The ER tether VAPA is required for proper cell motility and anchors ER-PM contact sites to focal adhesions
- Université Paris Cité, CNRS, Institut Jacques Monod, F-75013, France
Figures
Figure 1 with 1 supplement
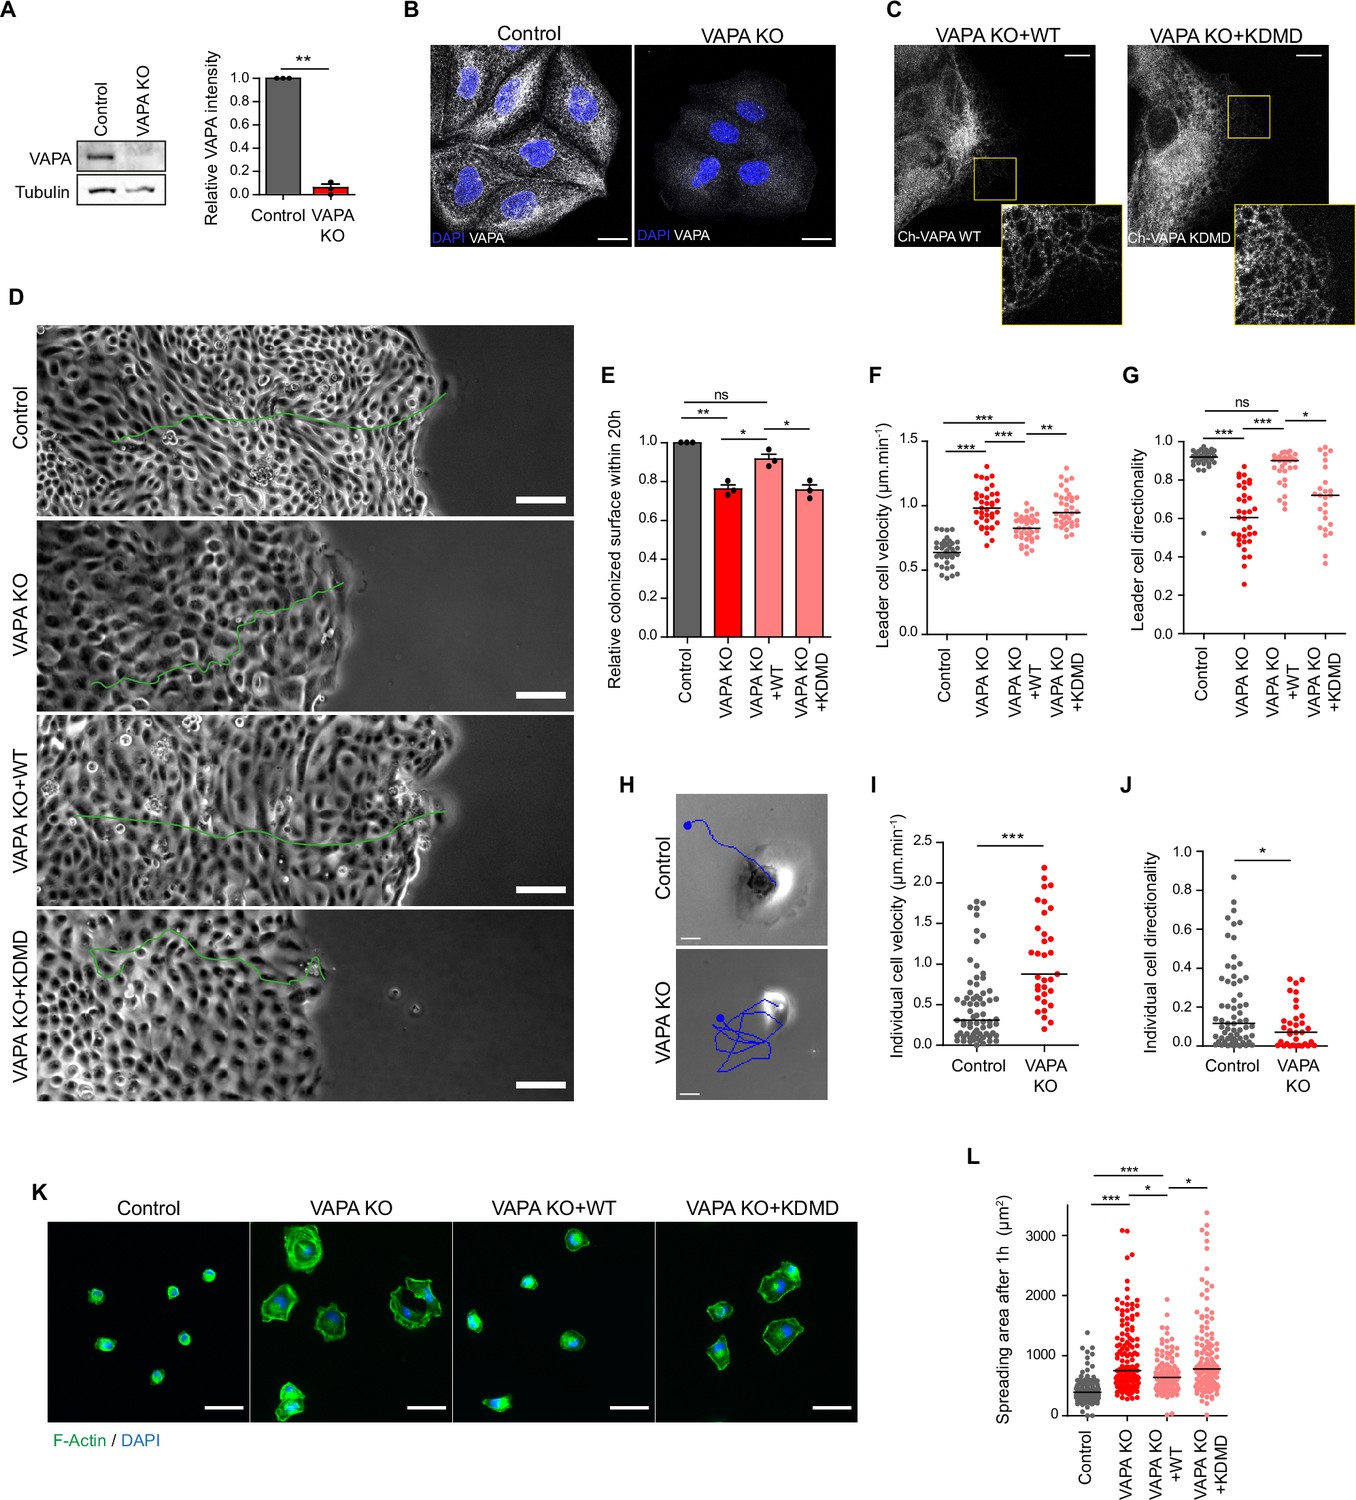
VAPA is required for proper cell migration and cell spreading.
(A) Left panel: Representative immunoblots showing the levels of VAPA and Tubulin in Control and VAPA KO cells. Tubulin expression level was used as loading control. Right panel: quantification of relative VAPA density in Control and VAPA KO cells normalized to Tubulin levels (mean ± SEM from three independent experiments). Data were analysed using a single-sample Student t-test. (B) Confocal images of Control and VAPA KO cells immunostained for VAPA. Scale bar 20 µm. (C) Confocal images of VAPA KO leader cells expressing wild-type mCherry-VAPA (VAPA KO +WT) or mCherry-VAPA KD/MD (VAPA KO +KDMD). Scale bar 10 µm. (D) Phase contrast images of Control, VAPA KO, VAPA KO +WT and VAPA KO +KDMD cells migrating collectively 48 hr after space release. For each condition, the trajectory of a leader cell over 20 hr is shown in green. Scale bar: 100 µm. (E) Analysis of relative colonized surface within the last 20 h by Control, VAPA KO, VAPA KO +WT and VAPA KO +KDMD cells (mean ± SEM from three independent experiments). Data were analysed using a One-way Anova paired test. (F, G) Analysis of Control, VAPA KO, VAPA KO +WT and VAPA KO +KDMD leader cell velocity (F) n=40, 40, 3,9 and 39 cells respectively from three independent experiments and directionality coefficient (G) n=34, 36, 32, and 26 cells respectively from three independent experiments. Data were analysed using a One-way Anova Kruskal-Wallis test. (H) Phase contrast images of a Control and VAPA KO individual cell displacing on fibronectin-coated glass during 5 minutes. The cell trajectory is shown in blue. Scale bar: 20 µm. (I, J) Analysis of cell velocity (I) and directionality coefficient (J) of Control and VAPA KO individual cells displacing on fibronectin-coated glass during at least 3 h (mean ± SEM; Control: n=64 cells; VAPA KO: n=33 cells from two independent experiments). data were analysed using non parametric Mann-Whitney t-test. (K) Epifluorescence images of Control, VAPA KO, VAPA KO +WT and VAPA KO +KDMD cells after 1 hour spreading on fibronectin-coated glass and stained as indicated. Scale bar: 50 µm. (L) Analysis of cells area after 1 hour spreading on fibronectin-coated glass (mean ± SEM; n=117, 134, 113, and 128 cells respectively from three independent experiments). Data were analysed using a One-way Anova Kruskal-Wallis test. (ns: non significant, ***p-values <0.001, **p-values <0.01, *p-values <0.05).
-
Figure 1—source data 1
Table containing the raw data used for the quantifications in Figure 1A, E, F, G, I, J and L.
- https://cdn.elifesciences.org/articles/85962/elife-85962-fig1-data1-v1.zip
-
Figure 1—source data 2
Folder containing the 2 original files of the full raw unedited blots for VAPA and Tubulin presented in Figure 1A and a figure with the uncropped annotated blots.
- https://cdn.elifesciences.org/articles/85962/elife-85962-fig1-data2-v1.zip
Figure 1—figure supplement 1
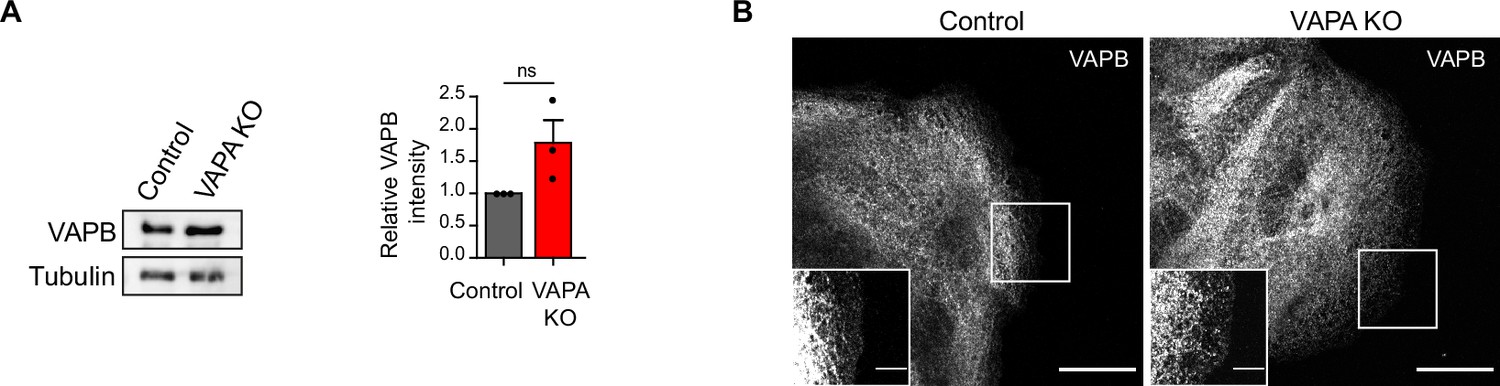
Analysis of VAPB expression in VAPA KO cells.
(A) Left panel: representative immunoblots showing the levels of VAPB and Tubulin in Control and VAPA KO cells. Tubulin level was used as loading control. Right panel: quantification of relative VAPB density in Control and VAPA KO cells normalized to Tubulin levels (mean ± SEM from three independent experiments). Data were analysed using a single-sample Student t-test (ns: non significant). (B) Confocal images of Control and VAPA KO leader cells immunostained for VAPB. Scale bar: 20 µm (5 µm in insets).
-
Figure 1—figure supplement 1—source data 1
Table containing the raw data used for the quantifications Figure 1—figure supplement 1A.
- https://cdn.elifesciences.org/articles/85962/elife-85962-fig1-figsupp1-data1-v1.zip
-
Figure 1—figure supplement 1—source data 2
Folder containing the 2 original files of the full raw unedited blots for VAPB and Tubulin presented in Figure 1—figure supplement 1A and a figure with the uncropped annotated blots.
- https://cdn.elifesciences.org/articles/85962/elife-85962-fig1-figsupp1-data2-v1.zip
Figure 2
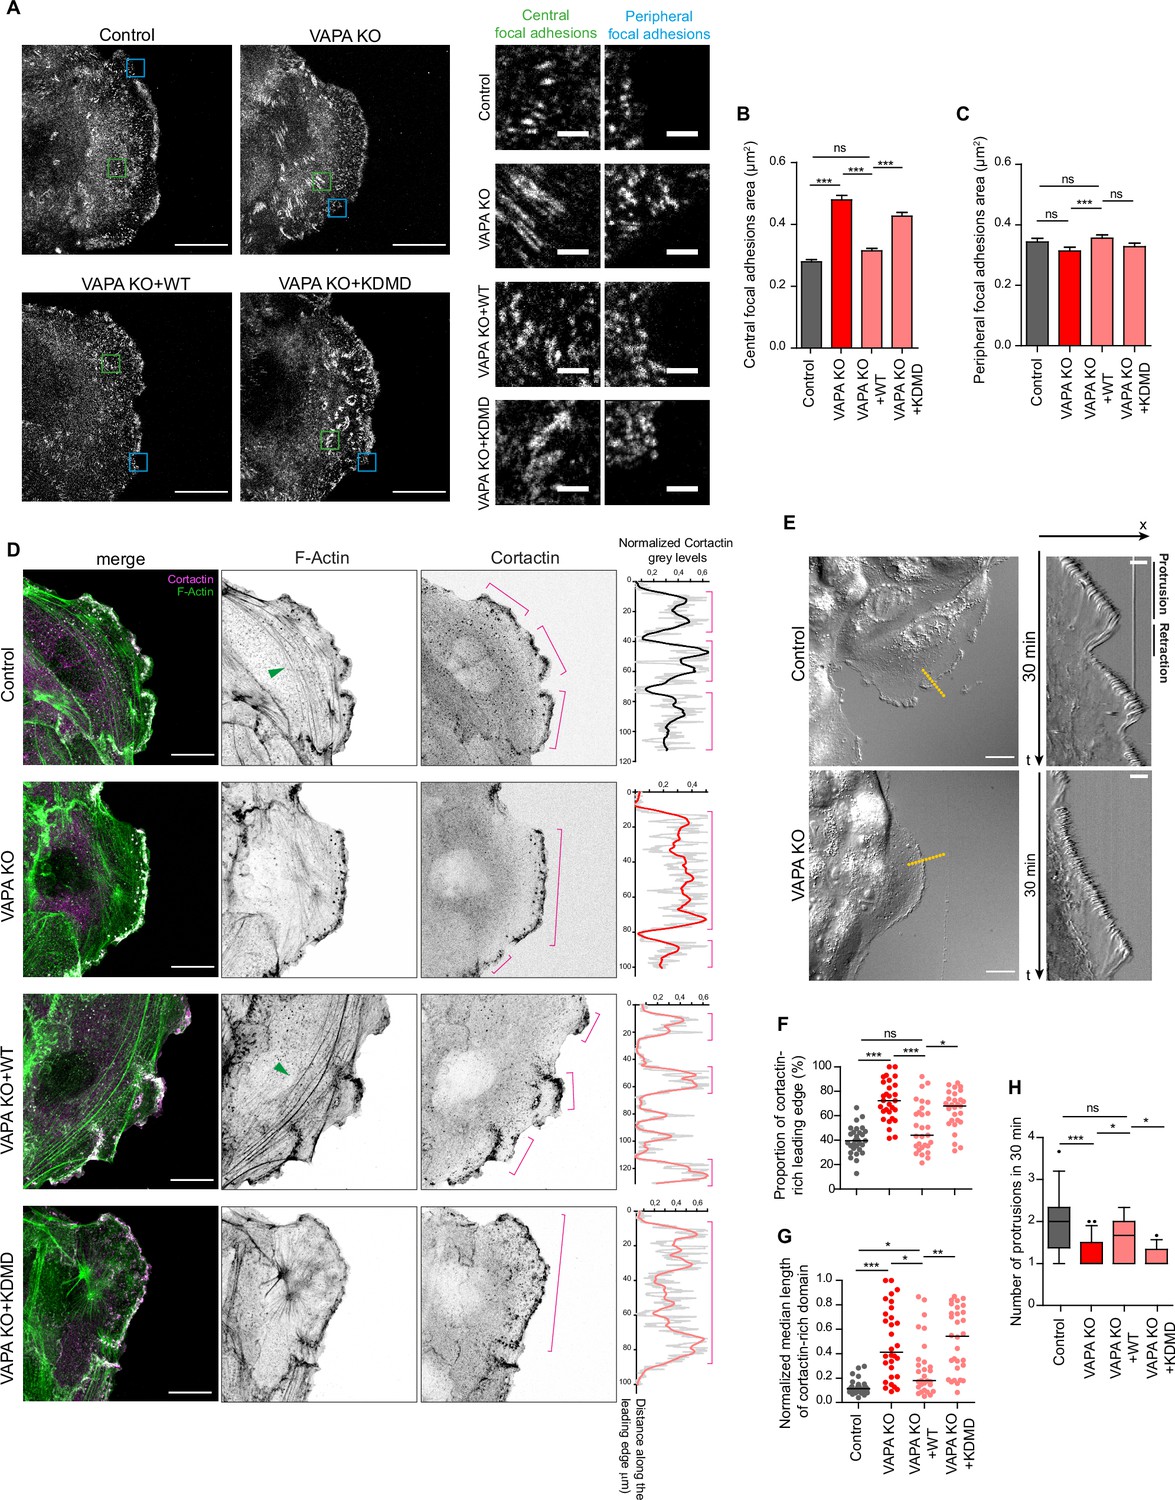
VAPA regulates focal adhesions and actin cytoskeleton through its MSP domain.
(A) Confocal images with zoom boxes of central (green squares) and peripheral (blue squares) paxillin-labeled focal adhesions from Control, VAPA KO, VAPA KO +WT and VAPA KO +KDMD leader cells in migrating monolayers 24 -48hr after insert removal. Scale bar: 20 µm (2 µm in insets). (B, C) Analysis of central (B) and peripheral (C) focal adhesion area quantified from images in A, in Control, VAPA KO, VAPA KO +WT and VAPA KO +KDMD leader cells (Control: n=2968 central and 353 peripheral focal adhesions from 20 cells, VAPA KO: n=4329 central and 293 peripheral focal adhesions from 22 cells, VAPA KO +WT: n=3818 central and 336 peripheral focal adhesions from 24 cells, VAPA KO +KDMD: n=2801 central and 297 peripheral focal adhesions from 19 cells, from three independent experiments). Data were analysed using a One-way Anova Kruskal-Wallis test.( D) Confocal images of actin cytoskeleton network in Control, VAPA KO, VAPA KO +WT and VAPA KO +KDMD leader cells stained for cortactin and F-actin. Green arrows point to F-Actin transversal arcs. Plot profiles of the cortactin signal along the leading edge are shown on the right. Pink lines highlight the cortactin-rich protrusive subdomains. Scale bar: 20 µm.( E) Differential Interference Contrast (DIC) images (left) and kymographs (right) along the yellow lines of Control and VAPA KO leader cells from a 30 min movie at 1 frame every 3 seconds, showing protrusion and retraction phases of the leading edge. Scale bar: 20 µm (left) and 5 µm (right). (F, G) Analysis of proportion of the leading edge enriched with cortactin (F) and mean size of cortactin-enriched domains at the leading edge normalized to the length of the leading edge (G) quantified from images in D (mean ± SEM; n=29 cells for each cell line, from three independent experiments). Data were analysed using a One-way Anova Kruskal-Wallis test. (H) Quantification of protrusion phases frequency per 30 min quantified from the kymographs in E, in Control, VAPA KO, VAPA KO +WT and VAPA KO +KDMD leader cells (mean ± SEM; n=16, 21, 17 and 12 cells respectively, from three independent experiments). Data were analysed using a non parametric Mann-Whitney t-test. (ns: non significant, ***p-values <0.001, **p-values <0.01, *p-values <0.05).
-
Figure 2—source data 1
Table containing the raw data used for the quantifications Figure 2B, C, D, F, G and H.
- https://cdn.elifesciences.org/articles/85962/elife-85962-fig2-data1-v1.zip
Figure 3
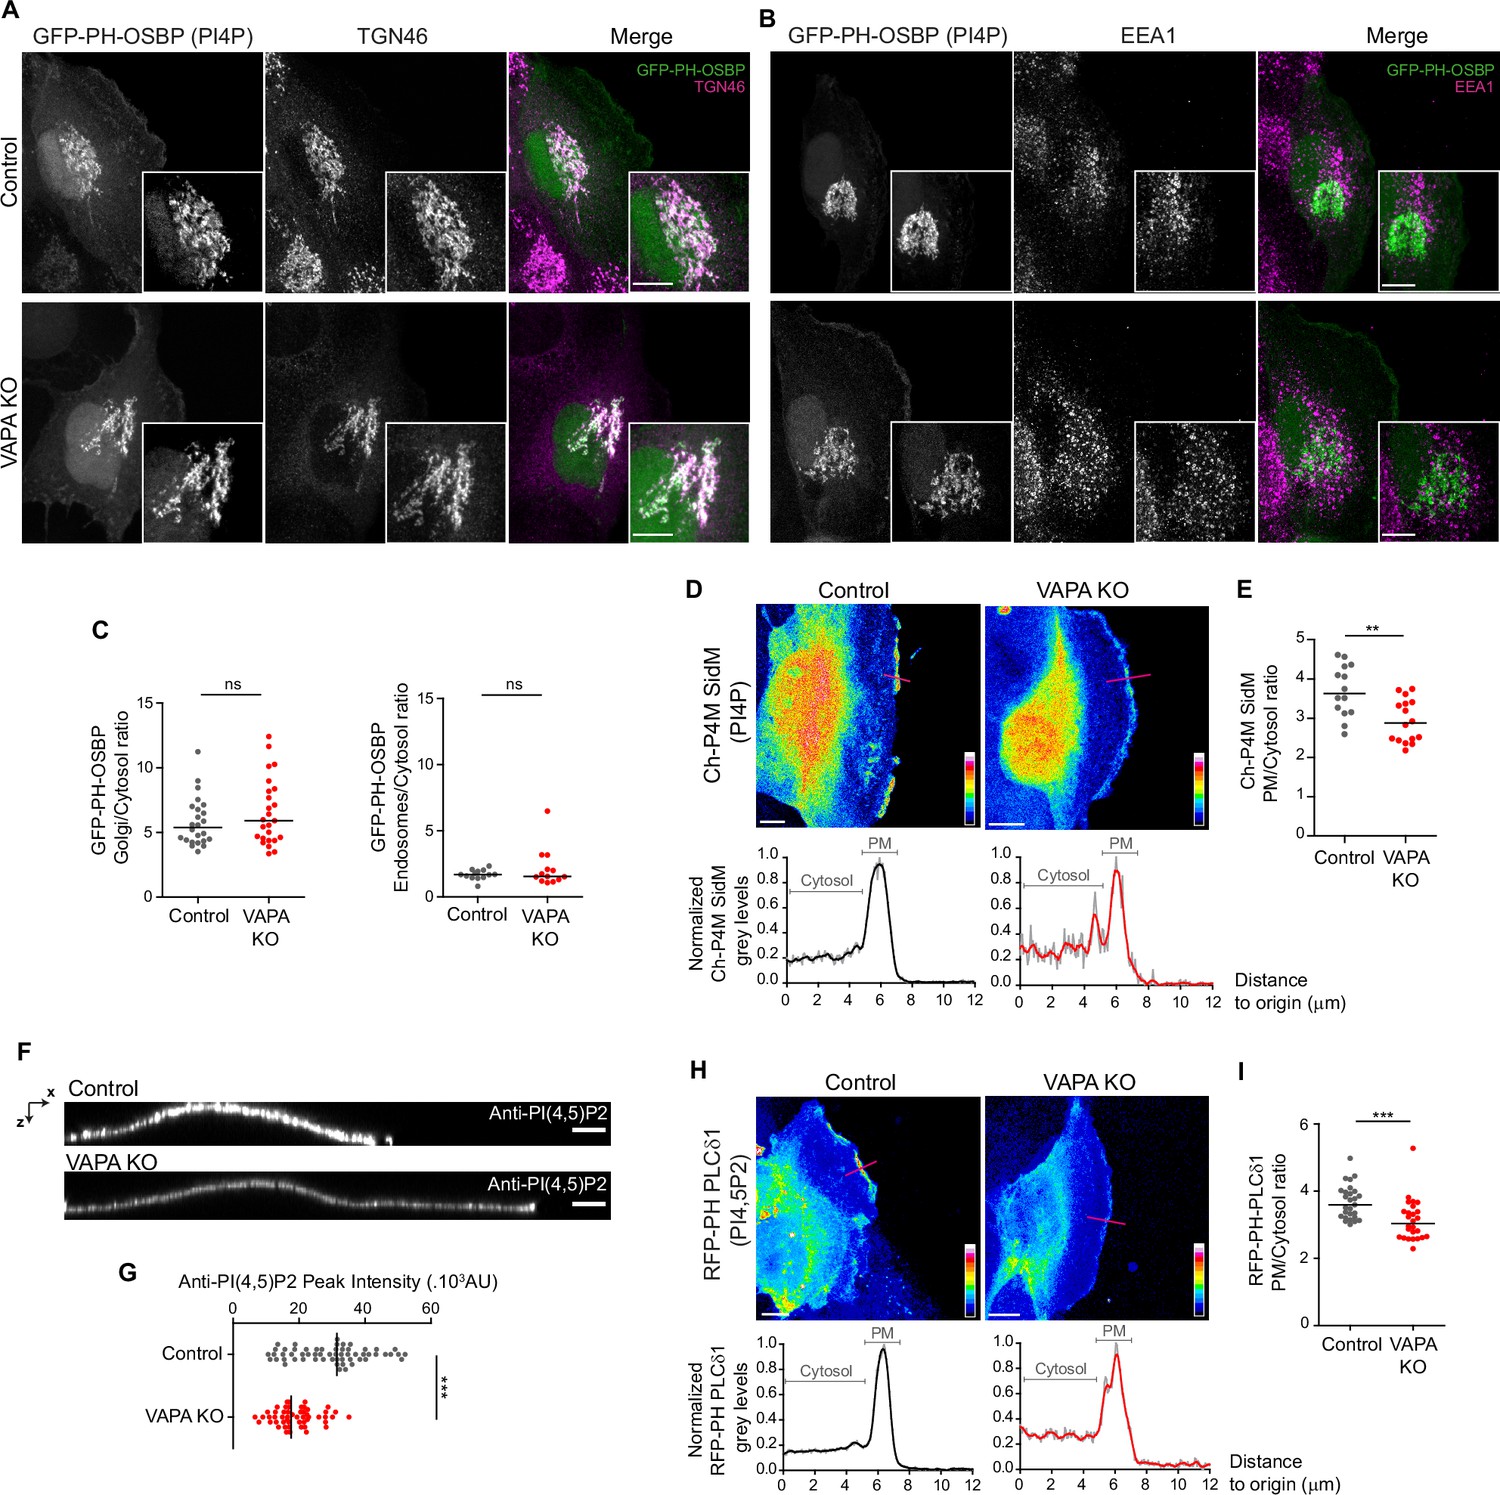
VAPA controls PInst homeostasis at the PM, but not in other compartments.
(A, B) Confocal images and zoom boxes of PI(4)P distribution in Control and VAPA KO leader cells expressing GFP-PH-OSBP and immunostained for TGN46 (A) or EEA1 (B). Scale Bar: 10 µm. (C) Analysis of Golgi(TGN46)/cytosol (left panel) and Early endosomes(EEA1)/Cytosol (right panel) ratio of GFP-PH-OSBP signal, quantified from images in A and B, in Control and VAPA KO leader cells (Left panel: n=24–25 cells, Right panel: n=13 cells; from three independent experiments). (D, H) Top: Sum projection of confocal images of PI(4)P (D) and PI(4,5)P2 (H) distribution in Control and VAPA KO leader cells expressing mCherry-P4M SidM or RFP-PH-PLCδ1 respectively, represented as a color-coded heat map. Scale bar: 10 µm. Bottom: Plot profiles of normalized grey levels along the pink lines. (E, I) Analysis of PM/Cytosol ratio of mCherry-P4M SidM (E) and RFP-PH-PLCδ1 (I), quantified from plot profiles represented in D and H respectively, in protrusive domains at the leading edge of Control and VAPA KO leader cells (E: n=14–16 cells, I: n=26–27 cells; from three independent experiments). (F) XZ view of confocal images of Control and VAPA KO cells immunostained for PI(4,5)P2. Scale Bar: 5 µm. (G) Analysis of PI(4,5)P2 peak intensity, quantified from images in F, in Control and VAPA KO leader cells (Control: n=58 cells; VAPA KO: n=53 cells, from three independent experiments). All data were analysed using non parametric Mann-Whitney t-test (ns: non significant, ***p-values <0.001, **p-values <0.01, *p-values <0.05).
-
Figure 3—source data 1
Table containing the raw data used for the quantifications Figure 3C, D, E, G, H and I.
- https://cdn.elifesciences.org/articles/85962/elife-85962-fig3-data1-v1.zip
Figure 4 with 1 supplement
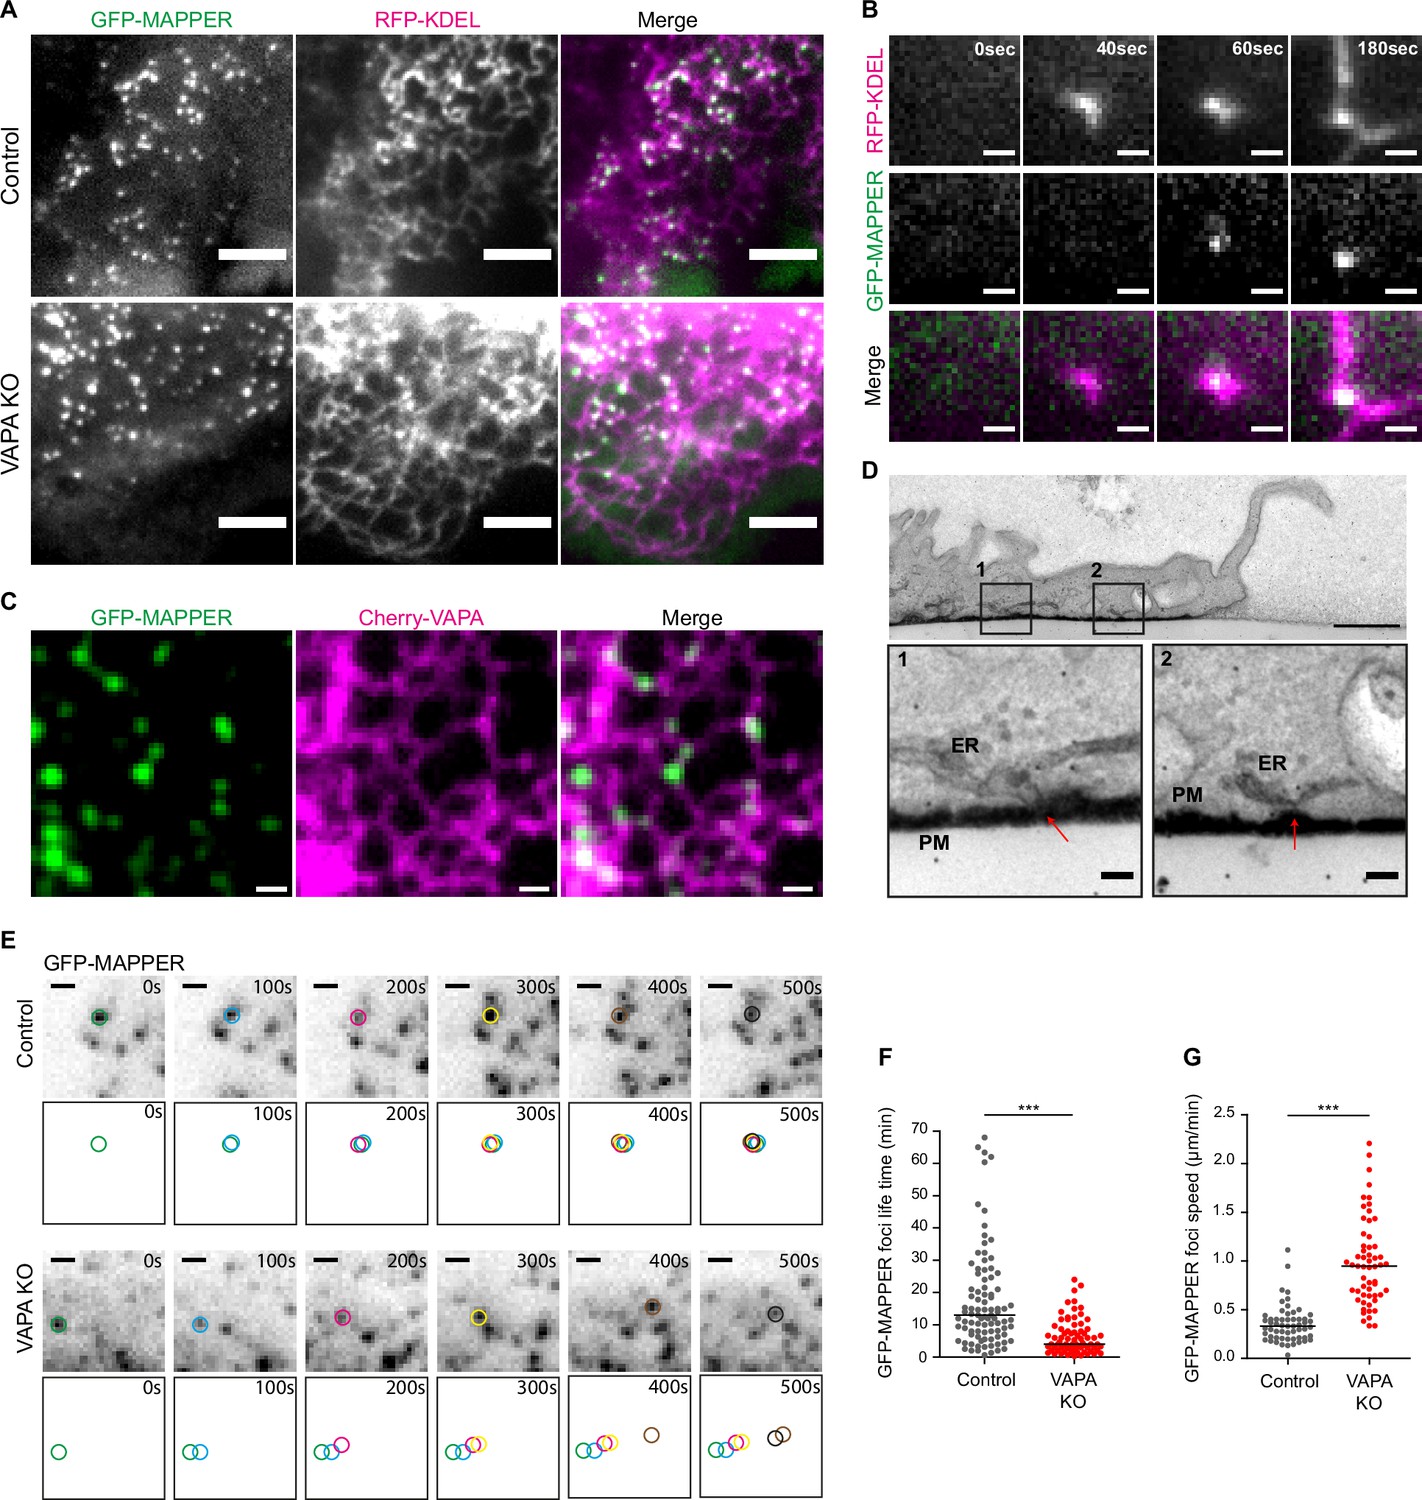
VAPA stabilizes ventral ER-PM contact sites at the front of migrating cells.
(A) TIRF microscopy images of GFP-MAPPER foci distribution along the ER in Control and VAPA KO leader cells expressing GFP-MAPPER and RFP-KDEL. Scale bar: 5 µm. (B) Sequential TIRF microscopy images of ER and GFP-MAPPER foci accumulation at the front of a Control leader cell expressing GFP-MAPPER and RFP-KDEL. Scale bar: 1 µm. (C) Confocal images of GFP-MAPPER foci distribution along Cherry-VAPA containing ER in Control cells transiently expressing Cherry-VAPA. Scale bar: 1 µm. (D) Transmission Electron Microscopy images of transversal cuts of a Control leader cell, showing the leading edge. Arrows point to ER-PM contact sites at the bottom of the cell. Scale bar: 1 µm (top) and 100 nm in insets 1 and 2. (E) Sequential TIRF microscopy images of GFP-MAPPER foci at the front of Control and VAPA KO leader cells expressing GFP-MAPPER. Individual GFP-MAPPER foci at each time point are pictured in the frames below images. Scale bar: 1 µm. (F, G). Analysis of the lifetime (F) and the speed (G) of ventral GFP-MAPPER foci, quantified from images in E, in Control and VAPA KO leader cells (Control: n=92 and 52 foci from 8 cells; VAPA KO: n=77 and 58 foci from 6 cells, from four independent experiments). All data were analysed using non parametric Mann-Whitney t-test (***p-values <0.001).
-
Figure 4—source data 1
Table containing the raw data used for the quantifications Figure 4F and G.
- https://cdn.elifesciences.org/articles/85962/elife-85962-fig4-data1-v1.zip
Figure 4—figure supplement 1
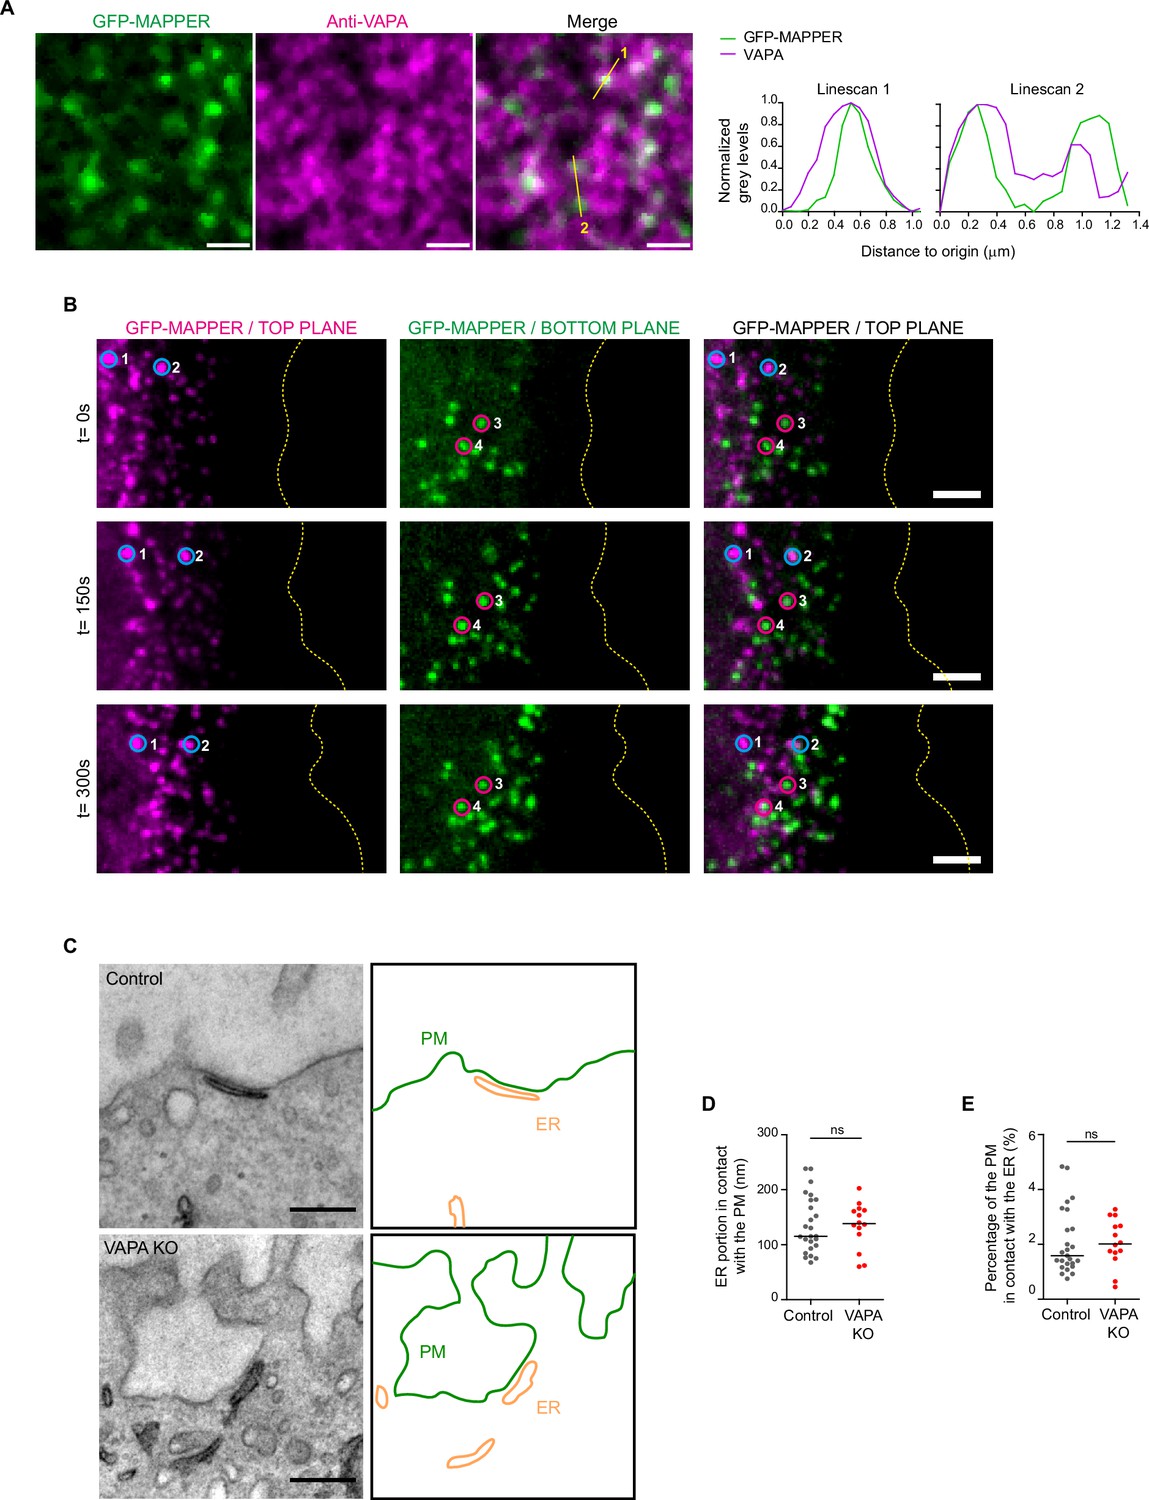
Dynamic and ultrastructural analysis of ER-PM contact sites.
(A) Confocal images of GFP-MAPPER foci distribution along anti-VAPA-stained ER in Control cells. On the right: plot profiles of normalized gray values along the two lines depicted in yellow. Scale bar: 1 µm. (B) Sequential spinning disk images of dorsal (magenta) and ventral (green) GFP-MAPPER foci at the front of a Control leader cell expressing GFP-MAPPER. Top and bottom plane images were color-coded in magenta and green respectively. Circles highlight single GFP-MAPPER foci at the dorsal (blue) and ventral (red) sides. Scale bar: 3 µm. (C) Representative Transmission Electron Microscopy images of a Control and a VAPA KO cell showing ER-PM contact sites. Scale bar: 0.3 µm. The ER compartment and the PM are pictured in the right framebox. (D, E). Analysis of the ER portion in contact with the PM (D) and the percentage of the PM in contact with the ER (E), quantified from images in A, in Control and VAPA KO leader cells (mean ± SEM; Control: n=25 cells: VAPA KO: n=14 cells, from three independent experiments). All data were analysed using non parametric Mann-Whitney t-test (ns: non significant).
-
Figure 4—figure supplement 1—source data 1
Table containing the raw data used for the quantifications Figure 4—figure supplement 1A and D and 1E.
- https://cdn.elifesciences.org/articles/85962/elife-85962-fig4-figsupp1-data1-v1.zip
Figure 5 with 1 supplement
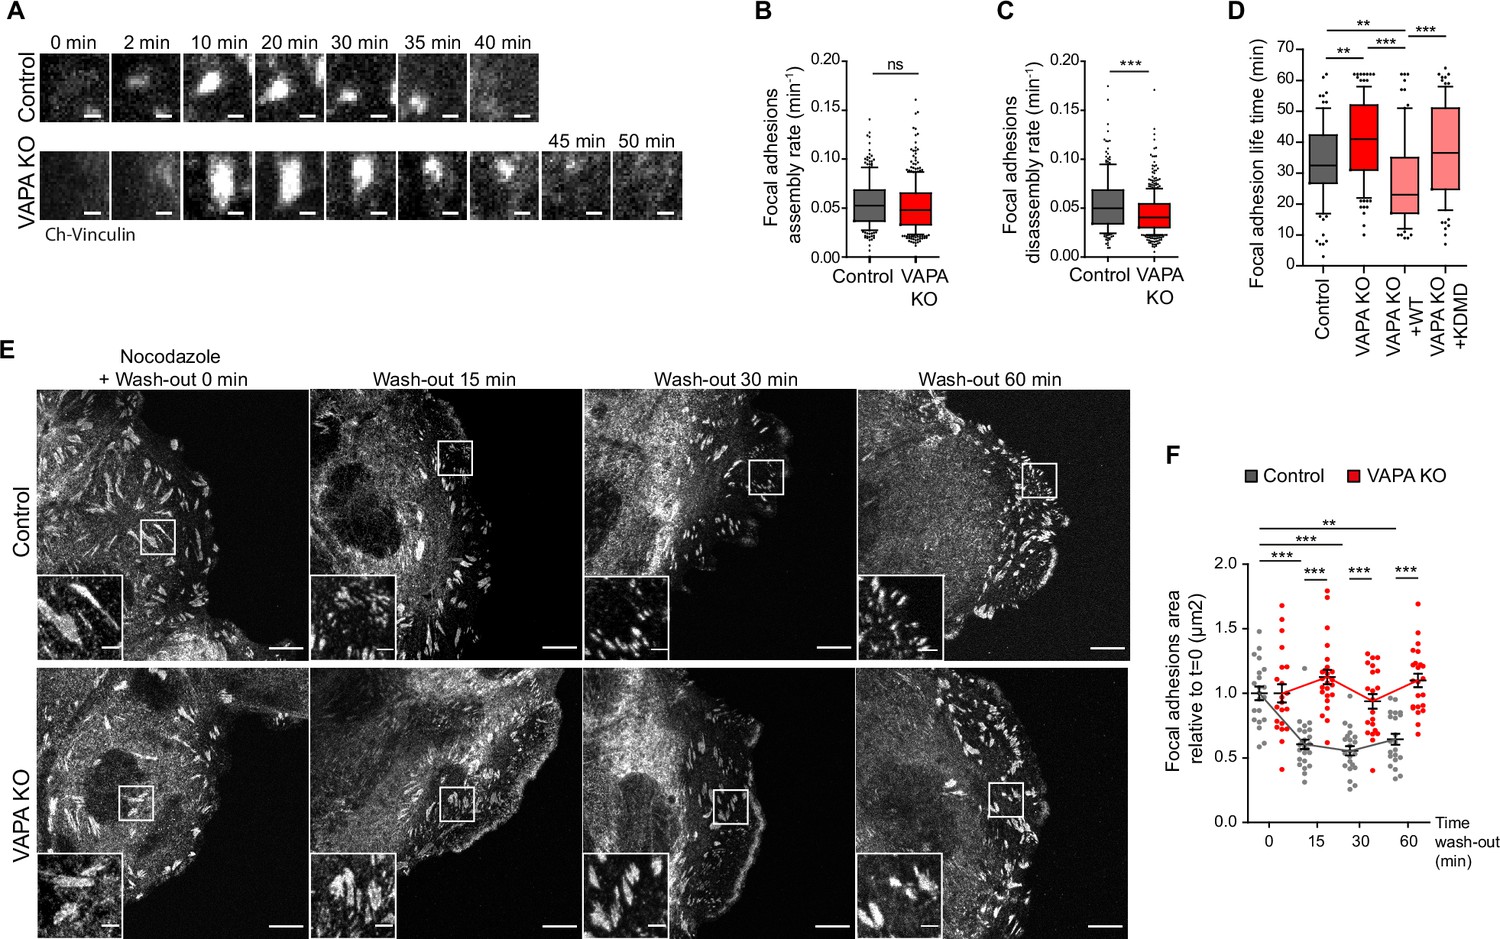
VAPA promotes microtubule-dependent FA disassembly.
(A) Sequential TIRF microscopy images of focal adhesions in Control and VAPA KO leader cells expressing mCherry-Vinculin. Scale Bar: 1 µm. (B, C) Analysis of assembly rate (B) and disassembly rate (C) of focal adhesions (FA), quantified from time-lapse images in A, in Control and VAPA KO leader cells (whisker plots with 10–90 percentile; Control: n=217 FA from 9 cells; VAPA KO: n=342 FA from 8 cells, from three independent experiments). Data were analysed using non parametric Mann-Whitney t-test. (D) Distribution of focal adhesion life times in Control, VAPA KO, VAPA KO +WT and VAPA KO +KDMD leader cells (Control: n=98 FA from 10 cells; VAPA KO: n=120 FA from 12 cells, VAPA KO +WT: n=79 FA from 8 cells, VAPA KO +KDMD: n=90 FA from 9 cells, from three independent experiments). Data were analysed using a One-way Anova Kruskal-Wallis test. (E) Confocal images of focal adhesions after nocodazole treatment and wash-out in migrating Control and VAPA KO leader cells immunostained for paxillin. Scale bar: 10 µm (2 µm in insets). (F) Analysis of relative focal adhesions (FA) size, quantified from images in E, in Control and VAPA KO leader cells after 0 min, 15 min, 30 min, and 60 min after nocodazole wash-out (FA from 22 to 25 cells were analysed, from 3 independent experiments. Control T0min: n=6053 FA; Control T15 min: n=5146 FA; Control T30 min: n=5543 FA; Control T60 min: n=3913 FA; VAPA KO T0 min: n=4481 FA, VAPA KO T15 min: n=3878 FA, VAPA KO T30 min: n=4165 FA; T60 min: n=4889 FA). Data were analysed using non parametric Mann-Whitney t-test. (ns: non significant, ***p-values <0.001, **p-values <0.01, *p-values <0.05).
-
Figure 5—source data 1
Table containing the raw data used for the quantifications Figure 5B, C, D and F.
- https://cdn.elifesciences.org/articles/85962/elife-85962-fig5-data1-v1.zip
Figure 5—figure supplement 1
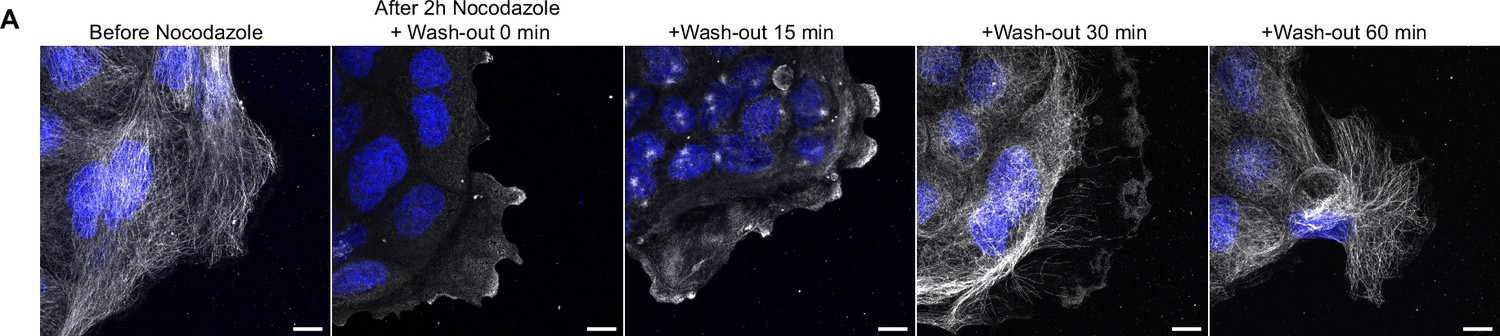
Organisation of microtubules after nocodazole treatment and wash-out.
(A) Sequential Confocal images of microtubules before and after 2 hr treatment with nocodazole, followed by wash-out during indicated time in Control leader cells immunostained for tubulin.
Scale bar: 10 µm.
Figure 6 with 1 supplement
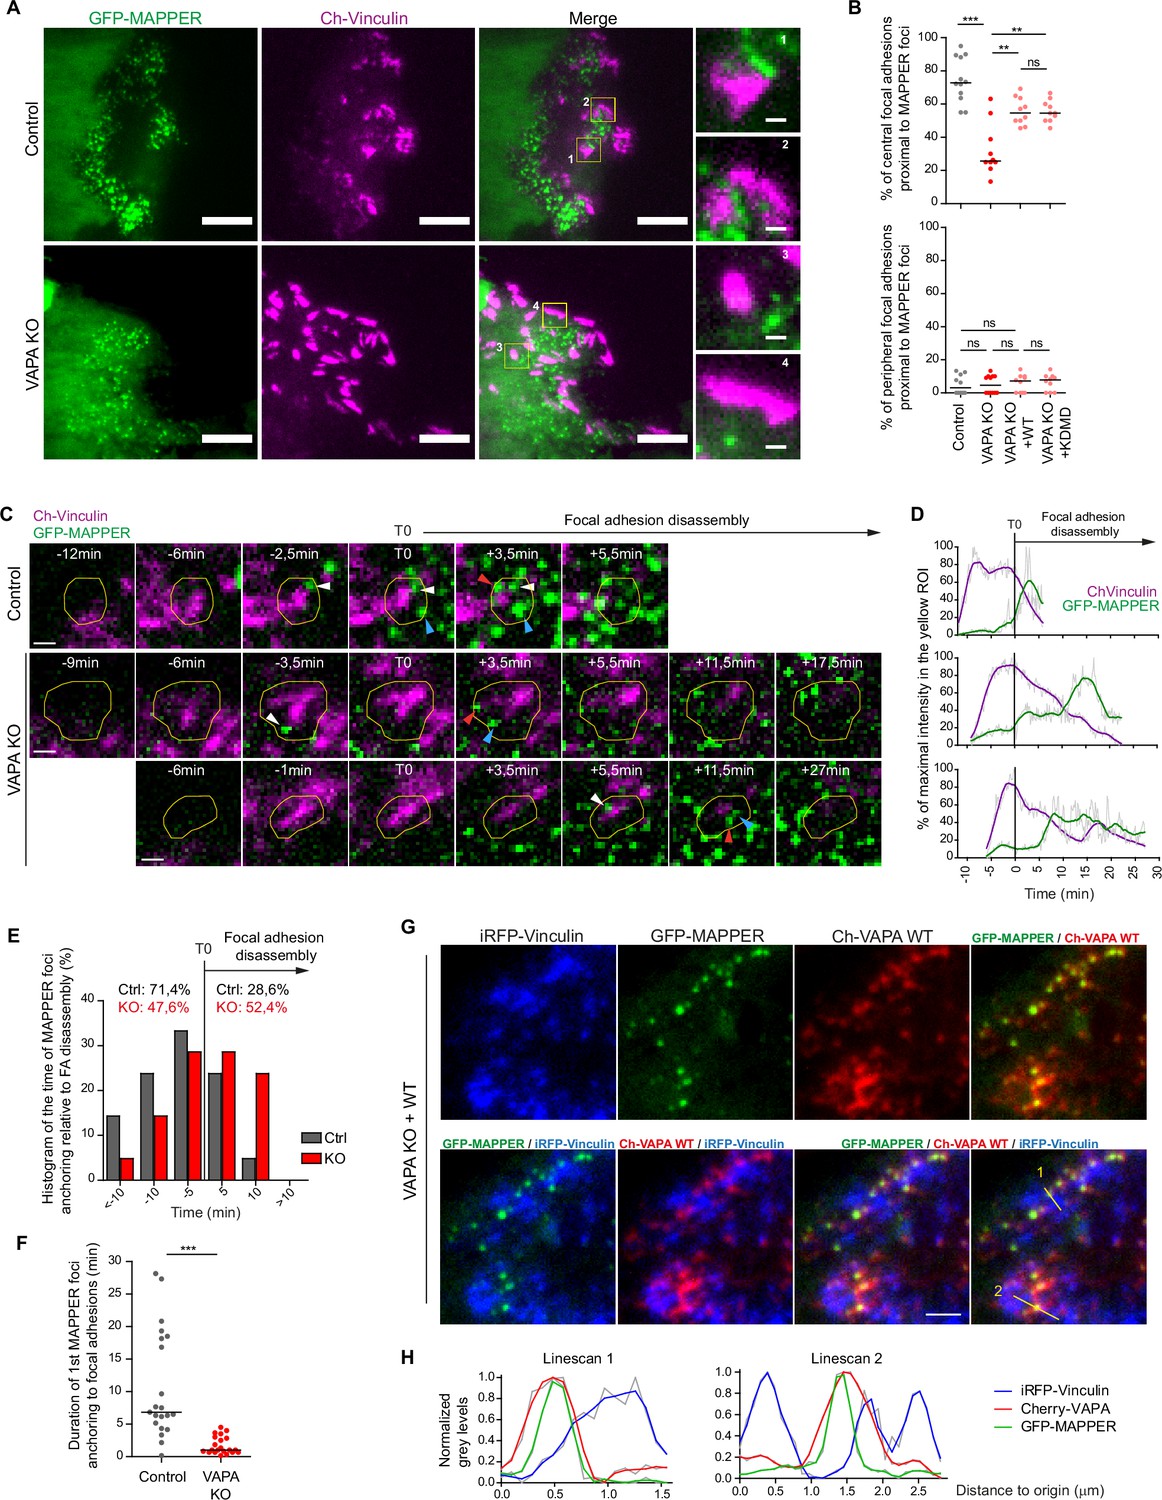
VAPA mediates the stable anchoring of ER-PM contact sites to FA before their disassembly.
(A) TIRF microscopy images of GFP-MAPPER and focal adhesions in Control and VAPA KO leader cells expressing GFP-MAPPER and mCherry-Vinculin. Scale bars: 10 µm (1 µm in insets). (B) Analysis of the percentage of central (top) or peripheral (bottom) focal adhesions in contact with GFP-MAPPER foci in Control, VAPA KO, VAPA KO +WT and VAPA KO +KDMD leader cells (n=10–12 cells, from three independent experiments). Data were analysed using a One-way Anova Kruskal-Wallis test. (C) Sequential TIRF microscopy images of GFP-MAPPER foci and focal adhesions before and after its disassembly in a Control and 2 representative VAPA KO leader cells expressing GFP-MAPPER and mCherry-Vinculin. Scale bar: 1 µm. (D) Time course of GFP-MAPPER (green) and mCherry-Vinculin (magenta) signals during the lifetime of focal adhesions in the yellow ROI depicted in C. The signals were smoothed, readjusted to the minimal value and expressed as % of the maximal value. (E) Histogram representing the repartition of first anchoring time of GFP-MAPPER foci relative to focal adhesion disassembly in Control and VAPA KO leader cells, quantified from images in D (n=21 focal adhesions from 7 cells from three independent experiments). (F) Analysis of duration of the first anchoring of GFP-MAPPER foci to focal adhesions in Control and VAPA KO leader cells, from images in D (n=21 focal adhesions from 7 cells from three independent experiments). Data were analysed using a non parametric Mann-Whitney t-test. (G) TIRF microscopy images of iRFP-Vinculin, GFP-MAPPER and Cherry-VAPA WT in a VAPA KO leader cell. Scale bar: 2 µm. (H) Plot profiles of normalized grey levels along the two lines depicted in G. (ns: non significant, ***p-values <0.001, **p-values <0.01, *p-values <0.05).
-
Figure 6—source data 1
Table containing the raw data used for the quantifications Figure 6B, D, E, F and H.
- https://cdn.elifesciences.org/articles/85962/elife-85962-fig6-data1-v1.zip
Figure 6—figure supplement 1
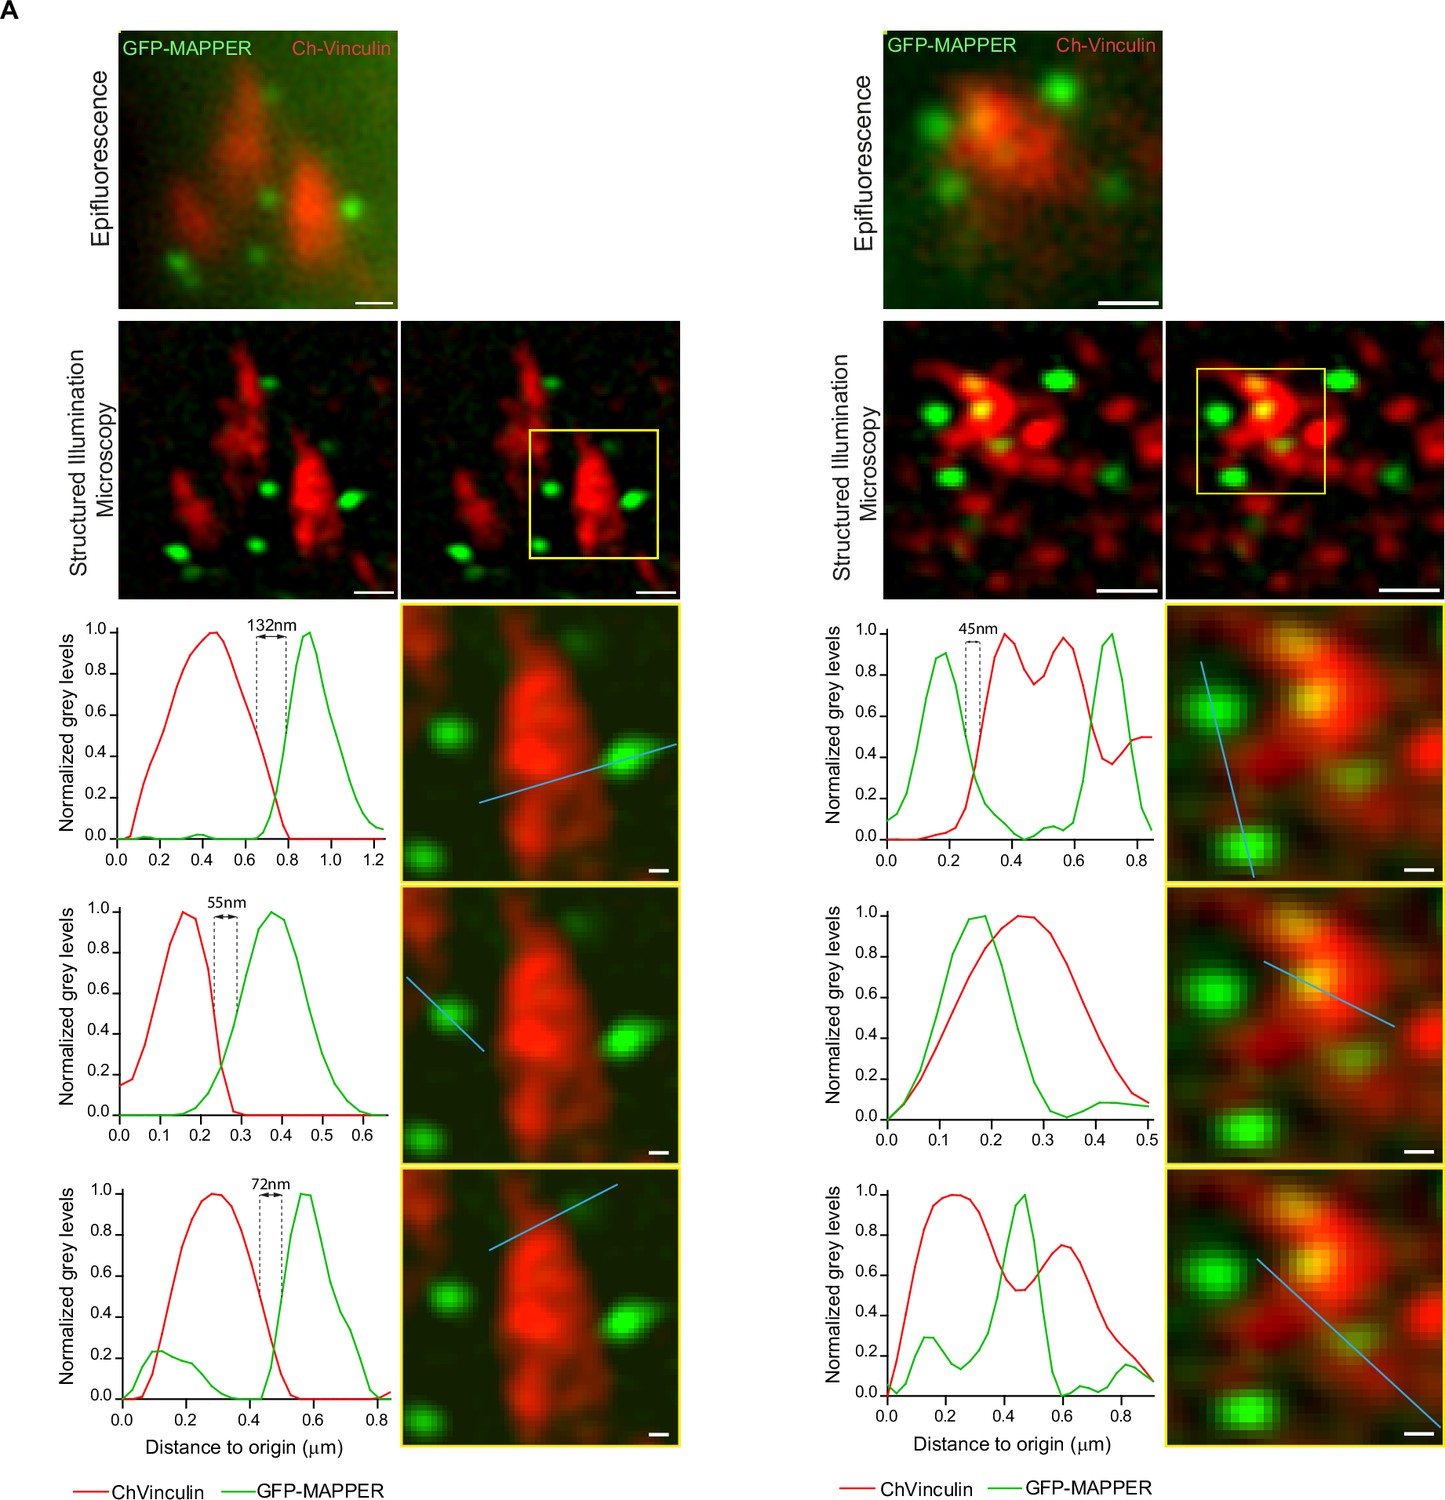
Analysis of proximity between FA and GFP-MAPPER foci by super-resolution microscopy.
(A) Two examples of images obtained by epifluorescence and structured illumination microscopy (SIM), in Control leader cells expressing GFP-MAPPER and mCherry-Vinculin. Scale bar: 0.5 μm (100 nm in insets). The proximity between focal adhesions and GFP-MAPPER foci obtained by SIM is illustrated in plot profiles of normalized gray values along the blue lines.
-
Figure 6—figure supplement 1—source data 1
Table containing the raw data used for the quantifications Figure 6—figure supplement 1A.
- https://cdn.elifesciences.org/articles/85962/elife-85962-fig6-figsupp1-data1-v1.zip
Author response image 1
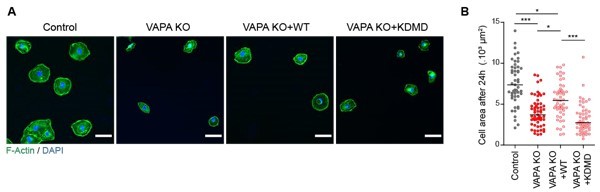
Analysis of cell area 24 hours after plating.
A. Epifluorescence images of Control, VAPA KO, VAPA KO+WT and VAPA KO+KDMD cells 24 hours after plating on fibronectin-coated glass and stained as indicated. Scale bar: 100 μm. B. Analysis of cell area 24 hours after plating on fibronectin-coated glass (n=49 to 57 cells from 3 independent experiments). Data were analysed using a One-way Anova Kruskal-Wallis test. (ns: non significant, ***P-values <0.001, **P-values <0.01, *P-values <0.05).
Videos
Video 1
Phase contrast movie showing collective migration behaviour of Control cells, VAPA KO cells, VAPA KO cells expresing Cherry-VAPA WT (VAPA KO +WT) or Cherry-VAPA KDMD (VAPA KO +KDMD) 48 hr after space release.
Scale bar: 100 µm. Time stamp is hour:min.
Video 2
TIRF microscopy movie showing the accumulation of a GFP-MAPPER foci (green) at a site of close apposition between the ER (RFP-KDEL, Magenta) and the PM, at the front of a Control leader cell.
Scale bar: 1 µm.
Time stamp is min:sec.
Video 3
Confocal microscopy movie showing dorsal (magenta) and ventral (green) GFP-MAPPER foci at the front of a Control leader cell expressing GFP-MAPPER.
Circles highlight single GFP-MAPPER foci at the dorsal (blue) and ventral (red) sides.
Scale bar: 2 µm. Time stamp is min:s.
Video 4
TIRF microscopy movie showing the dynamics and tracks of GFP-MAPPER foci at the front of Control and VAPA KO leader cells expressing GFP-MAPPER.
Scale bar: 1 µm. Time stamp is min:s.
Additional files
-
MDAR checklist
- https://cdn.elifesciences.org/articles/85962/elife-85962-mdarchecklist1-v1.docx
-
Supplementary file 1
Complete list of materials used in this study indicating the references and dilutions used for the antibodies.
- https://cdn.elifesciences.org/articles/85962/elife-85962-supp1-v1.xlsx
Download links
A two-part list of links to download the article, or parts of the article, in various formats.
Downloads (link to download the article as PDF)
Open citations (links to open the citations from this article in various online reference manager services)
Cite this article (links to download the citations from this article in formats compatible with various reference manager tools)
The ER tether VAPA is required for proper cell motility and anchors ER-PM contact sites to focal adhesions
eLife 13:e85962.
https://doi.org/10.7554/eLife.85962


