Myristoylated Neuronal Calcium Sensor-1 captures the preciliary vesicle at distal appendages
- Baxter Laboratory, Department of Microbiology & Immunology and Department of Pathology, Stanford University, United States
- Department of Cell Biology, University of Oklahoma Health Sciences Center, United States
- Department of Molecular Biology and Genetics, Aarhus University, Denmark
- Institute for Physiology, Center for Integrative Physiology and Molecular Medicine, Saarland University, Germany
Figures
Figure 1 with 2 supplements
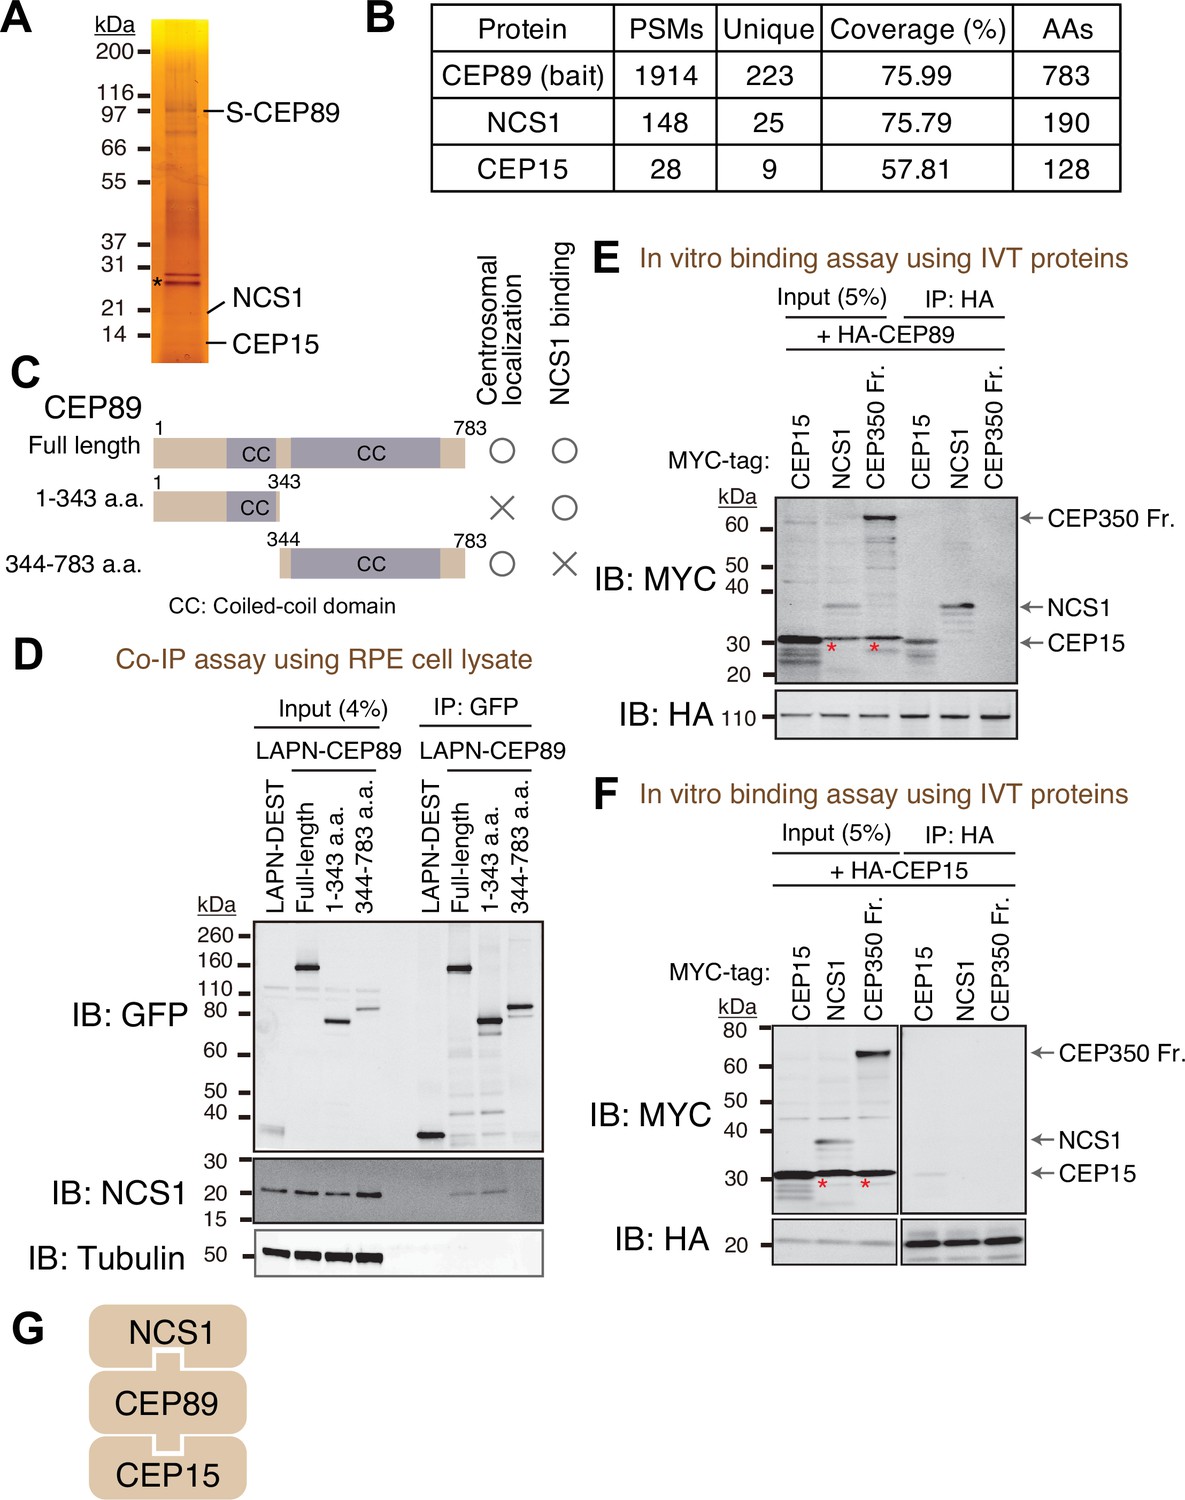
Identification of Neuronal Calcium Sensor-1 as a stoichiometric interactor of CEP89.
(A) Silver staining of the eluate following tandem affinity purification of N-terminally LAP (EGFP-TEV cleavage site-S tag-PreScission cleavage site)-tagged CEP89 expressed in confluent retinal pigment epithelia (RPE) cells. The cell lysates were purified with GFP antibodies and S-protein beads, resolved by sodium dodecyl sulfate–polyacrylamide gel electrophoresis (SDS–PAGE) and visualized by silver staining. The bands corresponding to S-tagged CEP89 (S-CEP89), NCS1, and CEP15 are indicated. Molecular weights (kDa) estimated from a protein marker are indicated. Asterisk denotes a band corresponding to TEV protease used for tandem affinity purification. Uncropped image of silver staining can be found in Figure 1—source data 1. (B) Tabulation of peptide-spectrum matches (PSMs), unique peptide counts, coverage, and the length of the amino acids from the mass spectrometry analysis of the eluate shown in (A). Raw mass spectrometry data can be found in Figure 1—source data 2. (C) A cartoon depicting the region of CEP89 important for centrosomal localization or binding to NCS1. Localization data can be found in Figure 1—figure supplement 1A. (D) Immunoblot (IB) analysis of the eluates from a co-immunoprecipitation assay of the full length or the indicated fragments of N-terminally LAP-tagged CEP89 expressed in confluent RPE cells. The cell lysates were purified with GFP antibodies, resolved by SDS–PAGE and immunoblotted with the indicated antibodies. Molecular weights (kDa) estimated from a protein marker are indicated. The raw unedited blots can be found in Figure 1—source data 3 and Figure 1—source data 4. Immunoblot (IB) analysis of the eluates from in vitro binding assay of the in vitro translated (IVT) N-terminally HA-tagged CEP89 (E) or CEP15 (F) and the indicated N-terminally MYC-tagged proteins. The in vitro translated proteins were mixed and captured by HA-agarose beads, resolved by SDS–PAGE and immunoblotted with the indicated antibodies. The CEP350 fragment (2470–2836 a.a.), which binds to FOP efficiently (Figure 1—figure supplement 2A; Kanie et al., 2017) serves as a negative control. Red asterisks indicate non-specific bands, which overlap with the MYC-tagged CEP15. Molecular weights (kDa) estimated from a protein marker are indicated. The raw unedited blots can be found in Figure 1—source data 5, Figure 1—source data 6, Figure 1—source data 7, and Figure 1—source data 8. (G) The order of binding for CEP89–NCS1–CEP15 interaction.
-
Figure 1—source data 1
Uncropped image of silver staining of the tandem affinity purification analysis of CEP89 shown in Figure 1A.
- https://cdn.elifesciences.org/articles/85998/elife-85998-fig1-data1-v2.pdf
-
Figure 1—source data 2
Mass spectrometry analysis of tandem affinity purification of CEP89 shown in Figure 1B.
- https://cdn.elifesciences.org/articles/85998/elife-85998-fig1-data2-v2.xlsx
-
Figure 1—source data 3
The original files of the full raw unedited blots shown in Figure 1D.
- https://cdn.elifesciences.org/articles/85998/elife-85998-fig1-data3-v2.zip
-
Figure 1—source data 4
The uncropped blots with boxes that indicate the regions displayed in Figure 1D.
- https://cdn.elifesciences.org/articles/85998/elife-85998-fig1-data4-v2.pdf
-
Figure 1—source data 5
The original files of the full raw unedited blots shown in Figure 1E.
- https://cdn.elifesciences.org/articles/85998/elife-85998-fig1-data5-v2.zip
-
Figure 1—source data 6
The uncropped blots with boxes that indicate the regions displayed in Figure 1E.
- https://cdn.elifesciences.org/articles/85998/elife-85998-fig1-data6-v2.pdf
-
Figure 1—source data 7
The original files of the full raw unedited blots shown in Figure 1F.
- https://cdn.elifesciences.org/articles/85998/elife-85998-fig1-data7-v2.zip
-
Figure 1—source data 8
The uncropped blots with boxes that indicate the regions displayed in Figure 1F.
- https://cdn.elifesciences.org/articles/85998/elife-85998-fig1-data8-v2.pdf
Figure 1—figure supplement 1
Individual channels of the images shown in Figure 1A.
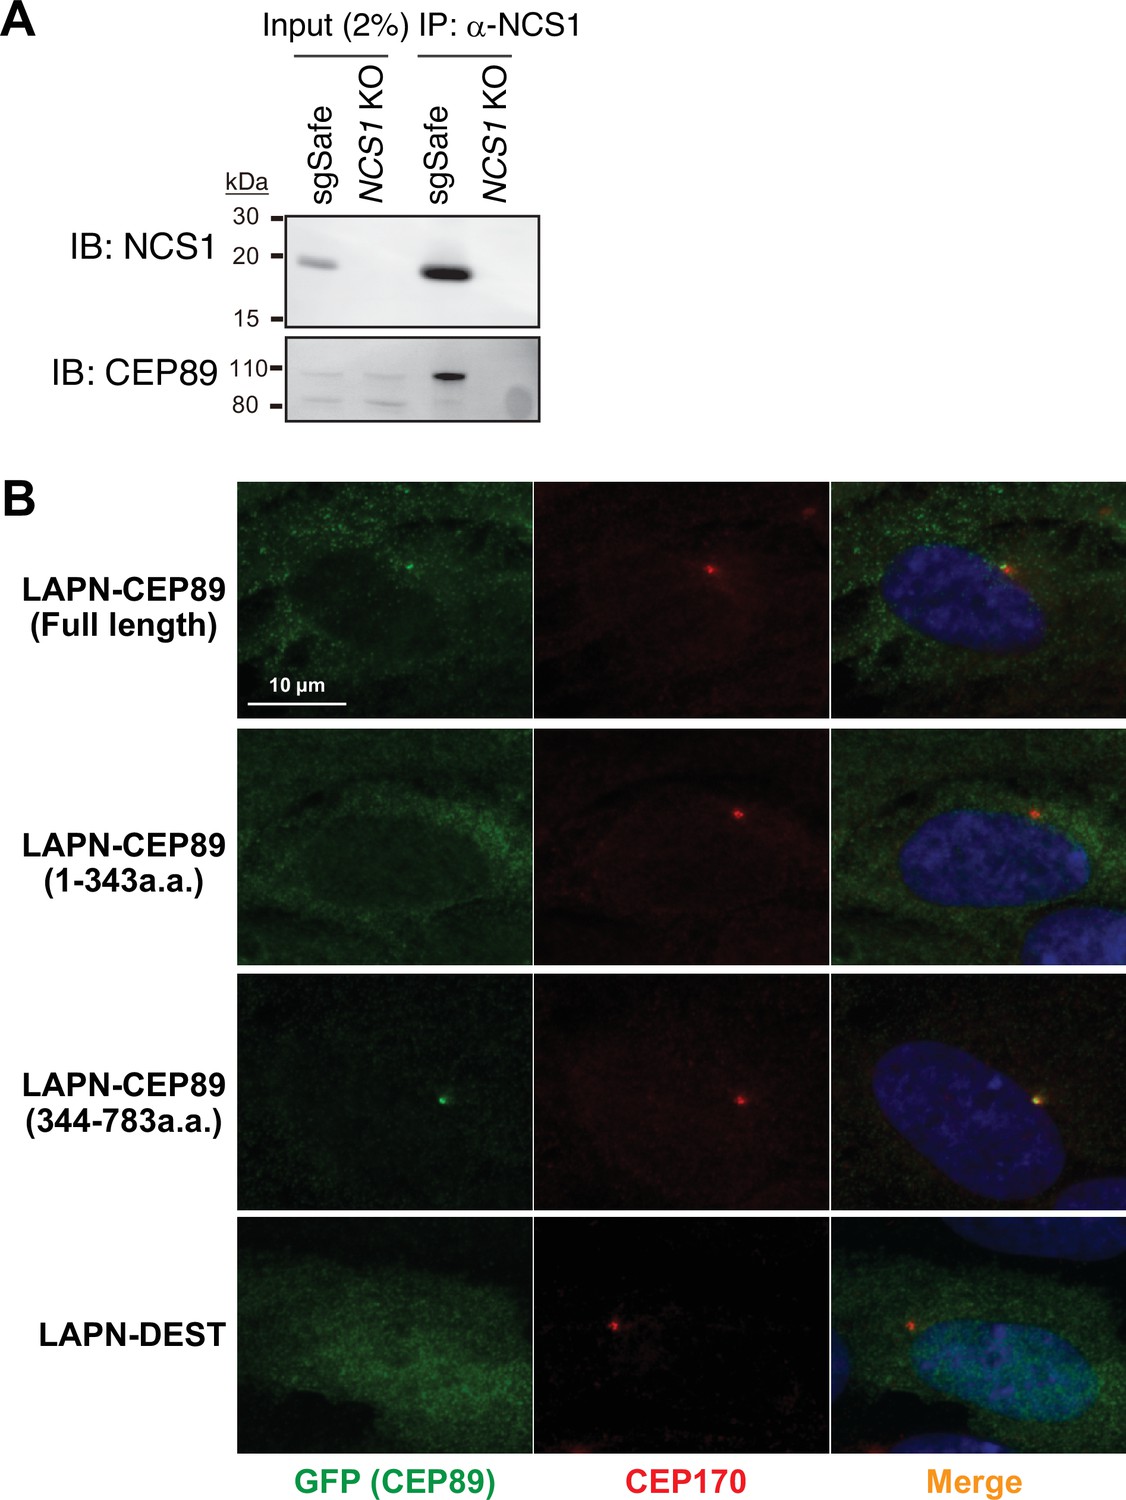
(A) Immunoblot (IB) analysis of the eluates from co-immunoprecipitation assay of endogenous NCS1 in the control (sgSafe) or NCS1 knockout retinal pigment epithelia (RPE) cells. The eluates were immunoblotted with antibodies against NCS1 or CEP89. Molecular weights (kDa) estimated from a protein marker are indicated. The raw unedited blots can be found in Figure 1—figure supplement 1—source data 1 and Figure 1—figure supplement 1—source data 2. (B) Immunofluorescence images taken via wide-field microscopy. RPE cells expressing the indicated N-terminally LAP (EGFP and S)-tagged fragments of CEP89 or LAPN (control) were serum starved for 24 hr, fixed, and stained with antibodies against GFP and CEP170. Scale bar: 10 µm. Co-immunoprecipitation of endogenous NCS1 and the localization of CEP89 mutants shown in (C).
-
Figure 1—figure supplement 1—source data 1
The original files of the full raw unedited blots shown in Figure 1—figure supplement 1A.
- https://cdn.elifesciences.org/articles/85998/elife-85998-fig1-figsupp1-data1-v2.zip
-
Figure 1—figure supplement 1—source data 2
The uncropped blots with boxes that indicate the regions displayed in Figure 1—figure supplement 1A.
- https://cdn.elifesciences.org/articles/85998/elife-85998-fig1-figsupp1-data2-v2.pdf
-
Figure 1—figure supplement 1—source data 3
Immunofluorescence conditions in the experiment shown in Figure 1—figure supplement 1B.
- https://cdn.elifesciences.org/articles/85998/elife-85998-fig1-figsupp1-data3-v2.xlsx
Figure 1—figure supplement 2
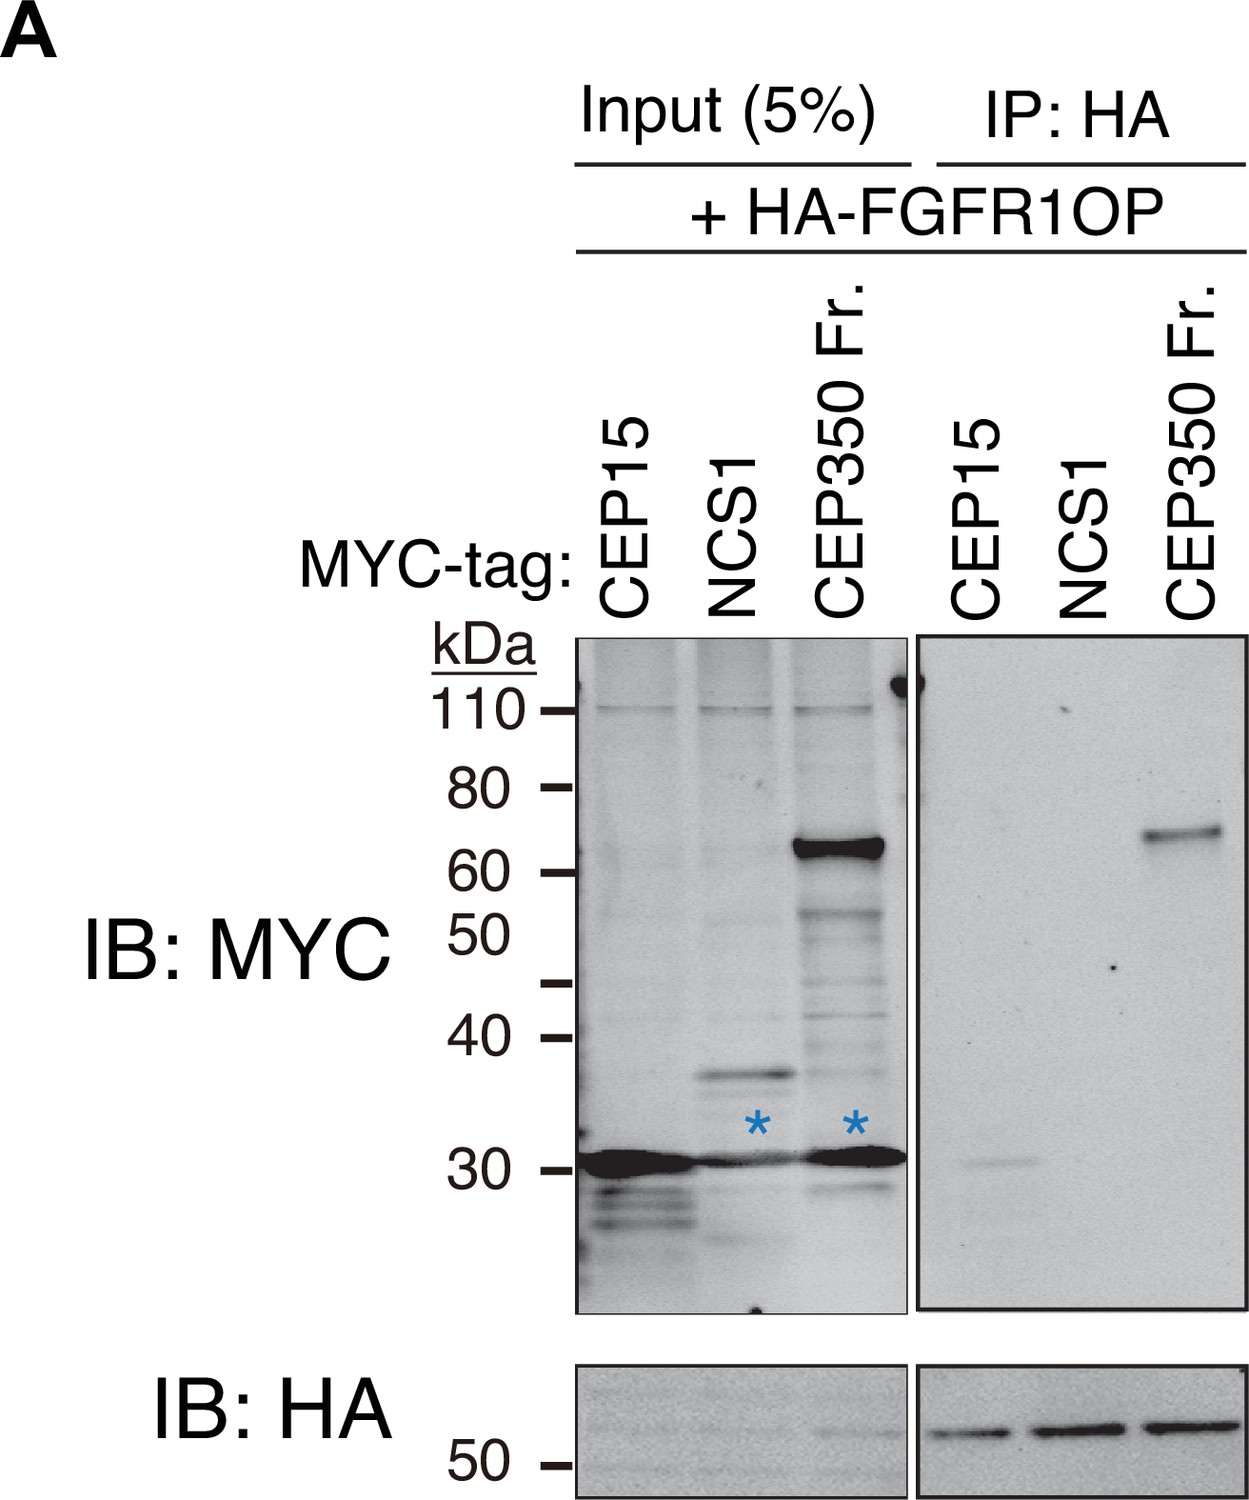
A negative control for the experiment shown in Figure 1E, F.
(A) Immunoblot (IB) analysis of the eluates from in vitro binding assay of the in vitro translated N-terminally HA-tagged FGFR1OP and the indicated N-terminally MYC-tagged proteins. The in vitro translated proteins were mixed and captured by HA-agarose beads, resolved by sodium dodecyl sulfate–polyacrylamide gel electrophoresis (SDS–PAGE) and immunoblotted with the indicated antibodies. The CEP350 fragment (2470–2836 a.a.), which binds to FGFR1OP efficiently (Kanie et al., 2017) serves as a positive control. Blue asterisks indicate non-specific bands, which overlap with the MYC-tagged CEP15. Molecular weights (kDa) estimated from a protein marker are indicated. The raw unedited blots can be found in Figure 1—figure supplement 2—source data 1 and Figure 1—figure supplement 2—source data 2.
-
Figure 1—figure supplement 2—source data 1
The original files of the full raw unedited blots shown in Figure 1—figure supplement 2A.
- https://cdn.elifesciences.org/articles/85998/elife-85998-fig1-figsupp2-data1-v2.zip
-
Figure 1—figure supplement 2—source data 2
The uncropped blots with boxes that indicate the regions displayed in Figure 1—figure supplement 2A.
- https://cdn.elifesciences.org/articles/85998/elife-85998-fig1-figsupp2-data2-v2.pdf
Figure 2 with 4 supplements
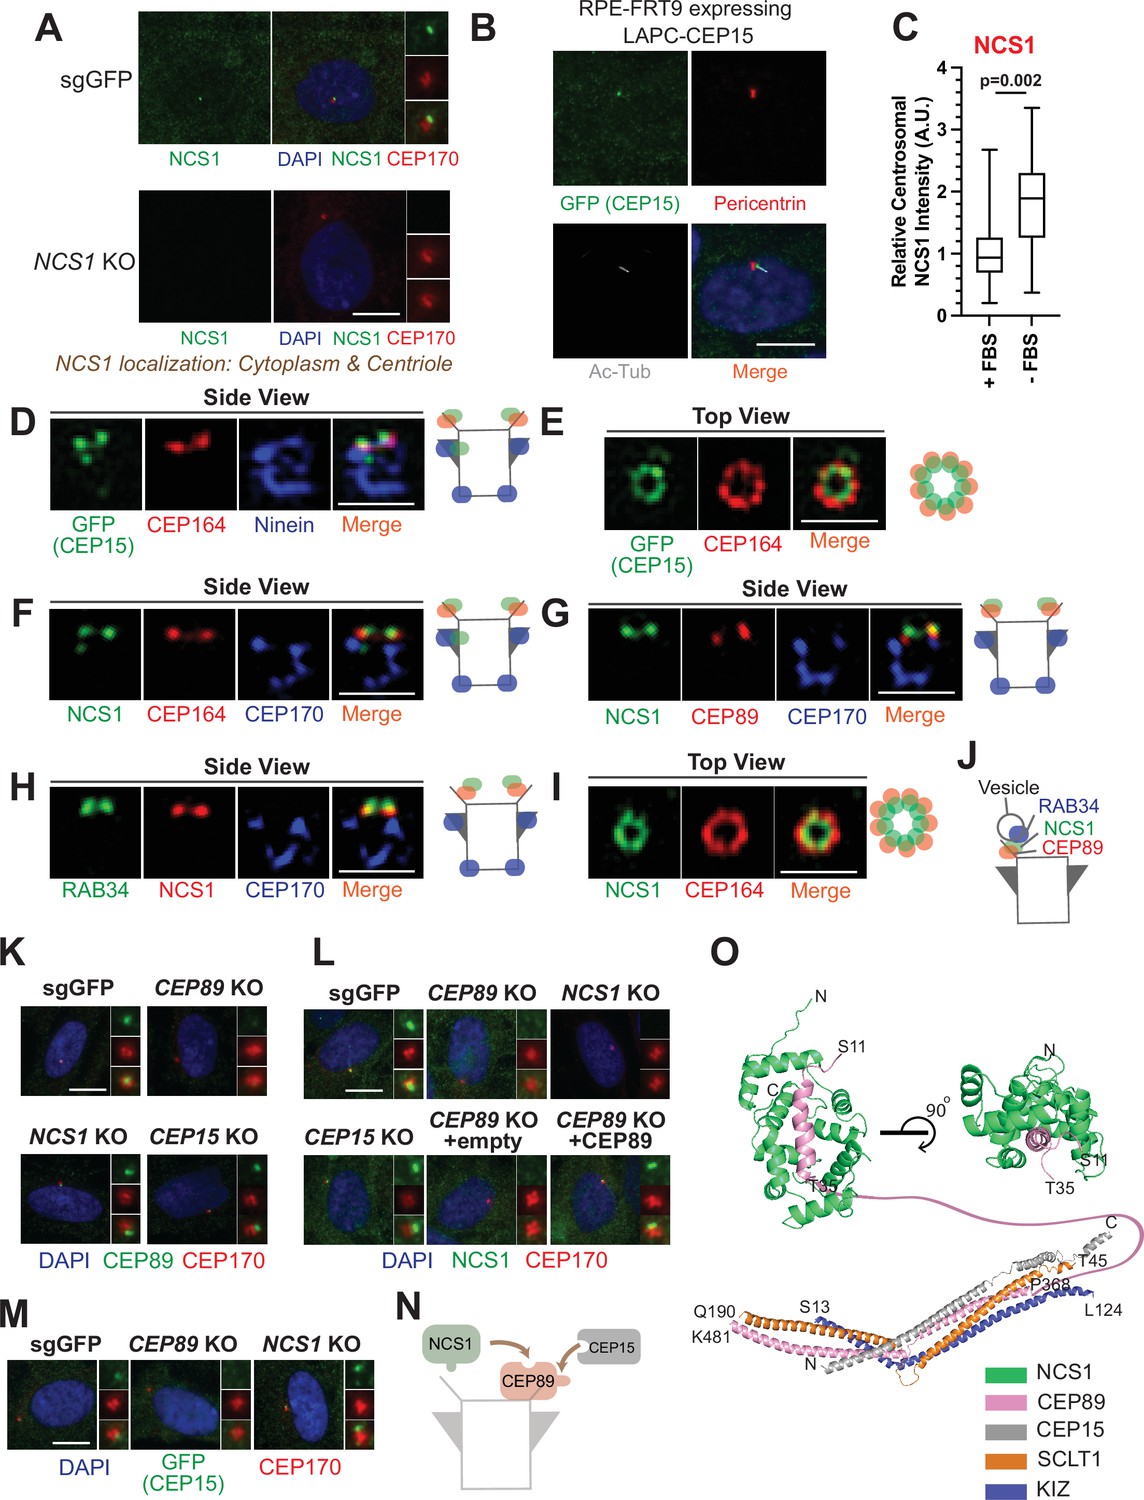
NCS1 is recruited to the distal appendage by CEP89.
(A) Immunofluorescence images taken via wide-field microscopy. Control (sgGFP) or NCS1 knockout retinal pigment epithelia (RPE) cells were serum starved for 24 hr, fixed, and stained with indicated antibodies. Insets at the right panels are the enlarged images of the mother centriole. Ac-Tub indicates acetylated α-tubulin. Scale bar: 10 µm. (B) Immunofluorescence images taken via wide-field microscopy. RPE cells expressing C-terminally LAP (LAPC)-tagged CEP15 were serum starved for 24 hr, fixed, and stained with indicated antibodies. Scale bar: 10 µm. (C) Box plots showing centrosomal signal intensity of NCS1. RPE cells were grown in fetal bovine serum (FBS)-containing media for 24 hr, and then grown in either FBS-containing media (+FBS) or serum-free media (−FBS) for an additional 24 hr. Cells were fixed and stained with NCS1 antibody. Centrosomal signal intensity of NCS1 was measured from fluorescence images using the method described in Materials and methods. A.U., arbitrary units. Data are combined from three replicates. Statistical significance was calculated from a nested t-test. The raw data, experimental conditions, and detailed statistics are available in Figure 2—source data 3. (D–I) Immunofluorescence images taken via 3D-structured illumination microscopy. Side view (D, F–H) or top view (E, I) is shown. RPE cells were either grown to confluent (H) or serum starved for 24 hr (D–G, I), fixed and stained with indicated antibodies. Each individual image is from a representative z-slice. Scale bar: 1 µm. CEP170: a marker of subdistal appendage and proximal end of the mother centriole. A cartoon at the right of each figure shows estimated positions of each protein at the mother centriole. (J) A cartoon depicting the localization of NCS1 relative to RAB34 and CEP89. NCS1 is sandwiched between RAB34 and CEP89. (K–M) Immunofluorescence images taken via wide-filed microscopy. Control (sgGFP) or indicated knockout RPE cells were serum starved for 24 hr, fixed, and stained with indicated antibodies. Scale bar: 10 µm. Insets at the right panels are the enlarged images of the mother centriole. Quantification data are available in Figure 2—figure supplement 2A–C. (N) A cartoon depicting the order of recruitment of the CEP89–NCS1–CEP15 complex. (O) Structural prediction of the NCS1/CEP89/CEP15/SCLT1/KIZ pentametric complex. (Bottom) AlphaFold2 prediction showing a tetrameric coiled-coil complex with each subunit displayed as cartoon representation and colored differently as indicated. (Top) Two perpendicular views of the structural prediction of the CEP89–NCS1 complex highlighting the N-terminal helix of CEP89 buried in a binding pocket of NCS1. Protein termini are labeled in the model and the residues between T35-P368 of CEP89 are indicated with a pink line.
-
Figure 2—source data 1
Immunofluorescence conditions in the experiment shown in Figure 2A.
- https://cdn.elifesciences.org/articles/85998/elife-85998-fig2-data1-v2.xlsx
-
Figure 2—source data 2
Immunofluorescence conditions in the experiment shown in Figure 2B.
- https://cdn.elifesciences.org/articles/85998/elife-85998-fig2-data2-v2.xlsx
-
Figure 2—source data 3
Immunofluorescence conditions, raw image quantification data, and detailed statistics of the experiment shown in Figure 2C.
- https://cdn.elifesciences.org/articles/85998/elife-85998-fig2-data3-v2.xlsx
-
Figure 2—source data 4
Immunofluorescence conditions in the experiment shown in Figure 2D–I.
- https://cdn.elifesciences.org/articles/85998/elife-85998-fig2-data4-v2.xlsx
-
Figure 2—source data 5
Immunofluorescence conditions in the experiment shown in Figure 2K.
- https://cdn.elifesciences.org/articles/85998/elife-85998-fig2-data5-v2.xlsx
-
Figure 2—source data 6
Immunofluorescence conditions in the experiment shown in Figure 2L.
- https://cdn.elifesciences.org/articles/85998/elife-85998-fig2-data6-v2.xlsx
-
Figure 2—source data 7
Immunofluorescence conditions in the experiment shown in Figure 2M.
- https://cdn.elifesciences.org/articles/85998/elife-85998-fig2-data7-v2.xlsx
Figure 2—figure supplement 1
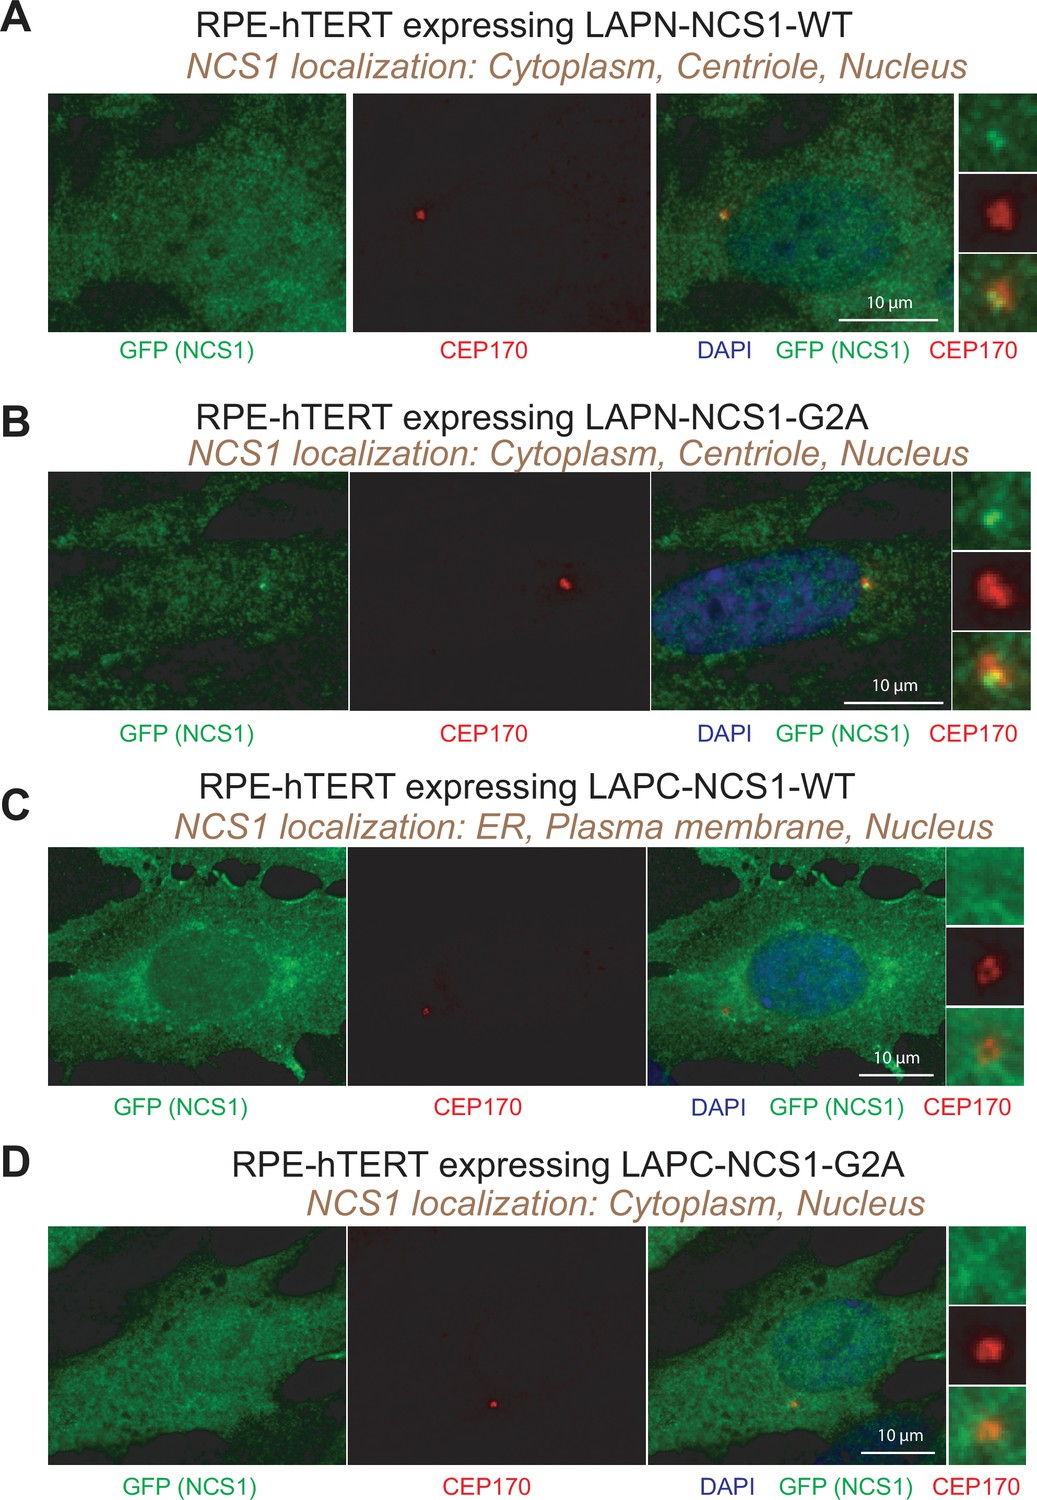
Localization of GFP-tagged NCS1.
(A–D) Immunofluorescence images taken via wide-field microscopy. Retinal pigment epithelia (RPE) cells expressing N-terminally LAP-tagged wild-type NCS1 (A), N-terminally LAP-tagged myristoylation defective mutant (G2A) of NCS1 (B), C-terminally LAP-tagged wild-type NCS1 (C), or C-terminally LAP-tagged myristoylation defective mutant (G2A) of NCS1 (D) were serum starved for 24 hr, fixed, and stained with indicated antibodies. Scale bar: 10 µm. Insets at the right panels are the enlarged images of the mother centriole. The experimental conditions are available in Figure 2—figure supplement 1—source data 1.
-
Figure 2—figure supplement 1—source data 1
Immunofluorescence conditions in the experiment shown in Figure 2—figure supplement 1.
- https://cdn.elifesciences.org/articles/85998/elife-85998-fig2-figsupp1-data1-v2.xlsx
Figure 2—figure supplement 2
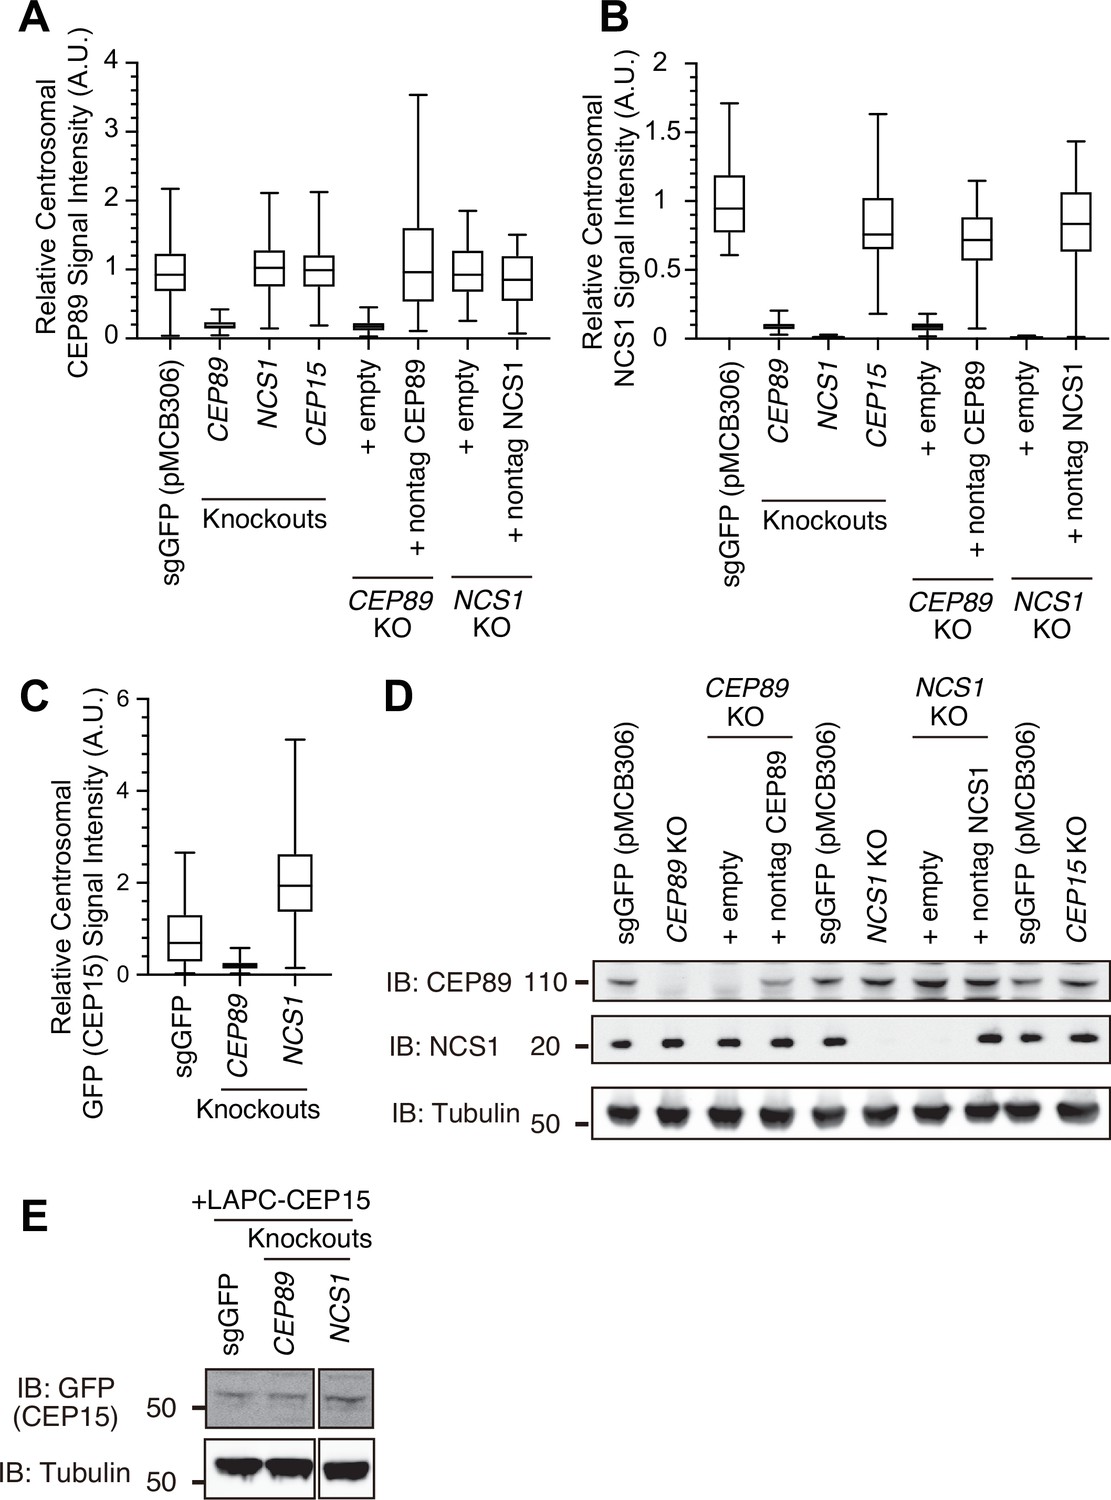
Quantification data and immunoblot related to Figure 2.
Box plots showing centrosomal signal intensity of CEP89 (A), NCS1 (B), or GFP-CEP15 (C) from the immunofluorescence experiments shown in Figure 2K–M. Data from a representative experiment are shown. A.U., arbitrary units. The raw data and experimental conditions are available in Figure 2—figure supplement 2—source data 1, Figure 2—figure supplement 2—source data 2, and Figure 2—figure supplement 2—source data 3. (D, E) Immunoblot (IB) analysis of expression of CEP89, NCS1, and LAPC-CEP15 in indicated retinal pigment epithelia (RPE) cells. The cells were serum starved for 24 hr, lysed and analyzed by immunoblot. Molecular weights (kDa) estimated from a protein marker are indicated. The raw unedited blots can be found in Figure 2—figure supplement 2—source data 4, Figure 2—figure supplement 2—source data 5, Figure 2—figure supplement 2—source data 6, and Figure 2—figure supplement 2—source data 7. A.U., arbitrary units; n.s., not significant.
-
Figure 2—figure supplement 2—source data 1
Immunofluorescence conditions and raw quantification data of the experiment shown in Figure 2—figure supplement 2A.
- https://cdn.elifesciences.org/articles/85998/elife-85998-fig2-figsupp2-data1-v2.xlsx
-
Figure 2—figure supplement 2—source data 2
Immunofluorescence conditions and raw quantification data of the experiment shown in Figure 2—figure supplement 2B.
- https://cdn.elifesciences.org/articles/85998/elife-85998-fig2-figsupp2-data2-v2.xlsx
-
Figure 2—figure supplement 2—source data 3
Immunofluorescence conditions and raw quantification data of the experiment shown in Figure 2—figure supplement 2C.
- https://cdn.elifesciences.org/articles/85998/elife-85998-fig2-figsupp2-data3-v2.xlsx
-
Figure 2—figure supplement 2—source data 4
The original files of the full raw unedited blots shown in Figure 2—figure supplement 2D.
- https://cdn.elifesciences.org/articles/85998/elife-85998-fig2-figsupp2-data4-v2.zip
-
Figure 2—figure supplement 2—source data 5
The uncropped blots with boxes that indicate the regions displayed in Figure 2—figure supplement 2D.
- https://cdn.elifesciences.org/articles/85998/elife-85998-fig2-figsupp2-data5-v2.pdf
-
Figure 2—figure supplement 2—source data 6
The original files of the full raw unedited blots shown in Figure 2—figure supplement 2E.
- https://cdn.elifesciences.org/articles/85998/elife-85998-fig2-figsupp2-data6-v2.zip
-
Figure 2—figure supplement 2—source data 7
The uncropped blots with boxes that indicate the regions displayed in Figure 2—figure supplement 2E.
- https://cdn.elifesciences.org/articles/85998/elife-85998-fig2-figsupp2-data7-v2.pdf
Figure 2—figure supplement 3
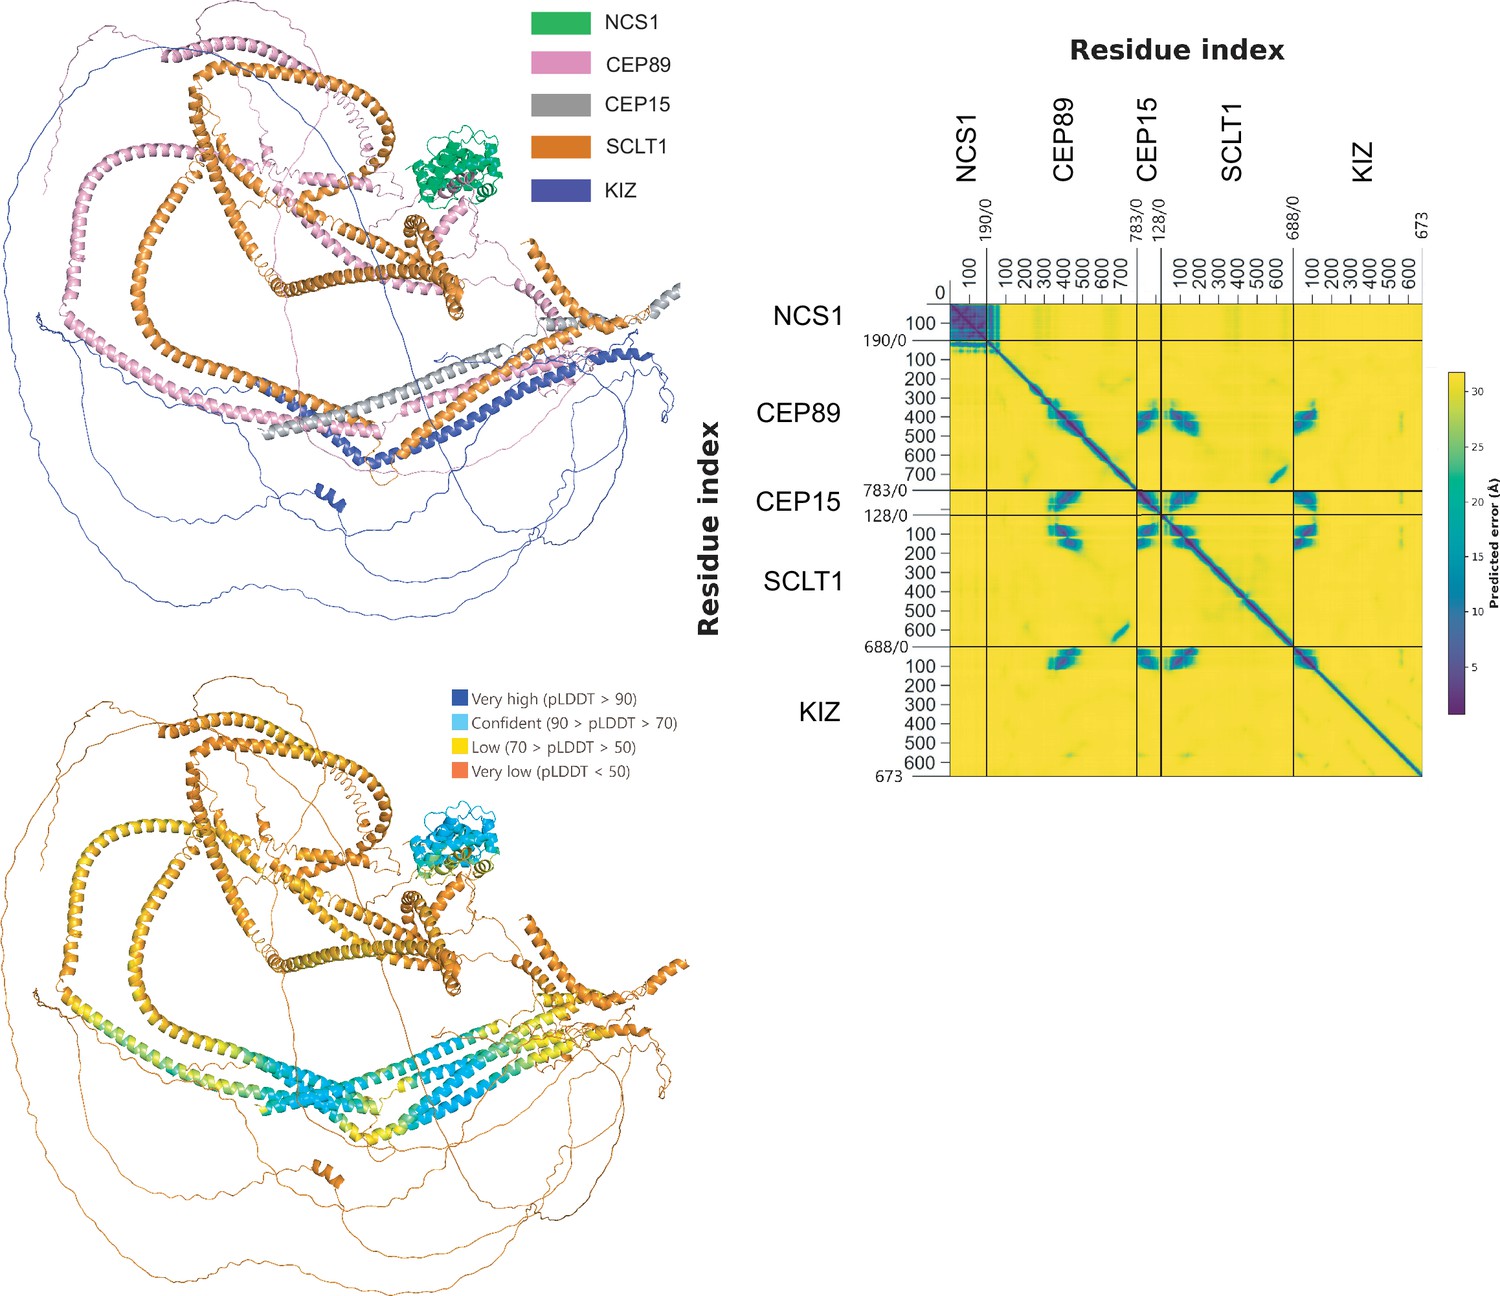
The predicted structure of the NCS1/CEP89/CEP15/SCLT1/KIZ pentameric complex.
The top-left panel shows a cartoon representation of the predicted structure of the NCS1/CEP89/CEP15/SCLT1/KIZ pentametric complex. The bottom-left figure is the color-coded predicted local distance difference test (pLDDT) score as indicated. The figure on the right shows the predicted aligned error (PAE) plot of the predicted structure. PAE plot assesses the confidence in the relative position of residues within the predicted structure. The aligned error in angstroms (Å) is color-coded according to the bar to the right of the plot with dark blue indicating a low error and thus high confidence in relative position.
Figure 2—figure supplement 4
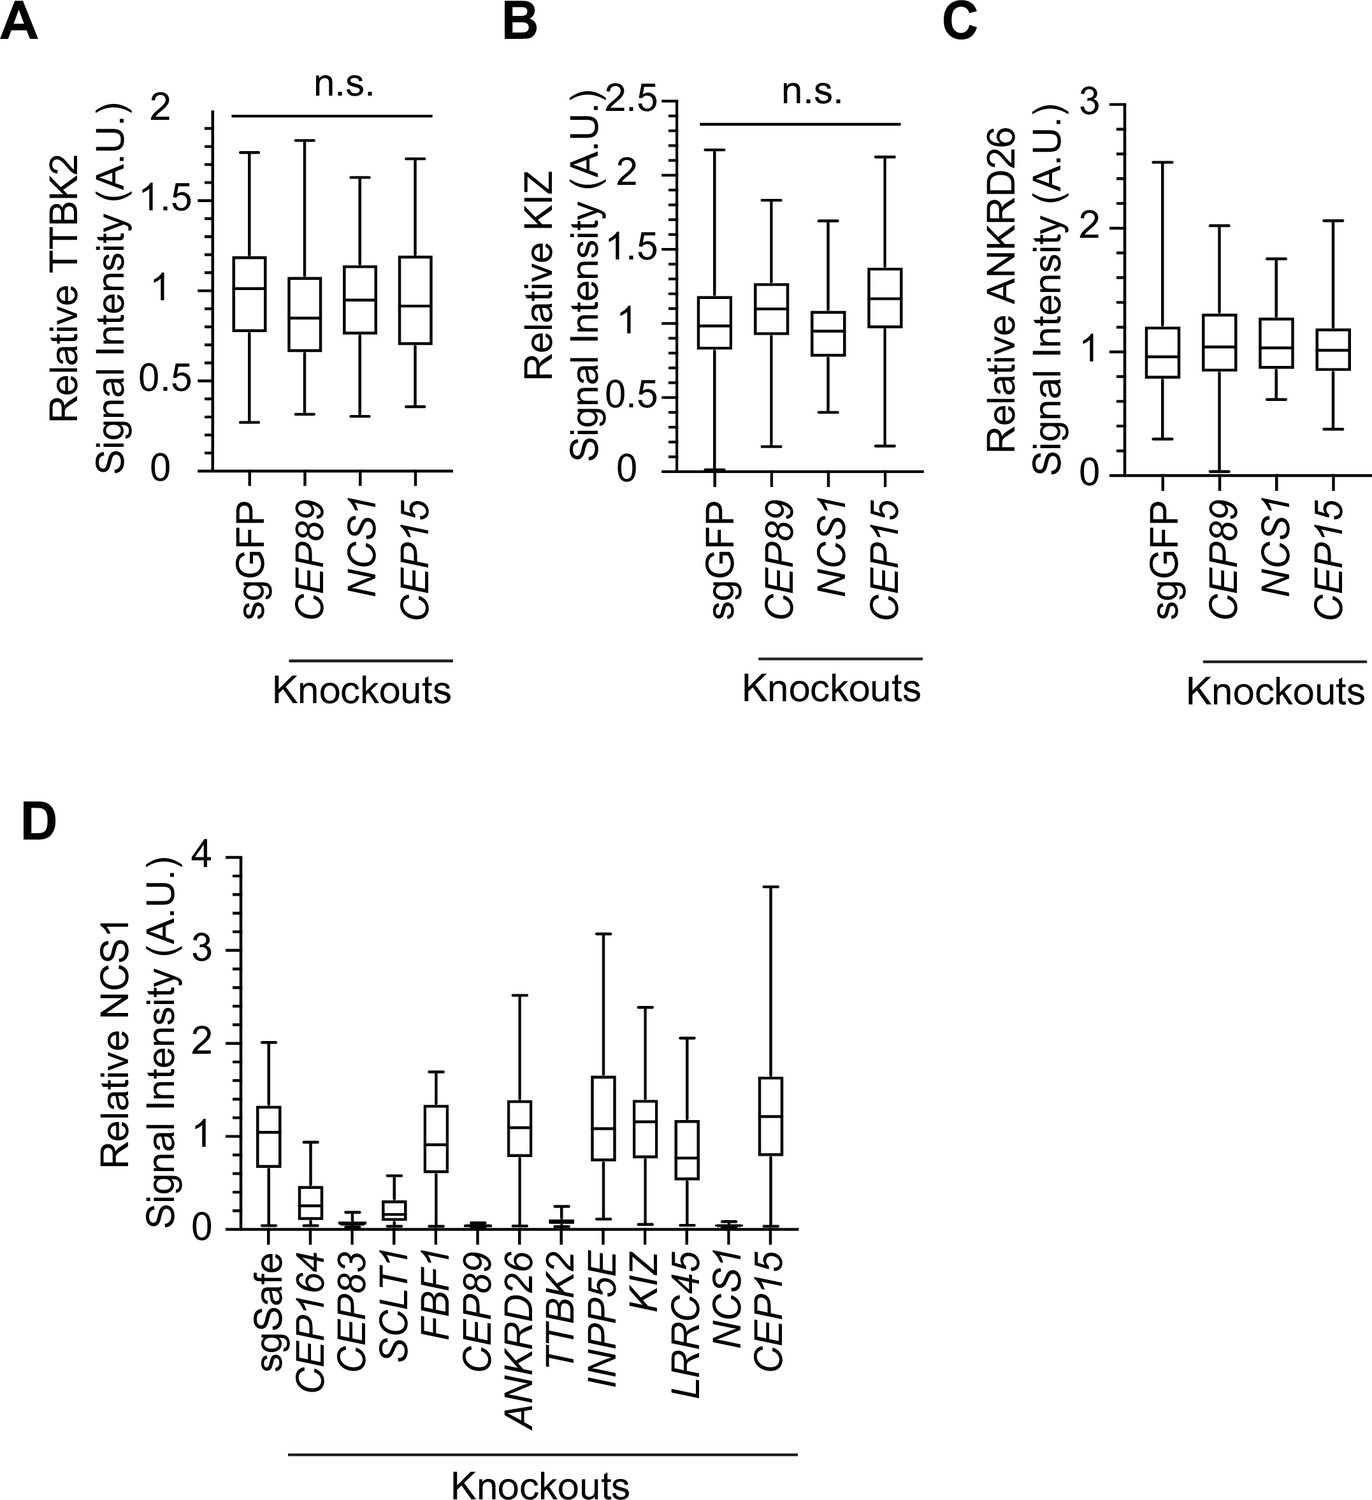
Localization of distal appendage protein in NCS1 knockouts.
Box plots showing centrosomal signal intensity of TTBK2 (A) and KIZ (B) in control (sgGFP), CEP89, NCS1, or CEP15 knockout retinal pigment epithelia (RPE) cells. The data combined from three independent experiments. Statistical significance was calculated from nested t-test. The raw data, experimental conditions, and detailed statistics are available in Figure 2—figure supplement 4—source data 1 and Figure 2—figure supplement 4—source data 2. Quantification of centrosomal signal intensity of ANKRD26 (C) and NCS1 (D) in indicated RPE cells. The data from the representative experiment are shown. The raw data and experimental condition are available in the source data of Figure 2—figure supplement 4—source data 3 and Figure 2—figure supplement 4—source data 4.
-
Figure 2—figure supplement 4—source data 1
Immunofluorescence conditions, raw quantification data, and detailed statistics of the experiment shown in Figure 2—figure supplement 4A.
- https://cdn.elifesciences.org/articles/85998/elife-85998-fig2-figsupp4-data1-v2.xlsx
-
Figure 2—figure supplement 4—source data 2
Immunofluorescence conditions, raw quantification data, and detailed statistics of the experiment shown in Figure 2—figure supplement 4B.
- https://cdn.elifesciences.org/articles/85998/elife-85998-fig2-figsupp4-data2-v2.xlsx
-
Figure 2—figure supplement 4—source data 3
Immunofluorescence conditions and raw quantification data of the experiment shown in Figure 2—figure supplement 4C.
- https://cdn.elifesciences.org/articles/85998/elife-85998-fig2-figsupp4-data3-v2.xlsx
-
Figure 2—figure supplement 4—source data 4
Immunofluorescence conditions and raw quantification data of the experiment shown in Figure 2—figure supplement 4D.
- https://cdn.elifesciences.org/articles/85998/elife-85998-fig2-figsupp4-data4-v2.xlsx
Figure 3 with 1 supplement
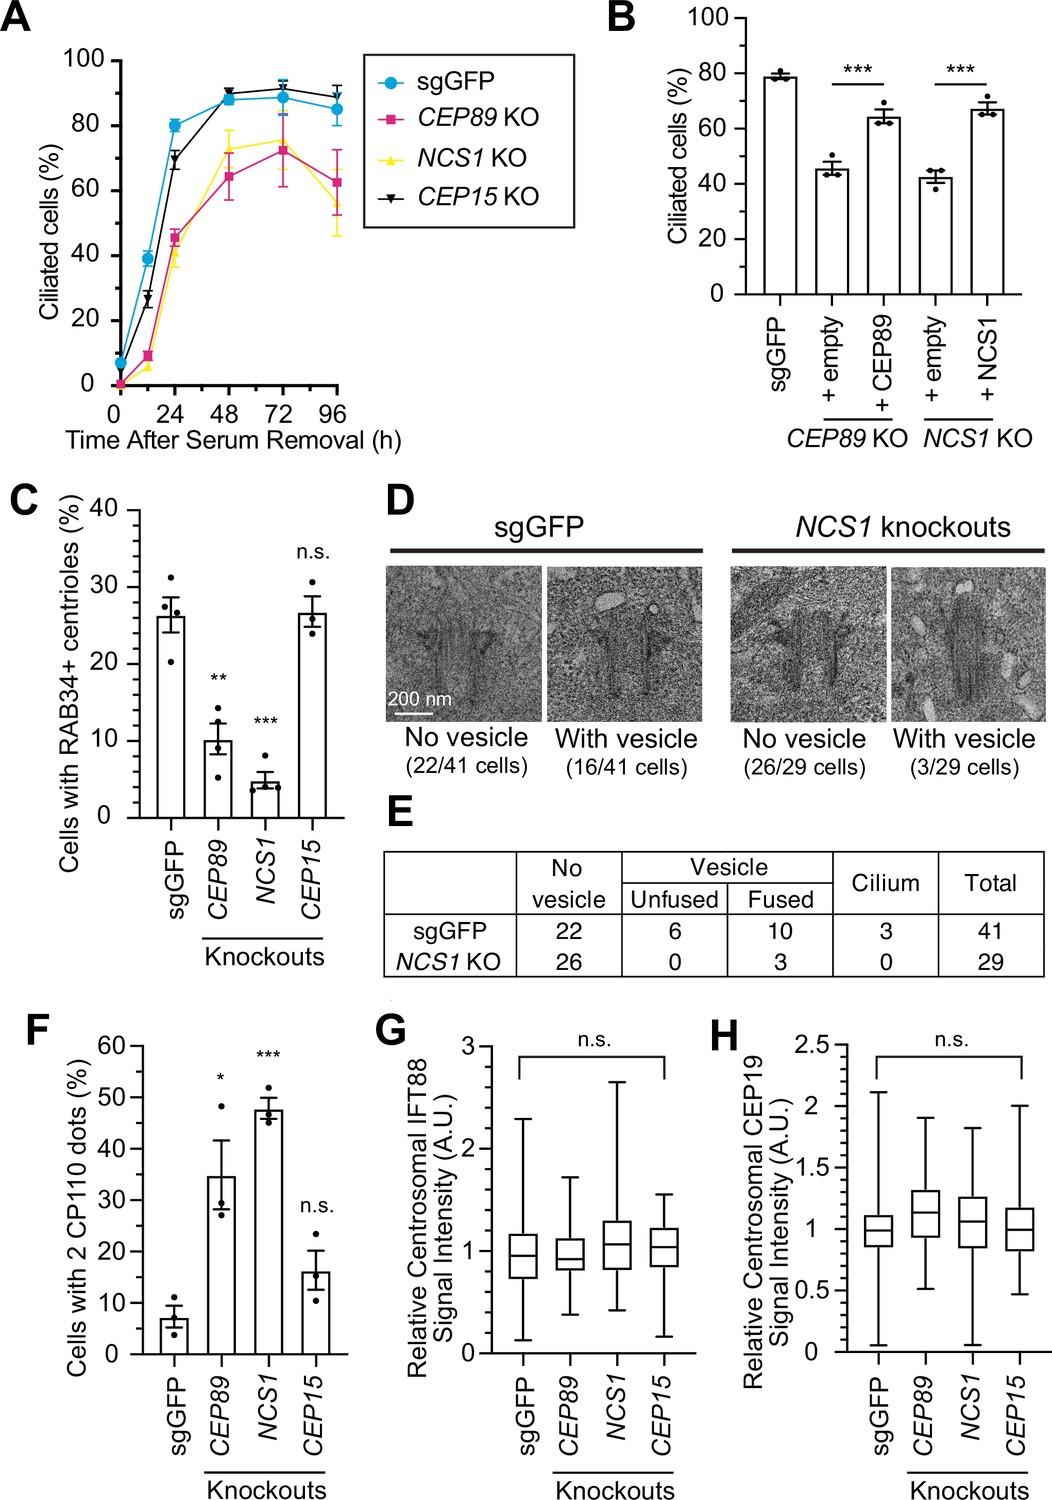
NCS1 is important for preciliary vesicle recruitment, but not for IFT88/CEP19 recruitment.
(A) Time course of cilium formation assay in control (sgGFP) and indicated knockout retinal pigment epithelia (RPE) cells. The indicated cells were serum starved for 12, 24,48,72,96 hr, fixed, stained with α-ARL13B (to mark cilium) and α-CEP170 (to mark centriole), and imaged via wide-field microscopy. Data averaged from four independent experiments. Error bars represent ± SEM. Statistics obtained through comparing between each knockout and control by Welch’s t-test. The raw data, experimental conditions, and detailed statistics are available in Figure 3—source data 1. (B) Cilium formation assay in control (sgGFP) and indicated knockout RPE cells serum starved for 24 hr. Data averaged from three independent experiments, and each black dot indicates the value from the individual experiment. Error bars represent ± SEM. Statistics obtained by Welch’s t-test. The raw data, experimental conditions, and detailed statistics are available in Figure 3—source data 2. (C) Preciliary vesicle recruitment assay in control (sgGFP) or indicated knockout RPE cells grown to confluence (without serum starvation). The data are averaged from four independent experiments, and each black dot indicates the value from each individual experiment. Error bars represent ± SEM. Statistics obtained through comparing between each knockout and control by Welch’s t-test. The raw data, experimental conditions, and detailed statistics are available in Figure 3—source data 3. (D) Transmission electron microscopy analysis of the mother centriole in control (sgGFP) or NCS1 knockout RPE cells serum starved for 3 hr. The representative images of the mother centrioles without (left) or with (right) vesicles at the distal appendage are shown. Scale: 200 nm. (E) Quantification of the data from the experiments shown in panel D. The raw data and detailed statistics are available in Figure 3—source data 4. This experiment was synchronized with the experiment shown in Figure 4C of Kanie et al., 2025, hence the values for sgGFP are exactly the same as the ones shown in Kanie et al., 2025. (F) CP110 removal assay in control (sgGFP) and indicated knockout RPE cells serum starved for 24 hr. Data are averaged from three independent experiments, and each black dot indicates the value from the individual experiment. Error bars represent ± SEM. Statistics obtained through comparing between each knockout and control by Welch’s t-test. The raw data, experimental conditions, and detailed statistics are available in Figure 3—source data 5. Quantification of the centrosomal signal intensity of IFT88 (G) or CEP19 (H) in control (sgGFP) and indicated knockout RPE cells serum starved for 24 hr. The data are combined from three independent experiments. Statistical significance was calculated from nested t-test. The raw data, experimental conditions, and detailed statistics are available in Figure 3—source data 6 and Figure 3—source data 7. A.U., arbitrary units; n.s., not significant; *p < 0.05, **p < 0.01, ***p < 0.001.
-
Figure 3—source data 1
Raw quantification data, immunofluorescence conditions, and detailed statistics of the experiment shown in Figure 3A.
- https://cdn.elifesciences.org/articles/85998/elife-85998-fig3-data1-v2.xlsx
-
Figure 3—source data 2
Raw quantification data, immunofluorescence conditions, and detailed statistics of the experiment shown in Figure 3B.
- https://cdn.elifesciences.org/articles/85998/elife-85998-fig3-data2-v2.xlsx
-
Figure 3—source data 3
Raw quantification data, immunofluorescence conditions, and detailed statistics of the experiment shown in Figure 3C.
- https://cdn.elifesciences.org/articles/85998/elife-85998-fig3-data3-v2.xlsx
-
Figure 3—source data 4
Raw quantification data and detailed statistics of the experiment shown in Figure 3E.
- https://cdn.elifesciences.org/articles/85998/elife-85998-fig3-data4-v2.xlsx
-
Figure 3—source data 5
Raw quantification data, immunofluorescence conditions, and detailed statistics of the experiment shown in Figure 3F.
- https://cdn.elifesciences.org/articles/85998/elife-85998-fig3-data5-v2.xlsx
-
Figure 3—source data 6
Raw quantification data, immunofluorescence conditions, and detailed statistics of the experiment shown in Figure 3G.
- https://cdn.elifesciences.org/articles/85998/elife-85998-fig3-data6-v2.xlsx
-
Figure 3—source data 7
Raw quantification data, immunofluorescence conditions, and detailed statistics of the experiment shown in Figure 3H.
- https://cdn.elifesciences.org/articles/85998/elife-85998-fig3-data7-v2.xlsx
Figure 3—figure supplement 1
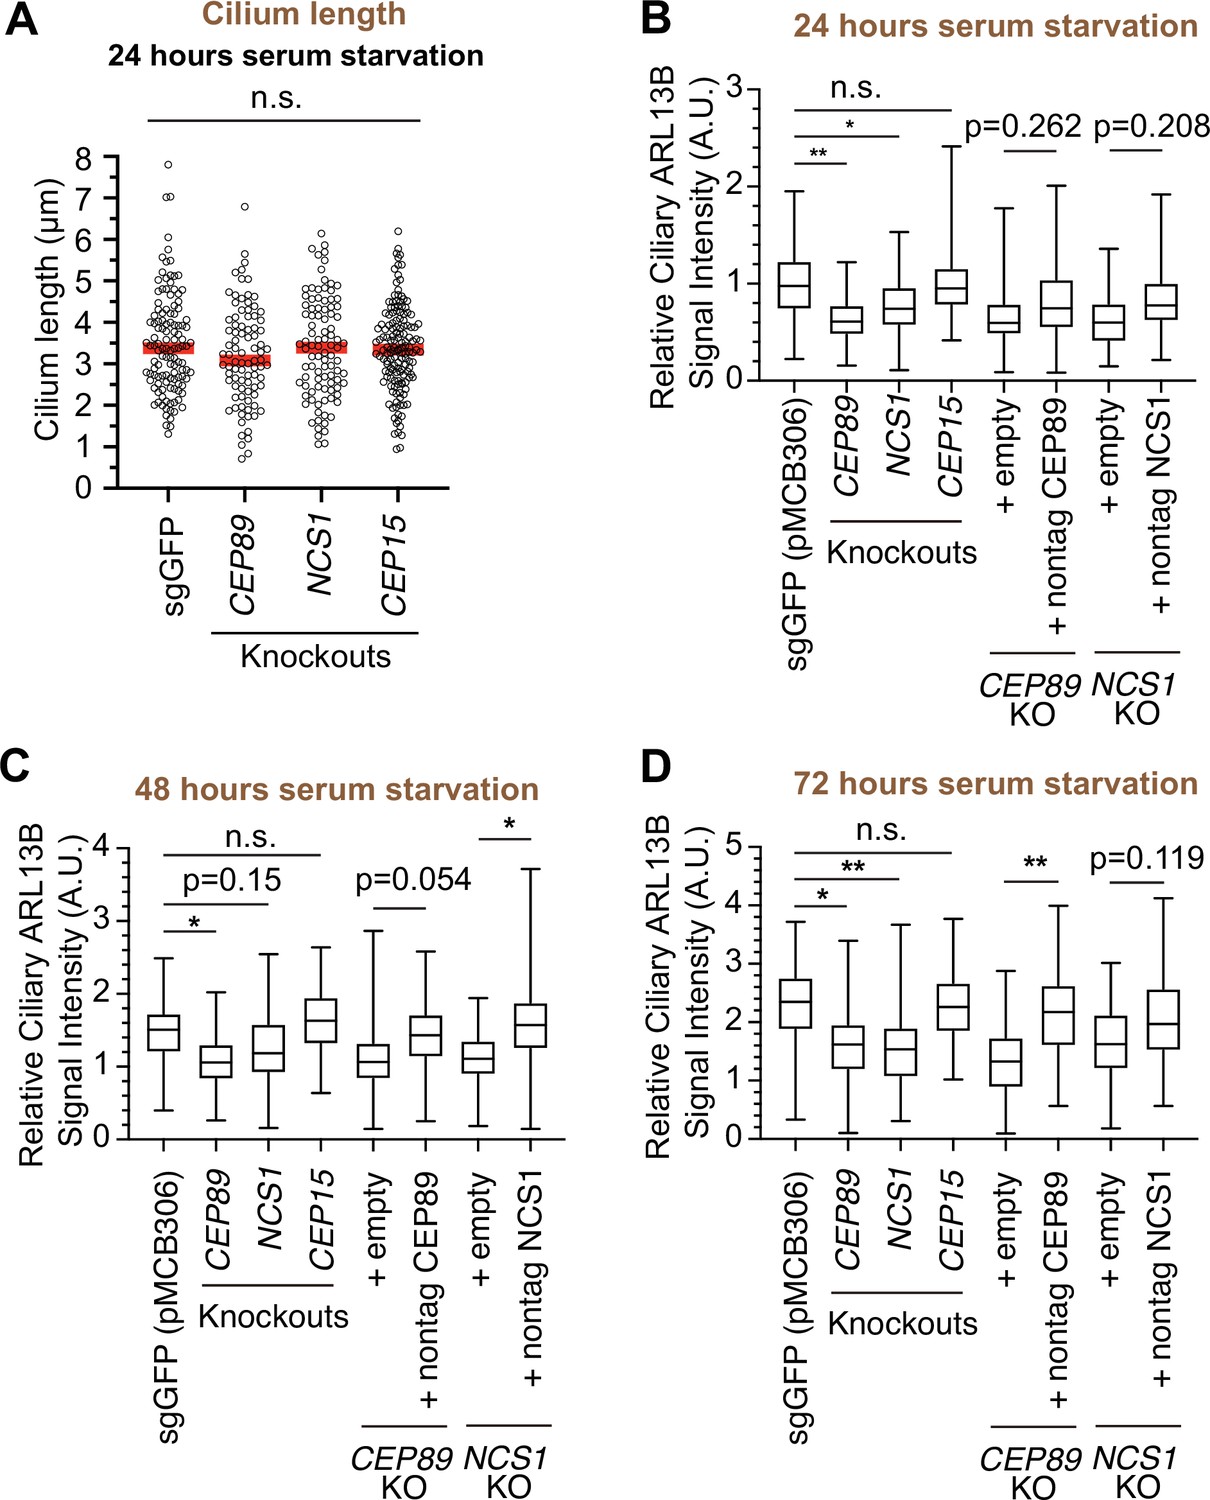
Quantification of ciliary signal intensity of ARL13B in CEP89 and NCS1 knockouts.
(A) Cilium length in control (sgGFP) and indicated knockout retinal pigment epithelia (RPE) cells serum starved for 24 hr. The data from a representative experiment are shown. Each circle indicates the cilium length of the individual cell. Red bars indicate median value. Statistics obtained through one-way ANOVA. The raw data, experimental conditions, and detailed statistics are available in Figure 3—figure supplement 1—source data 1. (B–D) Quantification of ciliary signal intensity of ARL13B in indicated RPE cells. The cells were serum starved for 24 (B), 48 (C), and 72 (D) hr, fixed, stained with α-ARL13B (cilium marker) and α-CEP170 (centriole marker), and imaged via wide-field microscopy. Data are averaged from three independent experiments. Error bars represent ± SEM. Statistics obtained by one-way ANOVA with Šídák’s multiple comparison test. The raw data, experimental conditions, and detailed statistics are available in Figure 3—figure supplement 1—source data 2. A.U., arbitrary units; n.s., not significant; *p < 0.05, **p < 0.01.
-
Figure 3—figure supplement 1—source data 1
Immunofluorescence conditions, raw quantification data, and detailed statistics of the experiment shown in Figure 3—figure supplement 1A.
- https://cdn.elifesciences.org/articles/85998/elife-85998-fig3-figsupp1-data1-v2.xlsx
-
Figure 3—figure supplement 1—source data 2
Immunofluorescence conditions, raw quantification data, and detailed statistics of the experiment shown in Figure 3—figure supplement 1B–D.
- https://cdn.elifesciences.org/articles/85998/elife-85998-fig3-figsupp1-data2-v2.xlsx
Figure 4
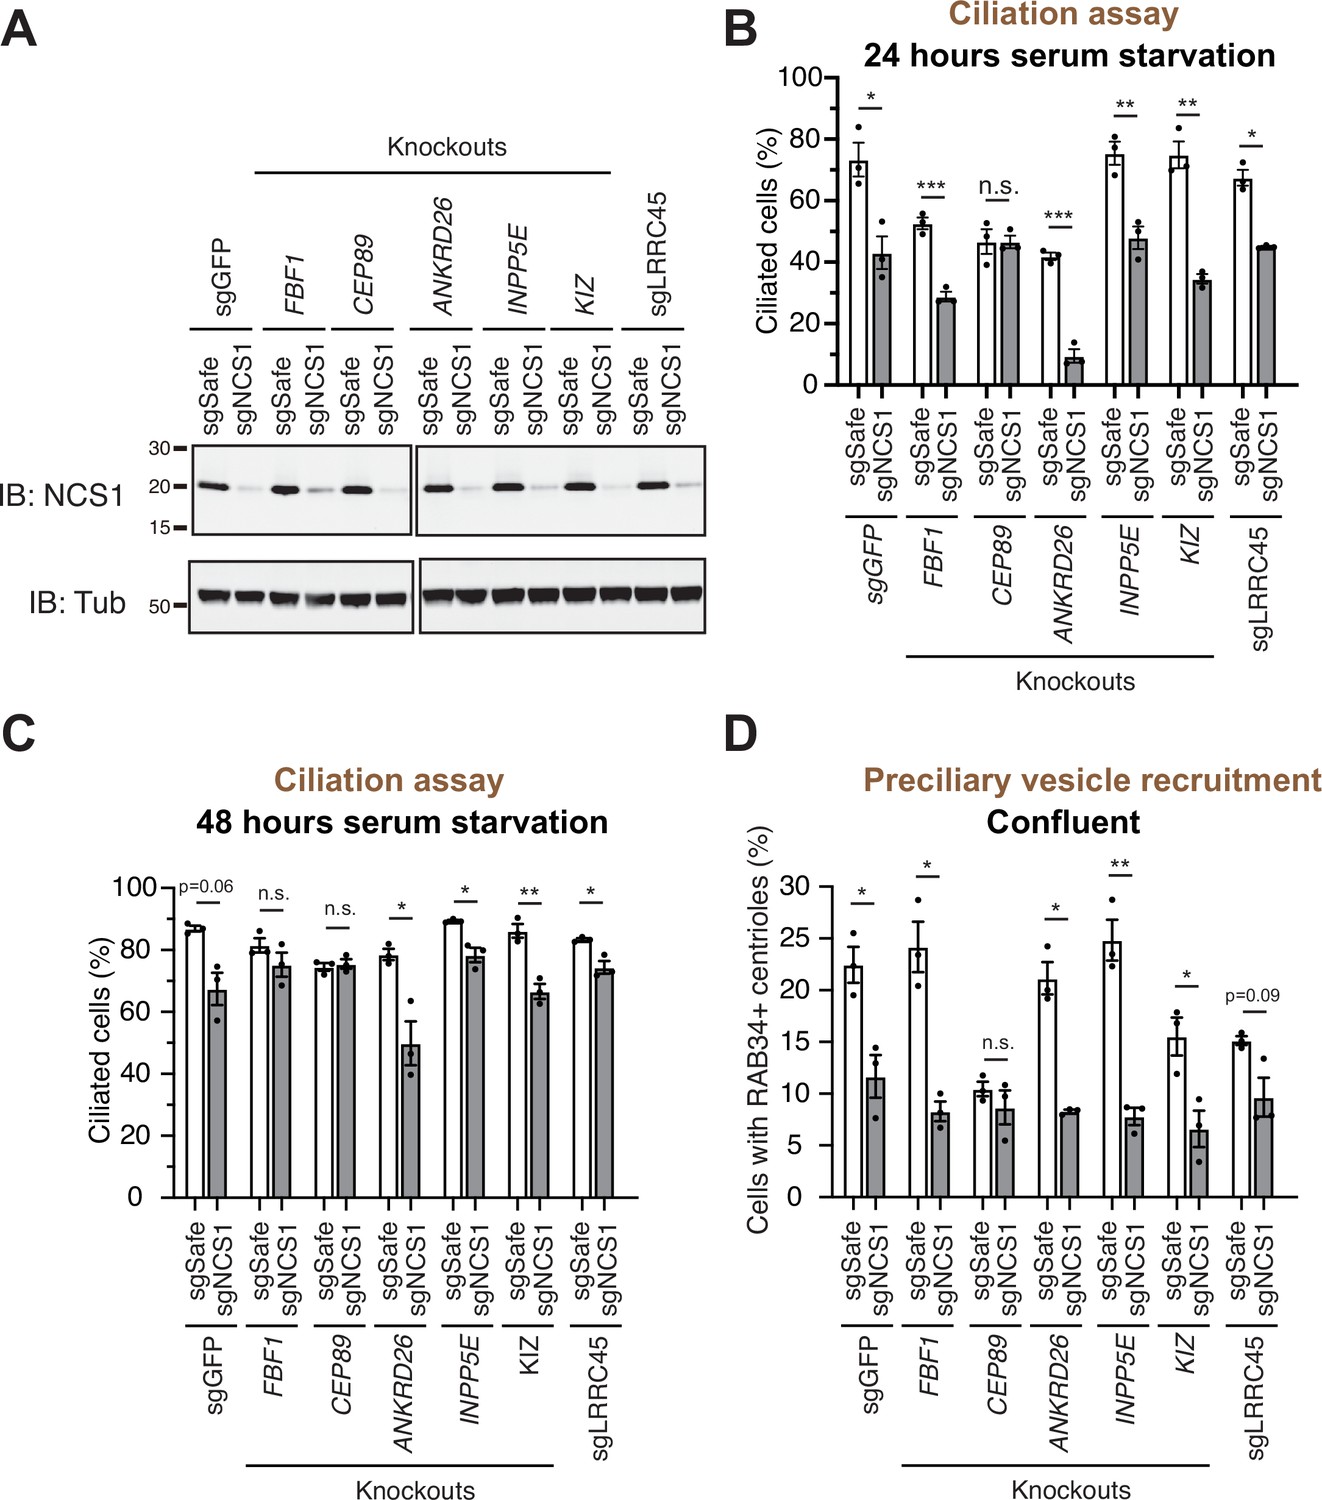
A preciliary vesicle recruitment defect in NCS1 knockout cells is compensated by yet unknown distal appendage proteins.
(A) Immunoblot (IB) analysis of expression of NCS1 (IB: NCS1) and α-tubulin (IB: Tub) in control (sgGFP) or indicated knockout retinal pigment epithelia (RPE) cells stably expressing either sgSafe (non-targeting) or sgNCS1. The cells were grown to confluence (without serum starvation), lysed and analyzed by immunoblot. Molecular weights (kDa) estimated from a protein marker are indicated. The raw unedited blots can be found in Figure 4—source data 1 and Figure 4—source data 2. (B, C) Cilium formation assay in control (sgGFP) and indicated knockout RPE cells stably expressing either sgSafe (non-targeting) or sgNCS1. The cells were serum starved for 24 (B) or 48 (C) hr. Data averaged from three independent experiments, and each black dot indicates the value from the individual experiment. Error bars represent ± SEM. Statistics obtained by Welch’s t-test. The raw data, experimental conditions, and detailed statistics are available in Figure 4—source data 3 and Figure 4—source data 4. (D) Preciliary vesicle recruitment assay in indicated knockout RPE cells stably expressing either sgSafe (control) or sgNCS1. Cells were grown to confluence (without serum starvation). Data are averaged from three independent experiments. Error bars represent ± SEM. Statistics obtained by Welch’s t-test. The raw data, experimental conditions, and detailed statistics are available in Figure 4—source data 5. n.s., not significant; *p < 0.05, **p < 0.01, ***p < 0.001.
-
Figure 4—source data 1
The original files of the full raw unedited blots shown in Figure 4A.
- https://cdn.elifesciences.org/articles/85998/elife-85998-fig4-data1-v2.zip
-
Figure 4—source data 2
The uncropped blots with boxes that indicate the regions displayed in Figure 4A.
- https://cdn.elifesciences.org/articles/85998/elife-85998-fig4-data2-v2.pdf
-
Figure 4—source data 3
Raw quantification data, immunofluorescence conditions, and detailed statistics of the experiment shown in Figure 4B.
- https://cdn.elifesciences.org/articles/85998/elife-85998-fig4-data3-v2.xlsx
-
Figure 4—source data 4
Raw quantification data, immunofluorescence conditions, and detailed statistics of the experiment shown in Figure 4C.
- https://cdn.elifesciences.org/articles/85998/elife-85998-fig4-data4-v2.xlsx
-
Figure 4—source data 5
Raw quantification data, immunofluorescence conditions, and detailed statistics of the experiment shown in Figure 4D.
- https://cdn.elifesciences.org/articles/85998/elife-85998-fig4-data5-v2.xlsx
Figure 5 with 1 supplement
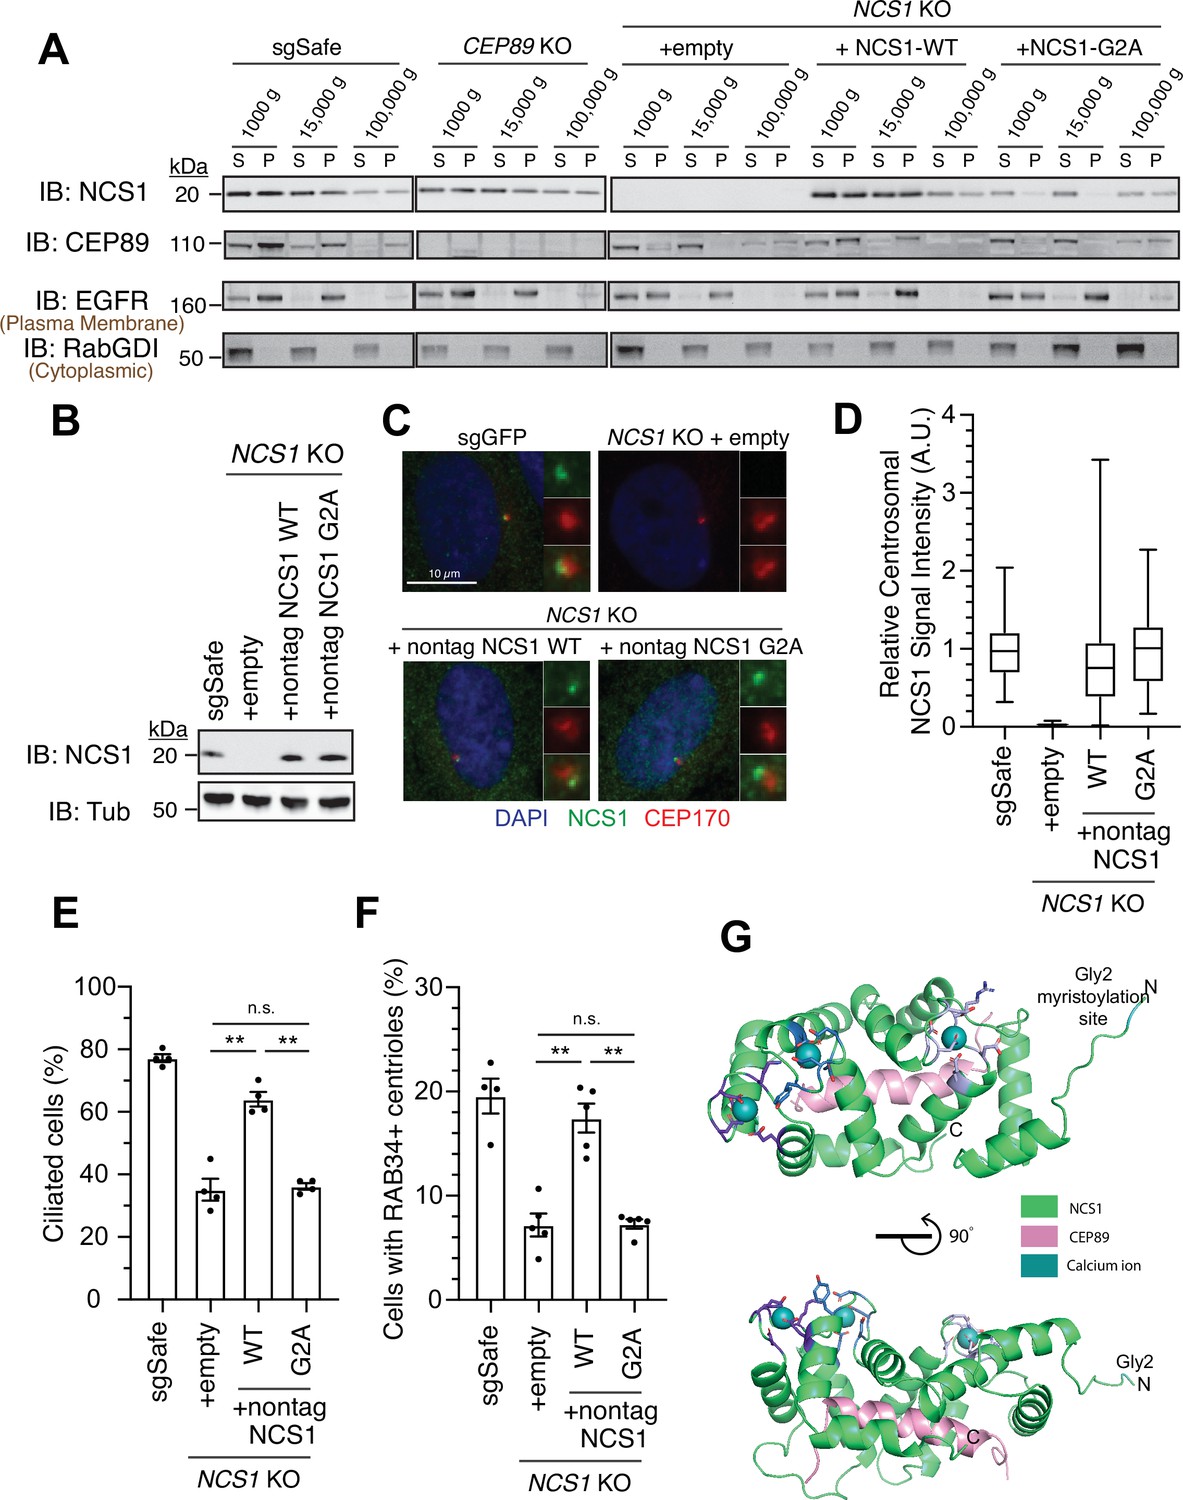
NCS1 captures the preciliary vesicle via its myristoylation motif.
(A) Immunoblot (IB) analysis of expression of NCS1, CEP89, EGFR, and RabGDI. The control (sgSafe) and indicated knockout retinal pigment epithelia (RPE) cells were grown to confluence, lysed by nitrogen cavitation, and fractionated by differential centrifugation at 1000, 15,000, and 100,000 × g. S: supernatant; P: pellet. Molecular weights (kDa) estimated from a protein marker are indicated. EGFR and RabGDI serve as representative markers for plasma membrane or cytoplasmic proteins, respectively. The raw unedited blots can be found in Figure 5—source data 1 and Figure 5—source data 2. (B) Immunoblot (IB) analysis of expression of NCS1 and α-tubulin in control (sgSafe) or indicated RPE cells. Molecular weights (kDa) estimated from a protein marker are indicated. The raw unedited blots can be found in Figure 5—source data 3 and Figure 5—source data 4. (C) Immunofluorescence images taken via wide-filed microscopy in the cells described in (B) serum starved for 24 hr. Insets at the right panels are the enlarged images of the mother centriole. Scale bar: 10 µm. (D) Box plots showing centrosomal signal intensity of NCS1 in cells described in (B) that were serum starved for 24 hr. A.U., arbitrary units. The data from a representative experiment are shown. The raw data and experimental conditions are available in Figure 5—source data 6. (E) Cilium formation assay in the cells described in (B) serum starved for 24 hr. Data averaged from four independent experiments, and each black dot indicates the value from the individual experiment. Error bars represent ± SEM. Statistics obtained by Welch’s t-test. The raw data, experimental conditions, and detailed statistics are available in Figure 5—source data 7. (F) Preciliary vesicle recruitment assay in the cells described in (B) grown to confluence (without serum starvation). Data averaged from five independent experiments. Error bars represent ± SEM. Statistics obtained through comparing between each knockout and control by Welch’s t-test. The raw data, experimental conditions, and detailed statistics are available in Figure 5—source data 8. (G) Cartoon representation of two perpendicular views of the CEP89-NCS1structural model with the myristoylation site (glycine 2) highlighted in cyan. Calcium ions are shown as spheres and EF-hand motifs of NCS1 are shown as sticks and colored in different shades of blue. The NCS1-binding helix of CEP89 is shown in pink. n.s., not significant; **p < 0.01.
-
Figure 5—source data 1
The original files of the full raw unedited blots shown in Figure 5A.
- https://cdn.elifesciences.org/articles/85998/elife-85998-fig5-data1-v2.zip
-
Figure 5—source data 2
The uncropped blots with boxes that indicate the regions displayed in Figure 5A.
- https://cdn.elifesciences.org/articles/85998/elife-85998-fig5-data2-v2.pdf
-
Figure 5—source data 3
The original files of the full raw unedited blots shown in Figure 5B.
- https://cdn.elifesciences.org/articles/85998/elife-85998-fig5-data3-v2.zip
-
Figure 5—source data 4
The uncropped blots with boxes that indicate the regions displayed in Figure 5B.
- https://cdn.elifesciences.org/articles/85998/elife-85998-fig5-data4-v2.pdf
-
Figure 5—source data 5
Immunofluorescence conditions in the experiment shown in Figure 5C.
- https://cdn.elifesciences.org/articles/85998/elife-85998-fig5-data5-v2.xlsx
-
Figure 5—source data 6
Raw quantification data and immunofluorescence conditions of the experiment shown in Figure 5D.
- https://cdn.elifesciences.org/articles/85998/elife-85998-fig5-data6-v2.xlsx
-
Figure 5—source data 7
Raw quantification data, immunofluorescence conditions, and detailed statistics of the experiment shown in Figure 5E.
- https://cdn.elifesciences.org/articles/85998/elife-85998-fig5-data7-v2.xlsx
-
Figure 5—source data 8
Raw quantification data, immunofluorescence conditions, and detailed statistics of the experiment shown in Figure 5F.
- https://cdn.elifesciences.org/articles/85998/elife-85998-fig5-data8-v2.xlsx
Figure 5—figure supplement 1
Calcium is required mainly for the stability of NCS1.
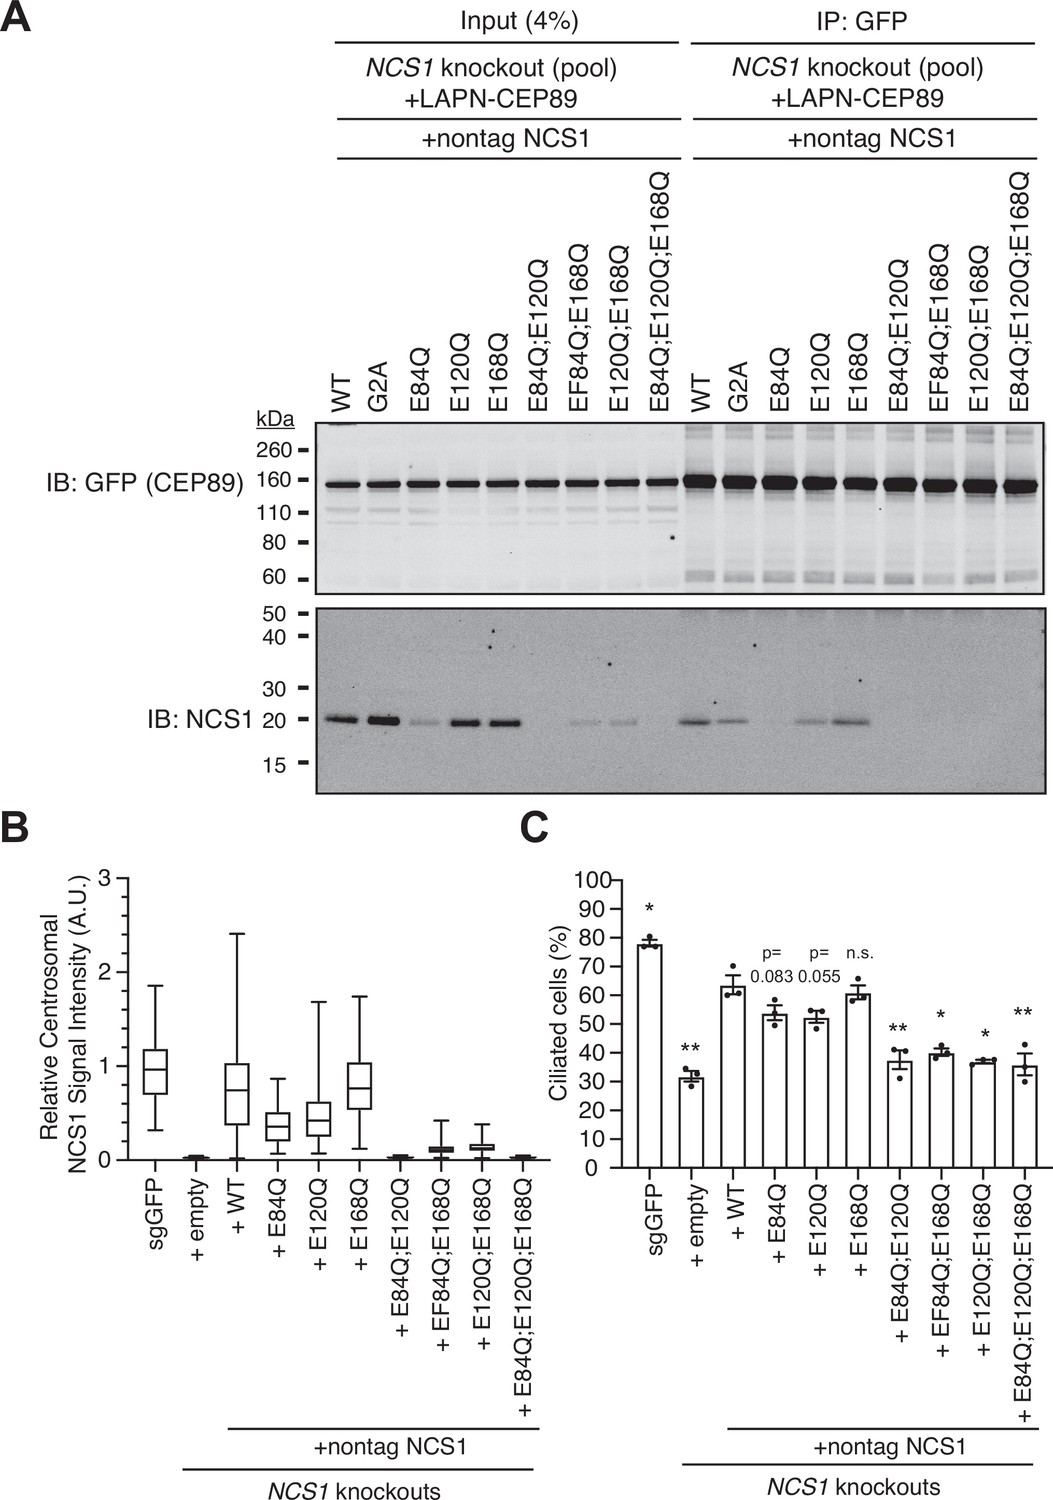
(A) Immunoblot (IB) analysis of the eluates from co-immunoprecipitation assay of NCS1 knockout retinal pigment epithelia (RPE) cells stably expressing wild-type or indicated point mutants of untagged NCS1 and N-terminally LAP (EGFP and S)-tagged CEP89. The cell lysates were co-immunoprecipitated with GFP antibodies, resolved by sodium dodecyl sulfate–polyacrylamide gel electrophoresis (SDS–PAGE) and immunoblotted with indicated antibodies. Molecular weights (kDa) estimated from a protein marker are indicated. The raw unedited blots can be found in Figure 5—figure supplement 1—source data 1 and Figure 5—figure supplement 1—source data 2. (B) Box plots showing centrosomal signal intensity of NCS1. Control (sgGFP) or NCS1 knockout RPE cells stably expressing wild-type or indicated point mutants of NCS1 were serum starved for 24 hr. Cells were fixed and stained with NCS1 antibody. Centrosomal signal intensity of NCS1 was measured from fluorescent images with the method described in Materials and methods. A.U., arbitrary units. Data from a representative experiment are shown. The raw data and experimental conditions are available in Figure 5—figure supplement 1—source data 3. (C) Cilium formation assay in cells described in (B) serum starved for 24 hr. Data are averaged from three independent experiments, and each black dot indicates the value from the individual experiment. Error bars represent ± SEM. Statistics obtained through comparing between each mutant and wild-type NCS1 by Welch’s t-test. The raw data, experimental conditions, and detailed statistics are available in Figure 5—figure supplement 1—source data 4. n.s., not significant; *p < 0.05, **p < 0.01.
-
Figure 5—figure supplement 1—source data 1
The original files of the full raw unedited blots shown in Figure 5—figure supplement 1A.
- https://cdn.elifesciences.org/articles/85998/elife-85998-fig5-figsupp1-data1-v2.zip
-
Figure 5—figure supplement 1—source data 2
The uncropped blots with boxes that indicate the regions displayed in Figure 5—figure supplement 1A.
- https://cdn.elifesciences.org/articles/85998/elife-85998-fig5-figsupp1-data2-v2.pdf
-
Figure 5—figure supplement 1—source data 3
Immunofluorescence conditions and raw quantification data of the experiment shown in Figure 5—figure supplement 1B.
- https://cdn.elifesciences.org/articles/85998/elife-85998-fig5-figsupp1-data3-v2.xlsx
-
Figure 5—figure supplement 1—source data 4
Immunofluorescence conditions, raw quantification data, and detailed statistics of the experiment shown in Figure 5—figure supplement 1C.
- https://cdn.elifesciences.org/articles/85998/elife-85998-fig5-figsupp1-data4-v2.xlsx
Figure 6
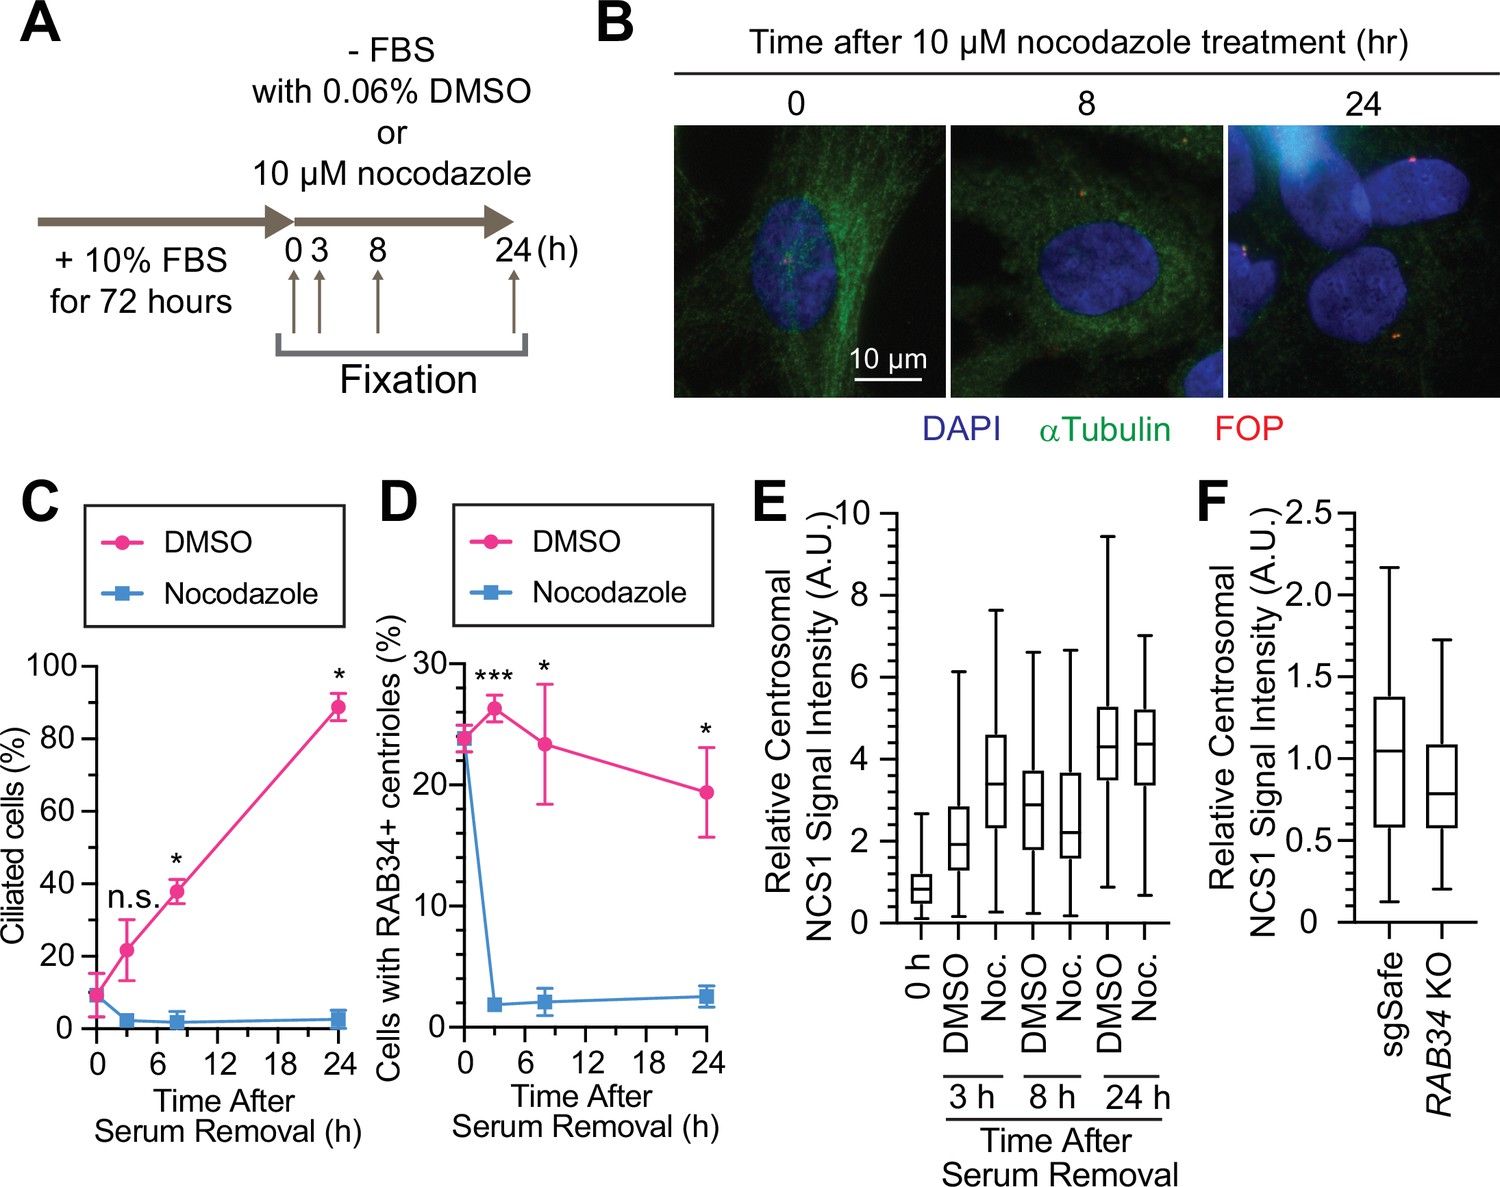
Preciliary vesicle, but not NCS1 and CEP89, is recruited to the centriole via microtubules.
(A) A cartoon showing the method used to test the requirement of microtubules in preciliary vesicle recruitment and NCS1 localization. Retinal pigment epithelia (RPE) cells were cultured in media containing 10% fetal bovine serum (FBS) for 72 hr, then serum starved (−FBS) for indicated times in the presence of nocodazole or dimethyl sulfoxide (DMSO). (B) Immunofluorescence images taken via wide-filed microscopy. RPE cells were cultured as shown in (A), fixed, and stained with antibodies against α-tubulin and FGFR1OP (FOP). Scale bar: 10 µm. (C) The time course of cilium formation in cells treated with either DMSO (magenta) or nocodazole (blue). The cells were fixed at indicated time points, stained with α-ARL13B (to mark cilium) and α-CEP170 (to mark centriole), and imaged via wide-field microscopy. Data averaged from three independent experiments. Error bars represent ± SEM. Statistics obtained through comparing between DMSO and nocodazole treated cells at each time point by Welch’s t-test. The raw data, experimental conditions, and detailed statistics are available in Figure 6—source data 2. (D) The time course of preciliary vesicle recruitment in cells treated with either DMSO (magenta) or nocodazole (blue). The cells were fixed at indicated time points, stained with α-RAB34 (to mark the centriole-associated vesicle) and α-CEP170 (to mark centriole), and imaged via wide-field microscopy. Data are averaged from three independent experiments. Error bars represent ± SEM. Statistics obtained through comparing between DMSO and nocodazole treated cells at each time point by Welch’s t-test. The raw data, experimental conditions, and detailed statistics are available in Figure 6—source data 3. (E) Box plots showing centrosomal signal intensity of NCS1 in RPE cells prepared using the method described in (A). The data from the representative experiment are shown. The raw data and experimental conditions are available in Figure 6—source data 4. (F) Quantification of the centrosomal signal intensity of NCS1 in control or RAB34 knockout RPE cells serum starved for 24 hr. The data from the representative experiment are shown. The raw data and experimental conditions are available in Figure 6—source data 5. A.U., arbitrary units; n.s., not significant; *p < 0.05, ***p < 0.001.
-
Figure 6—source data 1
Immunofluorescence conditions in the experiment shown in Figure 6B.
- https://cdn.elifesciences.org/articles/85998/elife-85998-fig6-data1-v2.xlsx
-
Figure 6—source data 2
Raw quantification data, immunofluorescence conditions, and detailed statistics of the experiment shown in Figure 6C.
- https://cdn.elifesciences.org/articles/85998/elife-85998-fig6-data2-v2.xlsx
-
Figure 6—source data 3
Raw quantification data, immunofluorescence conditions, and detailed statistics of the experiment shown in Figure 6D.
- https://cdn.elifesciences.org/articles/85998/elife-85998-fig6-data3-v2.xlsx
-
Figure 6—source data 4
Raw quantification data and immunofluorescence conditions of the experiment shown in Figure 6E.
- https://cdn.elifesciences.org/articles/85998/elife-85998-fig6-data4-v2.xlsx
-
Figure 6—source data 5
Raw quantification data and immunofluorescence conditions of the experiment shown in Figure 6F.
- https://cdn.elifesciences.org/articles/85998/elife-85998-fig6-data5-v2.xlsx
Figure 7 with 3 supplements
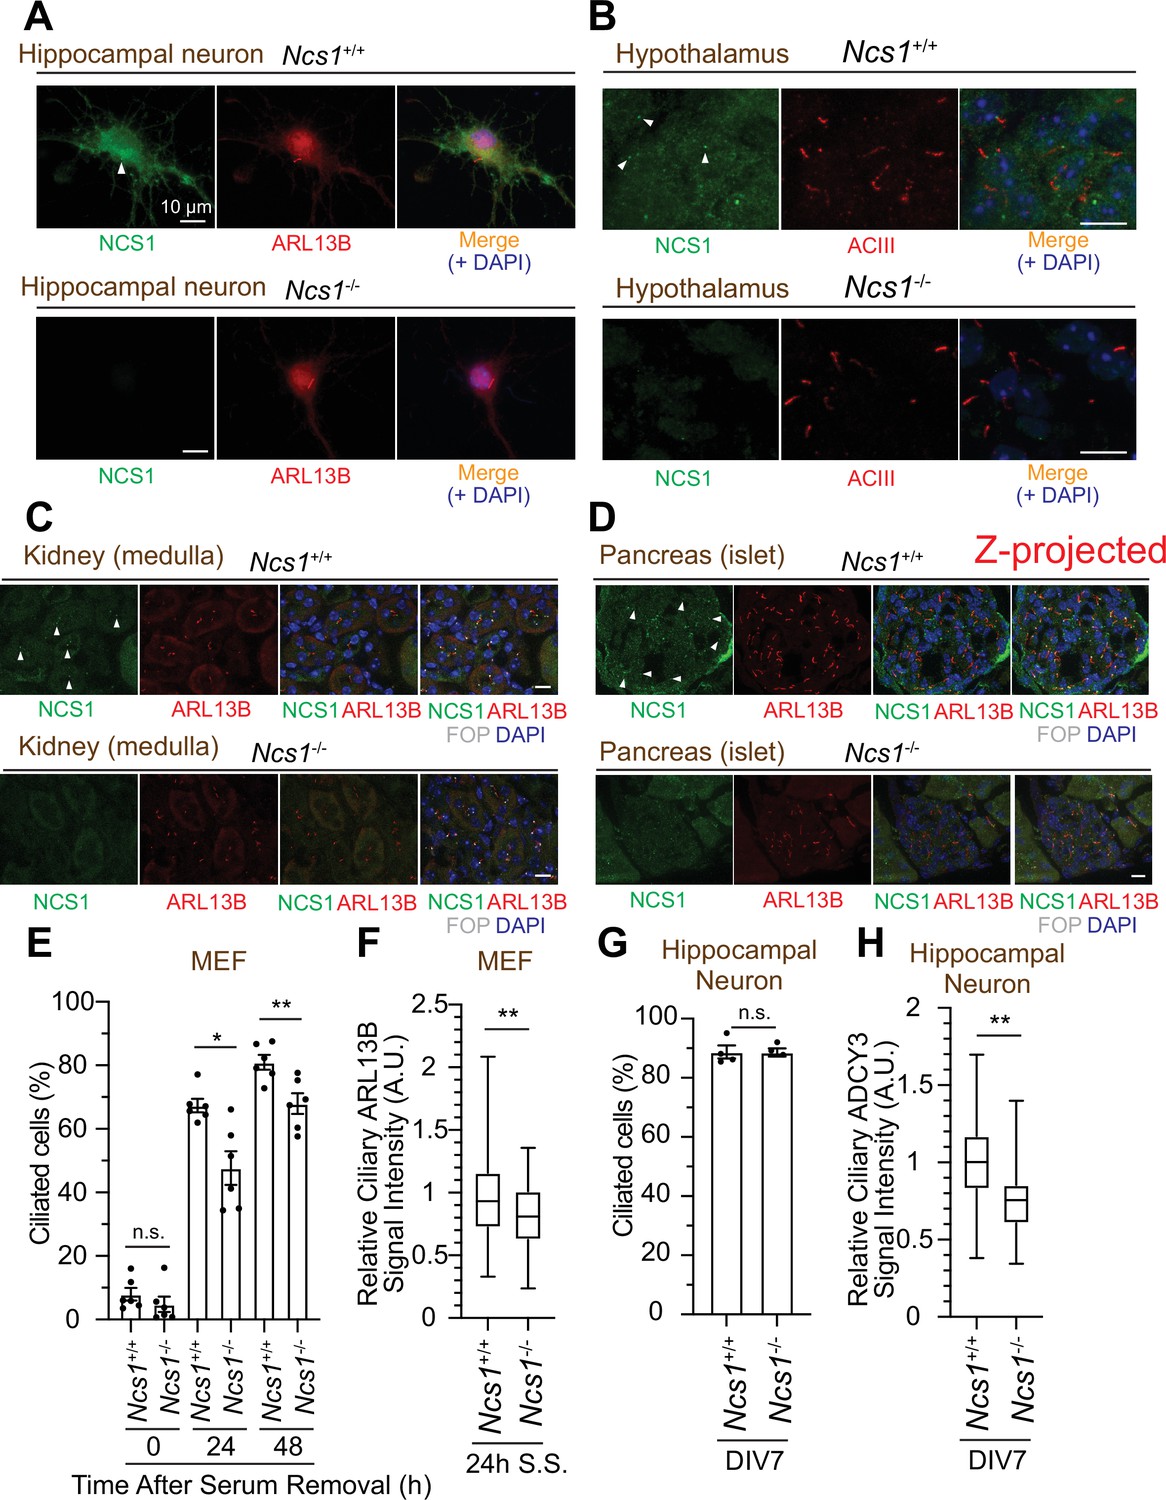
NCS1 localizes to the ciliary base in ciliated tissues and gets involved in cilium formation and ciliary membrane protein trafficking.
(A) Immunofluorescence images of cultured hippocampal neurons taken by wide-field microscopy. The isolated hippocampal neurons from E18.5 Ncs1+/+ or Ncs1−/− mice were fixed and stained for the indicated markers. Arrow indicates Ncs1 localization at the ciliary base. The individual image is from a representative z-slice. Scale bar: 10 µm. (B–D) Immunofluorescence images of indicated mouse tissues taken via spinning disk confocal microscopy. Tissue sections prepared from 8-week-old Ncs1+/+ or Ncs1−/− mice with the method described in Materials and methods were stained for indicated markers. The images shown in (D) were created by maximum intensity z-projection. The other images were from representative z-slices. Arrowheads indicate NCS1 localization. Scale bar: 10 µm. (E) Cilium formation assay in Ncs1+/+ or Ncs1−/− mouse embryonic fibroblasts (MEFs) serum starved for indicated time. Data averaged from six different MEFs per genotype. Each black dot indicates the value from the individual experiment. Error bars represent ± SEM. Statistics obtained through comparing between the two genotypes at each time point by Welch’s t-test. The raw data, experimental conditions, and detailed statistics are available in Figure 7—source data 5. (F) Box plots showing ciliary signal intensity of ARL13B in Ncs1+/+ or Ncs1−/− MEFs. The cells were serum starved for 24 hr, fixed, stained with α-ARL13B (to mark cilium) and α-CEP170 (to mark centriole), and imaged via wide-field microscopy. Data averaged from six different MEFs per genotype. Statistical significance was calculated from nested t-test. The raw data, experimental conditions, and detailed statistics are available in Figure 7—source data 6. (G) Cilium formation assay in isolated hippocampal neurons prepared from Ncs1+/+ or Ncs1−/− E18.5 mouse embryos at 7 days in vitro (DIV). Data are averaged from four different hippocampal neurons per genotype. Each black dot indicates the value from the individual experiment. Error bars represent ± SEM. Statistics obtained through comparing between the two genotypes at each time point by Welch’s t-test. The raw data, experimental conditions, and detailed statistics are available in Figure 7—source data 7. (H) Box plots showing ciliary signal intensity of ADCY3 in isolated hippocampal neurons prepared from Ncs1+/+ or Ncs1−/− E18.5 mouse embryos at DIV7. The cells were fixed and stained with α-ADCY3 antibody, and imaged via wide-field microscopy. Data are averaged from five different neurons per genotype. Statistical significance was calculated from nested t-test. The raw data, experimental conditions, and detailed statistics are available in Figure 7—source data 8. A.U., arbitrary units; n.s., not significant; *p < 0.05, **p < 0.01.
-
Figure 7—source data 1
Immunofluorescence conditions in the experiment shown in Figure 7A.
- https://cdn.elifesciences.org/articles/85998/elife-85998-fig7-data1-v2.xlsx
-
Figure 7—source data 2
Immunofluorescence conditions in the experiment shown in Figure 7B.
- https://cdn.elifesciences.org/articles/85998/elife-85998-fig7-data2-v2.xlsx
-
Figure 7—source data 3
Immunofluorescence conditions in the experiment shown in Figure 7C.
- https://cdn.elifesciences.org/articles/85998/elife-85998-fig7-data3-v2.xlsx
-
Figure 7—source data 4
Immunofluorescence conditions in the experiment shown in Figure 7D.
- https://cdn.elifesciences.org/articles/85998/elife-85998-fig7-data4-v2.xlsx
-
Figure 7—source data 5
Raw quantification data, immunofluorescence conditions, and detailed statistics of the experiment shown in Figure 7E.
- https://cdn.elifesciences.org/articles/85998/elife-85998-fig7-data5-v2.xlsx
-
Figure 7—source data 6
Raw quantification data, immunofluorescence conditions, and detailed statistics of the experiment shown in Figure 7F.
- https://cdn.elifesciences.org/articles/85998/elife-85998-fig7-data6-v2.xlsx
-
Figure 7—source data 7
Raw quantification data, immunofluorescence conditions, and detailed statistics of the experiment shown in Figure 7G.
- https://cdn.elifesciences.org/articles/85998/elife-85998-fig7-data7-v2.xlsx
-
Figure 7—source data 8
Raw quantification data, immunofluorescence conditions, and detailed statistics of the experiment shown in Figure 7H.
- https://cdn.elifesciences.org/articles/85998/elife-85998-fig7-data8-v2.xlsx
Figure 7—figure supplement 1
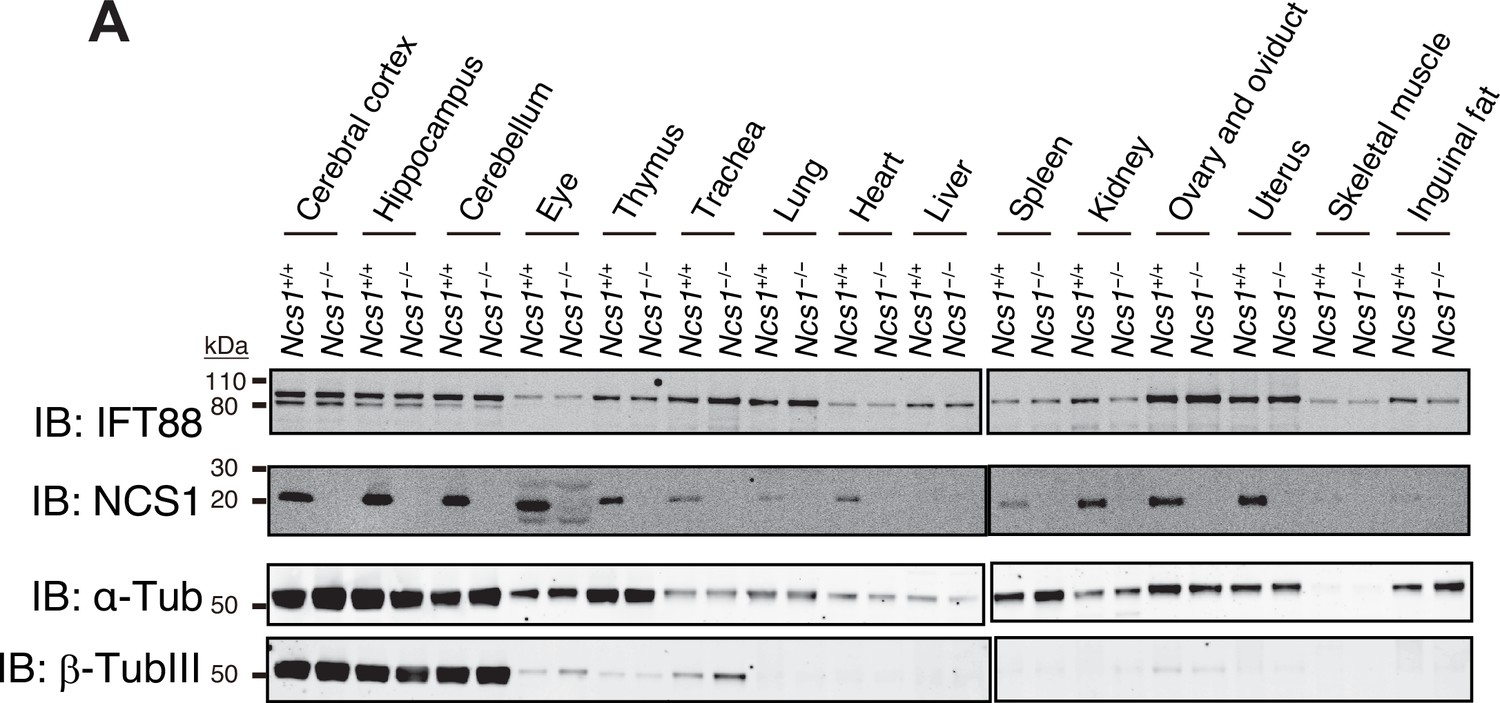
(A) The expression of NCS1 in various tissues.
-
Figure 7—figure supplement 1—source data 1
The original files of the full raw unedited blots shown in Figure 7—figure supplement 1A.
- https://cdn.elifesciences.org/articles/85998/elife-85998-fig7-figsupp1-data1-v2.zip
-
Figure 7—figure supplement 1—source data 2
The uncropped blots with boxes that indicate the regions displayed in Figure 7—figure supplement 1A.
- https://cdn.elifesciences.org/articles/85998/elife-85998-fig7-figsupp1-data2-v2.pdf
Figure 7—figure supplement 2
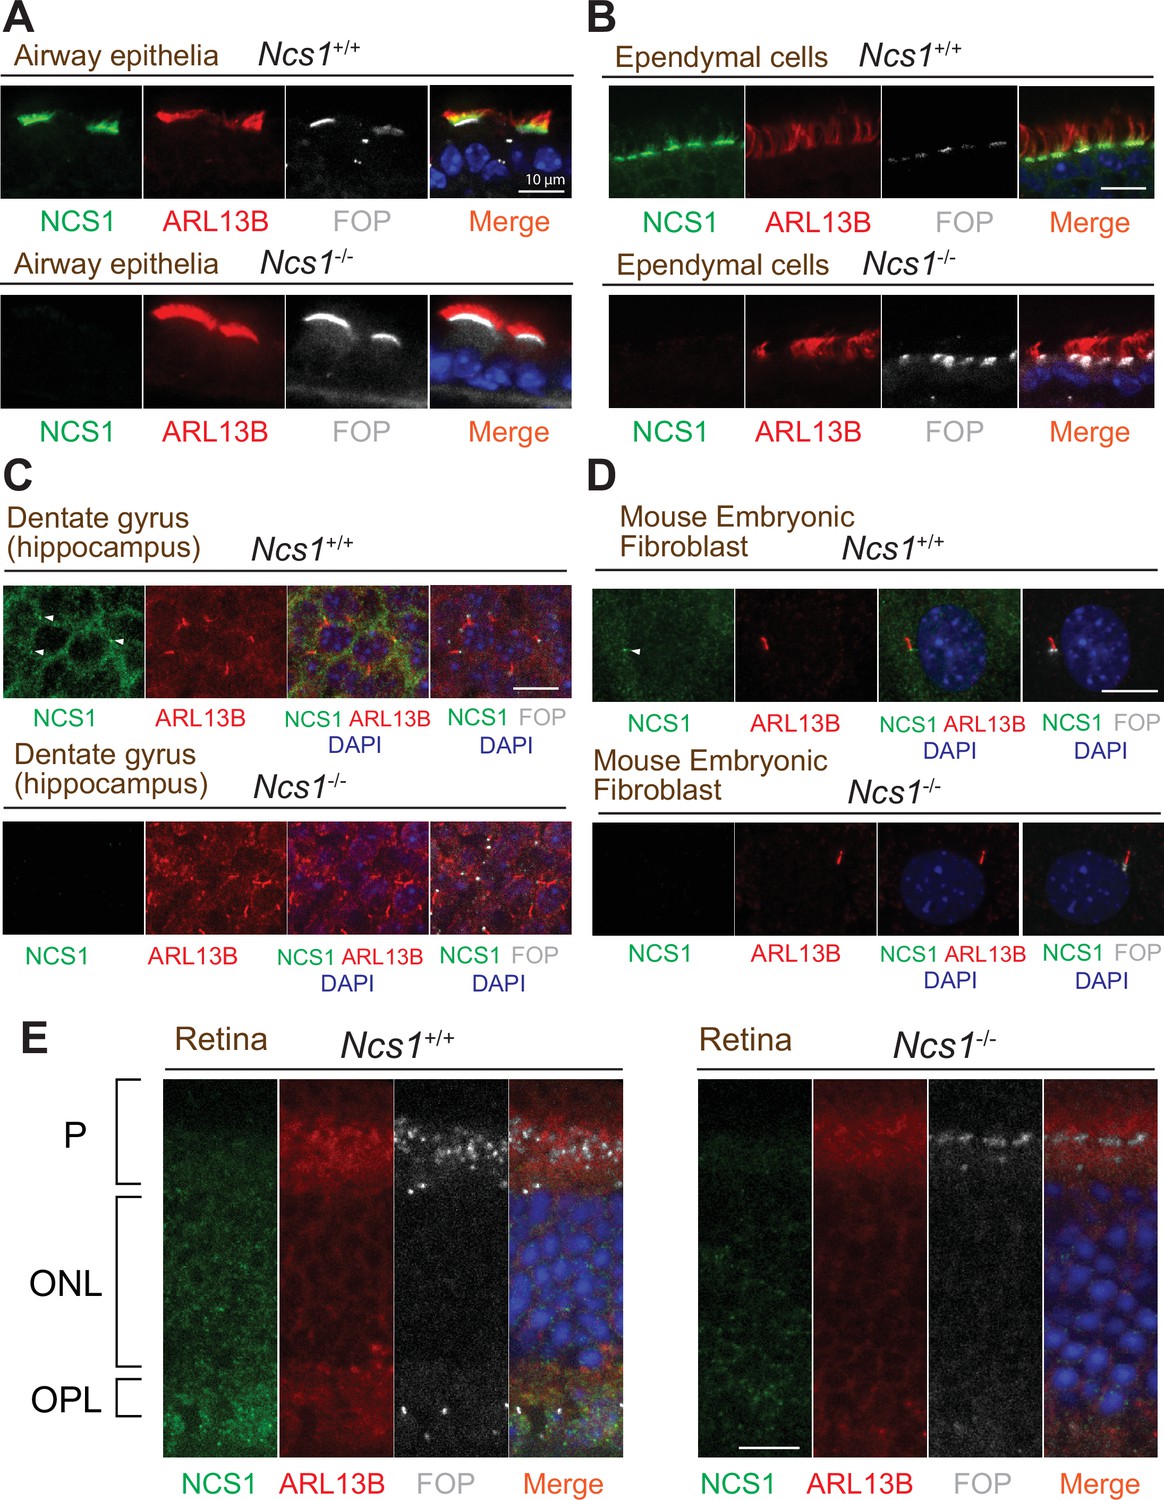
NCS1 localizes to the ciliary base in most ciliated tissues but not in photoreceptor cells.
(A–E) Immunofluorescence images of indicated mouse tissues taken via spinning disk confocal microscopy. Tissue sections prepared from 8-week-old Ncs1+/+ or Ncs1−/− mice with the method described in Materials and methods were stained for indicated markers. Arrowheads indicate NCS1 localization. The individual image is from a representative z-slice. Scale bar: 10 µm. P, photoreceptor cell layer; ONL, outer nuclear layer; OPL, outer plexiform layer.
-
Figure 7—figure supplement 2—source data 1
Immunofluorescence conditions in the experiment shown in Figure 7—figure supplement 2A–E.
- https://cdn.elifesciences.org/articles/85998/elife-85998-fig7-figsupp2-data1-v2.xlsx
Figure 7—figure supplement 3

Localization of ciliary GPCRs is mildly decreased in hippocampal neurons prepared from Ncs1−/− mice.
Box plots showing ciliary signal intensity of SSTR3 (A) or GPR161 (B) in isolated hippocampal neurons prepared from E18.5 Ncs1+/+ or Ncs1−/− mouse embryos. The cells were cultured in vitro for 7 days (DIV7), fixed, and stained with either SSTR3 or GPR161 together with α-ARL13B (to mark cilium) and α-FGFR1OP (to mark centriole), and imaged via wide-field microscopy. Data are averaged from five different neurons per genotype for SSTR3 and three Ncs1+/+ and four Ncs1−/− neurons for GPR161. Statistical significance was calculated from nested t-test. The raw data, experimental conditions, and detailed statistics are available in Figure 7—figure supplement 3—source data 1 and 2.
-
Figure 7—figure supplement 3—source data 1
Immunofluorescence conditions, raw quantification data, and detailed statistics of the experiment shown in Figure 7—figure supplement 3A.
- https://cdn.elifesciences.org/articles/85998/elife-85998-fig7-figsupp3-data1-v2.xlsx
-
Figure 7—figure supplement 3—source data 2
Immunofluorescence conditions, raw quantification data, and detailed statistics of the experiment shown in Figure 7—figure supplement 3B.
- https://cdn.elifesciences.org/articles/85998/elife-85998-fig7-figsupp3-data2-v2.xlsx
Figure 8
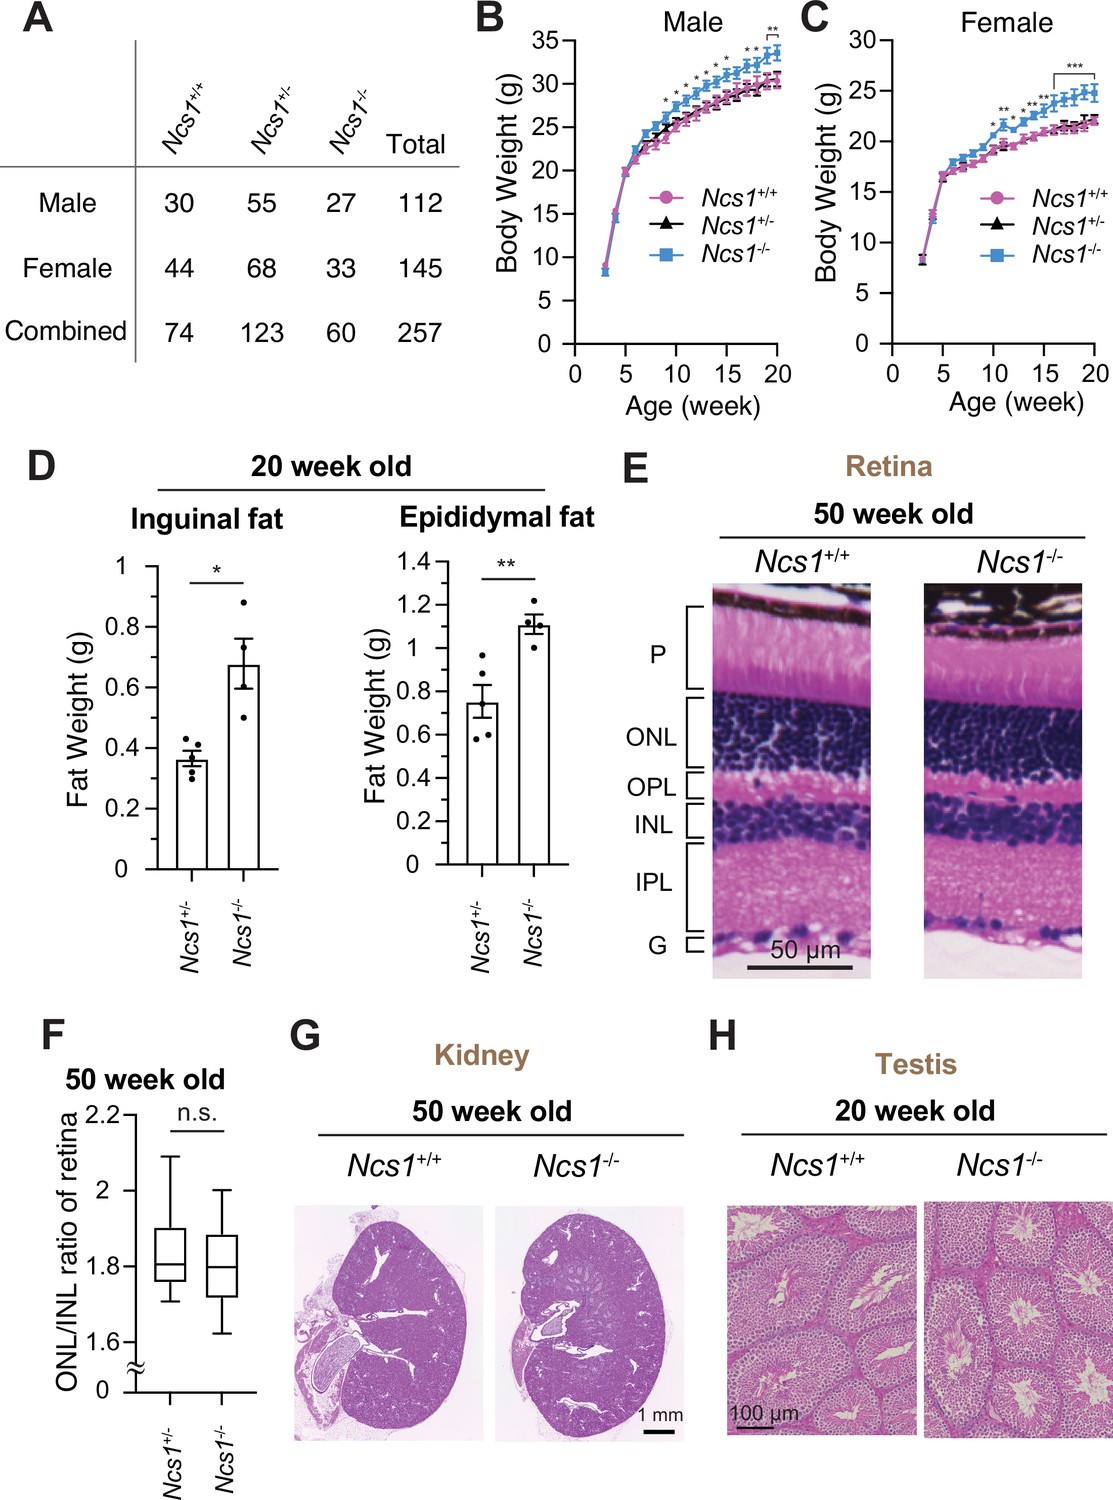
Ncs1 knockout mice display obesity but no other ciliopathy-related phenotypes.
(A) A table showing viability of Ncs1+/+, Ncs1+/−, or Ncs1−/− mice, generated by crossing Ncs1+/− male and female, at P21. Detailed information of the mice and statistics are available in Figure 8—source data 1. Body weight analysis of Ncs1+/+, Ncs1+/−, or Ncs1−/− male (B) and female (C) mice. Raw data and detailed statistics are available from Figure 8—source data 2. (D) Measurements of the weights of inguinal fat (left) or epididymal fat (right) from 20-week-old Ncs1+/+ or Ncs1−/− male mice. Raw data and detailed statistics are available in Figure 8—source data 3. (E) Hematoxylin and eosin (H&E) staining of the retina prepared from 50-week-old Ncs1+/+ or Ncs1−/− female mice. Scale bar: 50 µm. G, ganglion cell layer; IPL, inner plexiform layer; INL, inner nuclear layer; OPL, outer plexiform layer; ONL, outer nuclear layer; P, photoreceptor cell layer. Representative images from five Ncs1+/+ or Ncs1−/− mice are shown. Detailed information of the mice is available in Figure 8—source data 4. (F) Quantification of ONL/INL ration of the retina prepared from 50-week-old Ncs1+/+ or Ncs1−/− mice. 8 areas per mouse and 5 mice from each genotype were analyzed. Statistical significance was calculated from nested t-test. The raw data, detailed information of the mice, and detailed statistics are available in Figure 8—source data 5. H&E staining of the kidney (G) or testis (H) prepared from 50-week-old Ncs1+/+ or Ncs1−/− female mice (G) or 20-week-old Ncs1+/+ or Ncs1−/− male mice (H). Scale bar: 1 mm (G) and 100 µm (H). Representative images from five (G) or three (H) Ncs1+/+ or Ncs1−/− mice are shown. Detailed information of the mice is available in Figure 8—source data 4. n.s., not significant; *p < 0.05, **p < 0.01, ***p < 0.001.
-
Figure 8—source data 1
Detailed information of the mice and detailed statistics of the experiment shown in Figure 8A.
- https://cdn.elifesciences.org/articles/85998/elife-85998-fig8-data1-v2.xlsx
-
Figure 8—source data 2
Raw data and detailed statistics of the experiment shown in Figure 8B, C.
- https://cdn.elifesciences.org/articles/85998/elife-85998-fig8-data2-v2.xlsx
-
Figure 8—source data 3
Raw data and detailed statistics of the experiment shown in Figure 8D.
- https://cdn.elifesciences.org/articles/85998/elife-85998-fig8-data3-v2.xlsx
-
Figure 8—source data 4
Information of the mice used in the experiments shown in Figure 8E, G, H.
- https://cdn.elifesciences.org/articles/85998/elife-85998-fig8-data4-v2.xlsx
-
Figure 8—source data 5
Raw data and detailed statistics of the experiment shown in Figure 8F.
- https://cdn.elifesciences.org/articles/85998/elife-85998-fig8-data5-v2.xlsx
Additional files
-
MDAR checklist
- https://cdn.elifesciences.org/articles/85998/elife-85998-mdarchecklist1-v2.pdf
-
Source data 1
Primers used for genomic PCR and for generating sgRNA vectors.
- https://cdn.elifesciences.org/articles/85998/elife-85998-data1-v2.xlsx
-
Source data 2
The list of mouse embryonic fibroblasts used in this paper.
- https://cdn.elifesciences.org/articles/85998/elife-85998-data2-v2.xlsx
-
Source data 3
The list of hippocampal neurons used in this paper.
- https://cdn.elifesciences.org/articles/85998/elife-85998-data3-v2.xlsx
-
Source data 4
The list of antibodies used in this paper.
- https://cdn.elifesciences.org/articles/85998/elife-85998-data4-v2.xlsx
-
Source data 5
The list of cell lines used in this paper.
- https://cdn.elifesciences.org/articles/85998/elife-85998-data5-v2.xlsx
-
Source data 6
Uncropped images of the immunoblot with label.
- https://cdn.elifesciences.org/articles/85998/elife-85998-data6-v2.pdf
-
Source data 7
Summary of CRISPR knockout cells.
- https://cdn.elifesciences.org/articles/85998/elife-85998-data7-v2.xlsx
Download links
A two-part list of links to download the article, or parts of the article, in various formats.
Downloads (link to download the article as PDF)
Open citations (links to open the citations from this article in various online reference manager services)
Cite this article (links to download the citations from this article in formats compatible with various reference manager tools)
Myristoylated Neuronal Calcium Sensor-1 captures the preciliary vesicle at distal appendages
eLife 14:e85998.
https://doi.org/10.7554/eLife.85998


