Sexual dimorphism in obesity is governed by RELMα regulation of adipose macrophages and eosinophils
- Division of Biomedical Sciences, School of Medicine, University of California Riverside, United States
- Graduate Program in Genetics, Genomics and Bioinformatics, University of California Riverside, United States
Figures
Figure 1 with 1 supplement
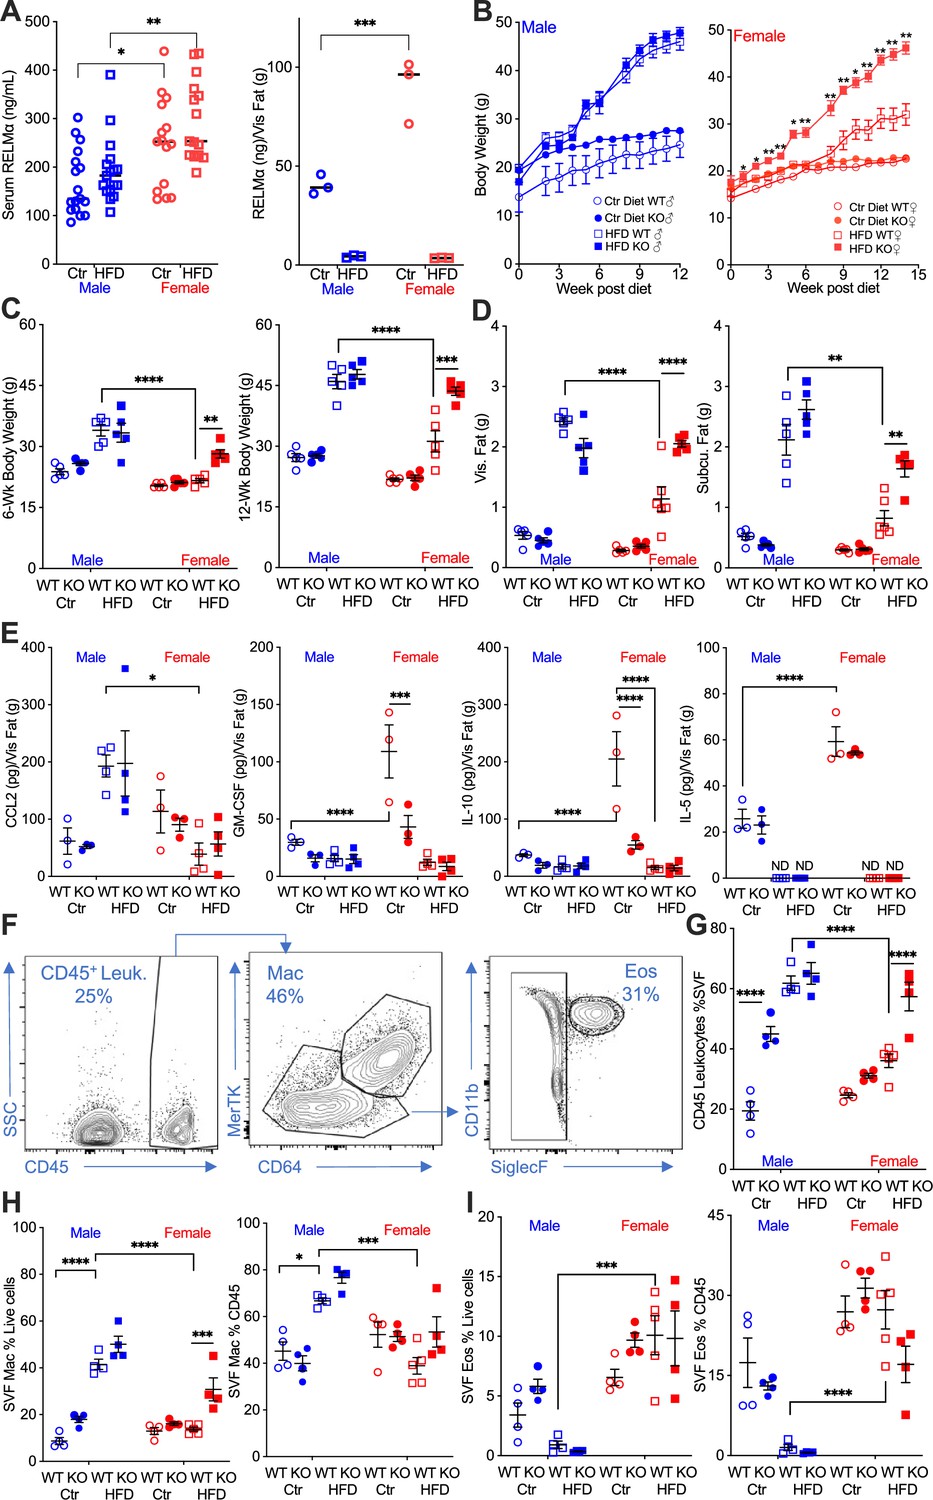
RELMα protects females from diet-induced obesity.
(A) RELMα levels in serum and visceral adipose tissue from 18-week-old male (♂) and female (♀) C57BL/6 mice after exposure to control (Ctr) or high-fat diet (HFD) for 12 weeks. (B) Wild-type (WT) or RELMα knockout (KO) mice were weighed for 12–15 weeks of diet exposure. After 6- and 12-week diet exposure (C), whole body, visceral and subcutaneous fat pad weights were recorded (D). (E) CCL2, Granulocyte-macrophage colony-stimulating factor (GM-CSF), IL10, and IL5 levels in protein extracts from visceral fat pad after 12-week diet exposure. (F) Gating strategy for flow cytometric analysis of the visceral adipose stromal vascular fraction (SVF). Proportion in the SVF of CD45+ leukocytes (G), CD45+CD64+Mertk+ macrophages (H), and CD45+SiglecF+CD11b+ eosinophils (I). Males (blue), females (red), WT (open symbols), RELMα KO (filled symbols), control diet (Ctr, circles), HFD (squares); data for (B) are presented as mean ± standard error of the mean (SEM), data for (H) are representative of one animal, all other data are presented as individual points for each animal, where lines represent group means ± SEM. Statistical significance between HFD WT females and HFD RELMα KO females was determined by two- or three-way analysis of variance (ANOVA) with Sidak’s multiple comparisons tests (ND, not detected; *p < 0.05; **p < 0.01; ***p < 0.001; ****p < 0.0001 are indicated for functionally relevant comparisons). Data are representative of 3 experiments with 4–6 mice per group.
Figure 1—figure supplement 1
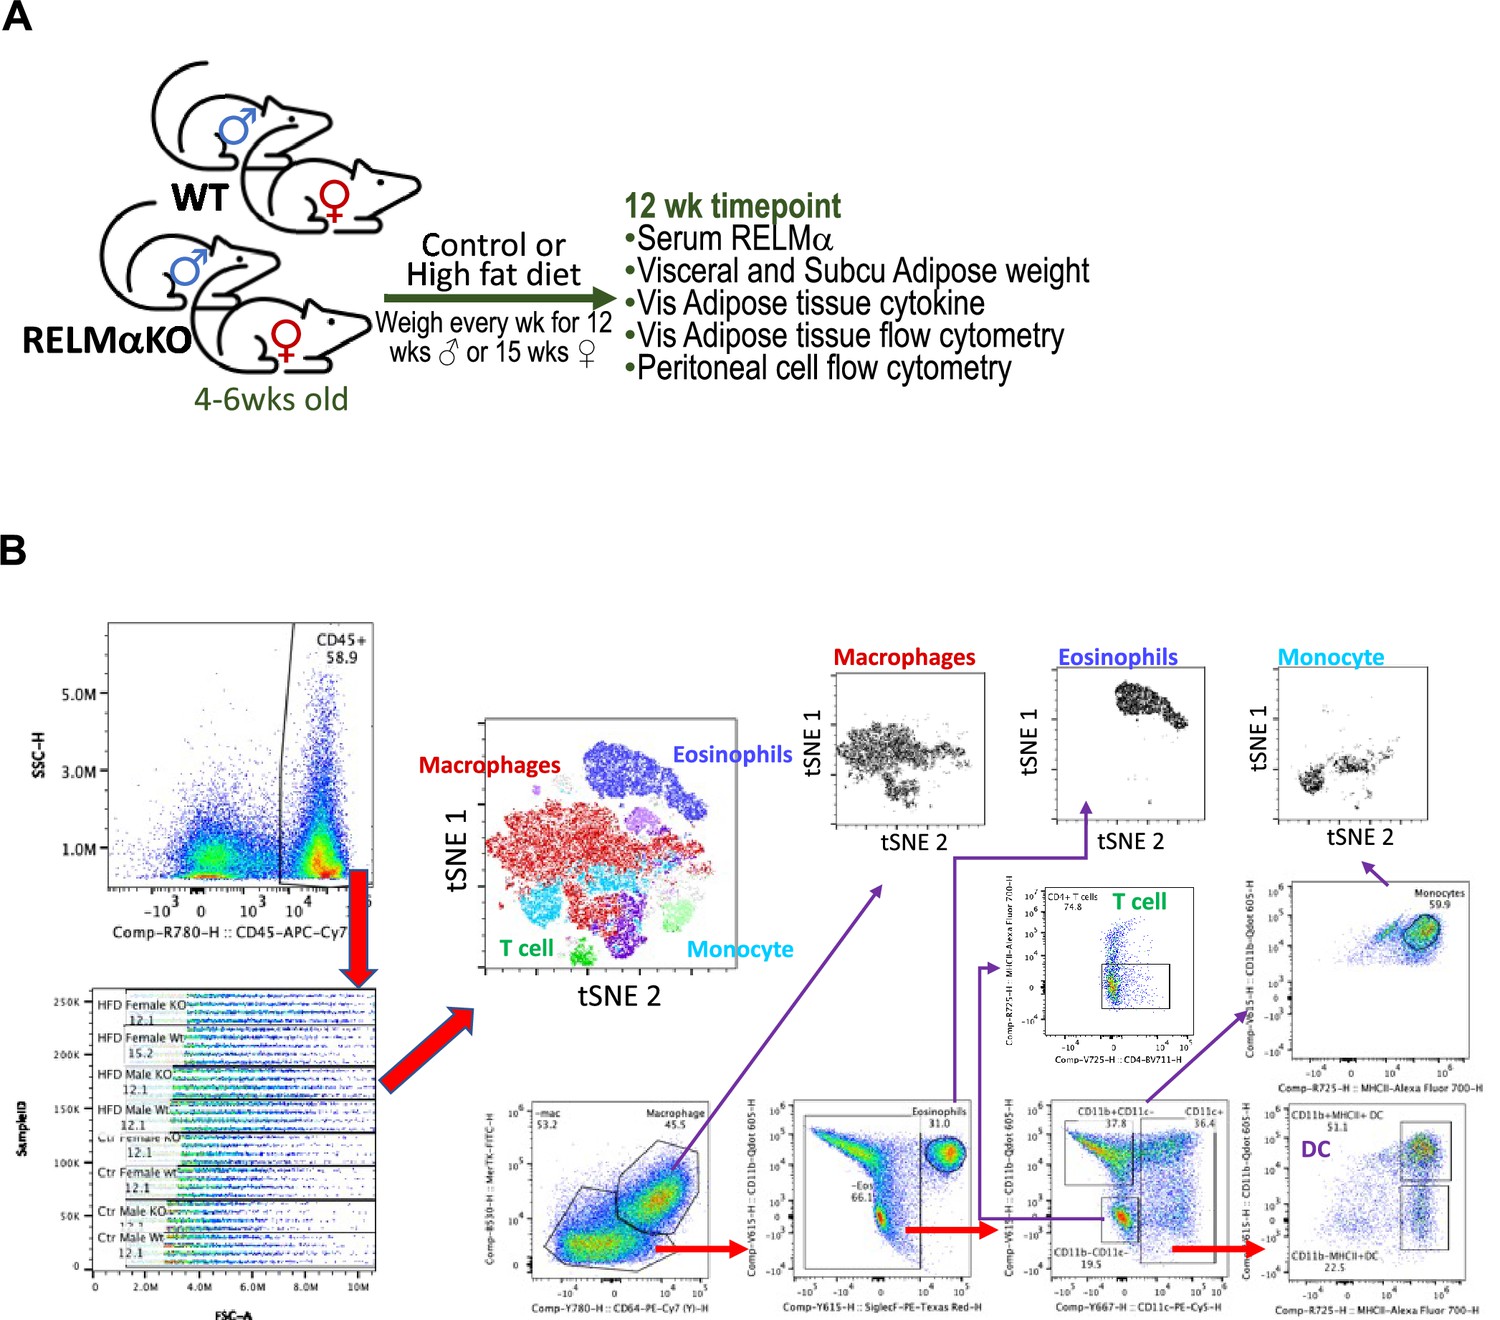
Experimental model figure and flow cytometry gating strategy.
(A) Model figure overviewing experimental design and important timepoints for this study. (B) Representative flow cytometry plots of adipose immune cells from the stromal vascular fraction of visceral adipose tissue detailing gating strategy and subsequent t-stochastic neighbor embedding (tSNE) analysis.
Figure 2 with 1 supplement
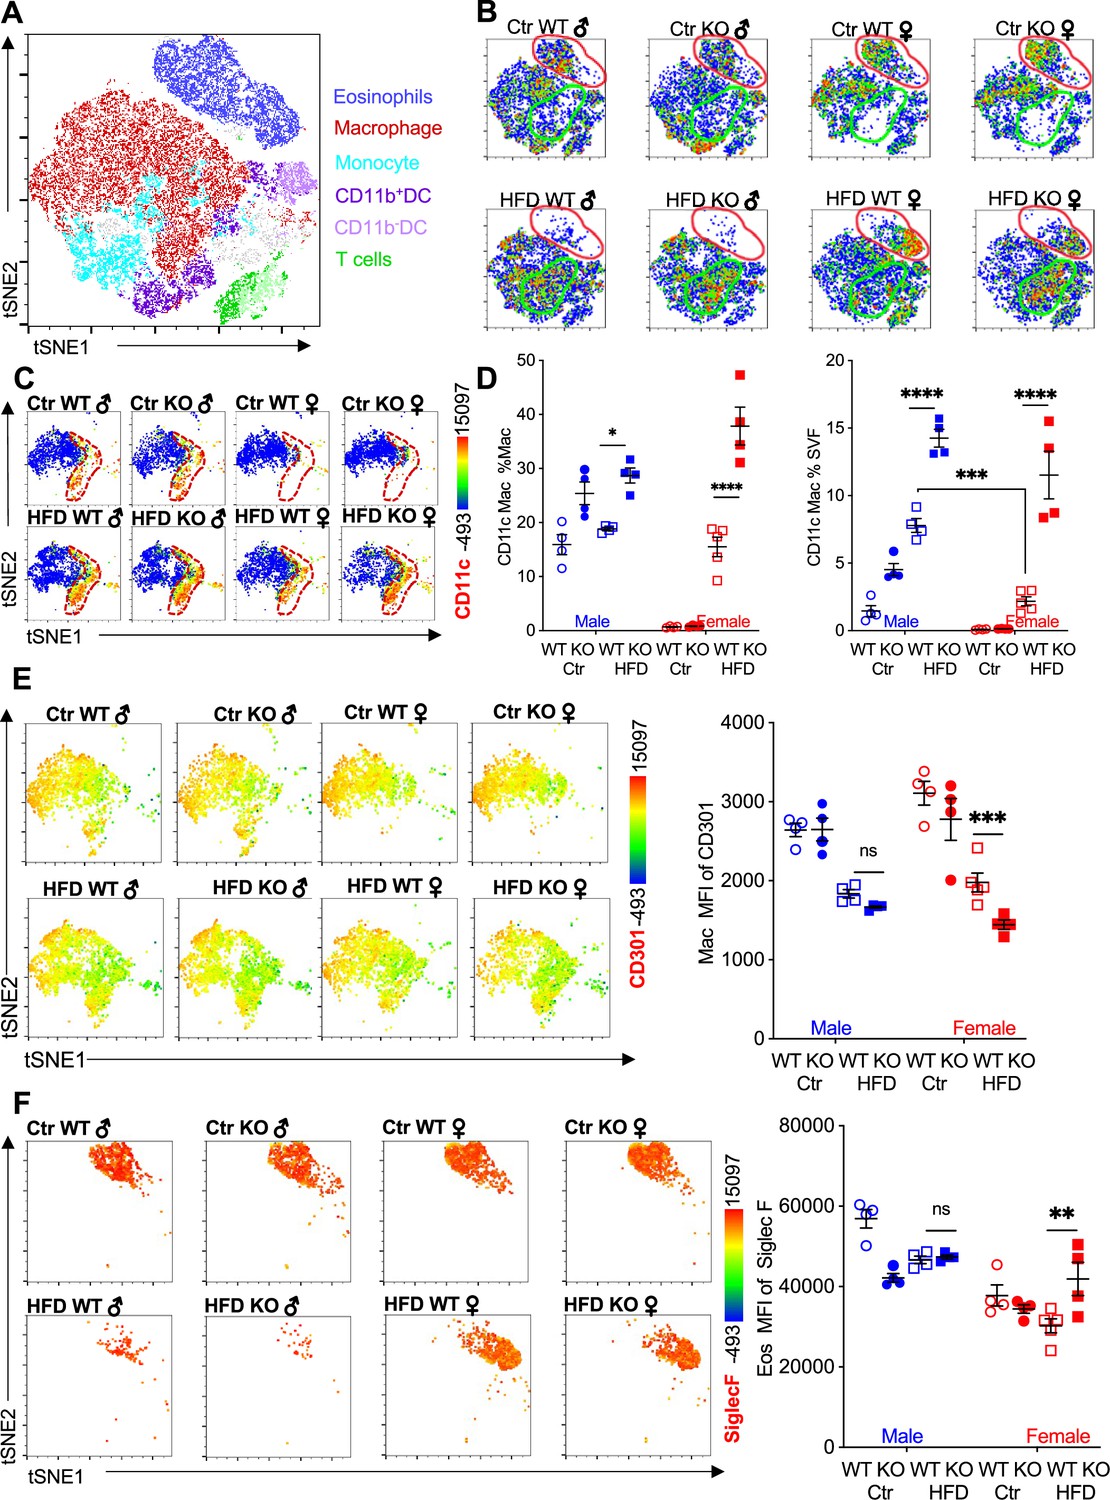
Adipose eosinophil and macrophage populations are influenced by sex, diet, and RELMα.
(A) t-Stochastic neighbor embedding (tSNE) analysis to identify stromal vascular fraction (SVF) leukocyte populations. (B) tSNE analyses of SVF from the different groups (male ♂, female ♀, wild-type [WT], or RELMα knockout [KO]) after 12 weeks of diet exposure (Ctr or high-fat diet [HFD]) revealed changes in eosinophil RELMα-dependent and diet-induced changes in eosinophil (red outline) and macrophage (green outline) subsets. (C, D) CD11c surface expression in CD45+MerTK+CD64+ macrophages was analyzed by tSNE, where dashed red outline shows CD11cHi cells, and quantified. (E) CD301b surface expression on SVF macrophages was examined by tSNE and quantified by mean fluorescent intensity (MFI). (F) Siglec-F surface expression on CD45+SiglecF+CD11b+ SVF eosinophils was examined by tSNE and quantified by mean fluorescent intensity (MFI). tSNE data are one representative animal per group. All other data are presented as individual points for each animal, where lines represent group means ± standard error of the mean (SEM). Statistical significance was determined by three-way analysis of variance (ANOVA) Sidak’s with multiple comparisons test (ns, no significant; *p < 0.05; **p < 0.01; ***p < 0.001; ****p < 0.0001). Data are representative of 3 experiments with 4–6 mice per group.
Figure 2—figure supplement 1
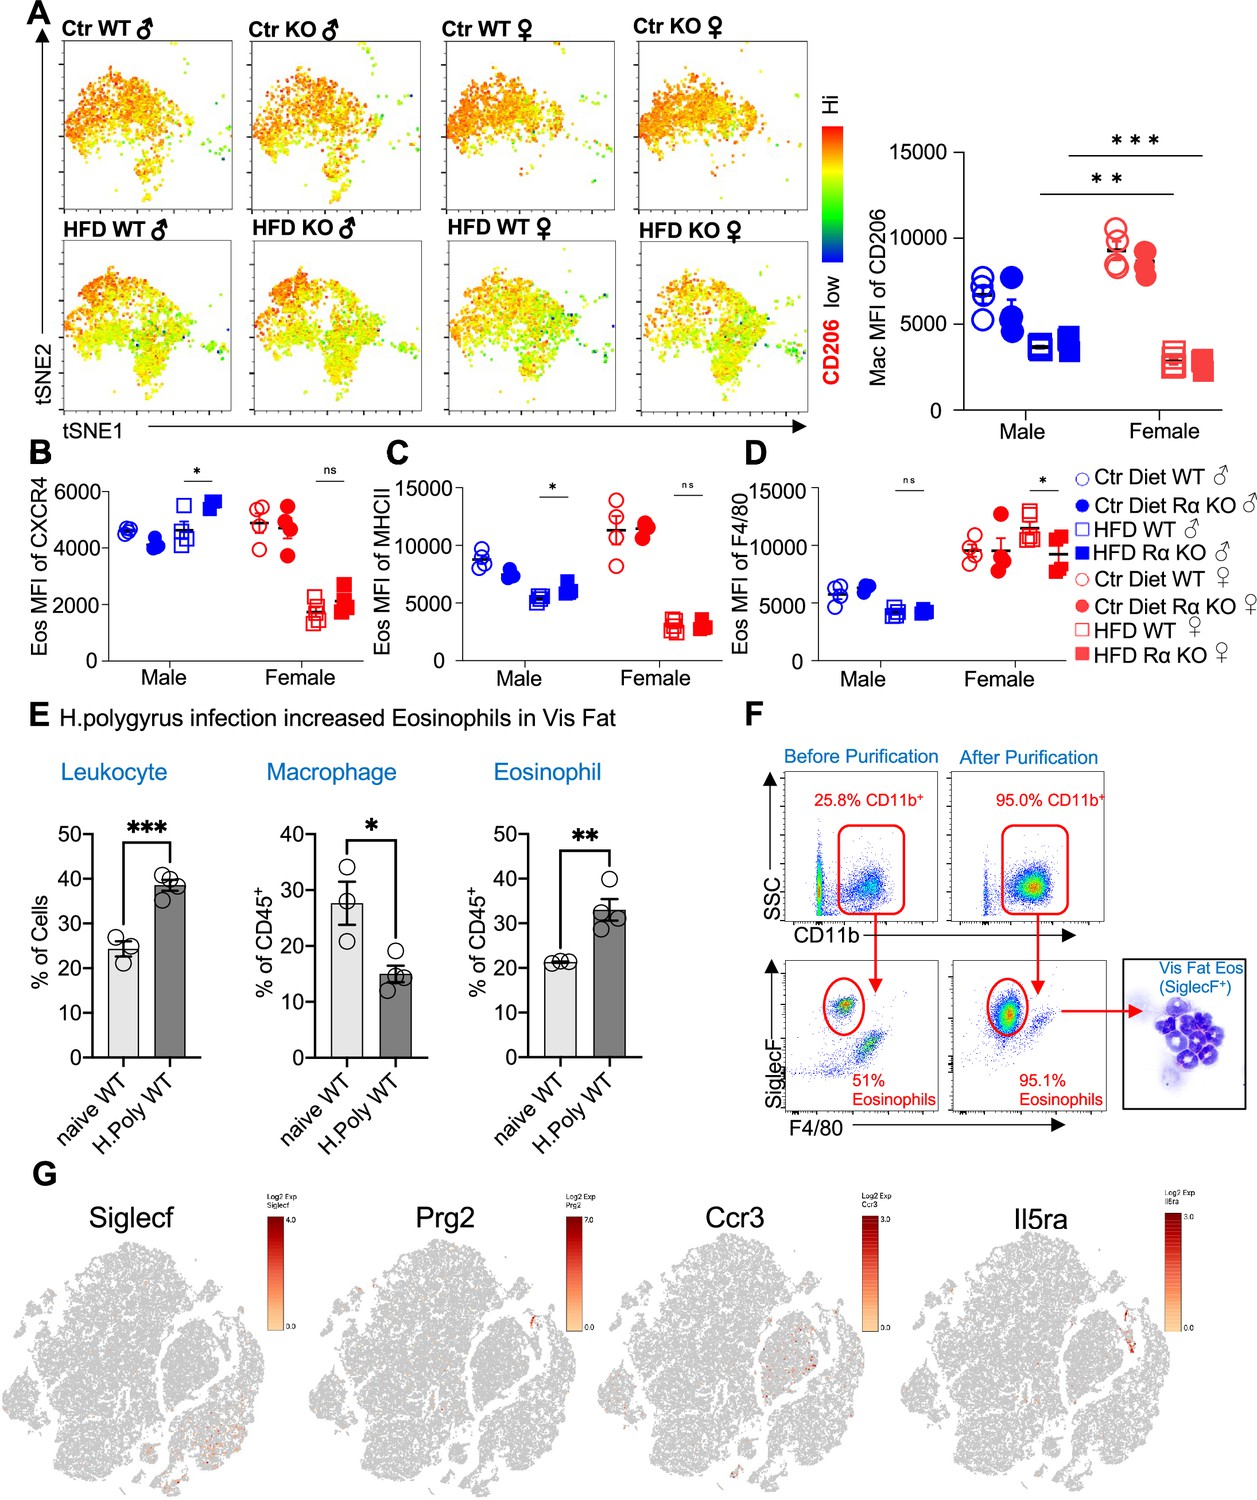
Flow cytometric analysis of adipose immune cells.
Flow cytometry analysis of the visceral adipose stromal vascular fraction of 12-week diet exposed mice for CD206 surface expression on CD45+CD64+Mertk+ macrophages by t-stochastic neighbor embedding (tSNE) plot and mean fluorescent intensity (MFI) (A) and surface expression by CD45+SiglecF+CD11b+ eosinophils of CXCR4 (B), MHCII (C), and F4/80 (D). Leukocytes from naïve or H. polyrus-infected mice were quantified (E), and eosinophils were column purified and analyzed for purity by flow and cytocentrifuge (F). (G) Feature plots of Log2 fold expression of eosinophil markers (SiglecF, Prg2, Ccr3, and Il5ra) in all clusters of single-cell RNA-sequencing (scRNA-seq) data. Statistical significance was determined by unpaired t-test (*p < 0.05; **p < 0.01). tSNE plot analysis and flow plots are representative of one animal per group, all other data are presented as individual points for each animal, where lines represent group means ± standard error of the mean (SEM). Statistical significance for (A–D) was determined by two-way analysis of variance (ANOVA) with Sidak’s multiple comparisons test (ns, no significant; *p < 0.05; **p < 0.01; ***p < 0.001) and by unpaired t-test for (E). Data are representative of two experiments with 3–6 mice per group.
Figure 3
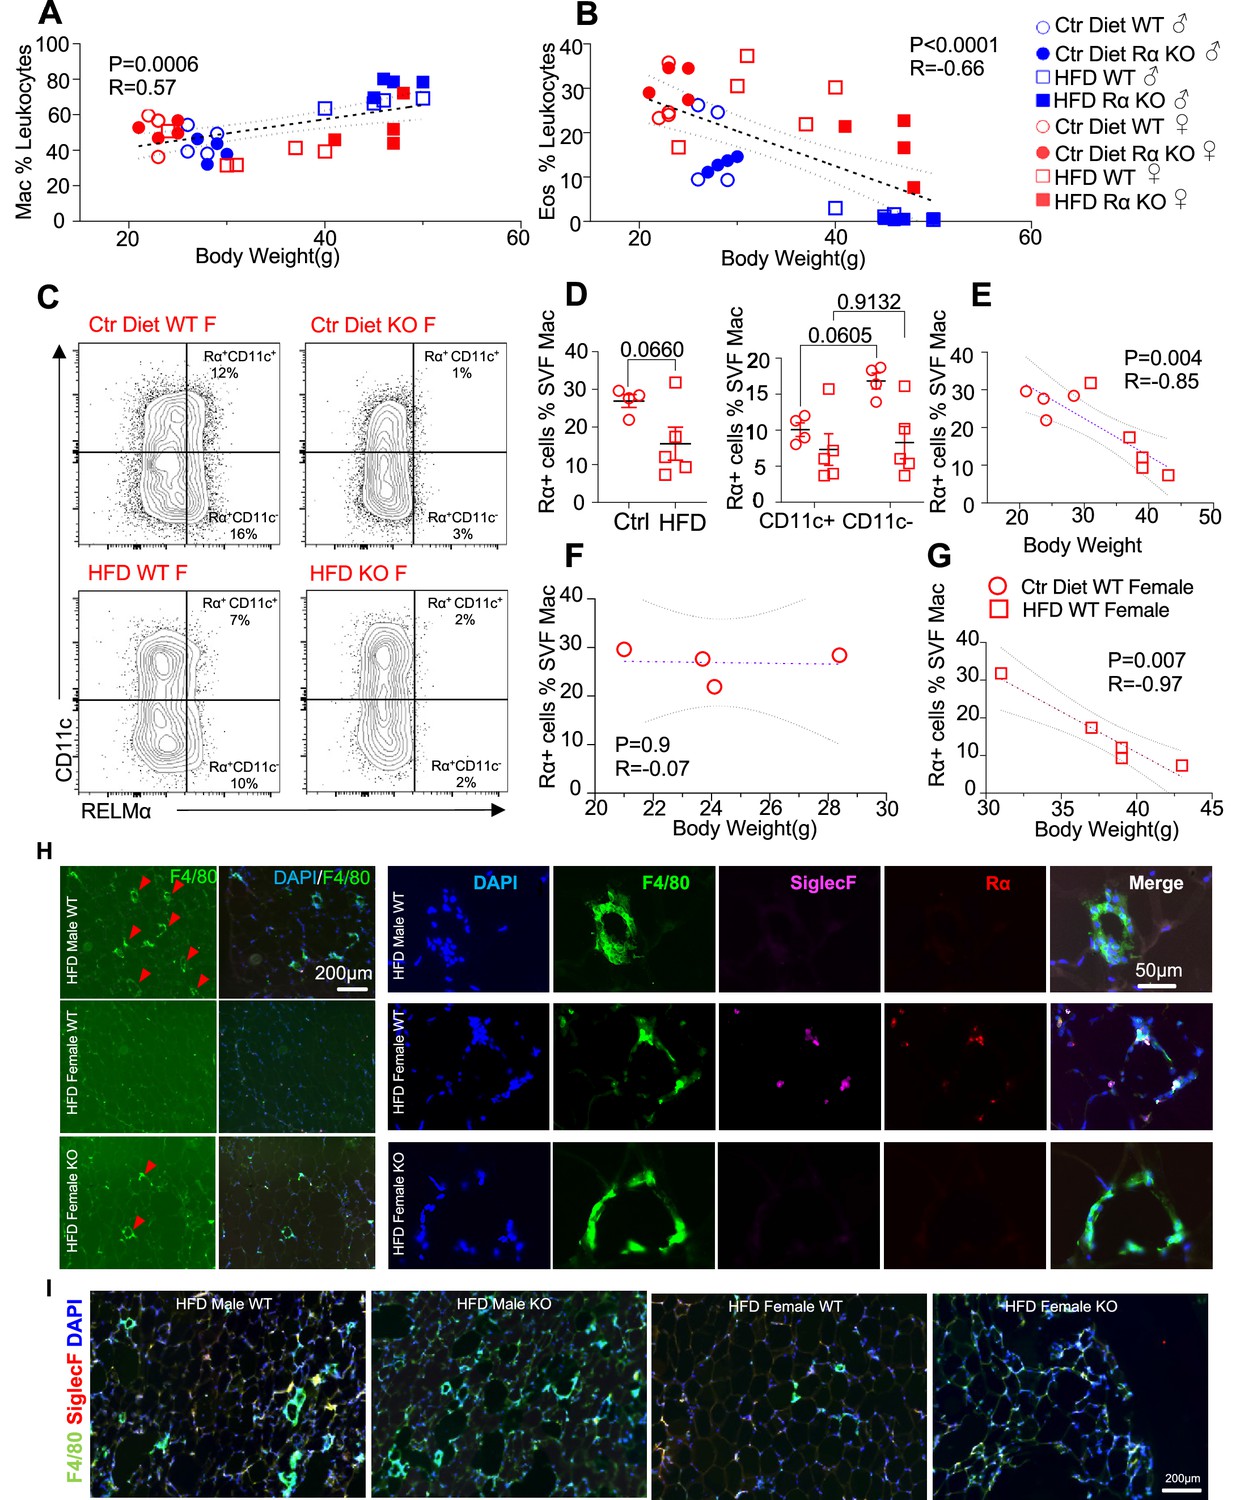
High-fat diet (HFD)-induced obesity is correlated with RELMα levels, eosinophils, and macrophages.
Pearson correlation analysis of adipose stromal vascular fraction (SVF) macrophage (A) or eosinophil (B) frequency against body weight of mice from all groups. (C) Representative flow plots of RELMα intracellular staining against CD11c surface staining of SVF Mac from wild-type (WT) and knockout (KO) ♀ mice. (D) Frequency of RELMα+ SVF Mac in Ctr and HFD WT ♀ (left) or CD11c+ and CD11c− Mac (right). (E–G) Pearson correlation analysis of RELMα+ cells against body weight of Ctr or HFD WT ♀ mice. (H) Immunofluorescent staining for F4/80 (green), SiglecF (magenta), RELMα (red), and DAPI, or 4′,6-diamidino-2-phenylindole (blue) was counterstained on visceral fat tissue sections (bar, 200 μM; red arrows indicate F4/80+ cells). (I) IF staining was performed for F4/80 (green), SiglecF (red), and DAPI (blue) for all groups. Flow plots (C) and IF images (H, I) are one representative animal per group. All other data are presented as individual points for each animal, where lines represent group means ± standard error of the mean (SEM). Statistical significance was determined by unpaired t-test (D), or Pearson correlation analysis for other data and p values are provided. Data are representative of 2 experiments with 4–6 mice per group.
Figure 4
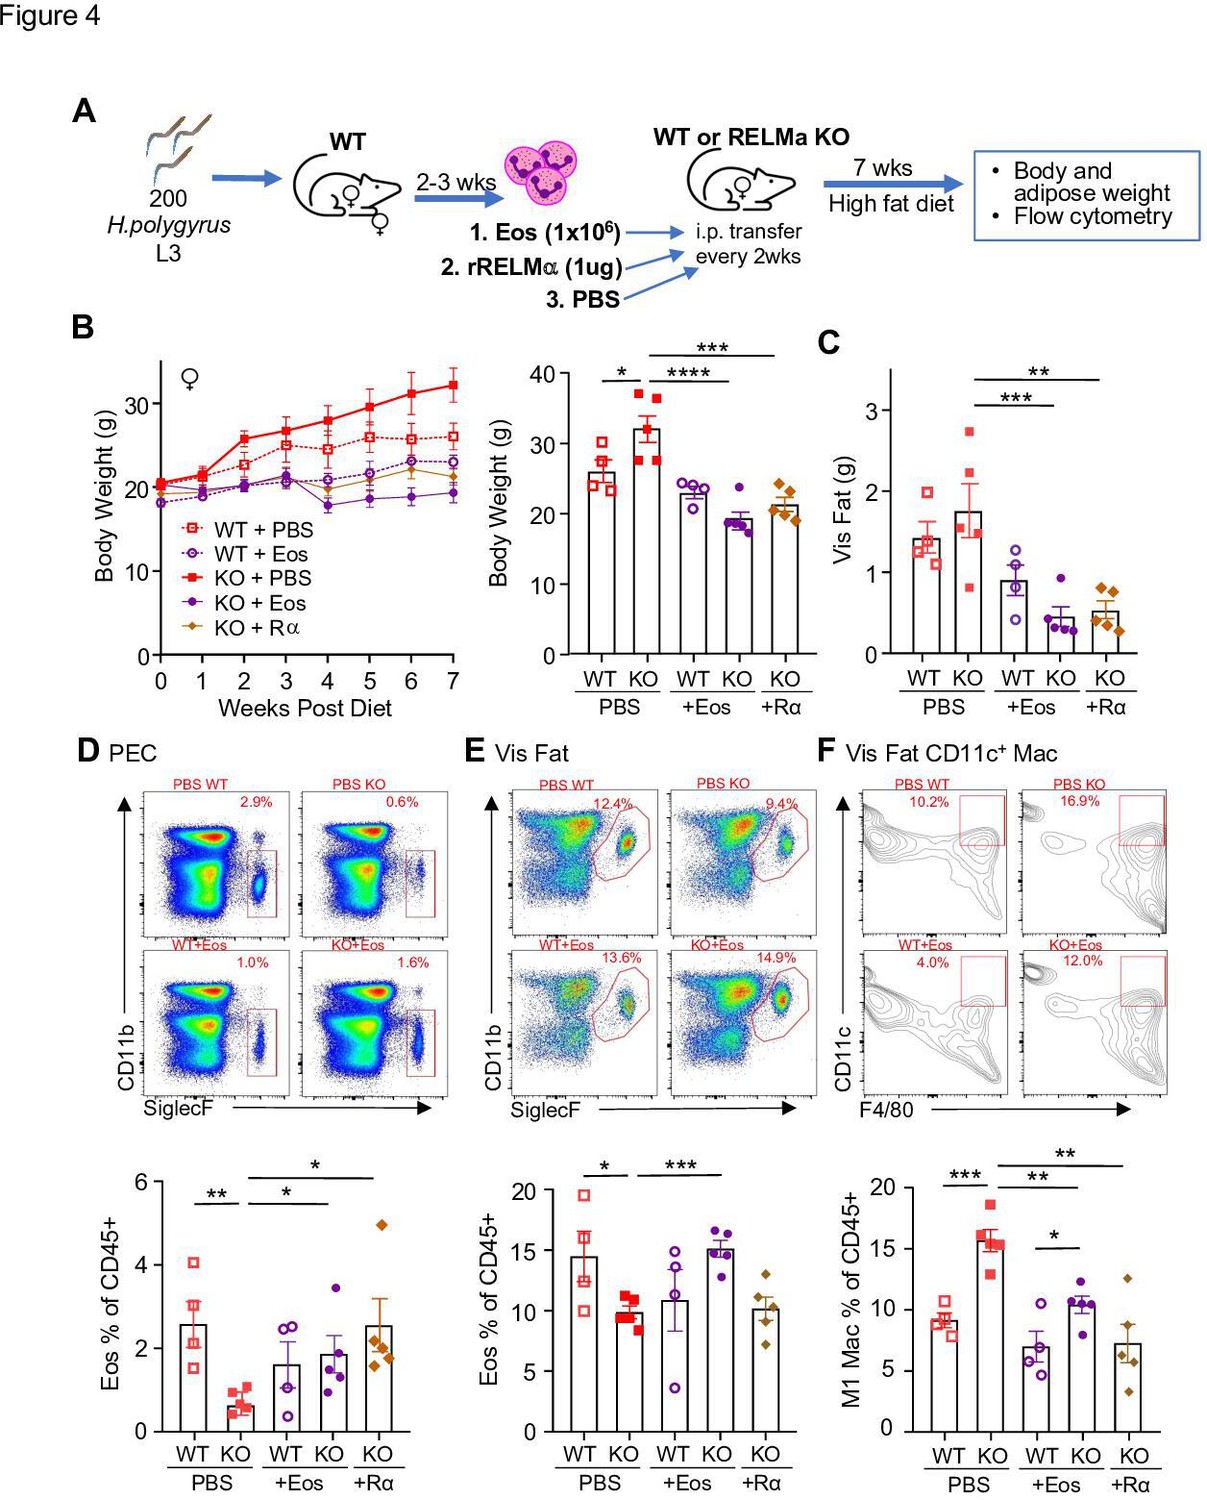
RELMα and eosinophils protect against diet-induced obesity.
Wild-type (WT) or RELMα knockout (KO) female (♀) mice were exposed to high-fat diet (HFD) for 7 weeks, during which they were intraperitoneally injected every 2 weeks with phosphate-buffered saline (PBS), RELMα (2 μg) or SiglecF+ eosinophils (1 × 10⁶) recovered from helminth-infected WT ♀ mice (A). (B) Body weight was recorded every week. Mice were sacrificed at 7 weeks post diet, and body and visceral fat weight (C) were recorded. Flow cytometric analysis and quantification of eosinophils from the peritoneal exudate cells (PEC) (D), visceral fat stromal vascular fraction (SVF) (E), and quantification of the % of CD11c+ Macs in the visceral fat SVF (F). Data for (B) are presented as mean ± standard error of the mean (SEM), flow plots for (D–F) are representative of one animal per group, all other data are presented as individual points for each animal, where lines represent group means ± SEM. Statistical significance was determined by one-way analysis of variance (ANOVA) with Sidak’s multiple comparisons test (ns, no significant; *p < 0.05; **p < 0.01; ***p < 0.001; ****p < 0.0001). Data are representative of 2 experiments with 4–6 mice per group.
Figure 5 with 2 supplements
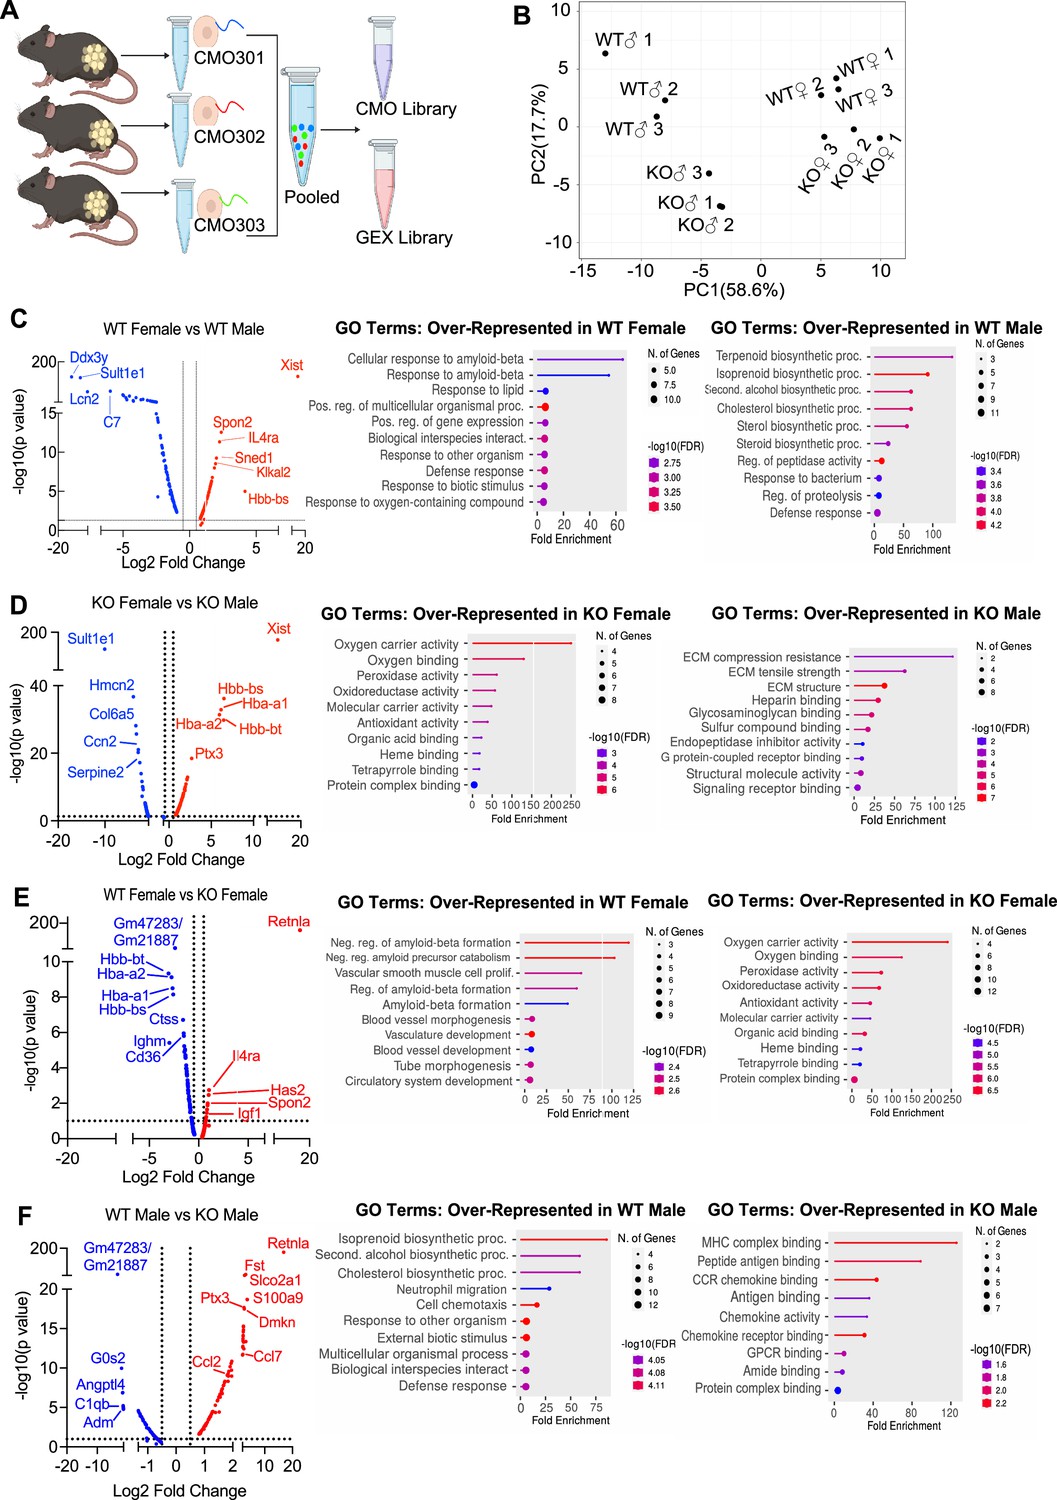
Single-cell RNA-sequencing (scRNA-seq) of adipose stromal vascular fraction reveals genes associated with protection from diet-induced obesity.
Wild-type (WT) or RELMα knockout (KO) male (♂) or female (♀) mice were exposed to high-fat diet (HFD) for 6 weeks, following which cells from the adipose stromal vascular fraction were recovered for single-cell sequencing. (A) Schematic protocol of scRNA-seq cell multiplexing oligo (CMO) labeling and library preparation workflow. (B) Principal component analysis (PCA) assay of individual mice. Volcano plot comparing the top 100 differentially expressed genes (DEGs) in all clusters between: WT females and WT males (C), KO females and KO males (D), WT females and KO females (E), and WT males and KO males (F). The most significant genes (−log10(p-value) >1, Log2 fold change >0.5) are indicated. Gene ontology (GO) terms indicating enriched pathways for the top 30 upregulated genes are plotted as histograms. Data are from 1 experiment with 3 mice per group.
Figure 5—figure supplement 1
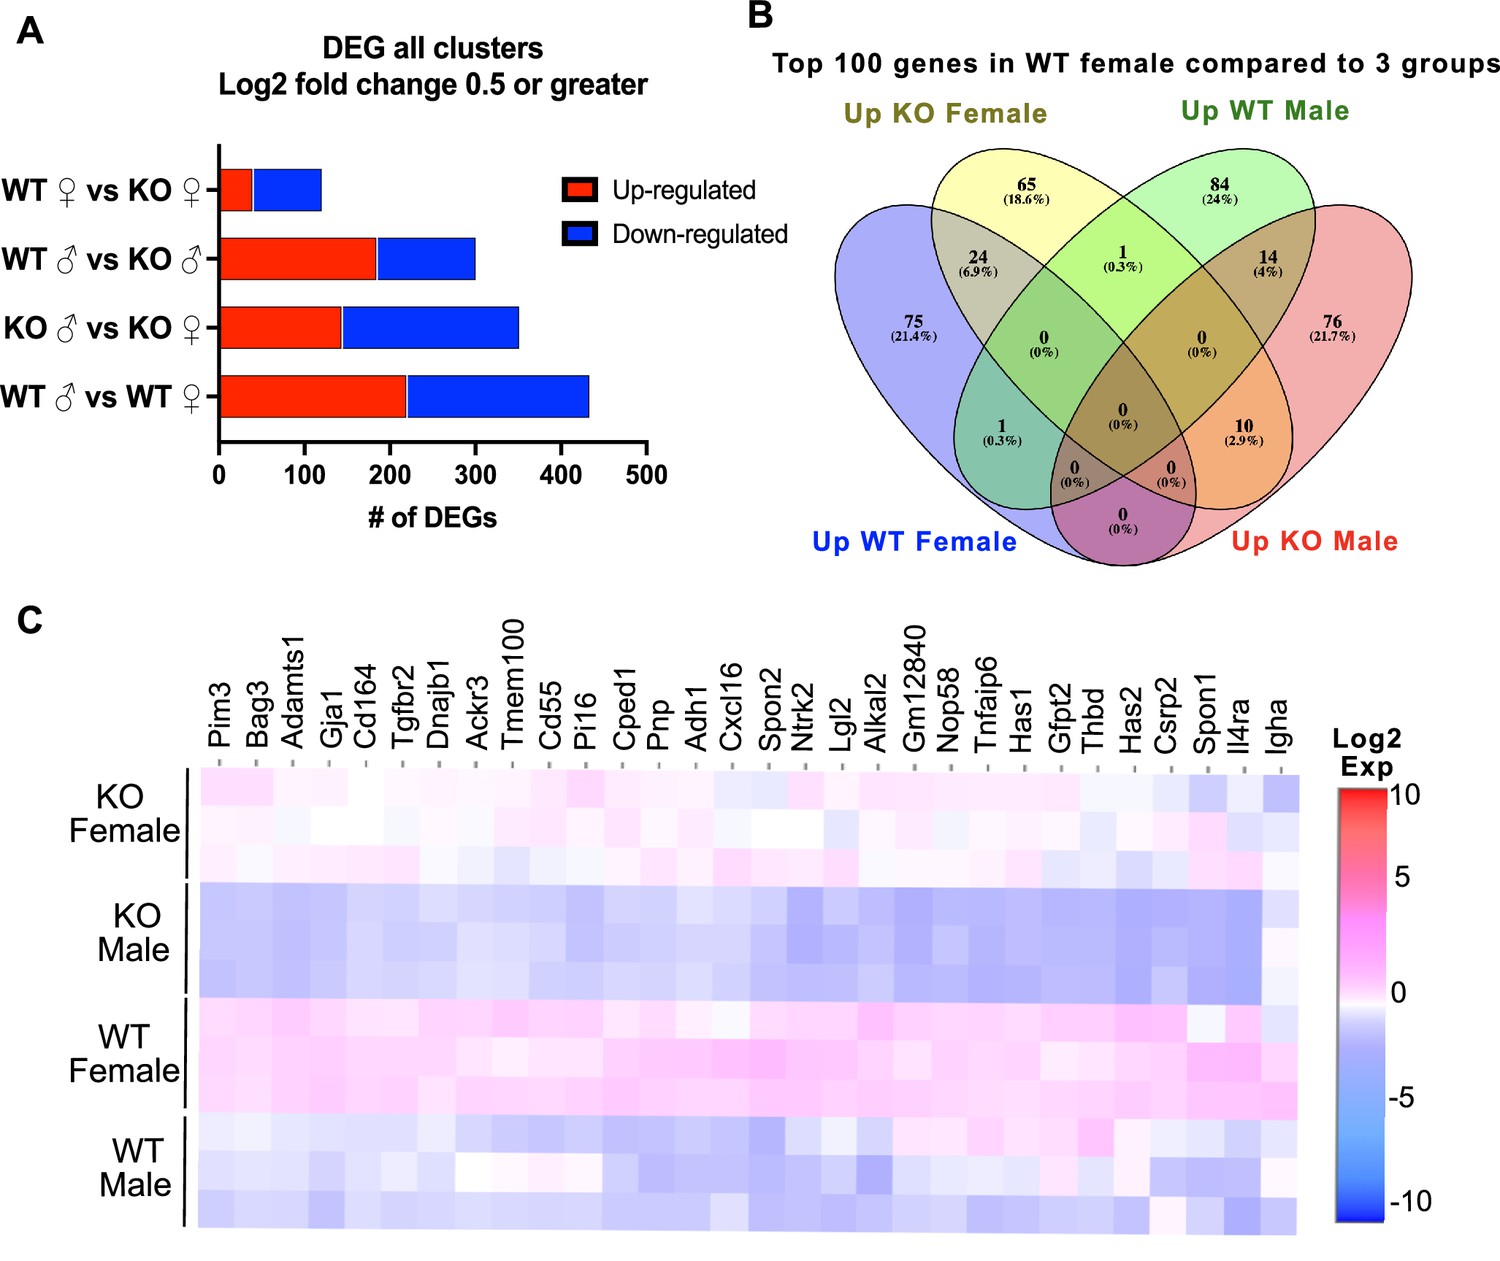
Single-cell RNA-sequencing (scRNA-seq) of adipose stromal vascular fraction reveals differential gene expression between all four groups in all clusters.
(A) Histogram of differentially expressed gene (DEG) analysis with Log2 fold change of 0.5 or greater from all clusters comparing sex and genotype. (B) Venn diagram of the Top 100 genes in all clusters comparing WT female to KO female, WT male, and KO male. (C) Heatmap of top 30 DEGs in WT female compared to all other groups in all clusters.
Figure 5—figure supplement 2
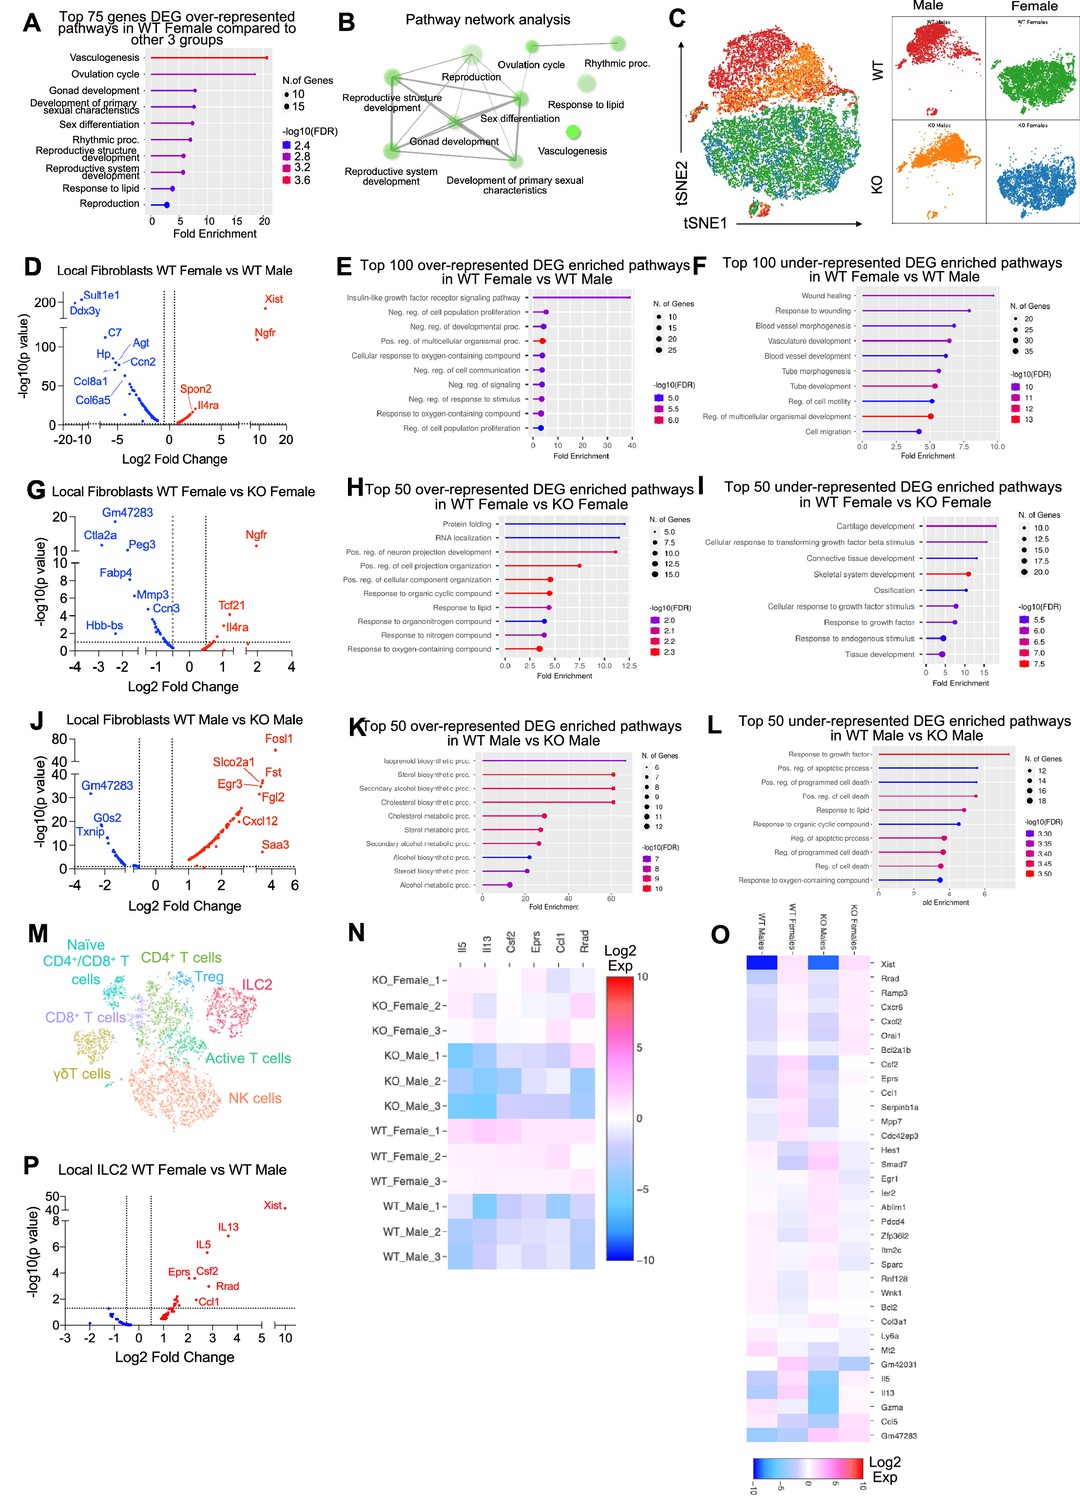
Differentially expressed genes (DEGs) in fibroblast and innate lymphoid cell (ILC)-2 cell populations from single-cell RNA-sequencing (scRNA-seq) analysis.
(A) Gene ontology (GO) pathways of the top 75 genes that were upregulated in WT females vs. other three group in all clusters. (B) Pathway network analysis of the top 75 genes upregulated in WT females vs. other three groups. (C) Population shift in fibroblasts between WT female, WT male, KO female, and KO male. (D–L) DEGs in fibroblast population between WT female vs. WT male, WT female vs. KO female, WT male vs. KO male as associated GO terms for top DEG. (M–P) ILC2 cell clusters and DEG between WT females and WT males. Heatmaps indicate DEGs between WT female, WT male, KO female, and KO males.
Figure 6 with 2 supplements
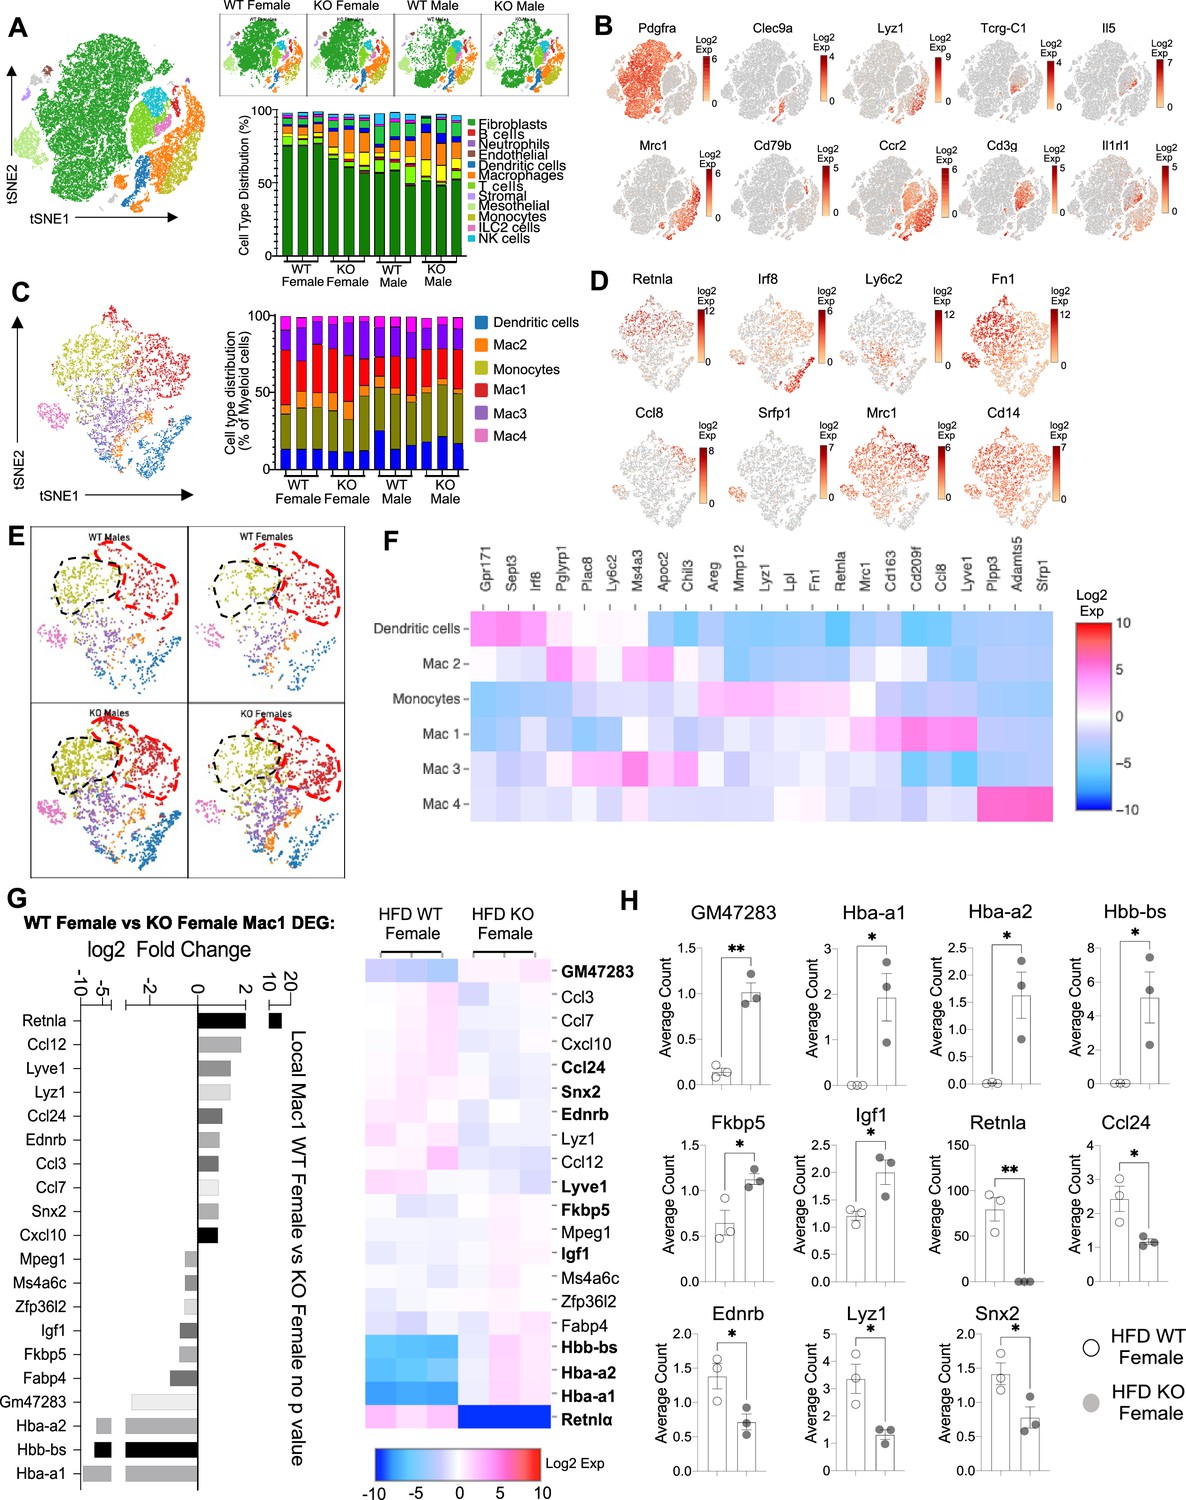
Sex-specific and RELMα-dependent gene expression changes in the stromal vascular fraction (SVF) myeloid subsets in response to high-fat diet (HFD).
(A) t-Stochastic neighbor embedding (tSNE) plot showing cell populations from SVF from all four groups of mice fed HFD for 6 weeks, with a histogram plotting cell-type distribution per animal per group in all clusters. (B) Log2 fold change of candidate marker genes for each cell population across all clusters. (C) tSNE plot of re-clustered myeloid cell populations with a histogram plotting cell-type distribution per animal per group. (D) Log2 fold change of candidate marker genes across myeloid cell populations. (E) tSNE plot highlighting population changes in Monocyte (green) and Mac1 (red) clusters between WT male, WT female, KO male, and KO female in myeloid cells. (F) Heatmap of the top differentially expressed gene (DEG) that defines each Mac subset. (G) WT female vs. KO female top DEG in Mac1 cluster. (H) Histograms of the average UMI count change of select candidate genes between WT female and KO female in Mac1 cluster. Data in (H) are presented as individual points for each animal, where lines represent group means ± standard error of the mean (SEM). Statistical significance was determined by unpaired t-test (*p < 0.05; **p < 0.01). Data are from 1 experiment with 3 mice per group.
Figure 6—figure supplement 1
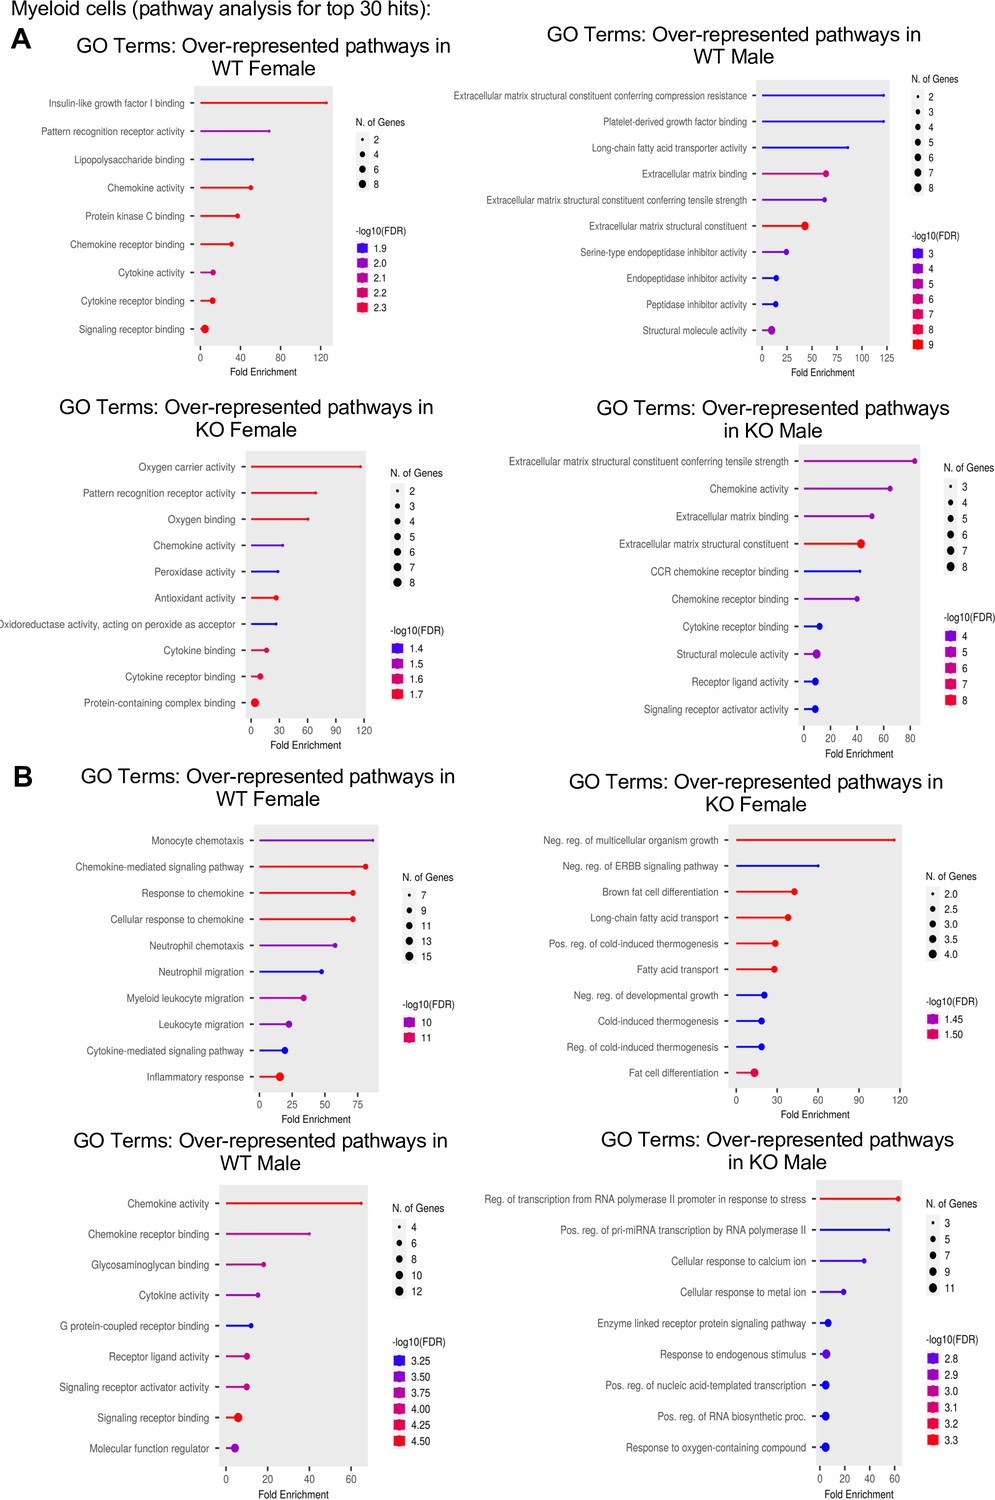
Gene ontology (GO) pathway analysis for the top 30 hits in myeloid cell subsets.
(A) GO pathway analyses comparing the top 30 genes between WT female vs. WT male, and KO female vs. KO male in myeloid cell subsets. (B) GO comparing the top 30 genes between WT female vs. KO female and WT male vs. KO male in myeloid cell subsets.
Figure 6—figure supplement 2
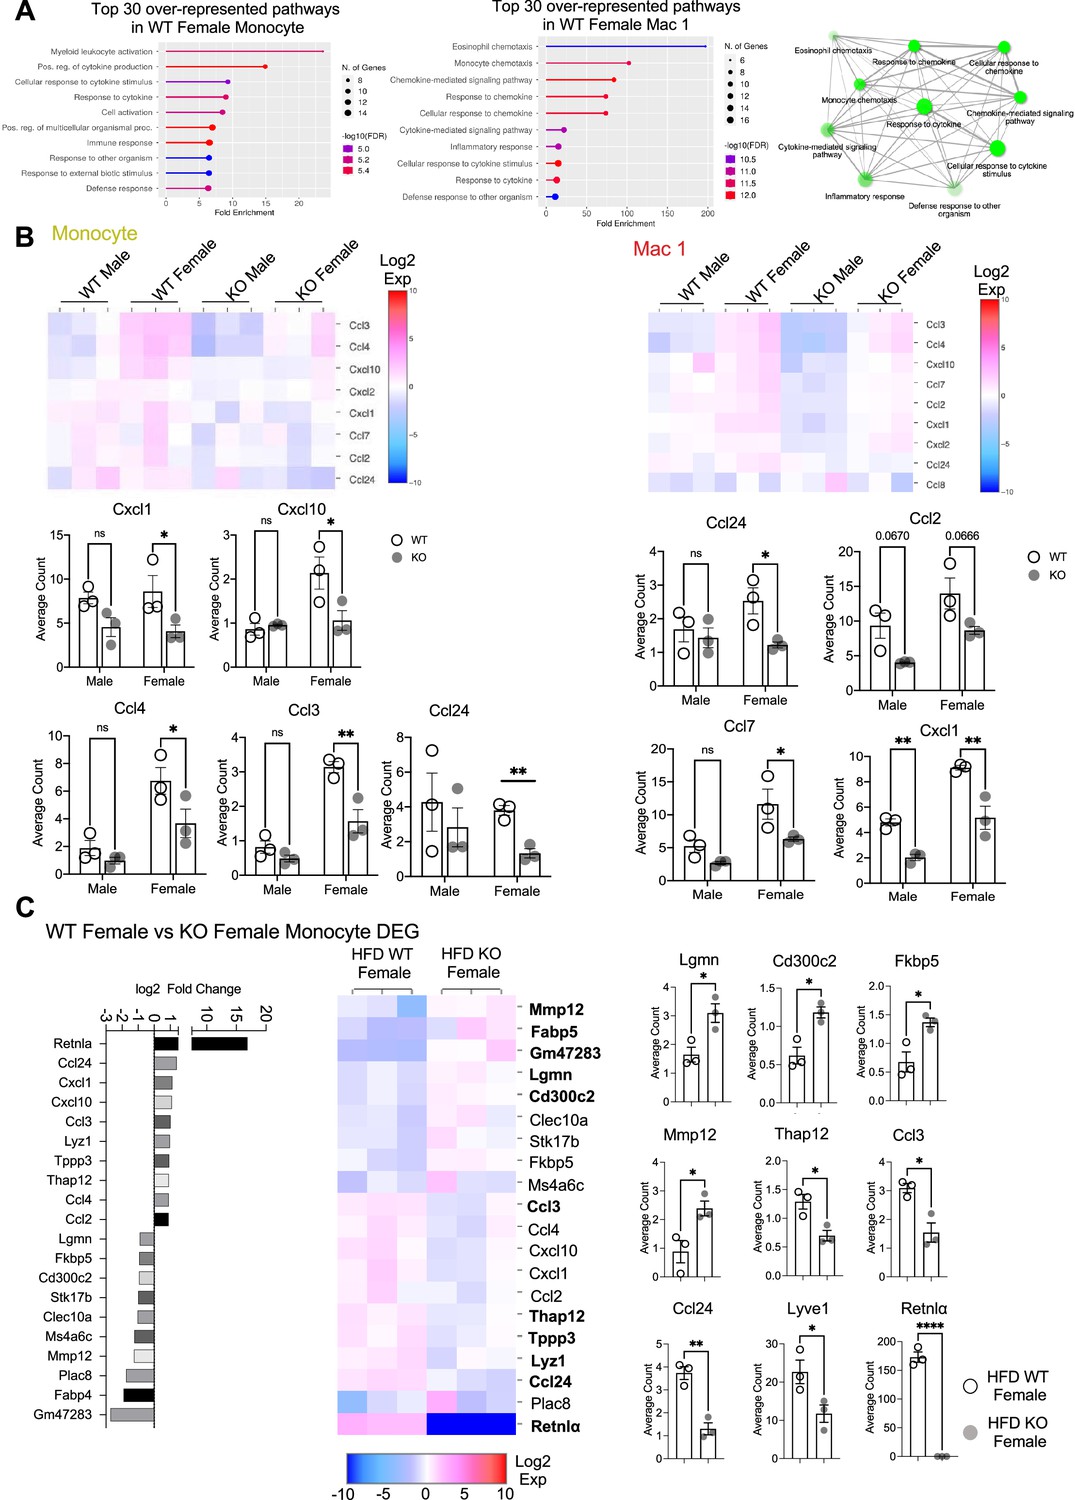
Monocyte and Mac1 differentially expressed gene (DEG).
(A) Gene ontology (GO) pathway analyses of top 30 DEG in WT female monocytes and Mac1 compared to other groups. (B) Heatmaps indicating DEGs in Monocyte and Mac1 and average UMI count analysis between all groups for key marker genes. (C) WT female vs. KO female on high-fat diet (HFD) monocyte subcluster DEG presented as Log2 fold changes in a heatmap and average UMI count comparisons. Statistical significance was determined by unpaired t-test (*p < 0.05; **p < 0.01; ****p<0.0001).
Figure 7
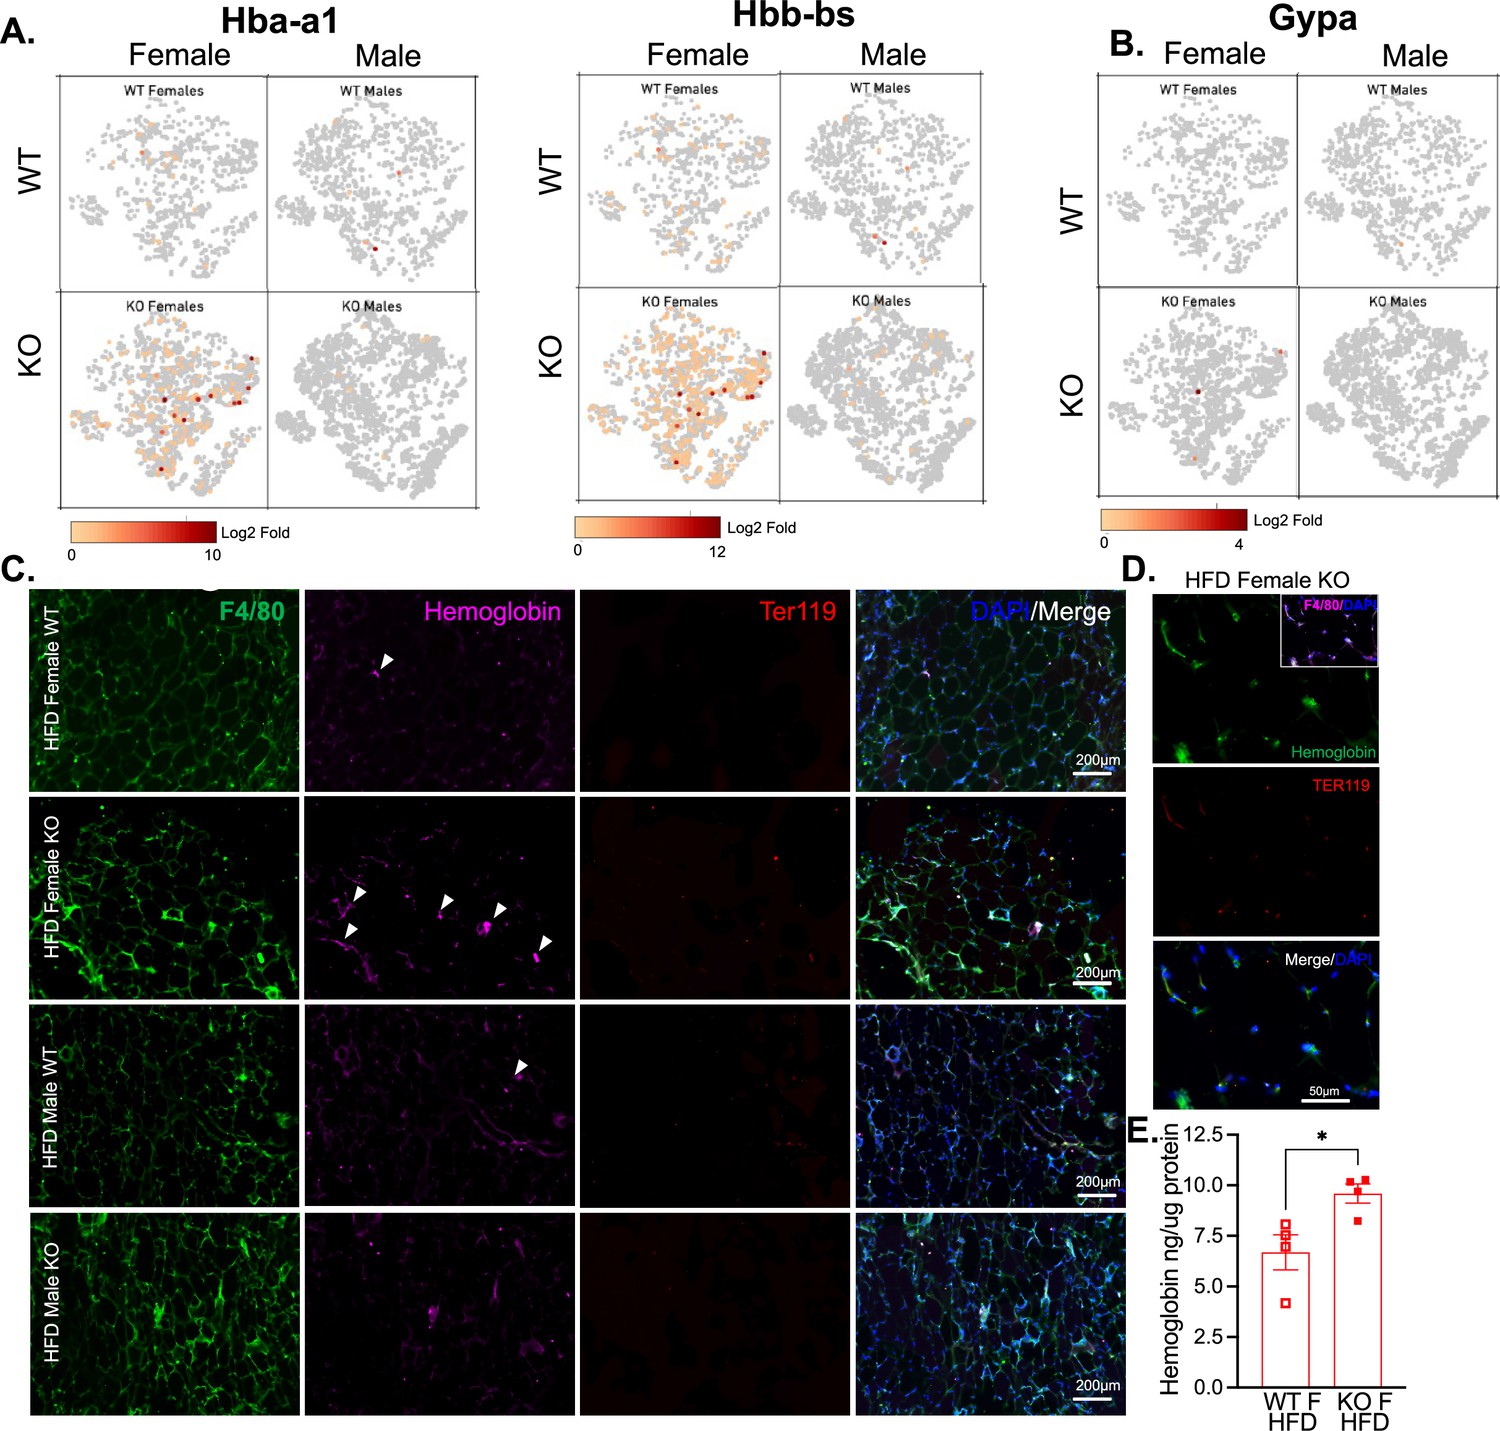
Hemoglobin expression in RELMα knockout (KO) myeloid cells.
t-Stochastic neighbor embedding (tSNE) feature plots of Hba-a1 and Hbb-bs (A) and GypA (B) Log2 fold expression in myeloid clusters in WT female, KO female, WT male, and KO male. (C) Immunofluorescent staining for F4/80 (green), Hemoglobin (magenta), Ter119 (red), and DAPI (blue) was performed on visceral fat tissue sections (bar, 200 μM; arrows indicate Hemoglobin+ cells). (D) High magnification of high-fat diet (HFD) KO female. F4/80 (magenta, inset), Hemoglobin (green), Ter119 (red), and DAPI (blue) (bar, 50 μM). (E) Visceral adipose tissue homogenate hemoglobin ELISA in HFD WT or KO females. Data in (E) are presented as individual points for each animal, where lines represent group means ± standard error of the mean (SEM). Statistical significance was determined by unpaired t-test (*p < 0.05). Data are from 1 experiment with 3–4 mice per group.
Figure 8
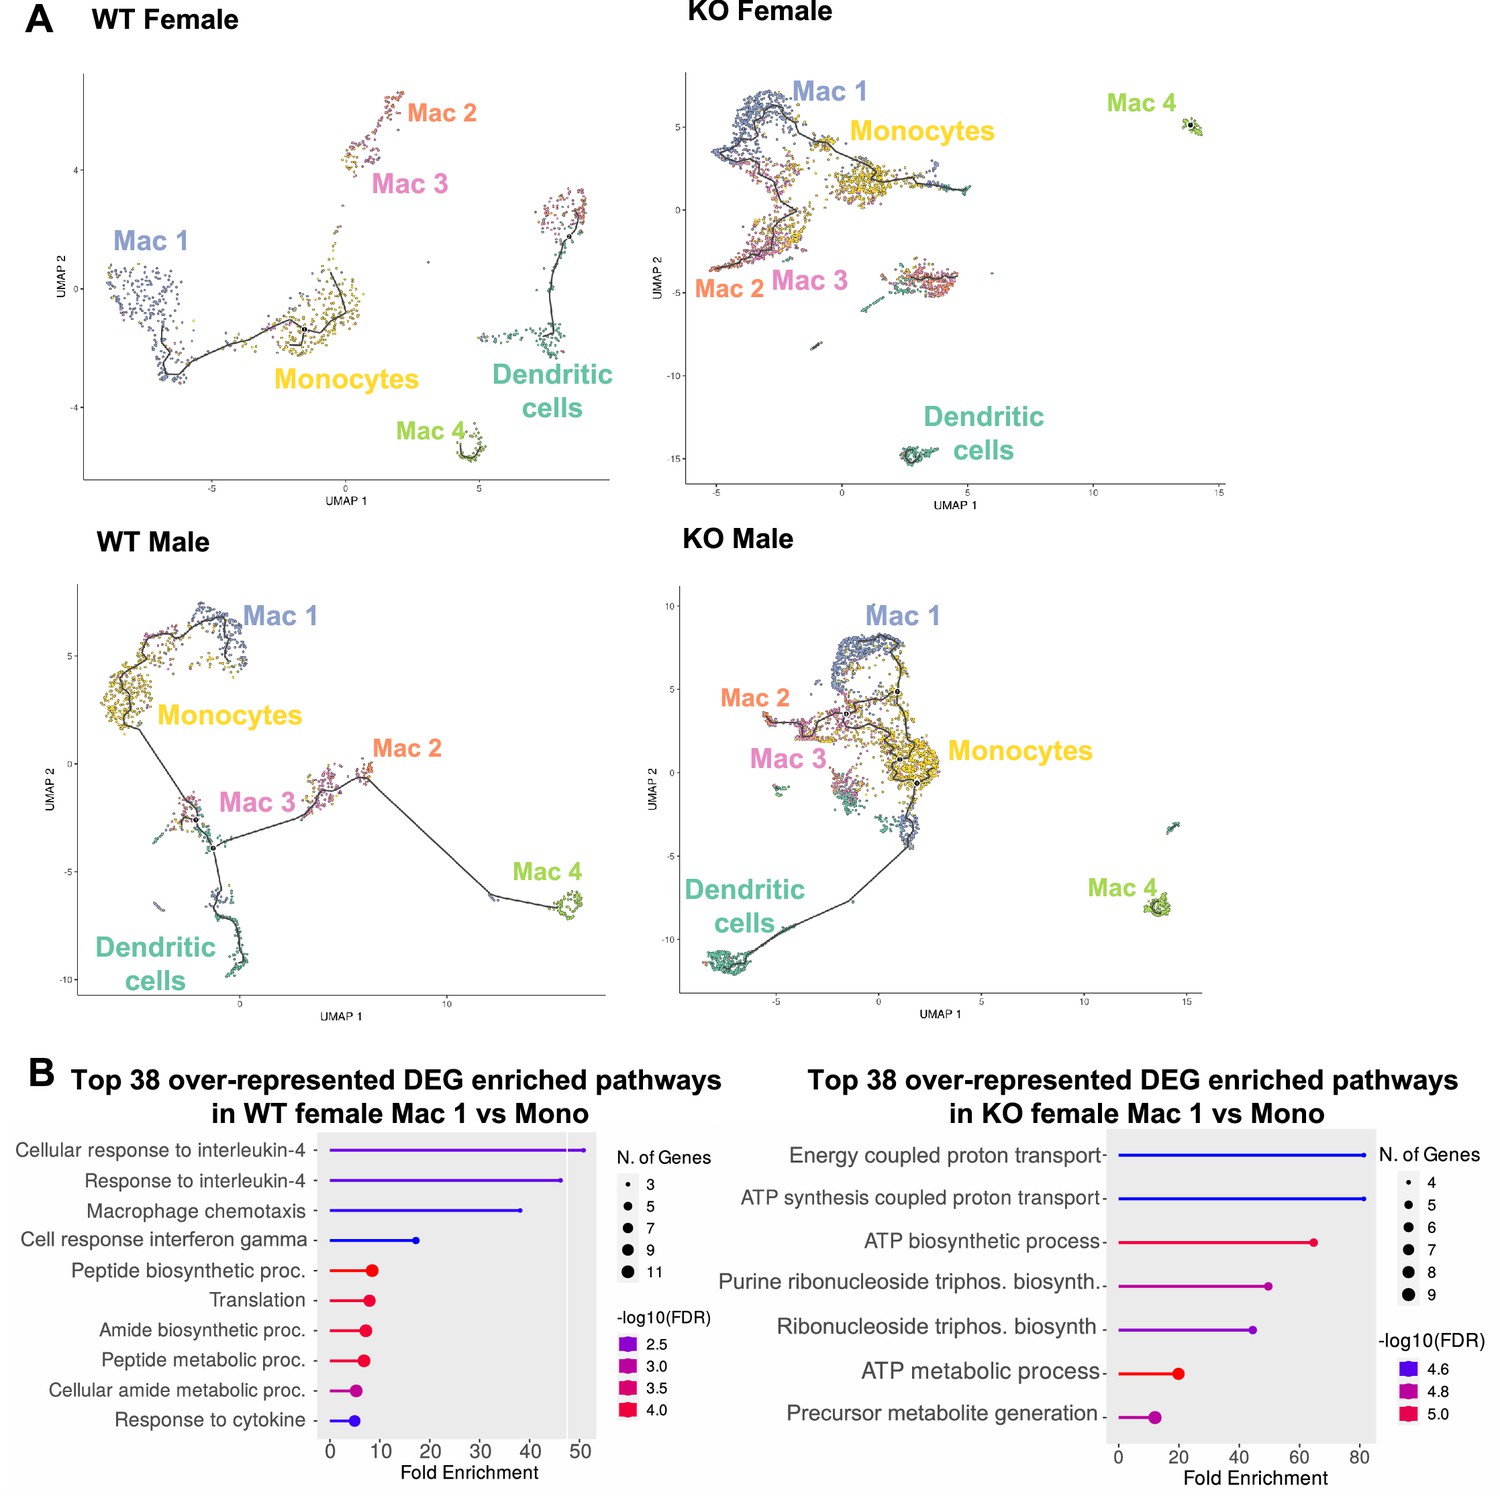
Trajectory analysis reveals dysfunctional myeloid differentiation in RELMα knockout (KO) females.
(A) UMAP plots of trajectory analysis with monocytes set as the root were made for the myeloid subsets within each group (WT female, WT male, KO female, and KO male fed high-fat diet [HFD] for 6 weeks). (B) Histogram of top 38 differentially expressed genes (DEGs) with enriched gene ontology (GO) terms that were upregulated in WT female Mac 1 vs. Monocyte population and KO female Mac 1 vs. Monocyte population. Data are from 1 experiment with 3 mice per group (Supplementary material).
Author response image 1
Author response image 2

Tables
Key resources table
| Reagent type (species) or resource | Designation | Source or reference | Identifiers | Additional information |
|---|---|---|---|---|
| Strain, strain background (Mus musculus) | RELMα knockout | PMID:34349768 | ||
| Strain, strain background (Heligmosomoides polygyrus) | H. polygyrus | PMID:36569914 | ||
| Antibody | anti-Hemoglobin alpha (Rabbit monoclonal) | Invitrogen | Cat. # MA5-32328 | IF (1:100) |
| Antibody | anti-F4/80 (Rat monoclonal) | Invitrogen | Cat. # MA5-16624 | IF (1:100) |
| Antibody | anti-TER-119- APC (Rat monoclonal) | eBioscience | Cat. # 17-5921-81 | IF (1:100) |
| Antibody | anti-RELM alpha-APC (Rat monoclonal) | Invitrogen | Cat. # 17-5441-82 | IF (1:100) |
| Antibody | anti-mouse CD170 (Siglec-F)-PE (Rat monoclonal) | BioLegend | Cat. # S17007L | IF (1:100) |
| Antibody | Anti-rabbit IgG cross-absorbed secondary-TRITC (Chicken polyclonal) | Invitrogen | Cat. # A15998 | IF (1:250) |
| Antibody | anti- F4/80-Alexa Fluor 488 (Rat monoclonal) | eBioscience | Cat. # 53-4801-82 | IF (1:100) |
| Antibody | anti-Rat IgG cross-absorbed secondary- Alexa Fluor 488 (Goat polyclonal) | Invitrogen | Cat. # A11006 | IF (1:250) |
| Antibody | anti-mouse CD16/CD32 (Rat monoclonal) | BD Biosciences | Cat. # 553141 | Flow (1:100) |
| Antibody | anti-mouse MERTK-FITC (Rat monoclonal) | BioLegend | Cat. # 151504 | Flow (1:200) |
| Antibody | anti-mouse CD25-PerCP (Rat monoclonal) | BioLegend | Cat. # 102028 | Flow (1:200) |
| Antibody | anti-mouse CD301- PerCP/Cyanine5.5 (Rat monoclonal) | BioLegend | Cat. # 145710 | Flow (1:200) |
| Antibody | anti-mouse CD36-APC (Armenian Hamster monoclonal) | BioLegend | Cat. # 102612 | Flow (1:200) |
| Antibody | anti-mouse I-A/I-E- Alexa Fluor 700 (Rat monoclonal) | BioLegend | Cat. # 107622 | Flow (1:200) |
| Antibody | anti-mouse CD45-PerCP/Cyanine5.5 (Mouse recombinant) | BioLegend | Cat. # 157612 | Flow (1:200) |
| Antibody | anti-mouse CD184- Brilliant Violet 421 (Rat monoclonal) | BioLegend | Cat. # 146511 | Flow (1:200) |
| Antibody | anti-mouse/human CD11b- APC/Cyanine7 (Rat monoclonal) | BioLegend | Cat. # 101226 | Flow (1:200) |
| Antibody | anti-mouse CD4- Brilliant Violet 711 (Rat monoclonal) | BioLegend | Cat. # 100557 | Flow (1:200) |
| Antibody | anti-mouse F4/80- Brilliant Violet 650 (Rat monoclonal) | BioLegend | Cat. # 123149 | Flow (1:200) |
| Antibody | anti-mouse CD206- Brilliant Violet 785 (Rat monoclonal) | BioLegend | Cat. # 141729 | Flow (1:200) |
| Antibody | anti-mouse CD170 (Siglec-F)- PE/Dazzle 594 (Rat monoclonal) | BioLegend | Cat. # 155530 | Flow (1:200) |
| Antibody | anti-mouse CD11c-APC (Armenian Hamster monoclonal) | BioLegend | Cat. # 117310 | Flow (1:200) |
| Antibody | anti-mouse CD64-PE/Cyanine7 (Mouse monoclonal) | BioLegend | Cat. # 139314 | Flow (1:200) |
| Antibody | anti-mouse RELM alpha-PE (Rat monoclonal) | eBioscience | Cat. # 12-5441-82 | Flow (1:200) |
| Commercial assay or kit | Hemoglobin Elisa | abcam | Cat. # ab254517 | |
| Commercial assay or kit | Chromium Next GEM Single Cell 3′ GEM Kit v3.1 | 10×Genomics | Cat. # 1000269 | |
| Commercial assay or kit | Chromium Next GEM Chip G Single Cell Kit | 10× Genomics | Cat. # 1000127 | |
| Commercial assay or kit | Dual Index Kit TT Set A, 96 rxns | 10× Genomics | Cat. # 1000215 | |
| Commercial assay or kit | 3′ CellPlex Kit Set A | 10× Genomics | Cat. # 1000261 | |
| Commercial assay or kit | Dual Index Kit NN Set A, 96 rxns | 10× Genomics | Cat. # 1000243 | |
| Software, algorithm | R | The R Foundation | RRID:SCR_001905 | V4.2.3 |
| Software, algorithm | Cell Ranger | 10× Genomics | V7.0 | |
| Software, algorithm | Cell Ranger multiplexing (multi) | 10× Genomics | For use with Cell Ranger 6.0 and higher | |
| Software, algorithm | Cell Ranger aggregation (aggr) | 10× Genomics | Run cellranger multi prior | |
| Software, algorithm | Seurat | Satija Lab PMID:31178118 | V4.3 | |
| Software, algorithm | Monocle3 | Cole-Trapnell Lab PMID:30787437 | V3.1.2.9 | |
| Software, algorithm | FlowJo | Treestar | Version 10.8 | |
| Other | High-fat diet (HFD) | Research Diets | Cat. # D12492 | Mouse food |
| Other | Control diet (Ctrl) | Research Diets | Cat. # D12450J | Mouse food |
| Other | Zombie Aqua Fixable Viability Kit | BioLegend | Cat. # 423102 | Viability dye (1:500) |
| Other | DAPI stain | Invitrogen | Cat. # D1306 | Nuclear stain (1 µg/ml) |
Additional files
-
Supplementary file 1
Three-way analysis of variance (ANOVA) of body weight, immune cells, macrophages, and eosinophils.
- https://cdn.elifesciences.org/articles/86001/elife-86001-supp1-v1.xlsx
-
Supplementary file 2
All enriched gene ontology (GO) terms for differentially expressed gene (DEG) analysis between WT female vs. WT male, KO female vs. KO male, KO female vs. WT female, and KO male vs. WT male in all cells.
- https://cdn.elifesciences.org/articles/86001/elife-86001-supp2-v1.xlsx
-
MDAR checklist
- https://cdn.elifesciences.org/articles/86001/elife-86001-mdarchecklist1-v1.pdf
Download links
A two-part list of links to download the article, or parts of the article, in various formats.
Downloads (link to download the article as PDF)
Open citations (links to open the citations from this article in various online reference manager services)
Cite this article (links to download the citations from this article in formats compatible with various reference manager tools)
Sexual dimorphism in obesity is governed by RELMα regulation of adipose macrophages and eosinophils
eLife 12:e86001.
https://doi.org/10.7554/eLife.86001


