Manganese-enhanced magnetic resonance imaging reveals light-induced brain asymmetry in embryo
- Center for Mind/Brain Sciences, University of Trento, Piazza Manifattura, Italy
- Center for Neuroscience and Cognitive Systems @ UniTn, Istituto Italiano di Tecnologia, Italy
- Department of Molecular Biotechnology and Health Sciences, University of Torino, Italy
Figures
Figure 1 with 4 supplements
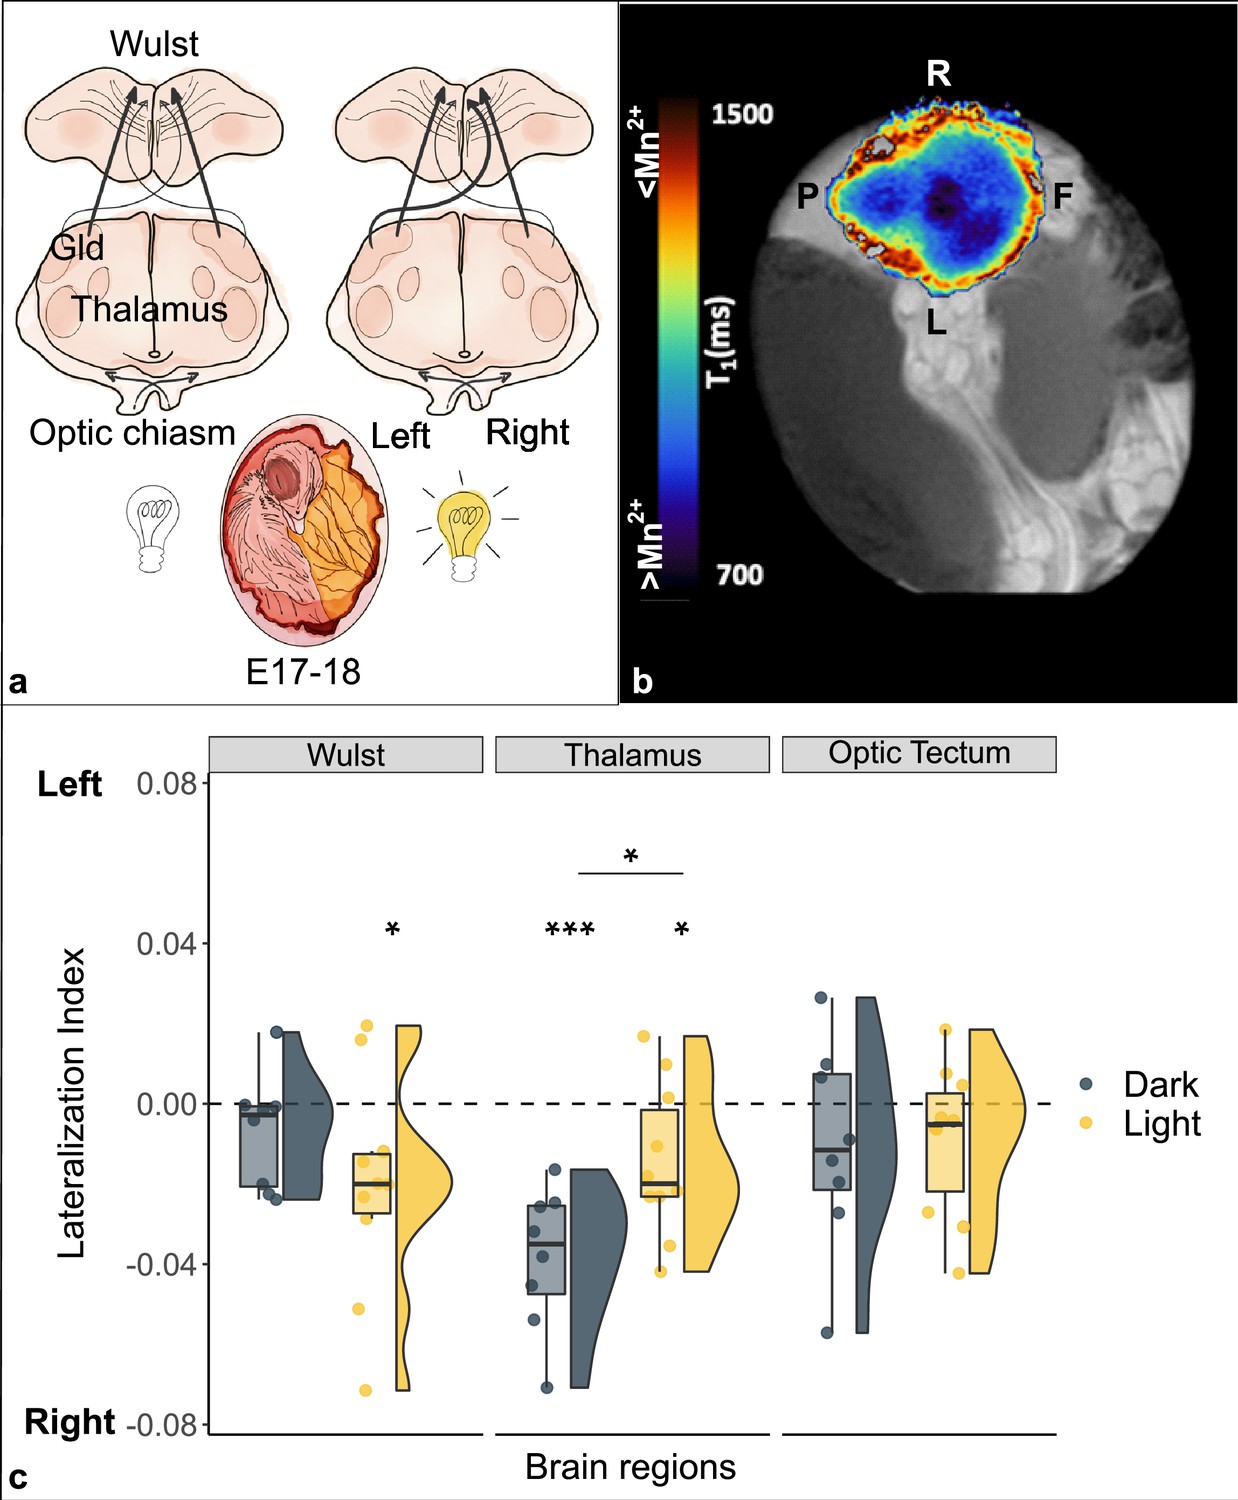
Lateralization of brain activity in chick embryos light and dark incubated.
(a) Schematic representation of the impact of light (off/on) on the lateralization of projections from the left thalamus (nucleus geniculatus lateralis pars dorsalis, Gld) to the right Wulst during the sensitive window (E17–18). (b) Typical longitudinal relaxation time (T1) map of a chick’s brain after administration of manganese. Mn2+ is a paramagnetic ion and shortens the T1 of nuclear spins in brain tissue in a concentration-dependent manner. Blue-darker regions correspond to higher intracellular Mn2+ accumulation, and hence to increased neuronal activity. Left-right front-posterior coordinates (L, R, F, P) are indicated with respect to the sagittal brain axis of embryo chick brain inside the egg. (c) Brain activity is reported as lateralization index (1=activity only in the left hemisphere; –1=only in the right). Regions of the thalamofugal pathway: Wulst and thalamus (Gld); region of the tectofugal pathway: optic tectum. Asterisk between groups indicates a significant difference between experimental conditions (Dark n=8, Light n=10). Asterisk above single group indicates lateralization significantly different from chance (0, dotted line). * indicates p<0.05, *** indicates p≤0.001. To best represent data, we used a raincloud plot that combines for each region and for each group: boxplot, raw data (circles) and data distribution (half violin on the left).
Figure 1—figure supplement 1
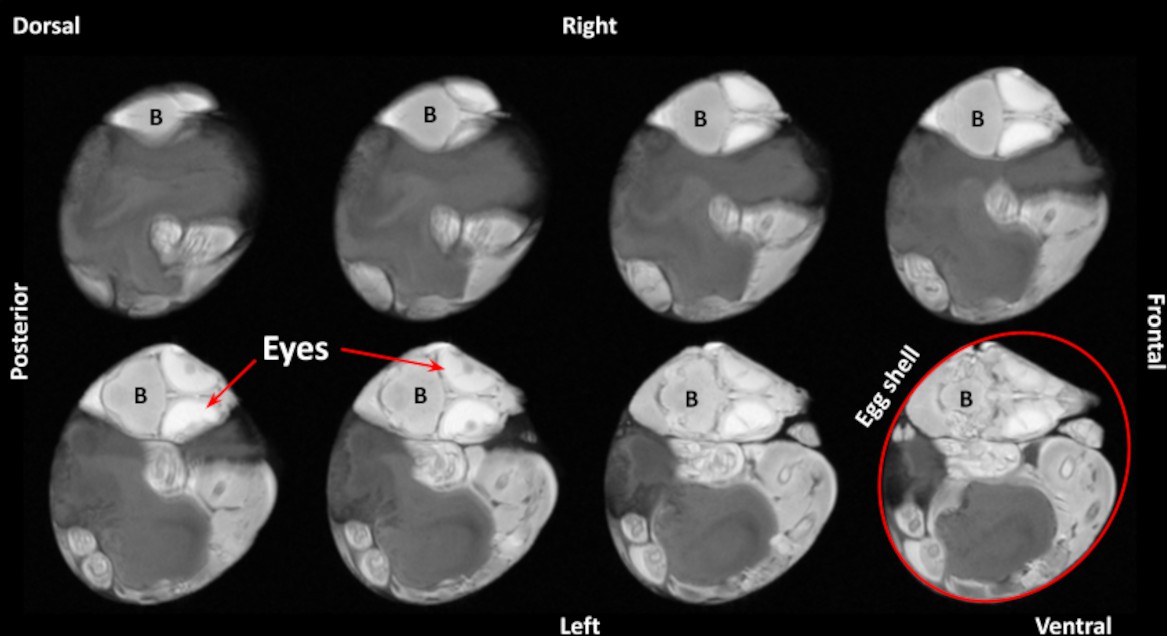
T1w structural image of a chick embryo.
Capital ‘B’ identifies the brain; red circle traces the outline of the eggshell; eyes are indicated with a red arrow. The brain is represented on the axial plane in the cranio-caudal direction.
Figure 1—figure supplement 2
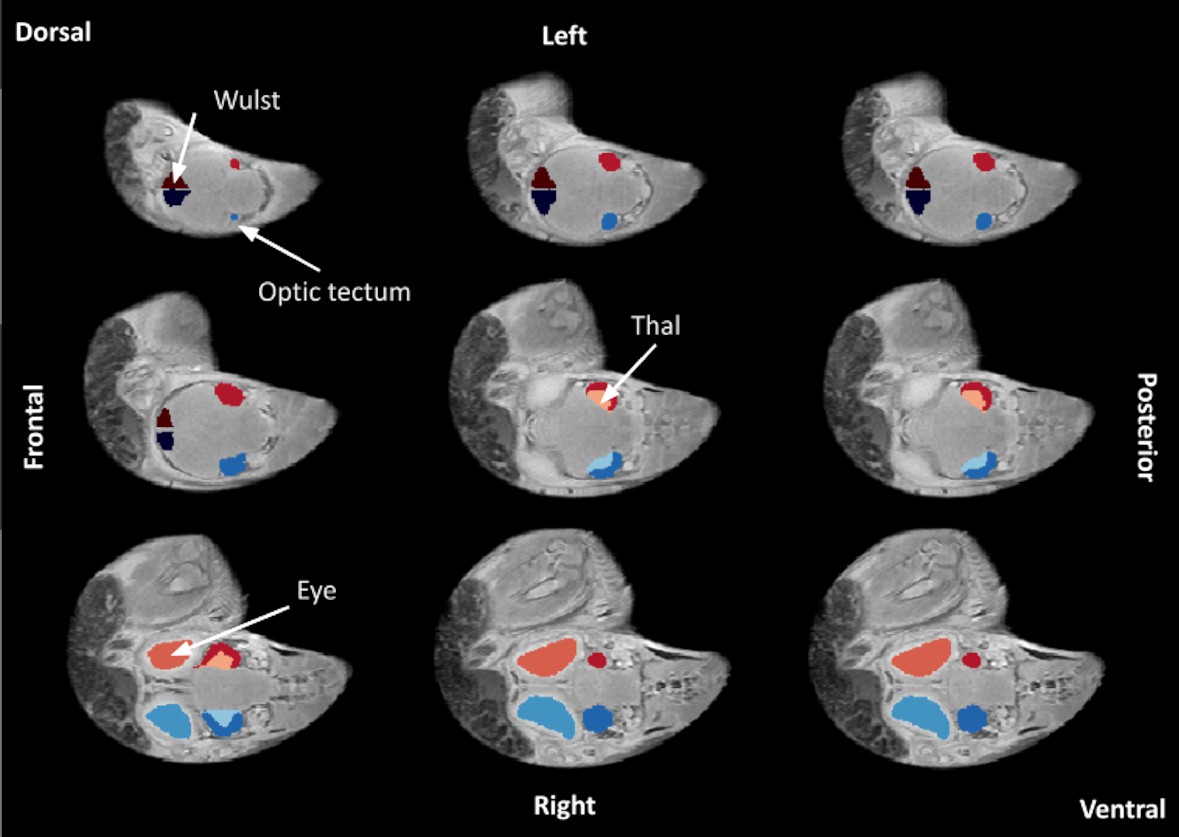
Representative in ovo MRI of a full egg.
Color labels indicate regions of interest (ROIs) in the left (red) and right (blue) hemisphere, respectively.
Figure 1—figure supplement 3
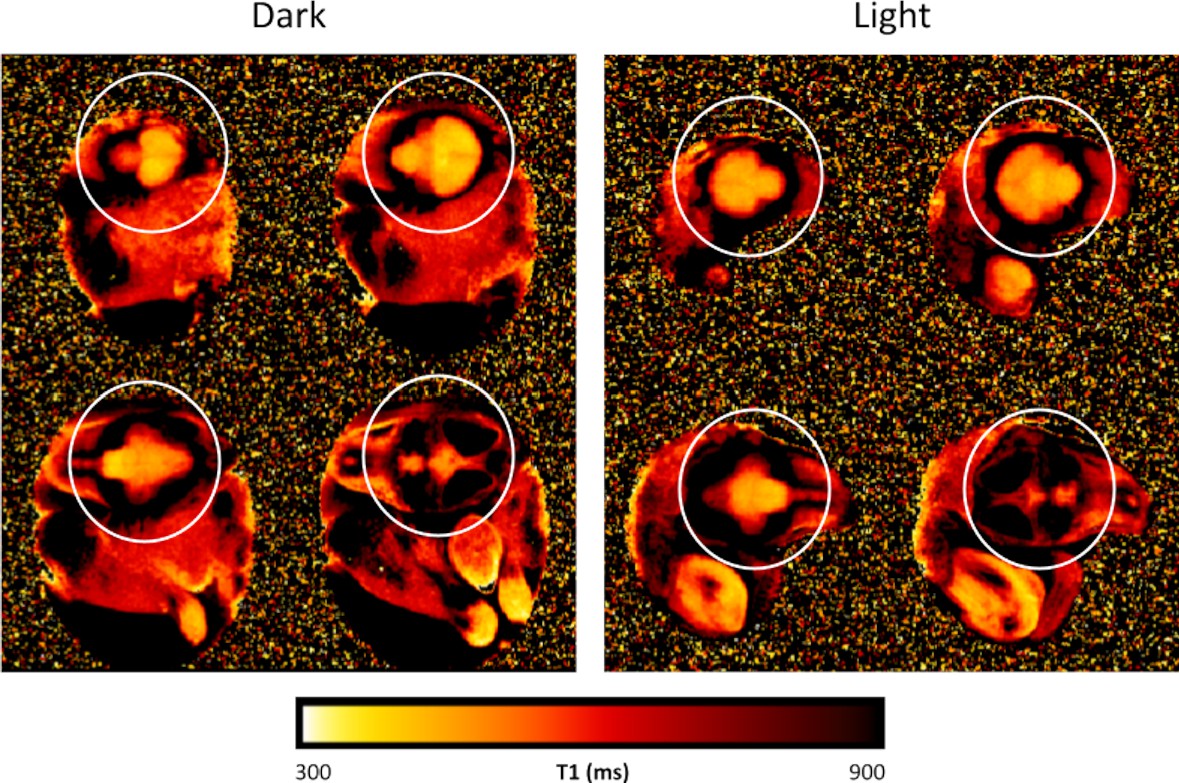
Visual assessment of two representative voxelwise T1 maps from a dark-incubated (left) and light-incubated egg (right).
White circles identify the head/brain complex. The colormap is inverted and optimized to emphasize Mn2+-induced T1 shortening in the brain.
Figure 1—figure supplement 4
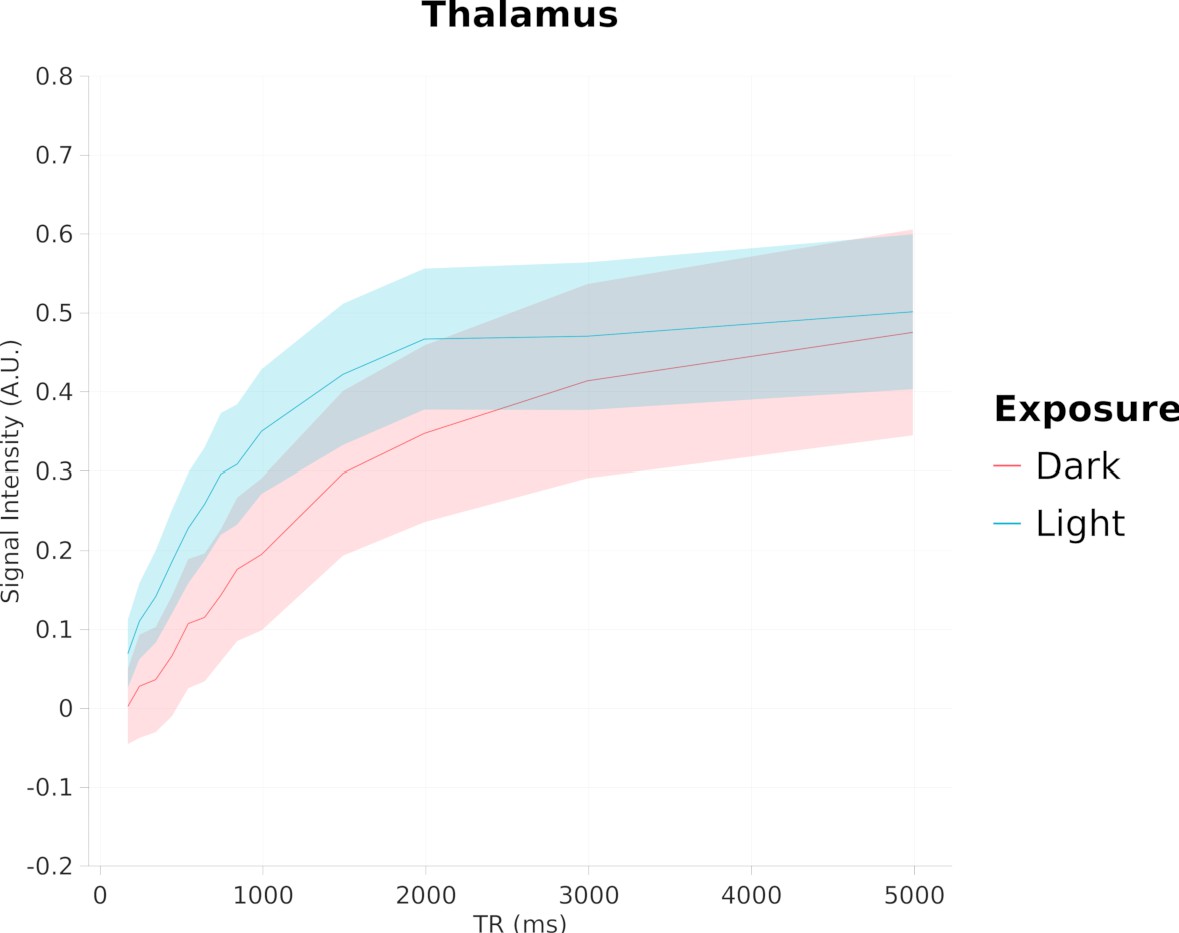
Saturation recovery curve of inter-hemispheric signal intensity of the thalamus.
Curves are calculated as difference between left and right thalamus for both exposure conditions and are reported as mean (continuous line) and SEM (shaded area).
Additional files
-
Supplementary file 1
Region of interest (ROI)-averaged T1 values measured for the two experimental groups.
All values are expressed in milliseconds.
- https://cdn.elifesciences.org/articles/86116/elife-86116-supp1-v1.csv
-
MDAR checklist
- https://cdn.elifesciences.org/articles/86116/elife-86116-mdarchecklist1-v1.pdf
Download links
A two-part list of links to download the article, or parts of the article, in various formats.
Downloads (link to download the article as PDF)
Open citations (links to open the citations from this article in various online reference manager services)
Cite this article (links to download the citations from this article in formats compatible with various reference manager tools)
Manganese-enhanced magnetic resonance imaging reveals light-induced brain asymmetry in embryo
eLife 12:e86116.
https://doi.org/10.7554/eLife.86116


