Glutaredoxin regulation of primary root growth is associated with early drought stress tolerance in pearl millet
- DIADE, Université de Montpellier, IRD, CIRAD, France
- LMI LAPSE, Senegal
- CERAAS, ISRA, Senegal
- LGDP, Université de Perpignan, France
- School of Biosciences, University of Nottingham, United Kingdom
- Montpellier GenomiX, France
- Be More Specific, France
- ICRISAT, India
- UMR AGAP Institut, Univ Montpellier, CIRAD, INRAE, Institut Agro, France
- LGDP, CNRS, France
Figures
Figure 1 with 2 supplements
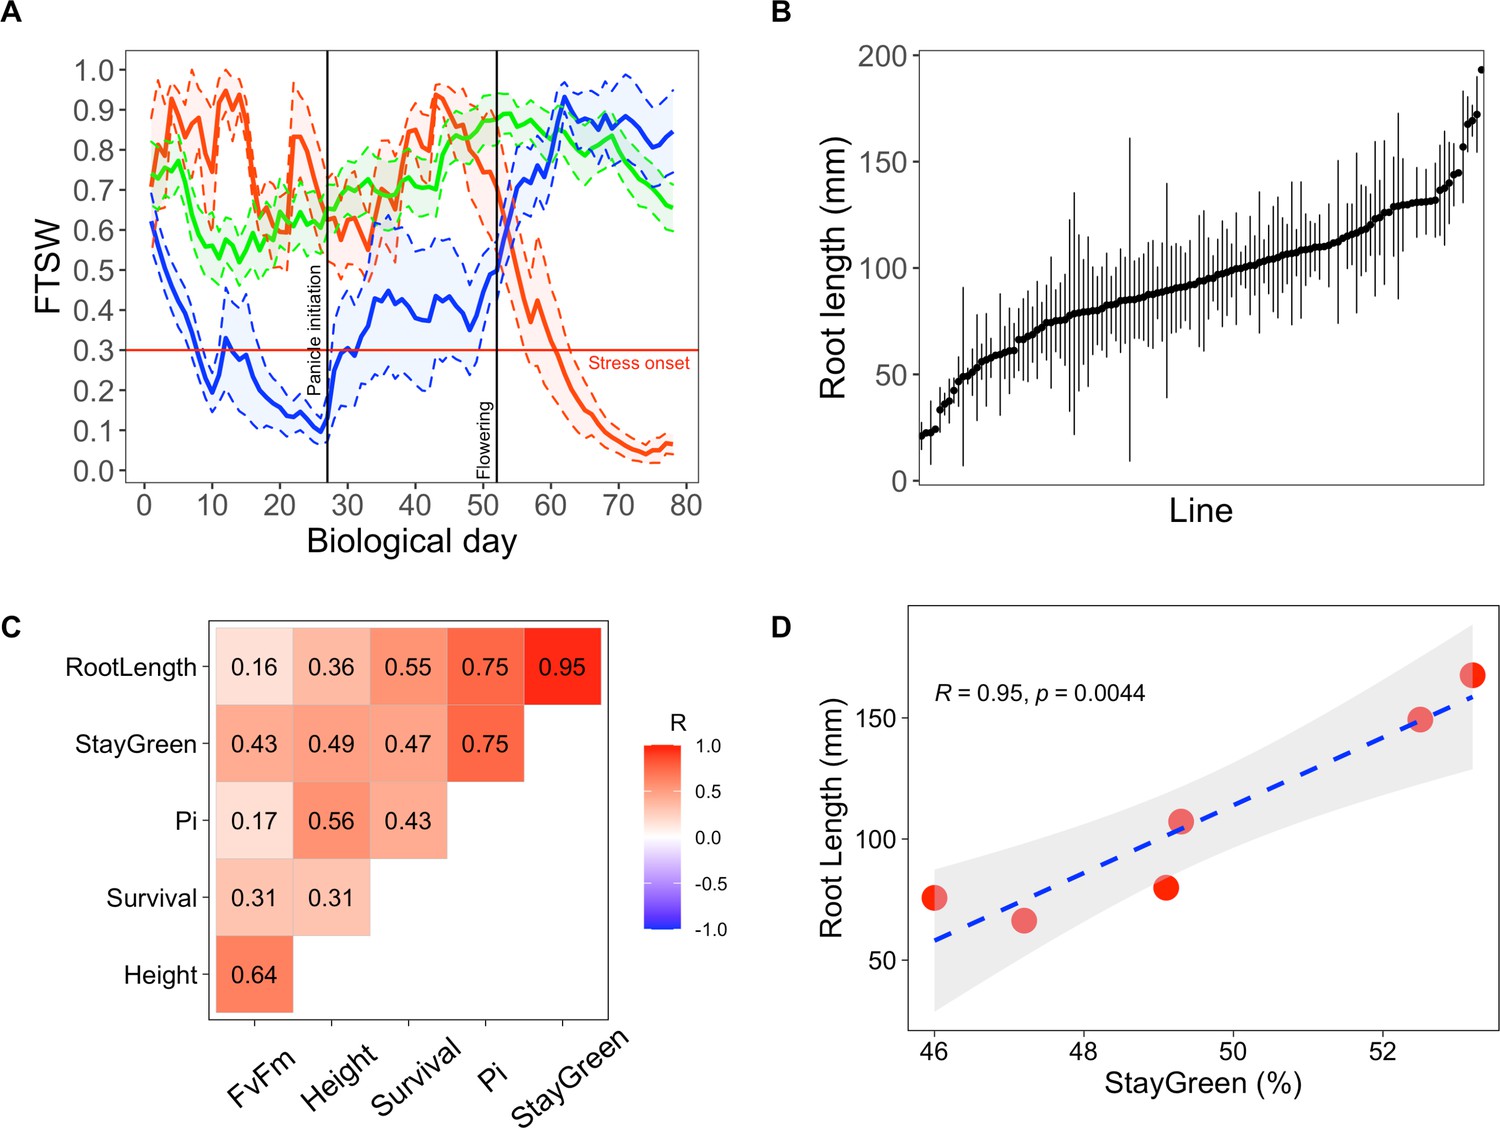
Early primary root growth and its correlation to drought tolerance related traits measured in field conditions.
(A) Stress patterns identified by clustering of simulated fraction of transpirable soil water (FTSW) trend during crop growth in 2000–2021 in Bambey. FTSW = 0.3 (horizontal red line) was considered as the onset of water stress. Each point is the average of a few daily FTSW based on the biological day which was used instead of daily FTSW to highlight the critical stages (panicle initiation and flowering, black lines). Thick lines and shaded areas show the mean and two times standard error (SE), respectively. Blue, red, and green lines correspond to early-stress, late-stress, and no-stress, respectively. (B) Root length in 122 pearl millet inbred lines derived from West and Central African landraces. Root length was measured at 6 days after germination in a paper-based hydroponic system installed in a growth chamber. Points represent mean ± SE. (C) Correlation between root length and the field measured traits using adjusted lsmeans across both years. The Pearson correlation coefficients are indicated for each pair of traits. (D) Linear regression between root length and stay-green. Red points represent the lsmean for the six inbred lines that were common between the two field trials.
Figure 1—figure supplement 1
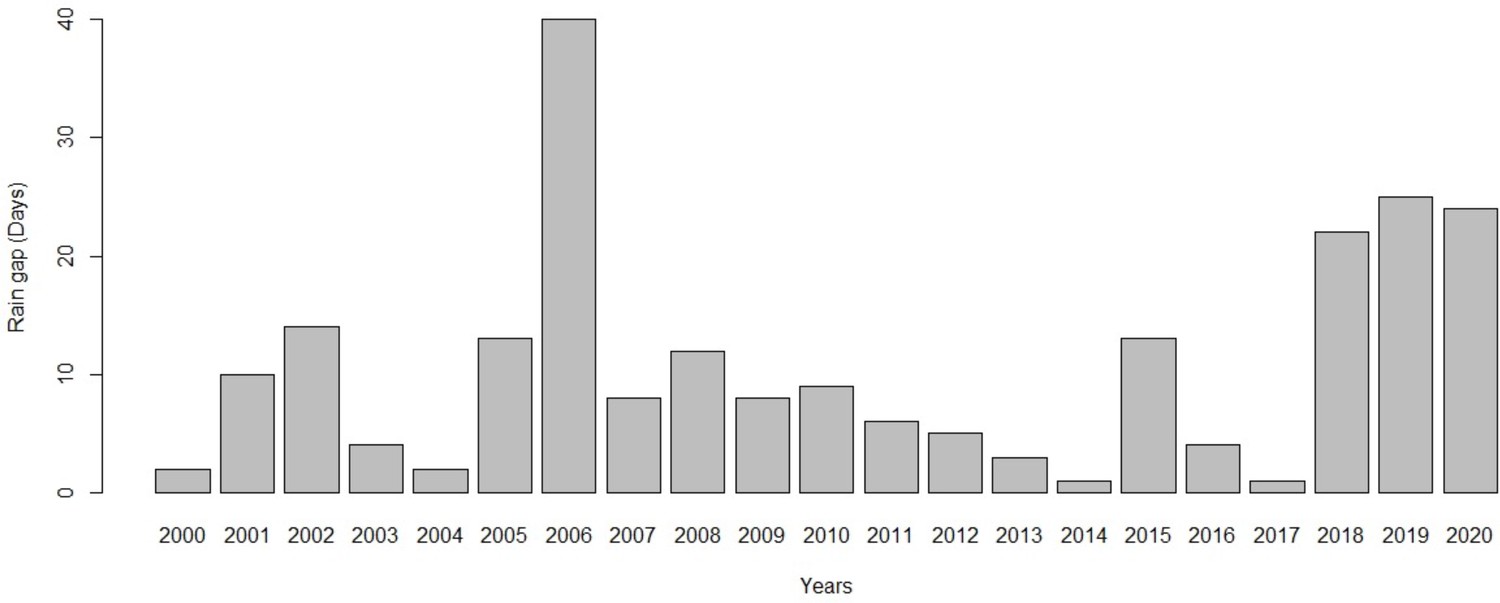
Lapse between the first and the second significant rainfall.
Rainfall was considered significant when >10 mm rainfall per day. Data from the Bambey experimental station.
Figure 1—figure supplement 2

Covariation of root length, plant height, and drought related traits including maximum quantum efficiency of photosystem II (FvFm) and performance index of photosynthesis (PI) measured at 32 days after sowing, stay-green and plant survival measured at 42 days after sowing.
Mean values measured in 2018 (A) and 2020 (B) field trials were used for principal component analysis (PCA). The contribution of each PCA axis (PC1 and PC2) is indicated on the graph.
Figure 2 with 4 supplements
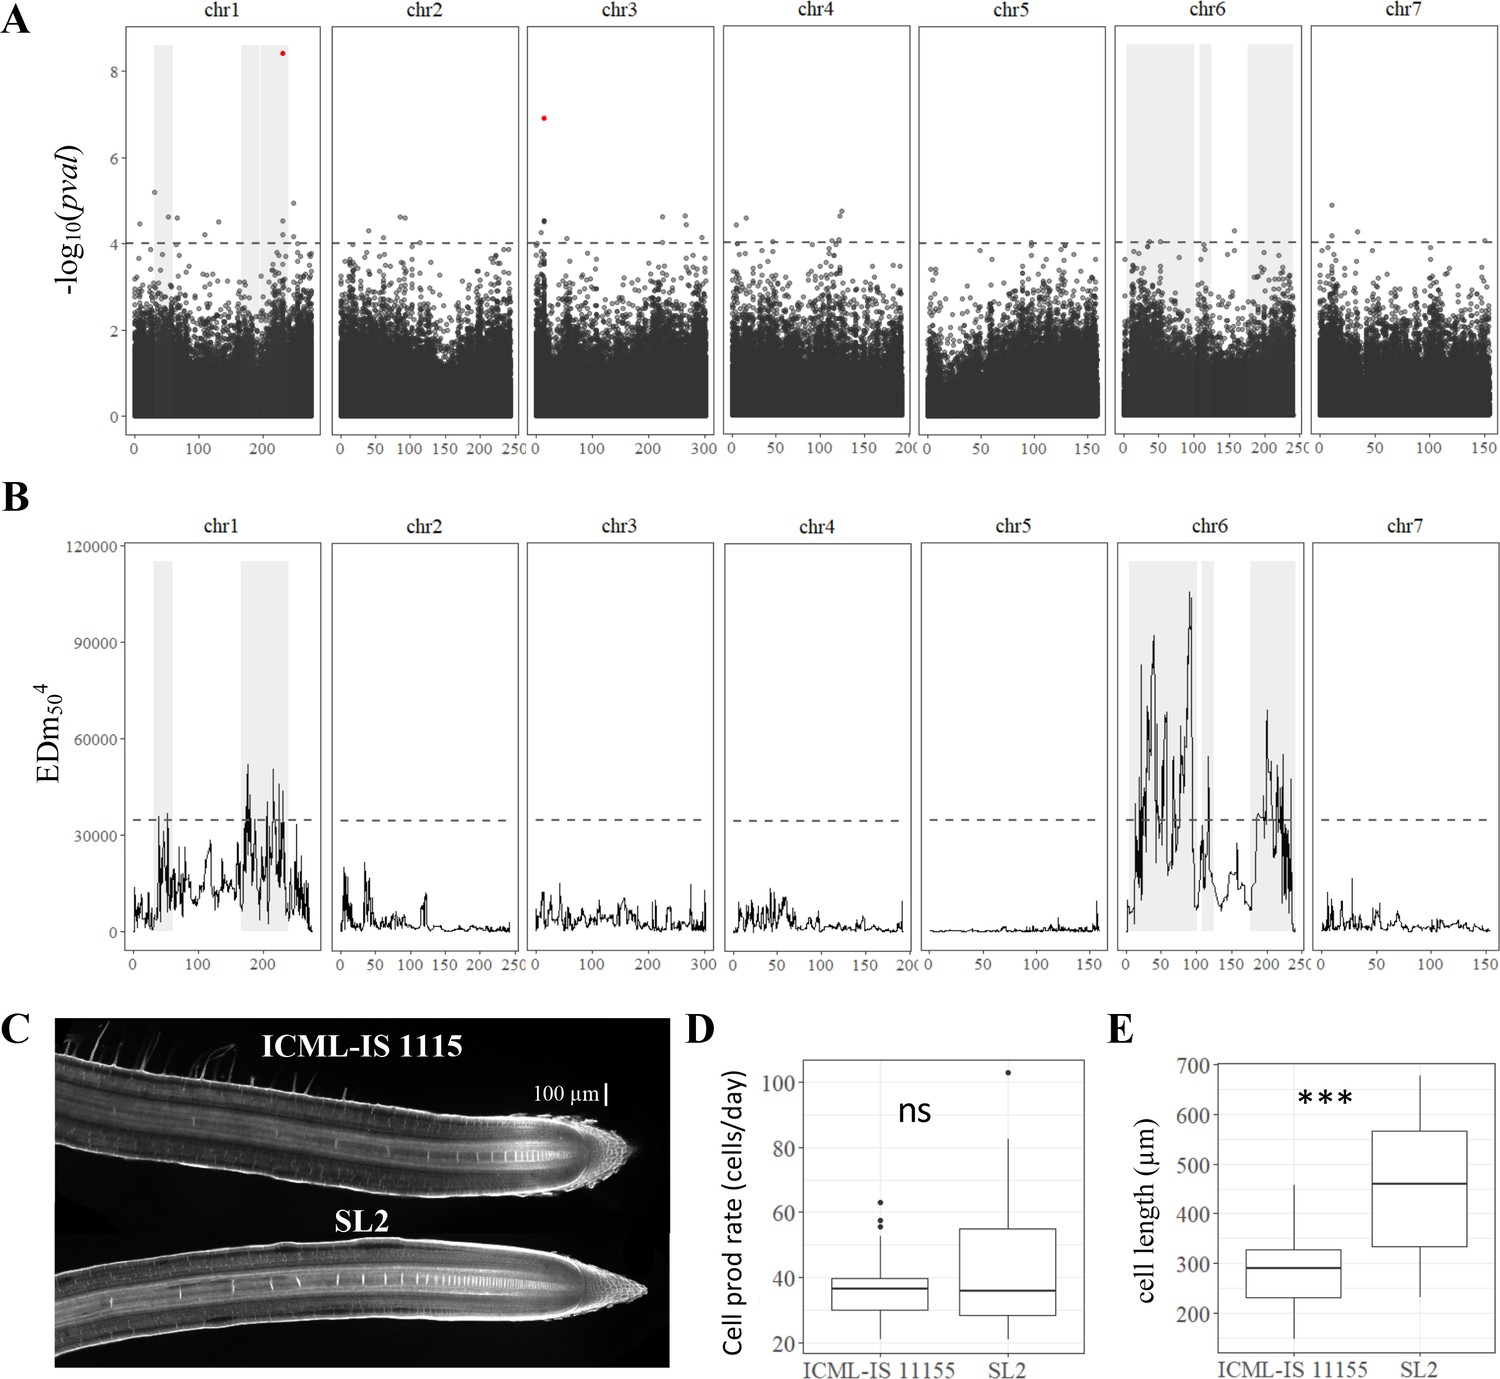
Genetic dissection of primary root length in pearl millet and analysis of root apical meristem and primary root growth of contrasted pearl millet lines.
(A) Manhattan plot of the genome-wide association study (GWAS) by lfmm ridge method (Caye et al., 2019). The horizontal axes correspond to the map position of each of the 392,216 SNPs identified by GBS in a group of 122 inbred lines. The vertical axis indicates the −log10 p-value of the statistic. The dash line delimits the threshold for highly significant SNPs (p-value <10−4). Significant SNP markers above the 0.05 false discovery rate (FDR) significance threshold are highlighted in red. (B) Bulk segregant analysis (BSA) identification of significant regions associated with primary root length using bulks of contrasted F2 lines from a bi-parental cross. The plot shows the Euclidean distance statistic profile (y-axis) across the seven pearl millet chromosomes (x-axis). The dash line indicates the 95% confidence interval threshold for the localization of significant regions. In both plots, the shaded area delimits the extent of the six significant regions identified by BSA and therefore the overlap with significant SNPs identified by GWAS (A) and the correspondence with the BSA peaks found (B). (C) Confocal image of the root tip of the contrasted inbred lines for primary root growth (ICML-IS-1115 and SL2 with slow and fast growth, respectively). (D) Estimation of cell production rate for ICML-IS-1115 (N = 25) and SL2 (N = 22) according to Beemster et al., 2002. (E) Maximum cell length reached in the root elongation zone for ICML-IS-1115 (N = 25) and SL2 (N = 22). ***p-value ≤0.0001, ns: not significant.
Figure 2—figure supplement 1
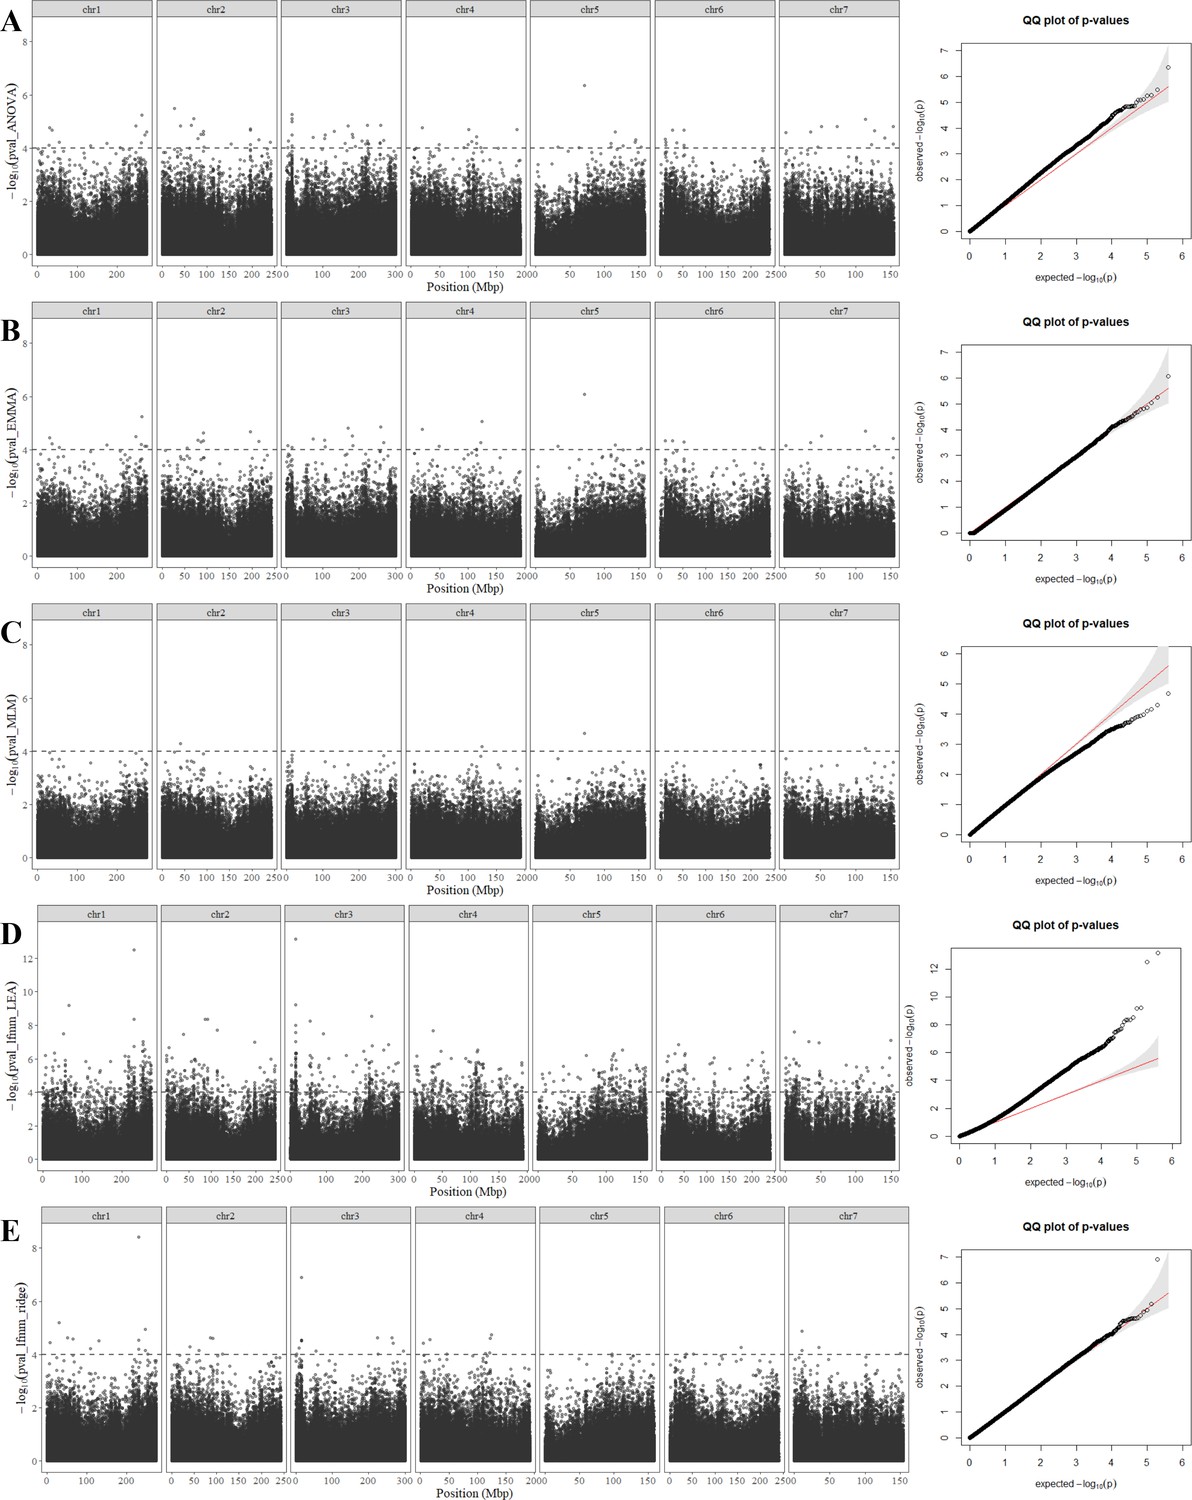
Genome-wide association study (GWAS) Manhattan plot and p-values QQ plots obtained with five methods.
(A) Analysis of variance or ANOVA, (B) efficient mixed model association or EMMA, (C) mixed lineal model or MLM, (D) latent factor mixed model using a stochastic algorithm (MCMC), or LFMM_LEA, and (E) latent factor mixed model using the ridge algorithm or LFMM_ridge.
Figure 2—figure supplement 2
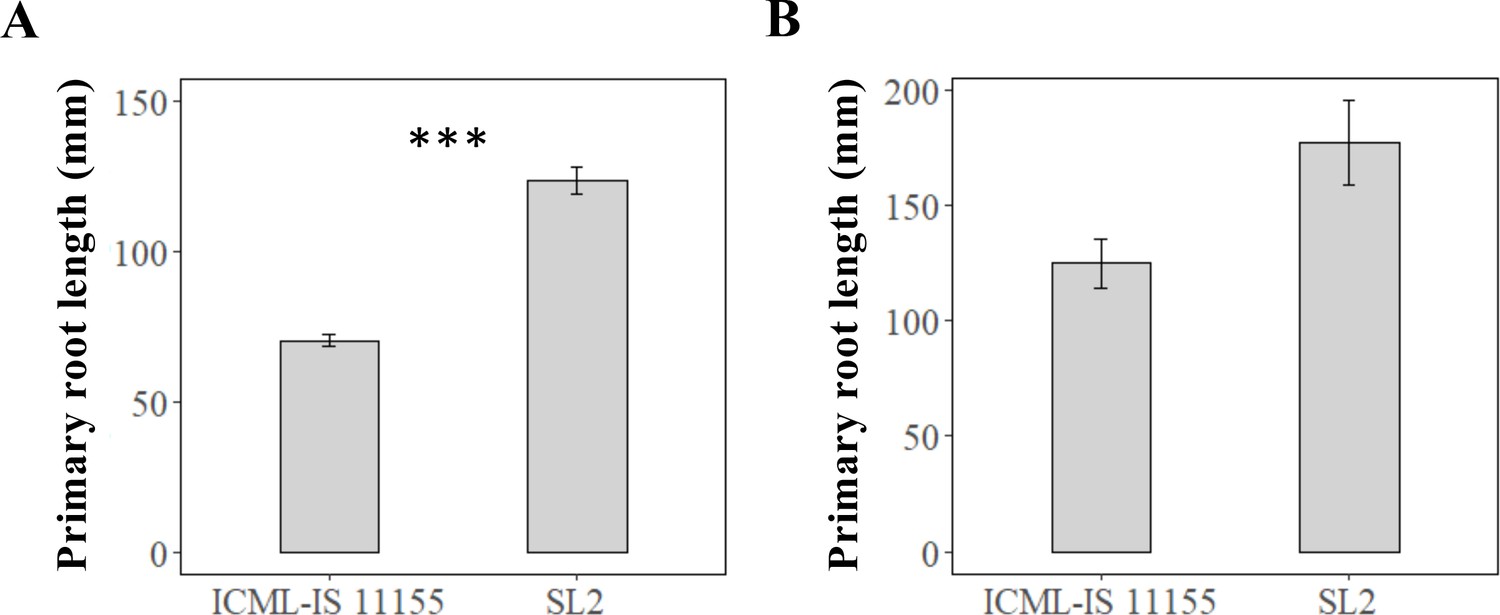
Contrasted primary root length of lines ICML-IS 11155 and SL2.
Measures were performed (A) on paper roll 7 days after germination (NICML-IS 11155 = 32, NSL2 = 34, ***p-value <0.0001) and (B) on soil column using by X-ray tomography 10 days after germination (NICML-IS 11155 = 4, NSL2 = 5, p-value = 0.058).
Figure 2—figure supplement 3

Distribution of root growth phenotypes in the F2 population and the parents ICML-IS 11155 and SL2.
(A) Distribution of the phenotype of parents and F2 plants. (B) Table of averages.
Figure 2—figure supplement 4
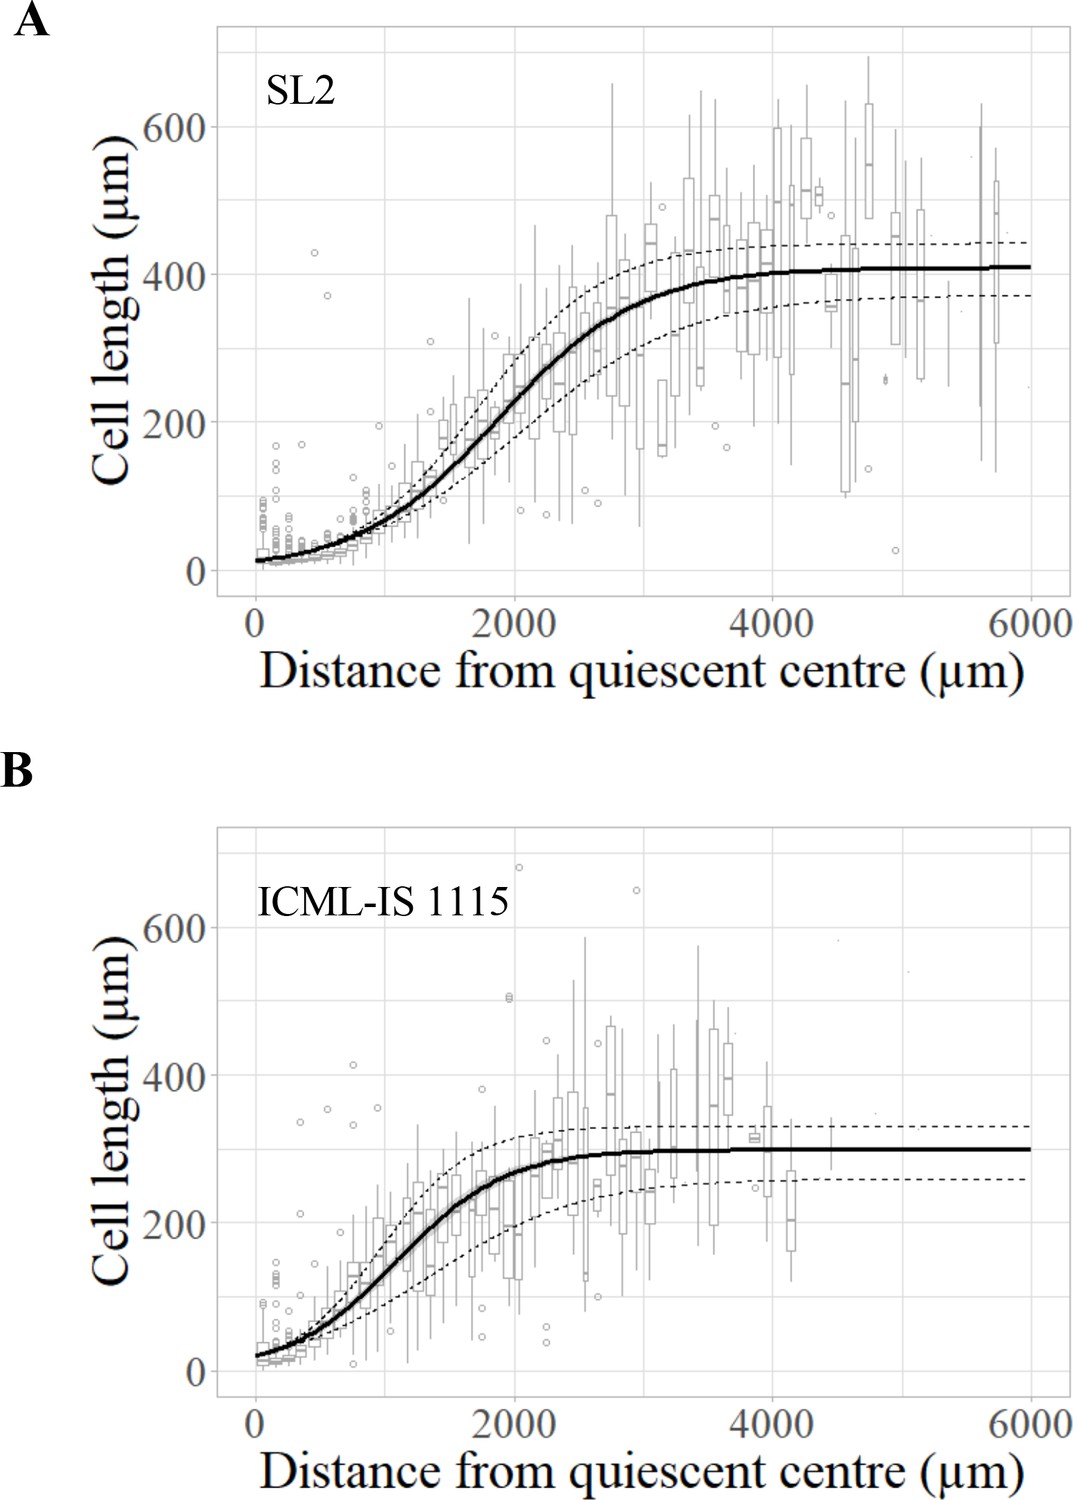
Cell length profile in the root meristem of (A) SL2 and (B) ICML-IS 11155.
Figure 3 with 1 supplement
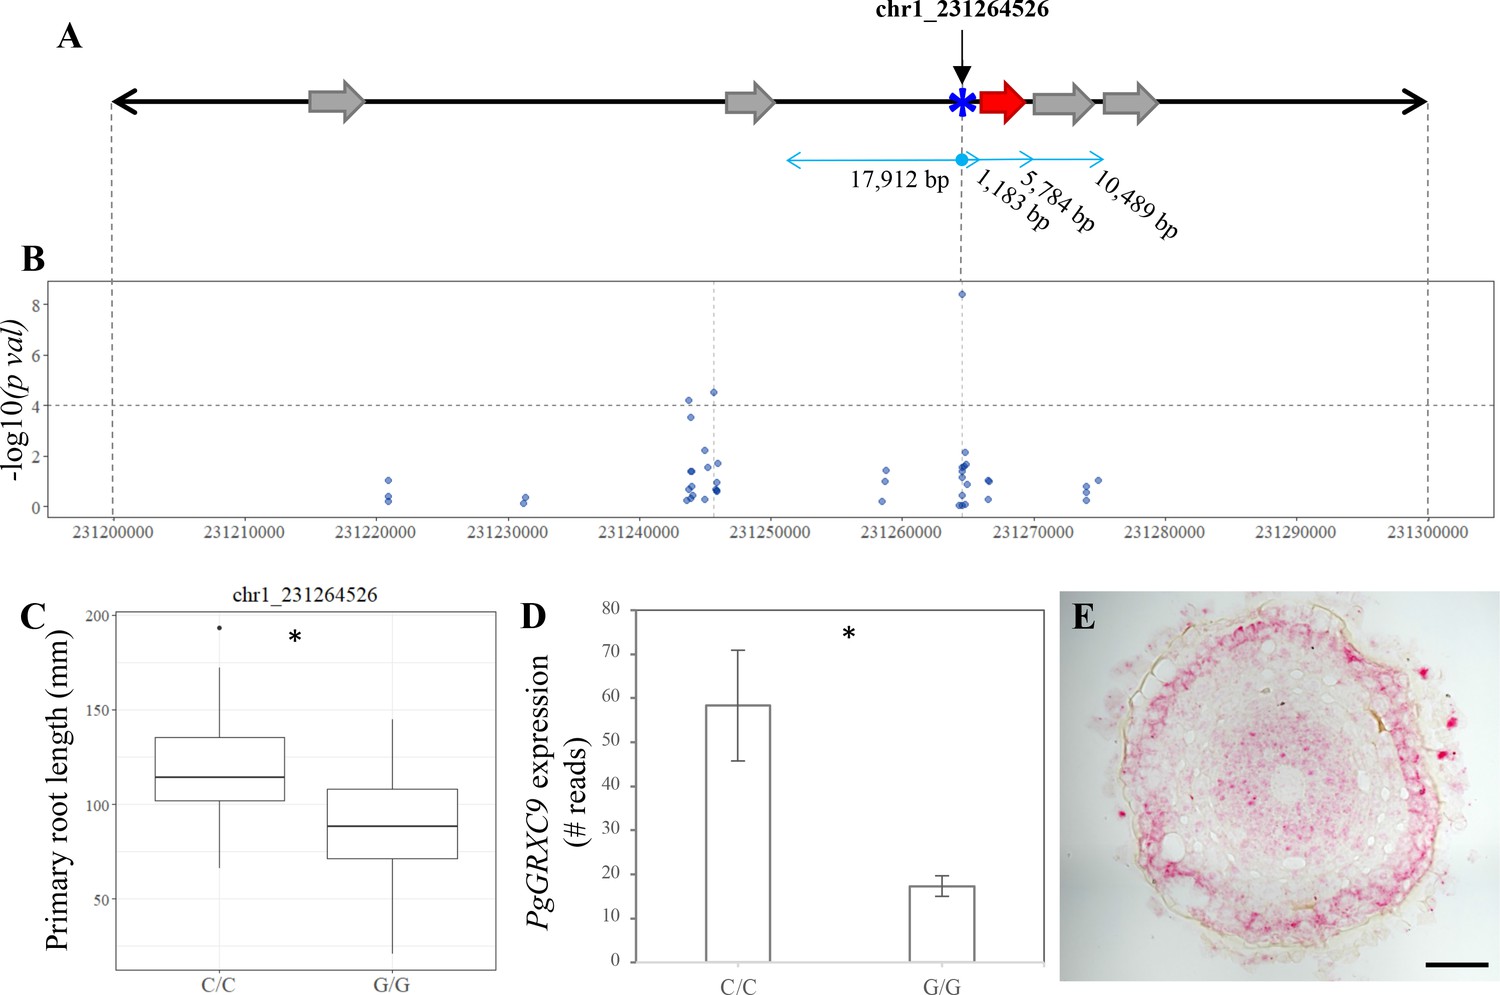
Identification of candidate genes for primary root length in pearl millet.
(A) Annotated genes in 100 kb region of chromosome 1 harboring significant SNPs identified by genome-wide association study (GWAS) and coincident with a bulk segregant analysis (BSA) significant region. Blue asterisk shows the position of the SNP with the most significant association. Gray arrows represent the predicted genes according to the reference genome (Varshney et al., 2017). The red arrow represents the new predicted gene, PgGRXC9, identified by re-annotation of the genomic interval using de novo pearl millet assembly based on contig sequences. (B) GWAS Manhattan plot in the 100 kb interval on chromosome 1. Dots represent the −log10 (pval) of the lfmm ridge statistic (y-axis) for the SNPs identified in the region. The dashed horizontal line shows the threshold for highly significant SNPs. Positions and physical distance between genes and markers are displayed in bp. (C) Primary root length phenotype associated to the allelic variants of the two significant SNPs in the region: chr1_231264526 (NC/C = 26, NG/G = 74). (D) Expression of PgGRXC9 for the two alleles from the RNAseq data. *p-value ≤0.01. (E) Transversal section in the elongation zone of a primary root showing the expression profile of PgGRXC9 as indicated by RNAscope. The localization of this section and the expression of PgGRXC9 in other part of the root is indicated in Figure 3—figure supplement 1. Scale bar = 50 mm.
Figure 3—figure supplement 1
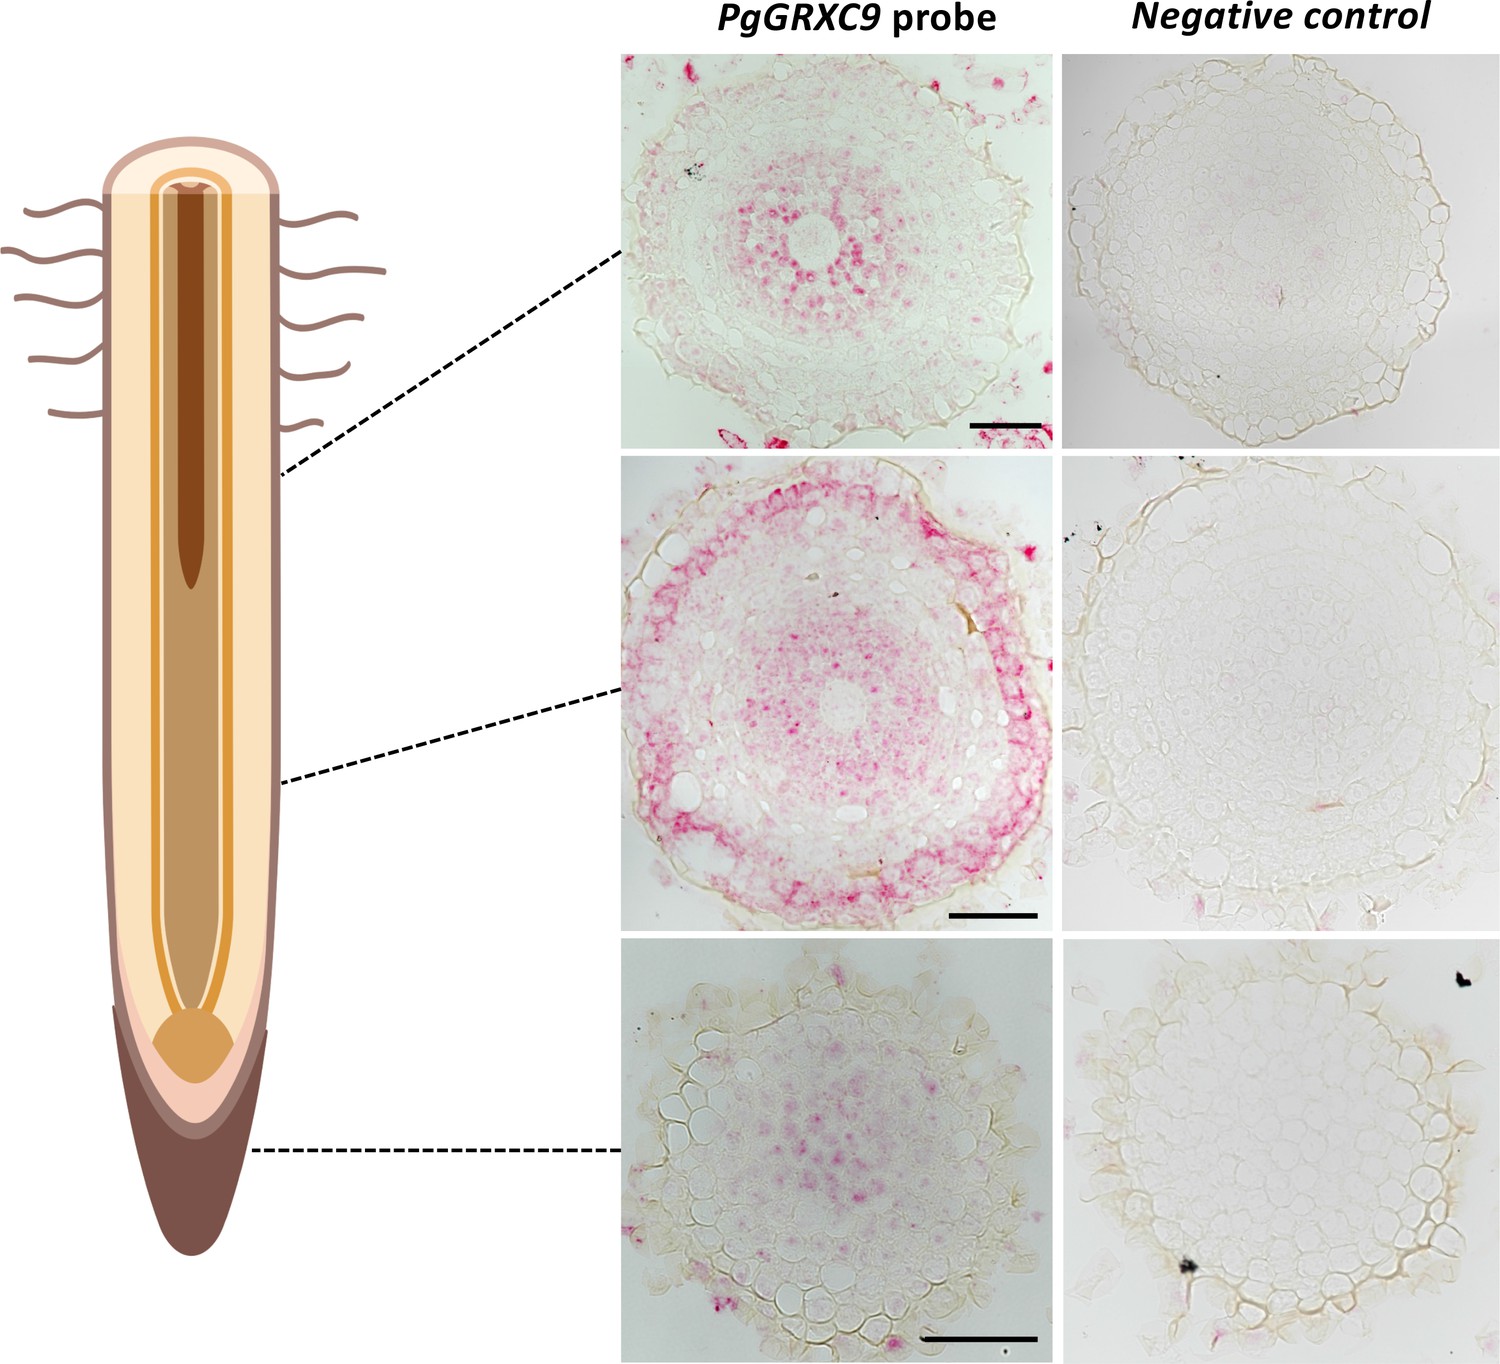
Expression pattern of PgGRXC9 in the root tip as revealed by RNAscope.
Transversal sections in the root cap, elongation zone, and mature zone of the root. Scale bars: 50 mm. Drawing created with https://www.biorender.com.
Figure 4 with 1 supplement
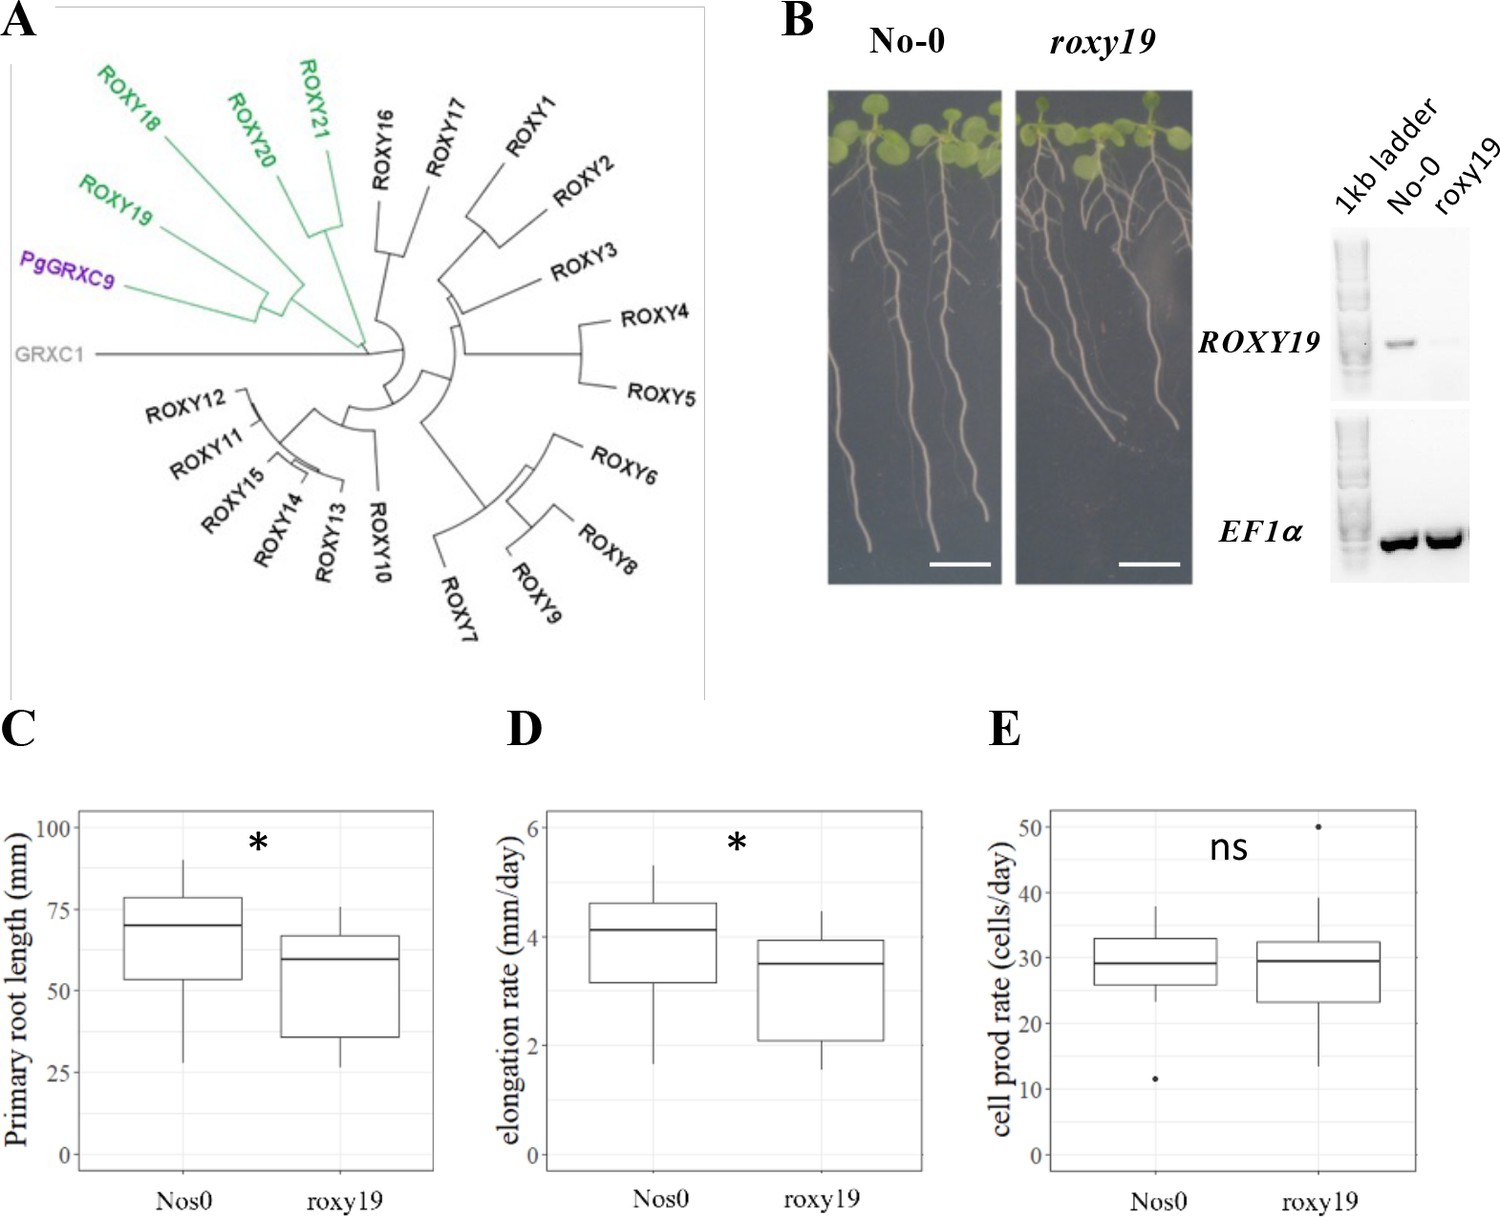
The Arabidopsis homolog of PgGRXC9 regulates root growth.
(A) Phylogenetic tree of ROXYs protein sequences. This tree has been obtained from pairwise alignments of all whole protein sequence pairs using the Neighbor-Joining method and Jukes–Cantor distance matrix. GRXC1 (gray), a member of Class I GRX, is used as the tree root. Arabidopsis ROXY18-21 are represented in green, and PgGRXC9 is represented in purple. (B) Contrasted primary root phenotype in Nos0 and roxy19 in 12-day-old seedlings grown in agar plates. Scale bar: 1 cm. (C) Primary root length, (D) cell elongation rate, and (E) estimation of the cell production rate assuming a steady root growth rate of Nos0 (N = 27) and roxy19 (N = 25) plants. *p-value ≤0.01, ns: not significant.
-
Figure 4—source data 1
ROXY19 and EF1a (control gene) expression detected by reverse transcription PCR in different Arabidopsis lines.
No ROXY19 expression was detected in the roxy19 mutant in contrast to the corresponding wild-type background.
- https://cdn.elifesciences.org/articles/86169/elife-86169-fig4-data1-v1.zip
Figure 4—figure supplement 1
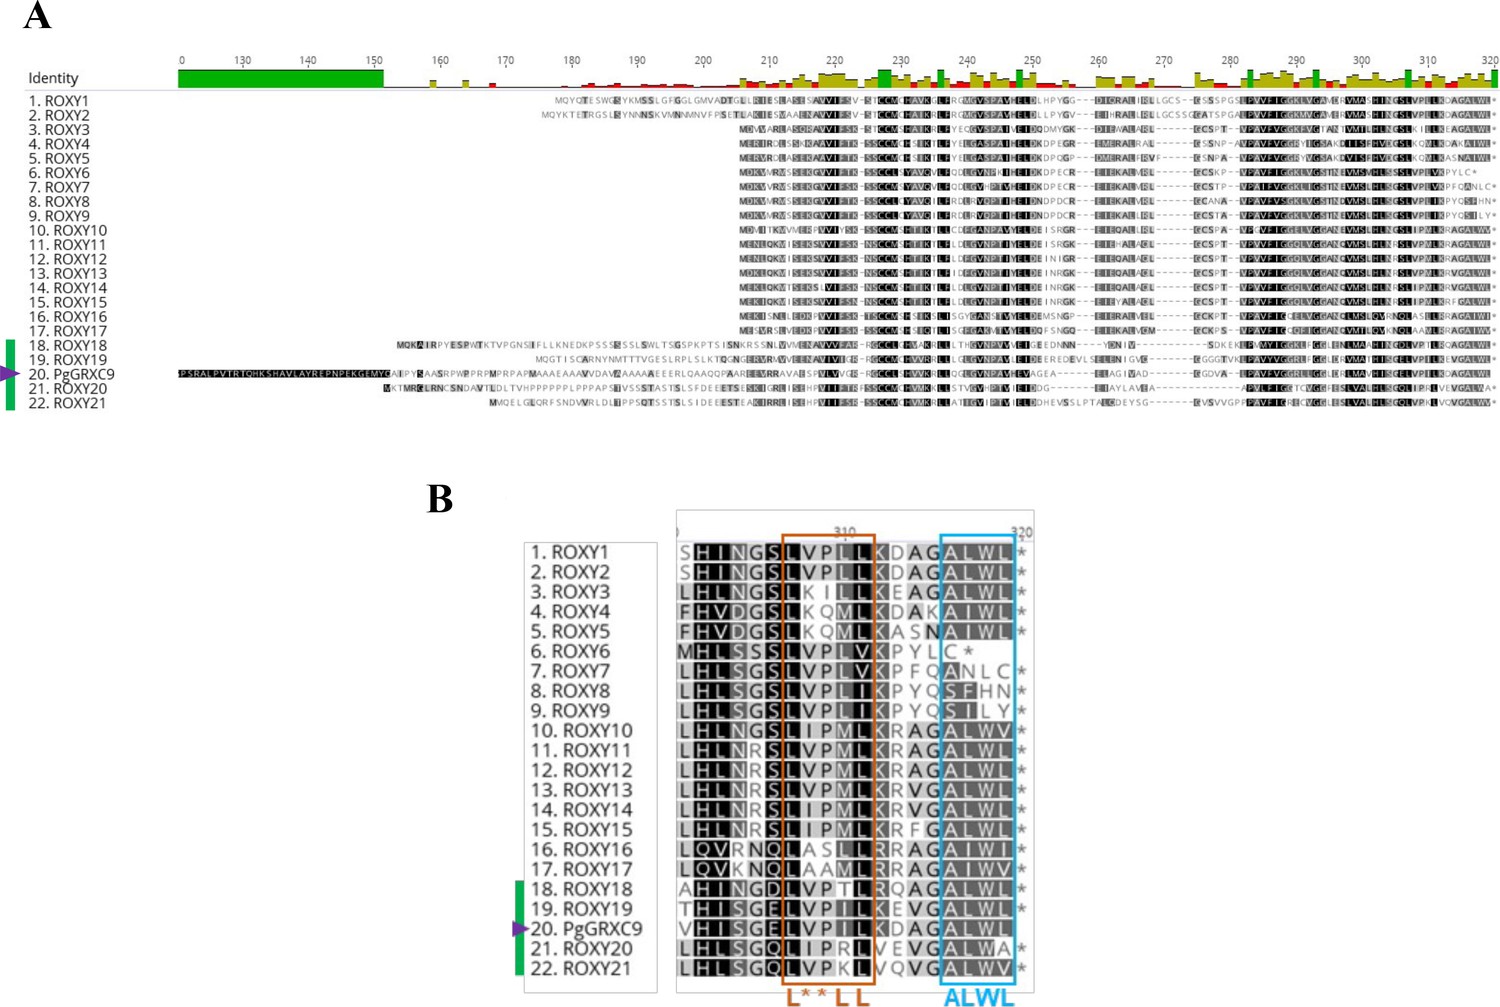
Protein alignment of PgGRXC9 and Arabidopsis ROXY members.
(A) Whole sequence alignment of PgGRXC9 and the 21 ROXY from A. thaliana. The first 120 N-terminal amino acids of PgGRXC9 are not represented in this alignment. (B) C-terminus alignment of ROXY proteins. This alignment displays the L**LL (orange) and the ALWL (light blue) C-terminal motifs, important for binding to TGA and TPL/TPR. The green bar and purple triangle indicate the ROXY18-21 Arabidopsis subclass and PgGRXC9, respectively.
Additional files
-
MDAR checklist
- https://cdn.elifesciences.org/articles/86169/elife-86169-mdarchecklist1-v1.docx
-
Supplementary file 1
Supplementary tables (Tables S1 to S5).
- https://cdn.elifesciences.org/articles/86169/elife-86169-supp1-v1.zip
Download links
A two-part list of links to download the article, or parts of the article, in various formats.
Downloads (link to download the article as PDF)
Open citations (links to open the citations from this article in various online reference manager services)
Cite this article (links to download the citations from this article in formats compatible with various reference manager tools)
Glutaredoxin regulation of primary root growth is associated with early drought stress tolerance in pearl millet
eLife 12:RP86169.
https://doi.org/10.7554/eLife.86169.3


