Decoding the genetic and chemical basis of sexual attractiveness in parasitic wasps
- Institute for Evolution & Biodiversity, University of Münster, Hüfferstr, Germany
Figures
Figure 1

Simplified overview of cuticular hydrocarbon (CHC) biosynthesis emphasizing fatty acid synthase (FAS) catalyzed reactions.
Initially, acetyl-Coenzyme A (CoA) is converted into malonyl-CoA by the enzyme Acetyl-CoA carboxylase (ACC). Then, further malonyl-CoA subunits are successively incorporated onto the acetyl-CoA primer to form long-chain fatty acids (LCFAs) catalyzed by fatty acid synthase enzymes hypothesized to be subcellularly located in the cytosol (c-FAS). For the synthesis of methyl-branched (MB)-CHCs with internal methyl groups, methyl-malonyl-CoA units are incorporated at specific chain locations instead of malonyl-CoA units, catalyzed by m-FAS enzymes whose subcellular location has been hypothesized to be microsomal. The MB or straight-chain LCFAs are then further processed through a series of biosynthetic conversions catalyzed by the elongase (ELO) enzyme complex, fatty acyl-CoA reductase (FAR) enzymes and cytochrome P450 decarboxylase (CYP4G) enzymes to either MB or straight-chain, saturated CHCs, respectively. For the biosynthesis of unsaturated CHCs (olefins), desaturase (DESAT) enzymes introduce double bonds into the fatty acyl-CoA chain between elongation steps. For a detailed description of CHC biosynthesis and the involved enzymatic reactions see Blomquist and Ginzel, 2021 as well as Holze et al., 2021.
Figure 2 with 4 supplements
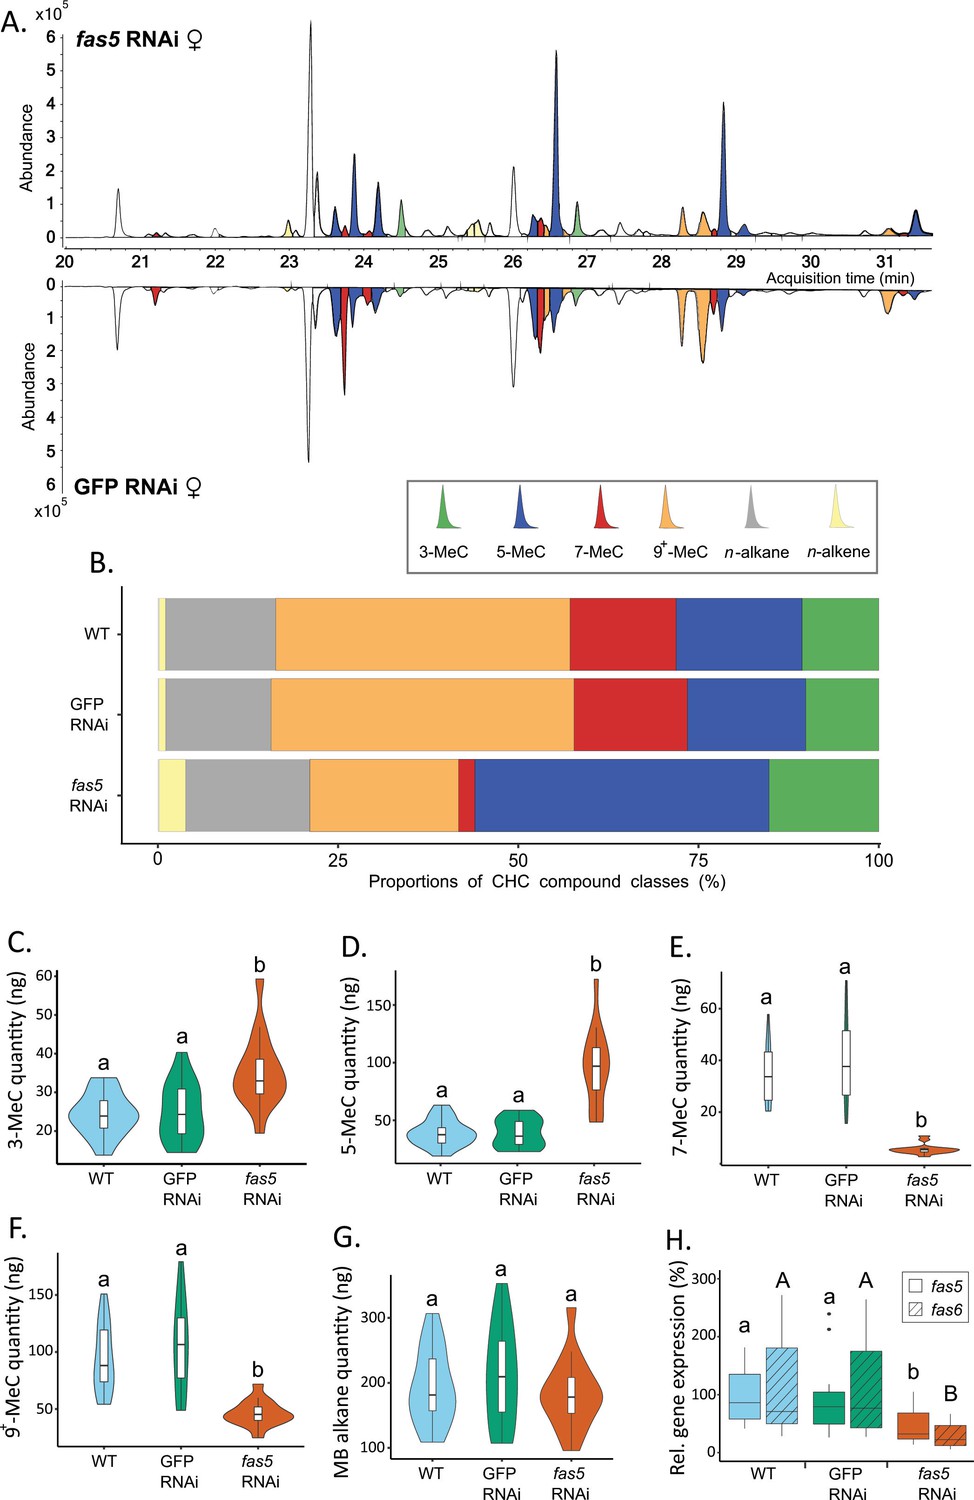
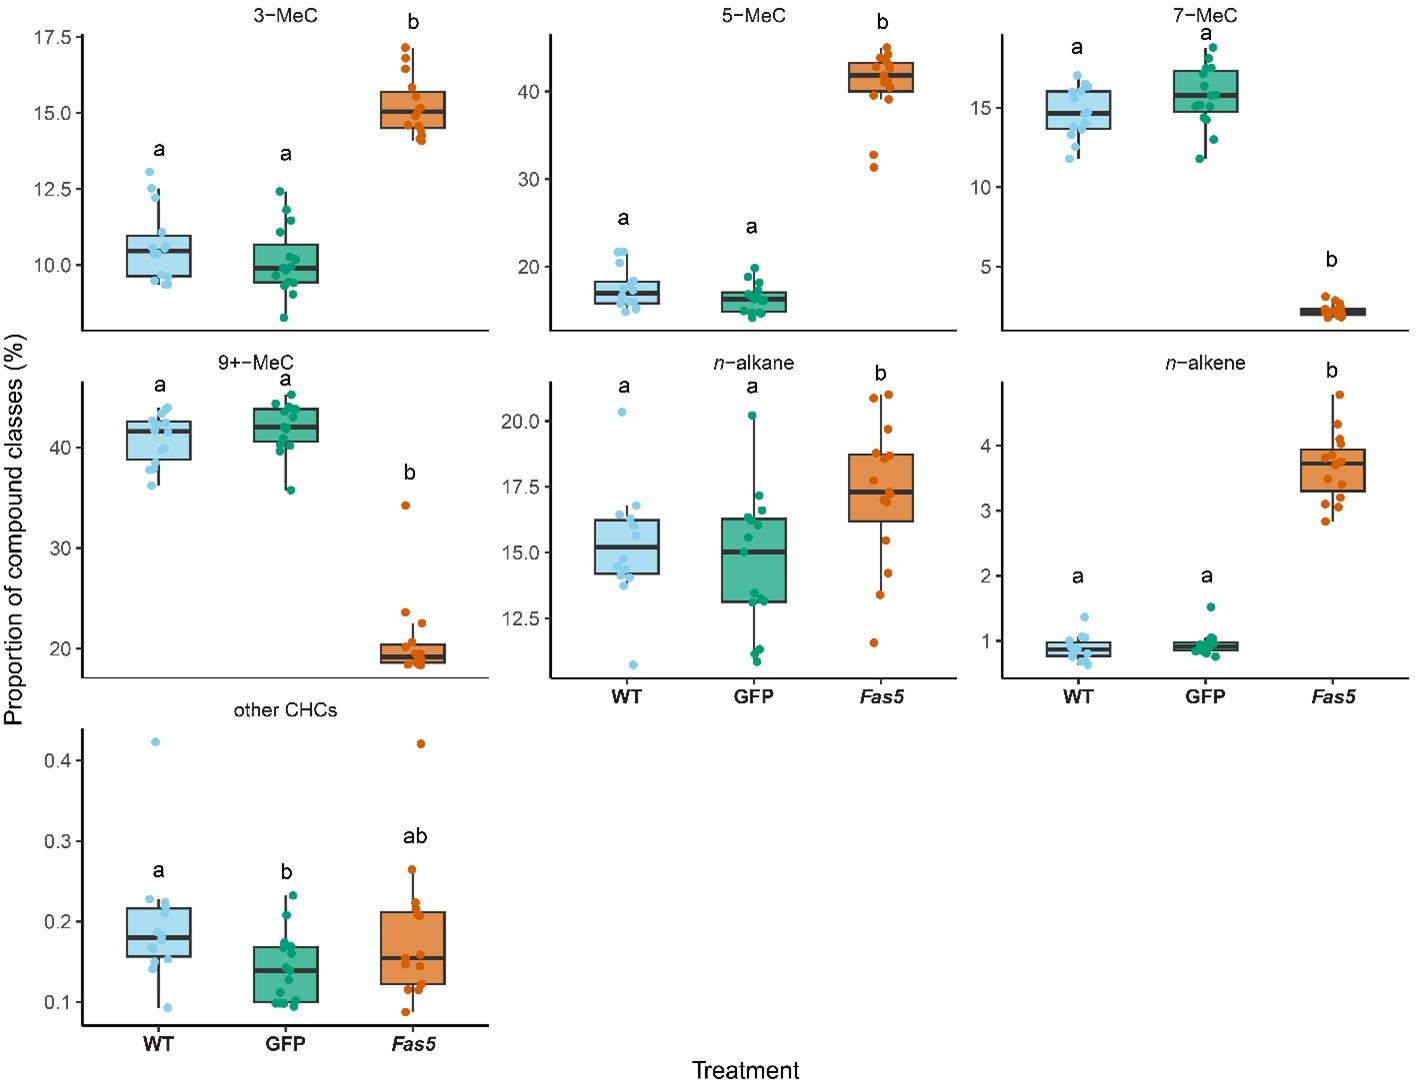
Fas5 knockdown primarily alters quantities and ratios of methyl-branched (MB) cuticular hydrocarbons (CHCs) with specific branching patterns in females.
(A) Chromatogram comparison of surface extracts from single female N. vitripennis wasps injected with fas5 dsRNA (top) and GFP (green fluorescent protein) dsRNA (bottom). CHC compound peaks with significantly different quantities in fas5 knockdown vs. GFP control females are indicated in color (compare to Supplementary file 3). Different colors are used for MB-alkanes with their first methyl group at positions 3-, 5-, 7-, and 9+ (also including positions 11-, 13-, and 15-) as well as n-alkanes and n-alkenes. (B) Average relative abundances (%) of different CHC compound classes (as indicated in A) compared between wild type (WT, N = 14), control knockdown (GFP, N = 15), and fas5 knockdown (fas5, N = 15) female wasps (sample sizes per group remain consistent from here on). (C) Average absolute quantities (in ng) of MB-alkanes with their first methyl group at the 3rd C-atom position (3-MeC) compared between wild type (WT), control knockdown (GFP) and fas5 knockdown (fas5) female wasps, indicated by blue, green, and orange violin plots, respectively (plot colors and group designations remain consistent from here on). (D) Average absolute quantities of MB-alkanes with their first methyl group at the 5th C-atom position (5-MeC) (E) Average absolute quantities of MB-alkanes with their first methyl group at the 7th C-atom position (7-MeC). (F) Average absolute quantities of MB-alkanes with their first methyl group at the 9th (as well as 11th, 13th, and 15th, indicated as 9+-MeC) C-atom position. (G) Average absolute quantities of total MB-alkanes. (H) Relative expression of fas5 (plain) and fas6 (hatched) in WT, GFP, and fas5 dsRNAi females (N = 15 for WT and fas5 RNAi; N = 16 for GFP RNAi), indicated by blue, green and orange boxplots, respectively. Significant differences (p < 0.05) were assessed with Benjamini–Hochberg corrected Mann–Whitney U-tests in (A) and (C)–(H) and are indicated by different letters, in (H) significant differences for fas5 expression vs. controls are indicated by lower case letters, and fas6 expression vs. controls by uppercase letters.
Figure 2—figure supplement 1
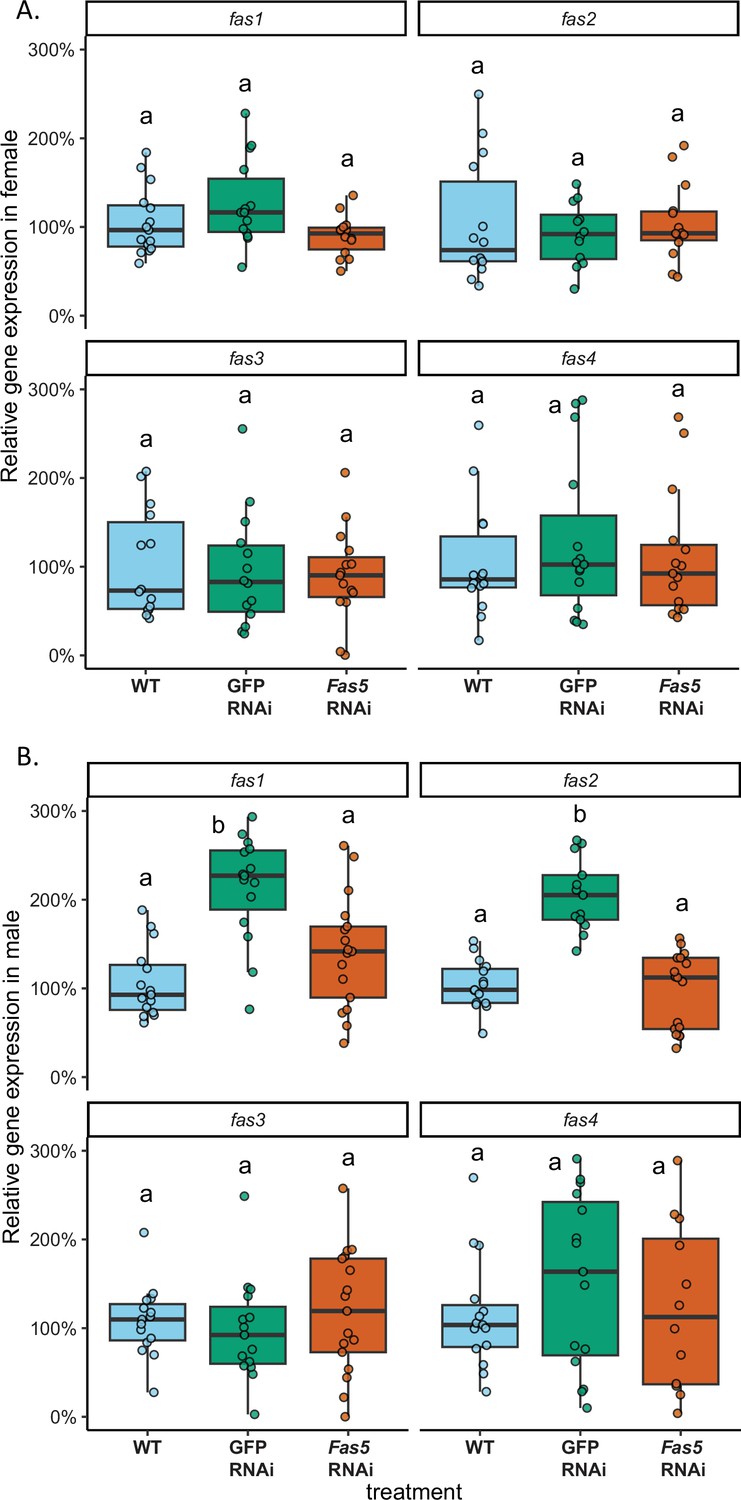
Fas5 knockdown does not affect the expressions of the previously published Nasonia vitripennis fas genes.
(A) Relative expression of fas1–4 in WT, GFP and fas5 RNAi females (N = 15 for WT and fas5 RNAi; N = 16 for GFP RNAi), indicated by blue, green, and orange boxplots, respectively. (B) Relative expression of fas1–4 in WT, GFP and fas5 RNAi males (N = 15 for WT and fas5 RNAi; N = 16 for GFP RNAi), indicated by blue, green, and orange boxplots, respectively. Significant differences (p < 0.05) were assessed with Benjamini–Hochberg corrected Mann–Whitney U-tests.
Figure 2—figure supplement 2

Fas5 is an adjunct to fas6 in the Nasonia vitripennis genome, exhibiting high sequence similarity.
(A) The physical locations of fas5 and fas6 are indicated in the N. vitripennis genome on scaffold NC_045761.1, which constitutes chromosome 5 of the most recent N. vitripennis genome assembly (Nvit_psr_1.1, GCF_009193385.2). Fas5 is precisely located from 21808178 to 21820384 bp (base pairs), while fas6 spans from 21821803 to 21833200 bp. The gene locations were visualized with the National Center for Biotechnology Information (NCBI) webpage. (B) Alignment between fas5 and fas6 transcripts. The identical sequences between fas5 transcript XM_008209455.4 and fas6 transcript XM_031931029.2 are indicated by a consistent gray bar, while single-nucleotide polymorphisms are indicated by the red lines inserted in the bar. Fas5 and fas6 transcripts share 92% query coverage and 90.95% sequence identity. The alignment of sequences was performed by the Basic Local Alignment Search Tool (BLAST) and visualized in Multiple Sequence Alignment Viewer 1.22.0 from NCBI.
Figure 2—figure supplement 3

Fas5 knockdown does not change total cuticular hydrocarbon (CHC) and n-alkane quantities but increases n-alkene quantities in females.
(A) Average absolute quantities (ng) of total extracted CHC, compared between wild type (WT, N = 14), control knockdown (GFP, N = 15), and fas5 knockdown (fas5, N = 15) N. vitripennis females, indicated by blue, green, and orange violin plots, respectively. (B) Average absolute quantities (ng) of the total n-alkanes from female CHC extracts, violin plot colors, and group designations as in A. (C) Average absolute quantities (ng) of the total amount of n-alkenes from female CHC extracts, violin plot colors, and group designations as in A. Significant differences (p < 0.05) were assessed with Benjamini–Hochberg corrected Mann-Whitney U-tests and are indicated by different letters.
Figure 2—figure supplement 4
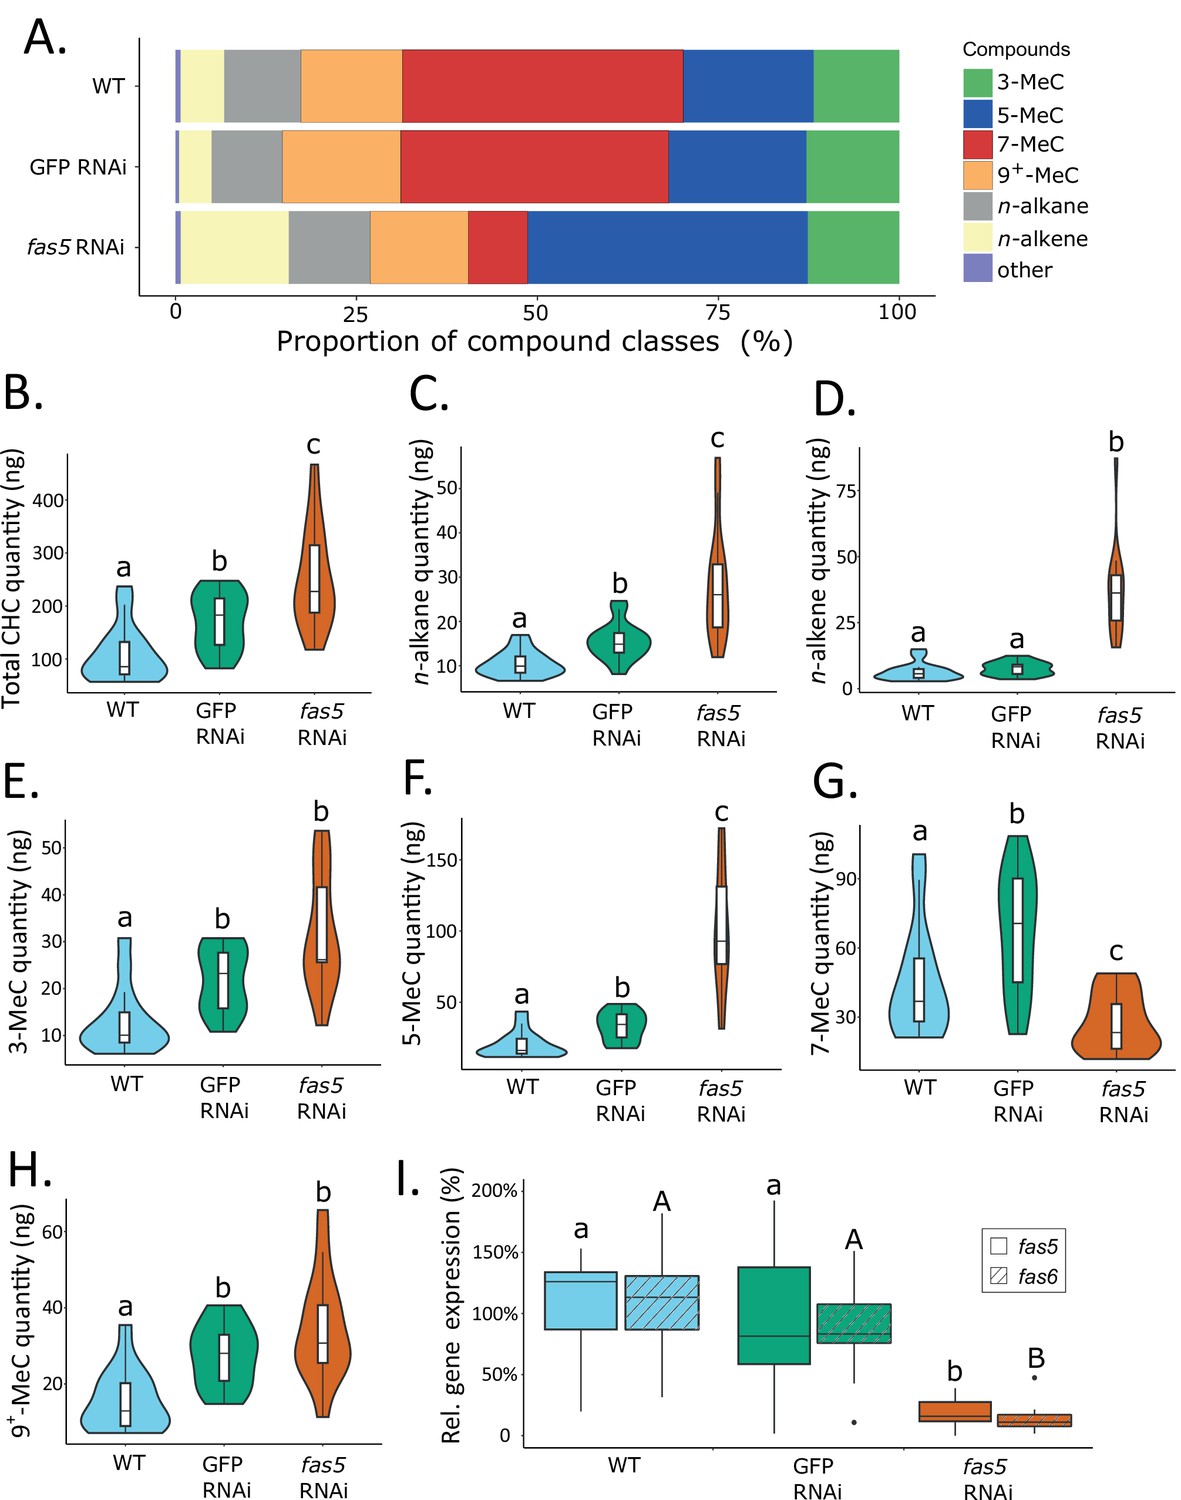
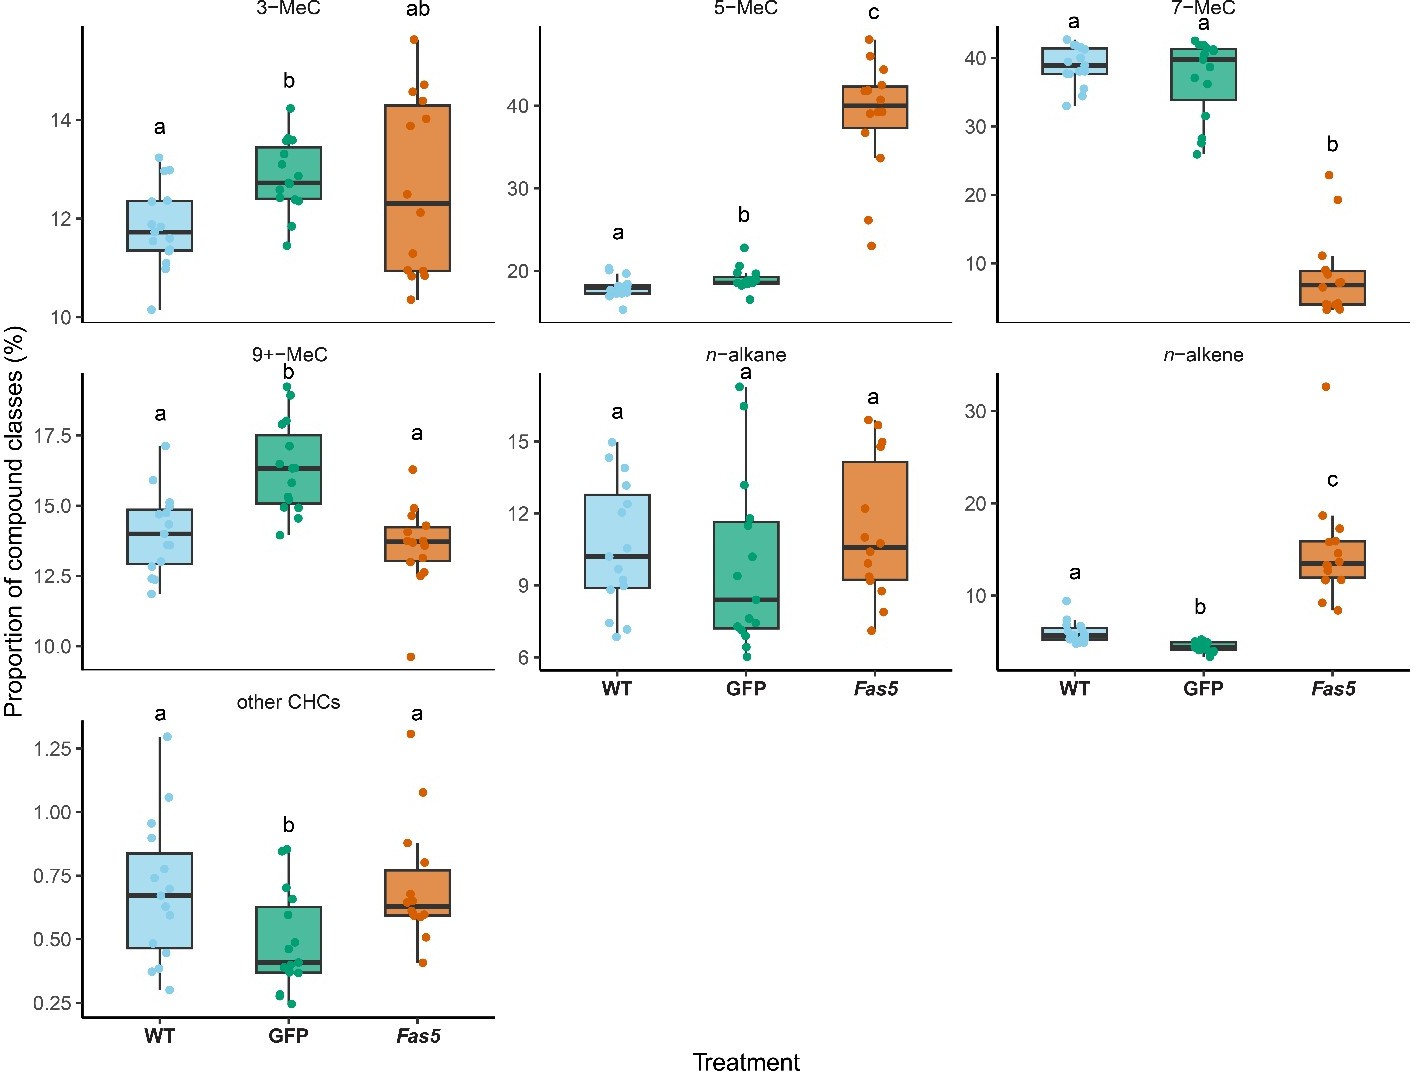
Fas5 knockdown increases total cuticular hydrocarbons (CHC) quantity and shifts the ratios of methyl-branched (MB) CHCs with specific branching patterns in males.
(A) Average relative abundances (%) of different CHC compound classes compared between wild type (WT, N = 15), control knockdown (GFP, N = 15), and fas5 knockdown (fas5, N = 14) male N. vitripennis wasps. Different colors are used for MB-alkanes with their first methyl group at positions 3-, 5-, 7-, and 9+ (also including positions 11-, 13-, and 15-) as well as n-alkanes and n-alkenes (compare to Figure 2B, sample sizes per group remain consistent from here on except for I). (B) Average absolute quantities (ng) of total CHC amounts, compared between wild type (WT), control knockdown (GFP), and fas5 knockdown (fas5) male wasps, indicated by blue, green, and orange violin plots, respectively (plot colors and group designations remain consistent from here on). (C) Average absolute quantities (ng) of total n-alkane amounts in male wasps, violin plot colors and group designations as in B. (D) Average absolute quantities (ng) of total n-alkene amounts in male wasps. (E) Average absolute quantities of MB-alkanes with their first methyl group at the 3rd C-atom position (3-MeC). (F) Average absolute quantities of MB-alkanes with their first methyl group at the 5th C-atom position (5-MeC). (G) Average absolute quantities of MB-alkanes with their first methyl group at the 7th C-atom position (7-MeC). (H) Average absolute quantities of MB-alkanes with their first methyl group at the 9th (as well as 11th, 13th, and 15th, indicated as 9+-MeC) C-atom position. (I) Relative expression of fas5 (plain) and fas6 (hatched) in WT, GFP, and fas5 RNAi males (N = 15 for WT and GFP RNAi; N = 17 for fas5 RNAi treatment), respectively. Significant differences (p < 0.05) were assessed with Benjamini–Hochberg corrected Mann–Whitney U-tests and are indicated by different letters (fas5 vs. controls: lower case letters, fas6 vs. controls: uppercase letters).
Figure 3
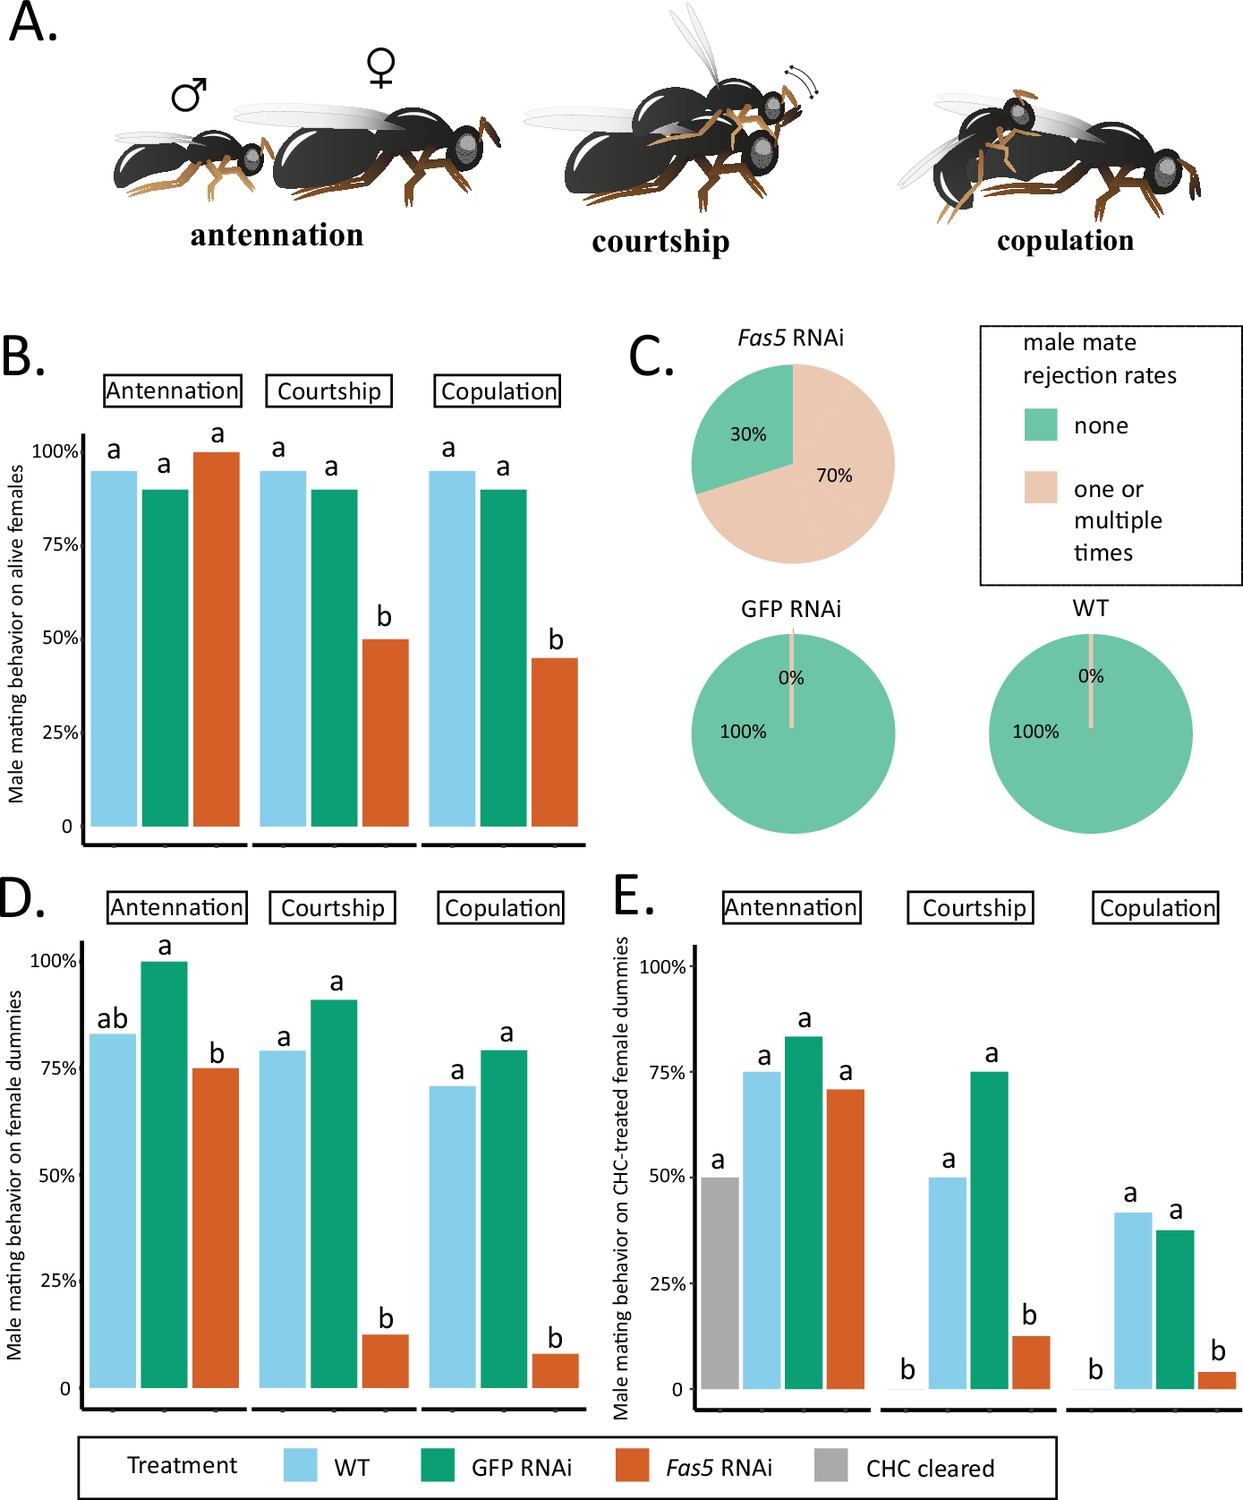
Fas5 knockdown females elicit less courtship and copulation behaviors from WT males.
(A) Depiction of consecutively displayed mating behavior of N. vitripennis males toward females, consisting of initial antennation, courtship (stereotypical head-nods on the female antennae after mounting), and actual copulation (injection of the male aedeagus into the female’s genital opening) (images by Quoc Hung Le). (B) The proportions of males performing antennation, courtship, and copulation toward alive WT, GFP, and fas5 RNAi females, which are marked by blue, green, and orange bar plots, N = 20 for each treatment. (C) Male mate rejection rates toward alive WT, GFP, and fas5 RNAi females, separated between no (light green) and one or multiple rejections (light orange). (D) The proportions of males performing antennation, courtship, and copulation toward freeze-killed WT, GFP, and fas5 RNAi females. Bar plot colors and group designations as in (B), N = 24 for each treatment. (E) The proportions of males performing antennation, courtship, and copulation toward either cuticular hydrocarbon (CHC) cleared (in gray) female dummies, or CHC cleared female dummies reconstituted with one female CHC profile equivalent from WT, GFP, and fas5 RNAi females. Other treatment colors and group designations as in (B) and (D), N = 24 for each treatment. Significant differences (p < 0.05) were assessed with Benjamini–Hochberg corrected Fisher’s exact tests in (B), (D) – (E) and are indicated by different letters, separated for each male mating behavior category.
Figure 4
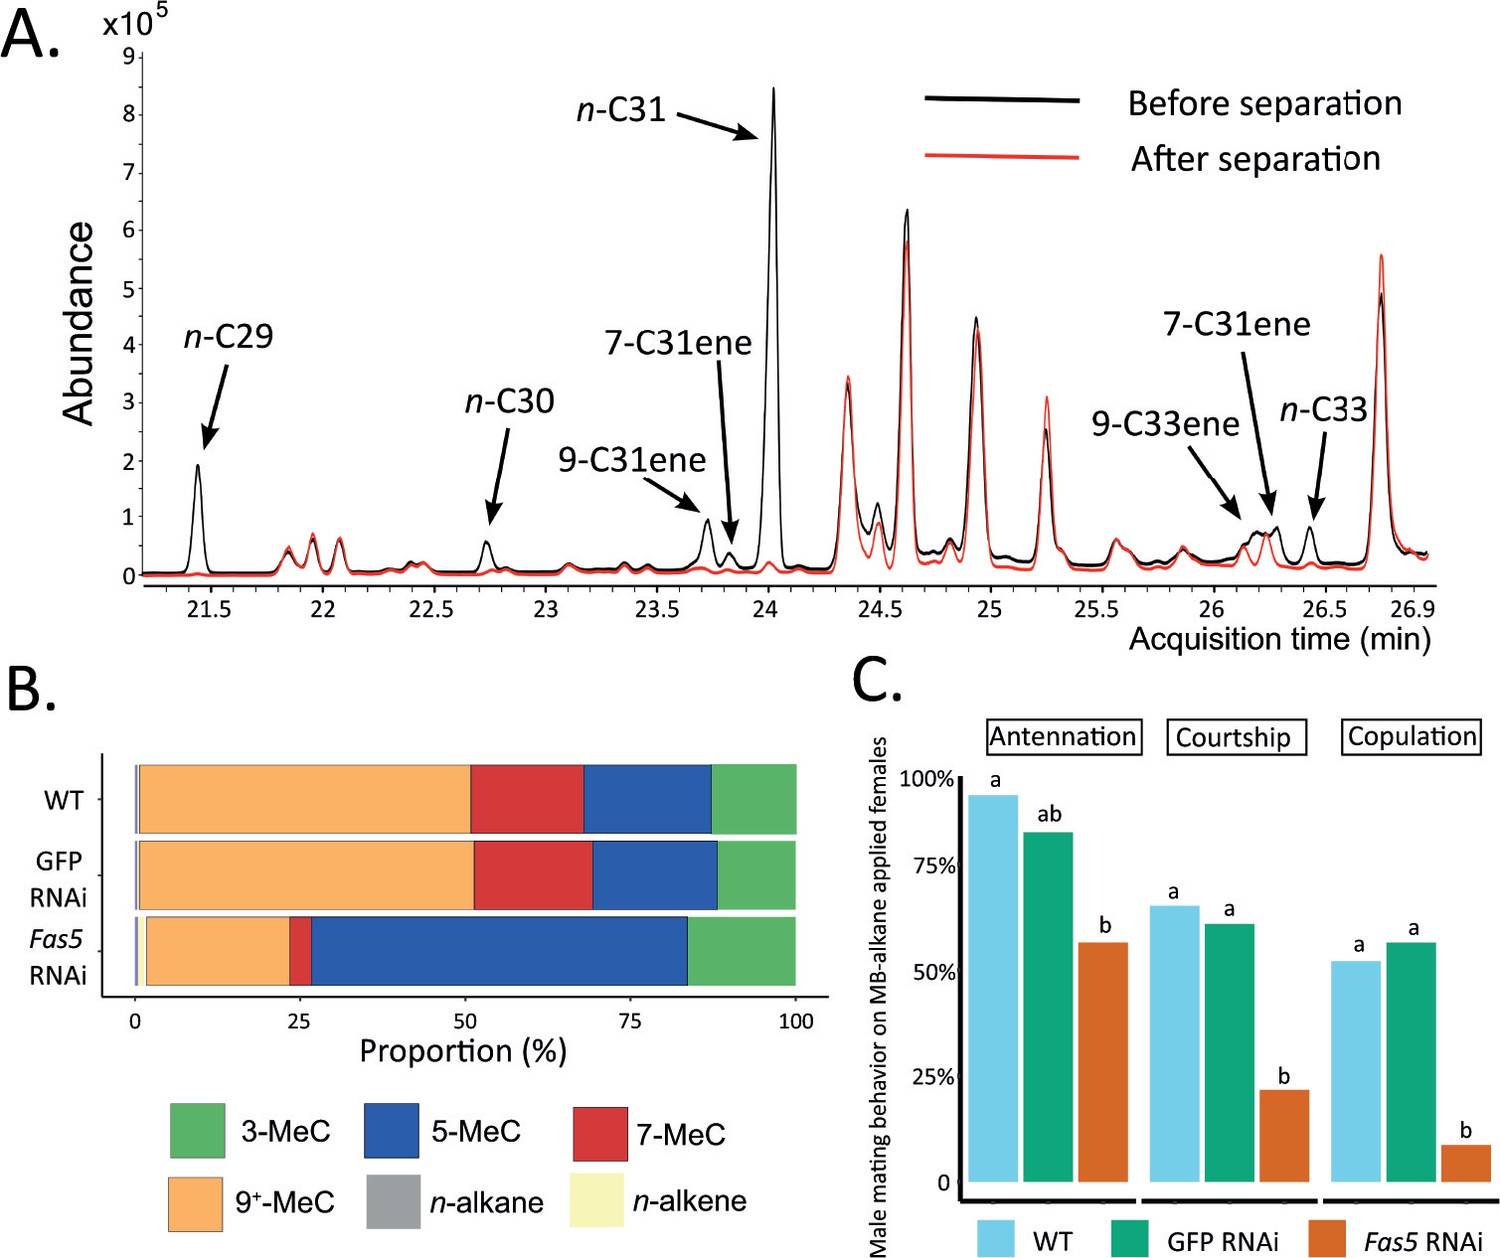
Methyl-branched (MB) alkane fraction from fas5 RNAi females elicits less courtship and copulation from WT males.
(A) Chromatogram comparison of representative fas5 RNAi female cuticular hydrocarbon (CHC) profiles before (in black) and after (in red) physical separation of the MB-alkane fraction from the other compound classes (n-alkanes and n-alkenes). Individual n-alkane and n-alkene compound peaks are indicated by arrows (all other peaks correspond to MB-alkanes). Note that only the part of the Nasonia CHC profile where n-alkane and n-alkene compounds do occur is shown (compare to Figure 1A). (B) Average relative abundances (%) of different compound classes, including MB-alkanes with their first methyl group at positions 3-, 5-, 7-, and 9+ (also including positions 11-, 13-, and 15-) as well as n-alkanes and n-alkenes, compared between wild type (WT, N = 3), control knockdown (GFP, N = 3), and fas5 knockdown (fas5, N = 3) individuals. (C) The proportions of males performing antennation, courtship, and copulation toward CHC cleared female dummies reconstituted with approximately one female equivalent of MB-alkane fractions derived from WT (in blue, N = 23), GFP (in green, N = 23), and fas5 RNAi (in orange, N = 24) females. Significant differences (p < 0.05) were assessed with Benjamini–Hochberg corrected Fisher’s exact tests in (C) and are indicated by different letters, separated for each male mating behavior category.
-
Figure 4—source data 1
Methyl-branched (MB) alkane separation process dramatically decreases n-alkane and n-alkene quantities .
The average relative abundances (%) of overall MB-alkanes, n-alkanes, and n-alkenes in fas5 RNAi female cuticular hydrocarbon (CHC) profiles before and after separation of the MB-alkane fraction from the other compound classes. N = 3 for each treatment.
- https://cdn.elifesciences.org/articles/86182/elife-86182-fig4-data1-v2.xlsx
Figure 5

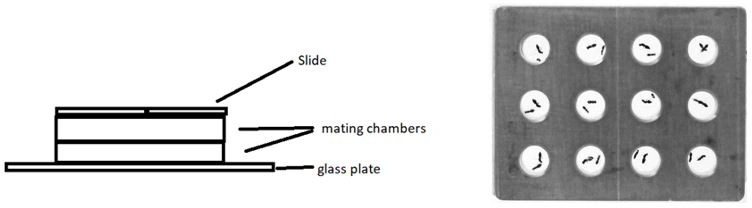
Fas5 knockdown does not change survival times of male and female wasps under desiccation stress.
(A) Comparison of survival probabilities along the observation time under high desiccation stress between control knockdown (GFP RNAi) and fas5 knockdown (fas5 RNAi) females. (B) Comparison of survival probabilities along the observation time under medium desiccation stress between GFP RNAi and fas5 RNAi females. (C) Comparison of survival probabilities along the observation time under high desiccation stress between GFP RNAi and fas5 RNAi males. (D) Comparison of survival probabilities along the observation time under medium desiccation stress between GFP RNAi and fas5 RNAi males. N = 10 for each treatment. The high desiccation stress treatment was achieved with approximately 9% relative humidity, and the medium desiccation stress treatment with approximately 55% relative humidity as assessed by humidity–temperature probes. Survival probability was assessed with a Cox regression Analysis, and the colored area along the survival curve represents the 95% confident interval.
Author response image 1
Author response image 2
Author response image 3
Author response image 4
Author response image 5
Additional files
-
Supplementary file 1
List of primers used in the present study.
All primers were designed using the Primer-BLAST tool from the National Center for Biotechnology Information (NCBI). Indicated are the respective primer names, their sequences, and their usage in the experimental protocol.
- https://cdn.elifesciences.org/articles/86182/elife-86182-supp1-v2.docx
-
Supplementary file 2
Gene names, gene IDs, and transcript IDs of all fas genes and the housekeeping gene (elongation factor 1a) from the present study.
Note that there are two transcript IDs for fas6 (compare to Figure 2—figure supplement 2).
- https://cdn.elifesciences.org/articles/86182/elife-86182-supp2-v2.docx
-
Supplementary file 3
Comparison of absolute quantities and relative abundances of single cuticular hydrocarbon (CHC compounds between differentially treated female wasps).
Indicated are retention indices (RI), CHC compound identifications or possible configurations in case of ambiguities, their mean absolute (ng) amounts with their respective absolute standard deviations (sd) as well as their respective relative amounts (in %) compared between wild type (WT, N = 14), control knockdown (GFP RNAi, N = 15), and fas5 knockdown (fas5 RNAi, N = 15) female wasps. To compare the absolute quantities (ng) of 54 single CHC compounds among the different treatments, we employed a sequential Benjamini–Hochberg corrected Mann–Whitney U-test between each pair of treatments: fas5 vs. GFP, fas5 vs. WT, and GFP vs. WT. Significant effects in fas5 knockdown (KD) females are indicated by up- (white) and downwards (black) arrows, corresponding to either up- or downregulation of the absolute compound quantities, respectively. Where compound identifications were ambiguous due to multiple possible methyl-branch positions based on the detected ion pairs, all possible compound configurations are given.
- https://cdn.elifesciences.org/articles/86182/elife-86182-supp3-v2.docx
-
MDAR checklist
- https://cdn.elifesciences.org/articles/86182/elife-86182-mdarchecklist1-v2.pdf
Download links
A two-part list of links to download the article, or parts of the article, in various formats.
Downloads (link to download the article as PDF)
Open citations (links to open the citations from this article in various online reference manager services)
Cite this article (links to download the citations from this article in formats compatible with various reference manager tools)
Decoding the genetic and chemical basis of sexual attractiveness in parasitic wasps
eLife 12:e86182.
https://doi.org/10.7554/eLife.86182


