Impairment of lipid homeostasis causes lysosomal accumulation of endogenous protein aggregates through ESCRT disruption
- Calico Life Sciences LLC, United States
Figures
Figure 1 with 1 supplement
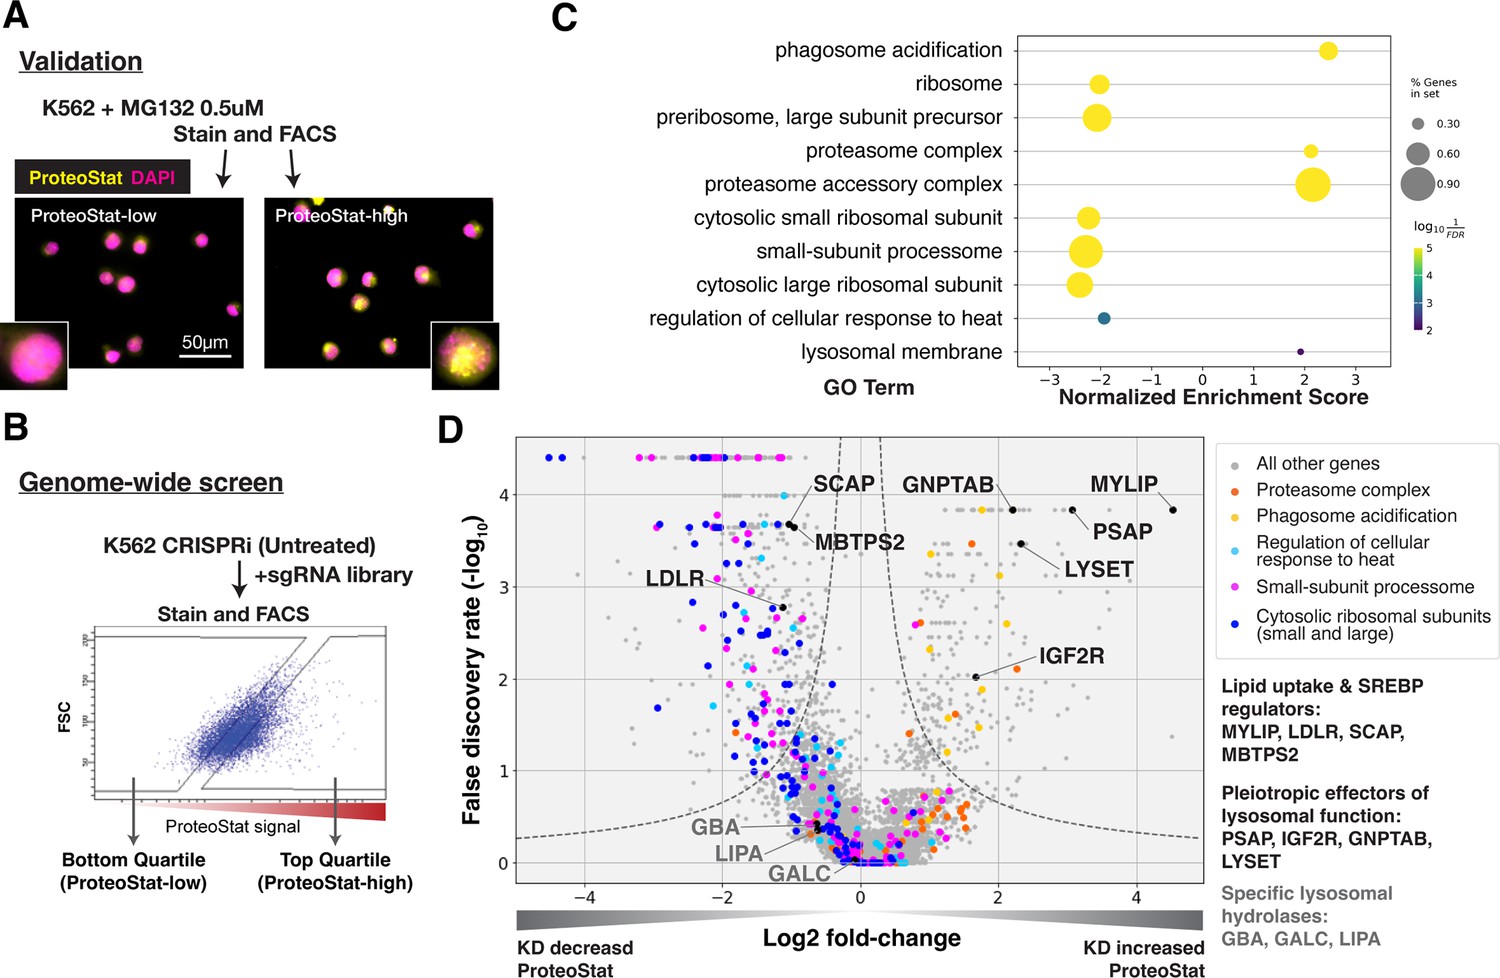
CRISPRi screens identified major cellular proteostasis components and implicated lipid uptake and metabolism pathways.
(A) ProteoStat validation: MG132-treated cells were stained, sorted into top and bottom quartiles (ProteoStat-high and ProteoStat-low, respectively), and imaged. (B) CRISPRi screen schematic: Untreated K562 cells were infected with sgRNA library, selected, stained, and sorted using gates that corrected for correlation between staining intensity and cell size. (C) A subset of GO Terms (Biological Process and Cellular Component) identified with GSEA on screen results. Positive Enrichment scores indicate an increased likelihood of genes in the GO Term to increase ProteoStat when knocked down. (D) Volcano plot highlighting major proteostasis pathways and select genes involved in lipid uptake and metabolism. Dotted line denotes where the product of |log2(fold-change)| and -log10(False discovery rate) is constant and equals to 1*-log10(0.05).
-
Figure 1—source data 1
CRISPRi ProteoStat screen MAGeCK analysis combining inputs from two biological replicates; gene-level output.
Depicted in Figure 1C–D.
- https://cdn.elifesciences.org/articles/86194/elife-86194-fig1-data1-v1.txt
Figure 1—figure supplement 1
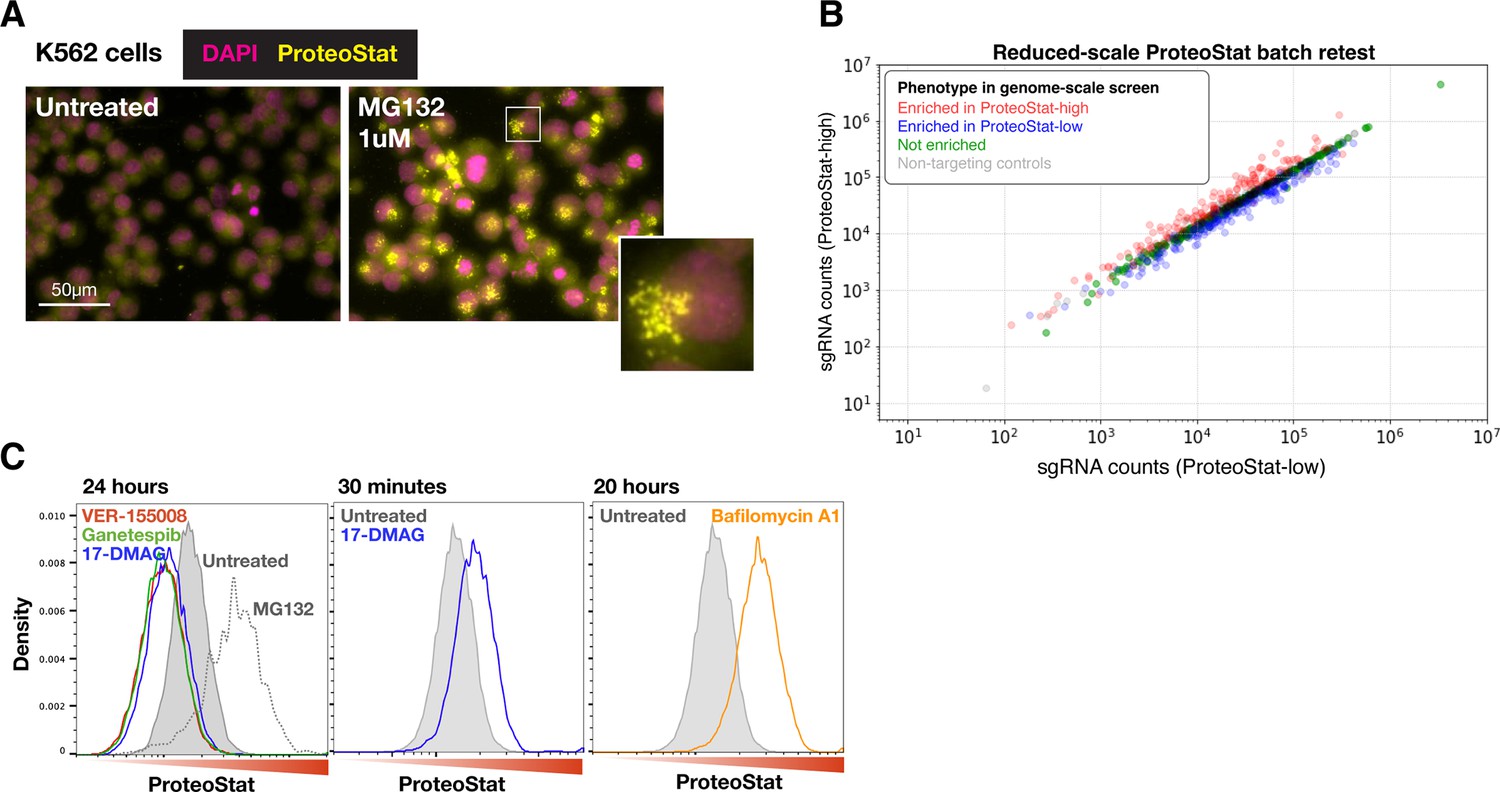
ProteoStat screen validation: reagent, reduced-scale batch retest, and chaperone test.
(A) K562 cells treated with MG132 at 1 µM for 20 hr were stained with ProteoStat and imaged. Images with untreated and treated cells are shown here with the same grayscale. Inset: enlarged image of a single cell showing perinuclear ProteoStat punctates in MG132-treated cells. (B) Results of a reduced-scale batch retest to validate the effect of select sgRNAs from the genome-wide screen. Sequencing counts of each sgRNA in the FACS-sorted ProteoStat-high vs ProteoStat-low populations are shown. sgRNAs selected include ones that were enriched in the ProteoStat-high (red) and ProteoStat-low (blue) populations, or showed no enrichment (green) in the genome-wide screen, as well as non-targeting sgRNAs (gray) for normalization. (C) Effects of pharmacological inhibition of proteasome (MG132, 1 µM), lysosomal acidification (Bafilomycin A1, 6.25 µM), and chaperones (VER-155008, 50 µM; Ganetespib, 100 nM; 17-DMAG, 1 µM; n=1) on ProteoStat staining in K562 cells after the specified treatment durations.
-
Figure 1—figure supplement 1—source data 1
CRISPRi ProteoStat batch retest sgRNA counts depicted in Figure 1—figure supplement 1B.
- https://cdn.elifesciences.org/articles/86194/elife-86194-fig1-figsupp1-data1-v1.txt
Figure 2 with 2 supplements
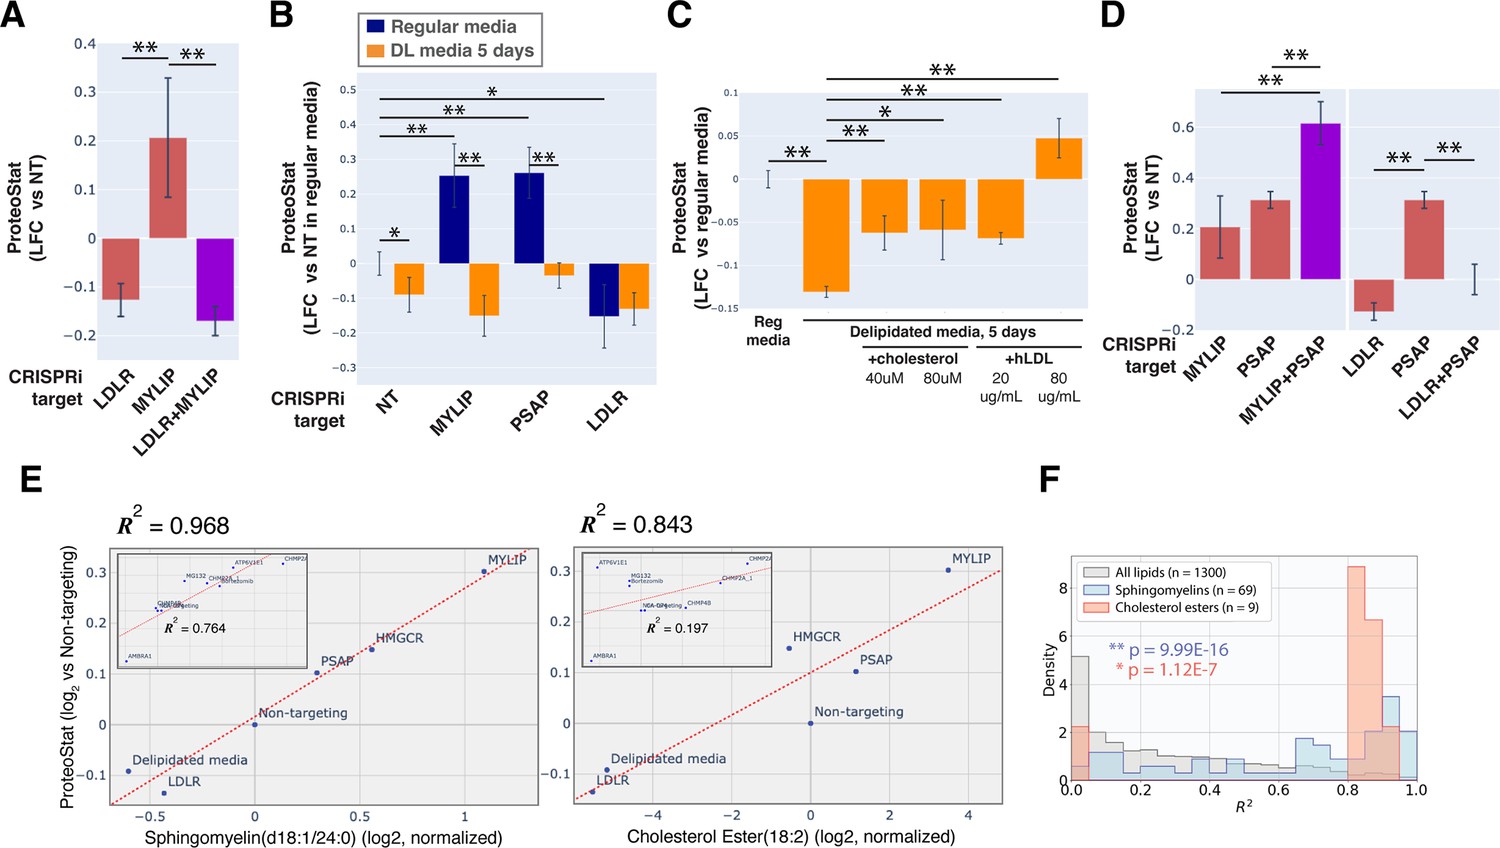
Accumulation of sphingolipid and cholesterol ester can impair proteostasis.
(A & D) Comparing effects on ProteoStat of single vs double KDs (n≥2) (B) Effects of gene KDs on ProteoStat in cells maintained in media with regular or delipidated FBS (DL media). (n=3) (C) Effects of supplementing free cholesterol or human LDL in restoring ProteoStat, which was lowered in cells grown in DL media (n=3). Phenotypes in A-D were normalized first to an internal staining control, and then to cells carrying non-targeting guides. (✻: p<0.05; ✻✻: p<0.01; t-test between pairs of samples as indicated with horizontal lines). (E) ProteoStat vs abundance of indicated lipid species in cells with KD of a core set of lipid-related target genes, or including other ProteoStat perturbing genes (insets). Both ProteoStat and lipid abundance are averages of biological triplicates and normalized to cells carrying non-targeting guides. Least squares linear regression models (dotted red lines) were generated and the Coefficient of determination, R2, values are shown. (F) Histograms of R2 values for all lipid species within each indicated lipid class as in E. p-values were calculated using K-S test comparing R2 values within each lipid class versus that of all lipids. The number of individual lipid species analyzed is indicated for each lipid class.
-
Figure 2—source data 1
Lipidomics results and ProteoStat phenotype depicted in Figure 2E–F.
Data are in log and normalized to control with non-targeting sgRNA.
- https://cdn.elifesciences.org/articles/86194/elife-86194-fig2-data1-v1.txt
Figure 2—figure supplement 1
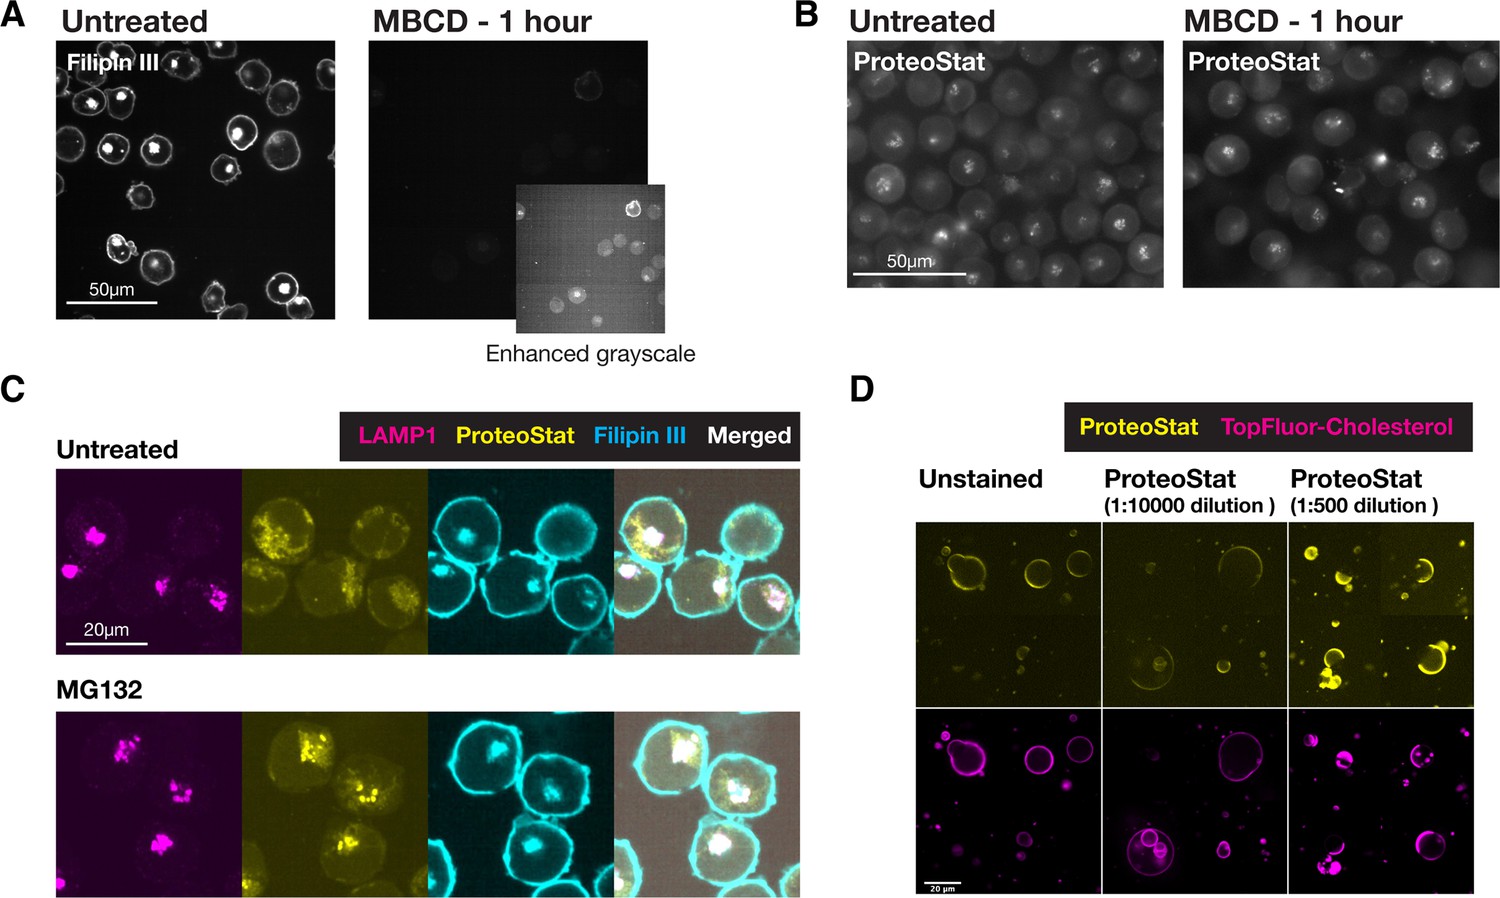
ProteoStat does not directly stain cholesterol nor major components of the plasma membrane.
(A & B) Filipin III (A) and Proteostat (B) staining on K562 cells that were untreated or MBCD-treated to remove cholesterol. Same grayscale was used for each pair of images in the main panels, where an additional Filipin III image of the MBCD-treated cells was shown at enhanced-grayscale to expose the minimal filipin III staining on these cells. (C) Co-staining K562 cells (untreated or MG132-treated) against LAMP1 and with ProteoStat and Filipin III. (D) Biphasic GUVs with cholesterol-poor and cholesterol-rich phases were generated, which included TopFluor Cholesterol to label the cholesterol-rich phases. These GUVs were stained with ProteoStat at two concentrations – low (1:10000 diluted, as used in all other experiments, including FACS-based screen) and high (1:500 diluted). Unstained samples were included to assess background fluorescence in the ProteoStat channel.
Figure 2—figure supplement 2
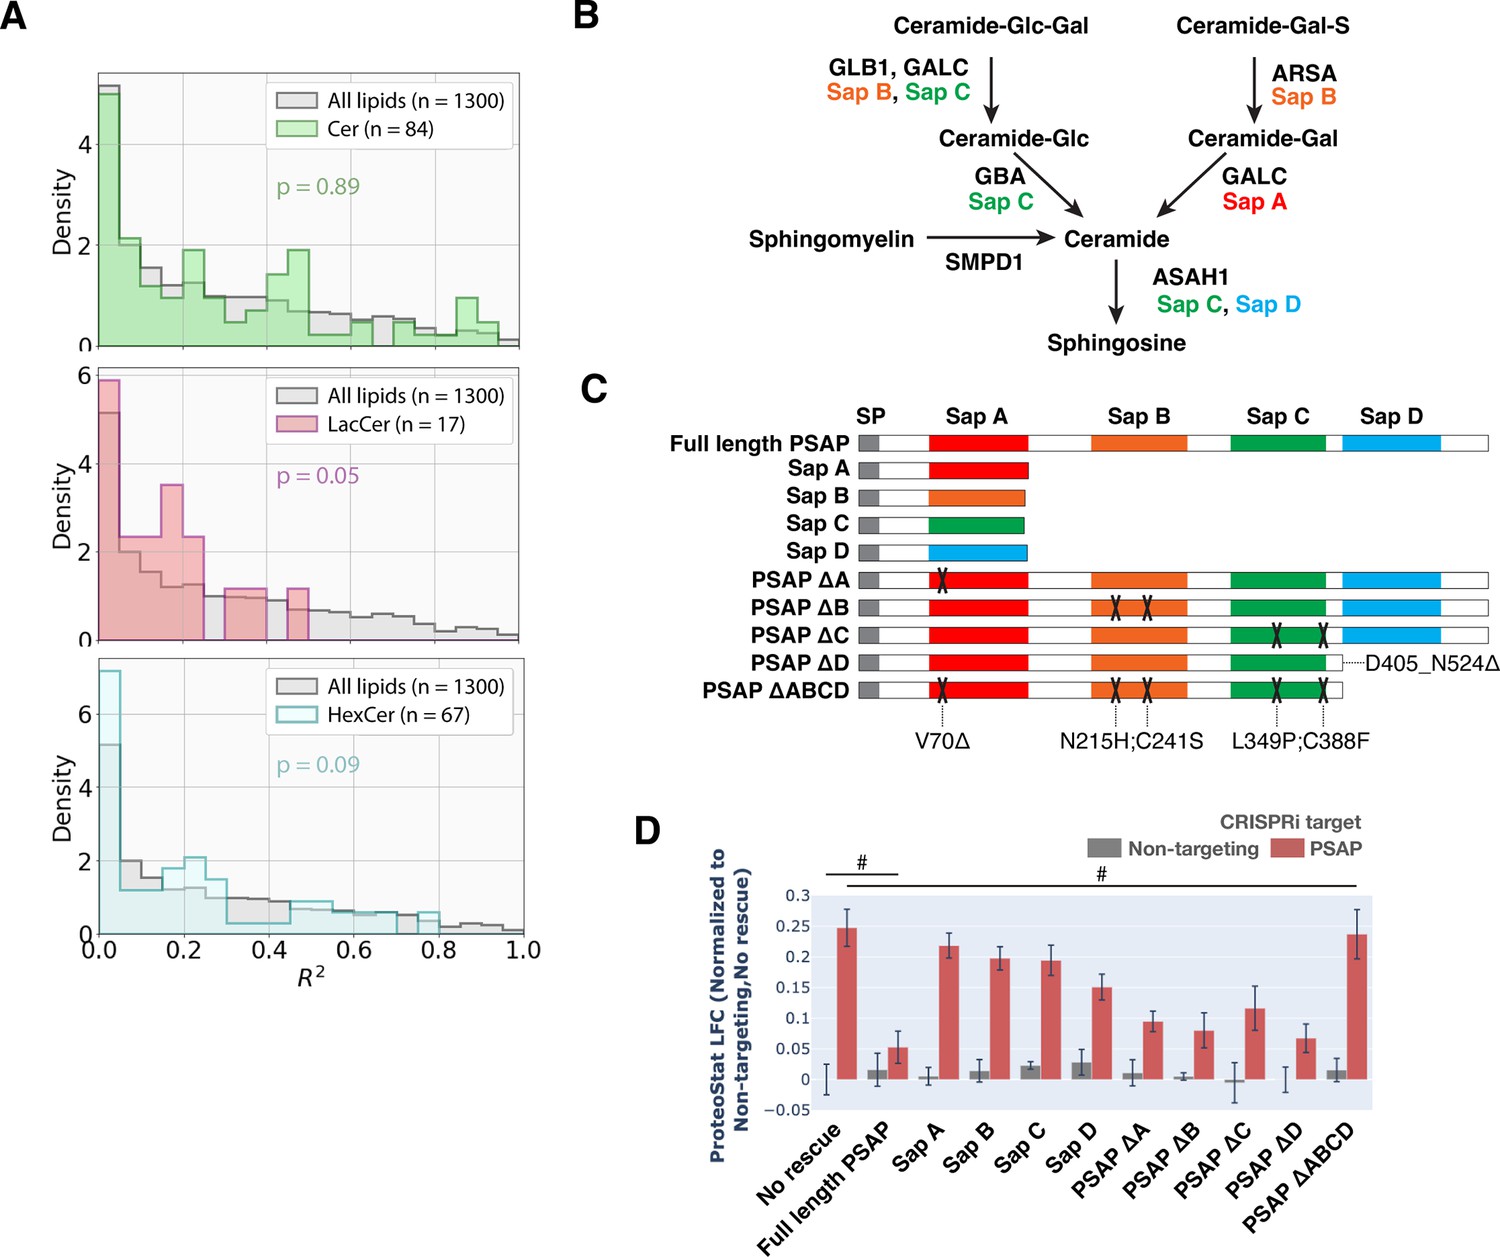
Example of lipid classes whose levels do not correlate with ProteoStat, and investigating the effects of perturbing individual saposins on ProteoStat.
(A) Histograms of R2 values obtained for all lipid species within each indicated lipid class – ceramides (Cers), lactosylceramides (LacCers), or hexosylceramides (HexCers) – using linear regression models generated from the ProteoStat phenotypes vs lipid abundances, as in Figure 2E. p-values were calculated using K-S test comparing R2 values within each lipid class versus that of all lipids. The number of individual lipid species analyzed is indicated for each lipid class. (B) Excerpt of hydrolytic pathway of a few sphingolipid species, their catalytic enzymes, and associated activating Saps. (C) Schematic of the series of constructs expressing different variations of PSAP (full-length, truncated, carrying mutations deleterious to individual Sap peptides, or individual functional Sap peptides alone). Colored boxes depict individual Sap peptides. Deleterious mutations are depicted by X’s on the corresponding Sap peptide. (D) ProteoStat phenotypes in cells overexpressing various PSAP variants in E, in conjunction with either PSAP KD or non-targeting control (n=3, #: p>0.05; t-test).
Figure 3 with 2 supplements
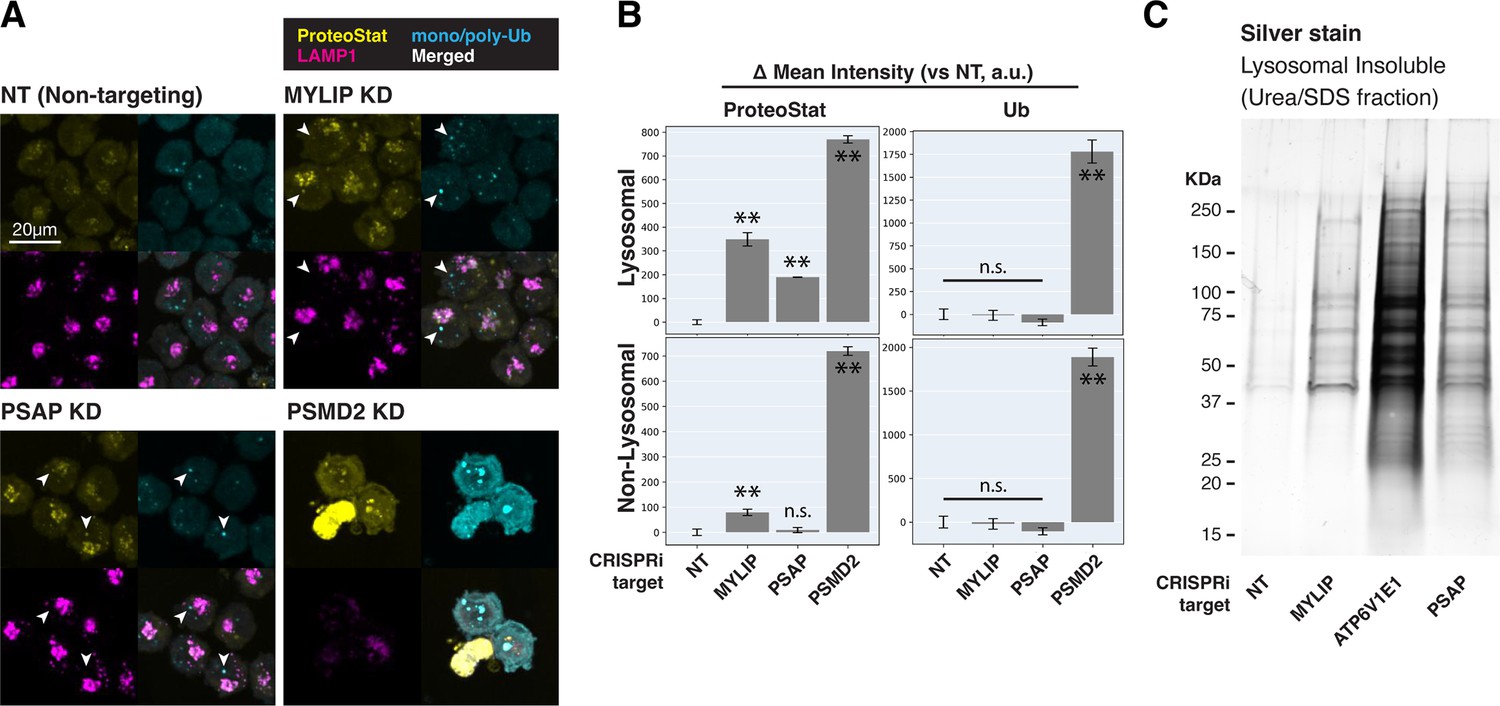
Lipid dysregulation leads to accumulation of insoluble lysosomal protein aggregates.
(A) K562 cells with the indicated KDs were co-stained with ProteoStat and antibodies against ubiquitinated proteins or lysosomes and imaged with confocal (maximum projection of multiple-z-slices). (B) Quantification (n=3) of ProteoStat and mono/poly-ubiquitinated proteins (representative images shown in A) segregated according to co-localization with lysosome (LAMP1 staining). (C) Representative (from triplicate experiments) polyacrylamide gel with Silver Stain showing Lysosomal Insoluble fractions from cells with various KDs after Lyso-IP and differential extraction. (✻✻: p<0.01; n.s.: not significant; t-test vs NT control or between pairs of samples as indicated with horizontal lines).
-
Figure 3—source data 1
PDF file containing original gel image for Figure 3C, indicating the treatment for each lane.
- https://cdn.elifesciences.org/articles/86194/elife-86194-fig3-data1-v1.pdf
-
Figure 3—source data 2
Original gel image for Figure 3C.
- https://cdn.elifesciences.org/articles/86194/elife-86194-fig3-data2-v1.zip
Figure 3—figure supplement 1
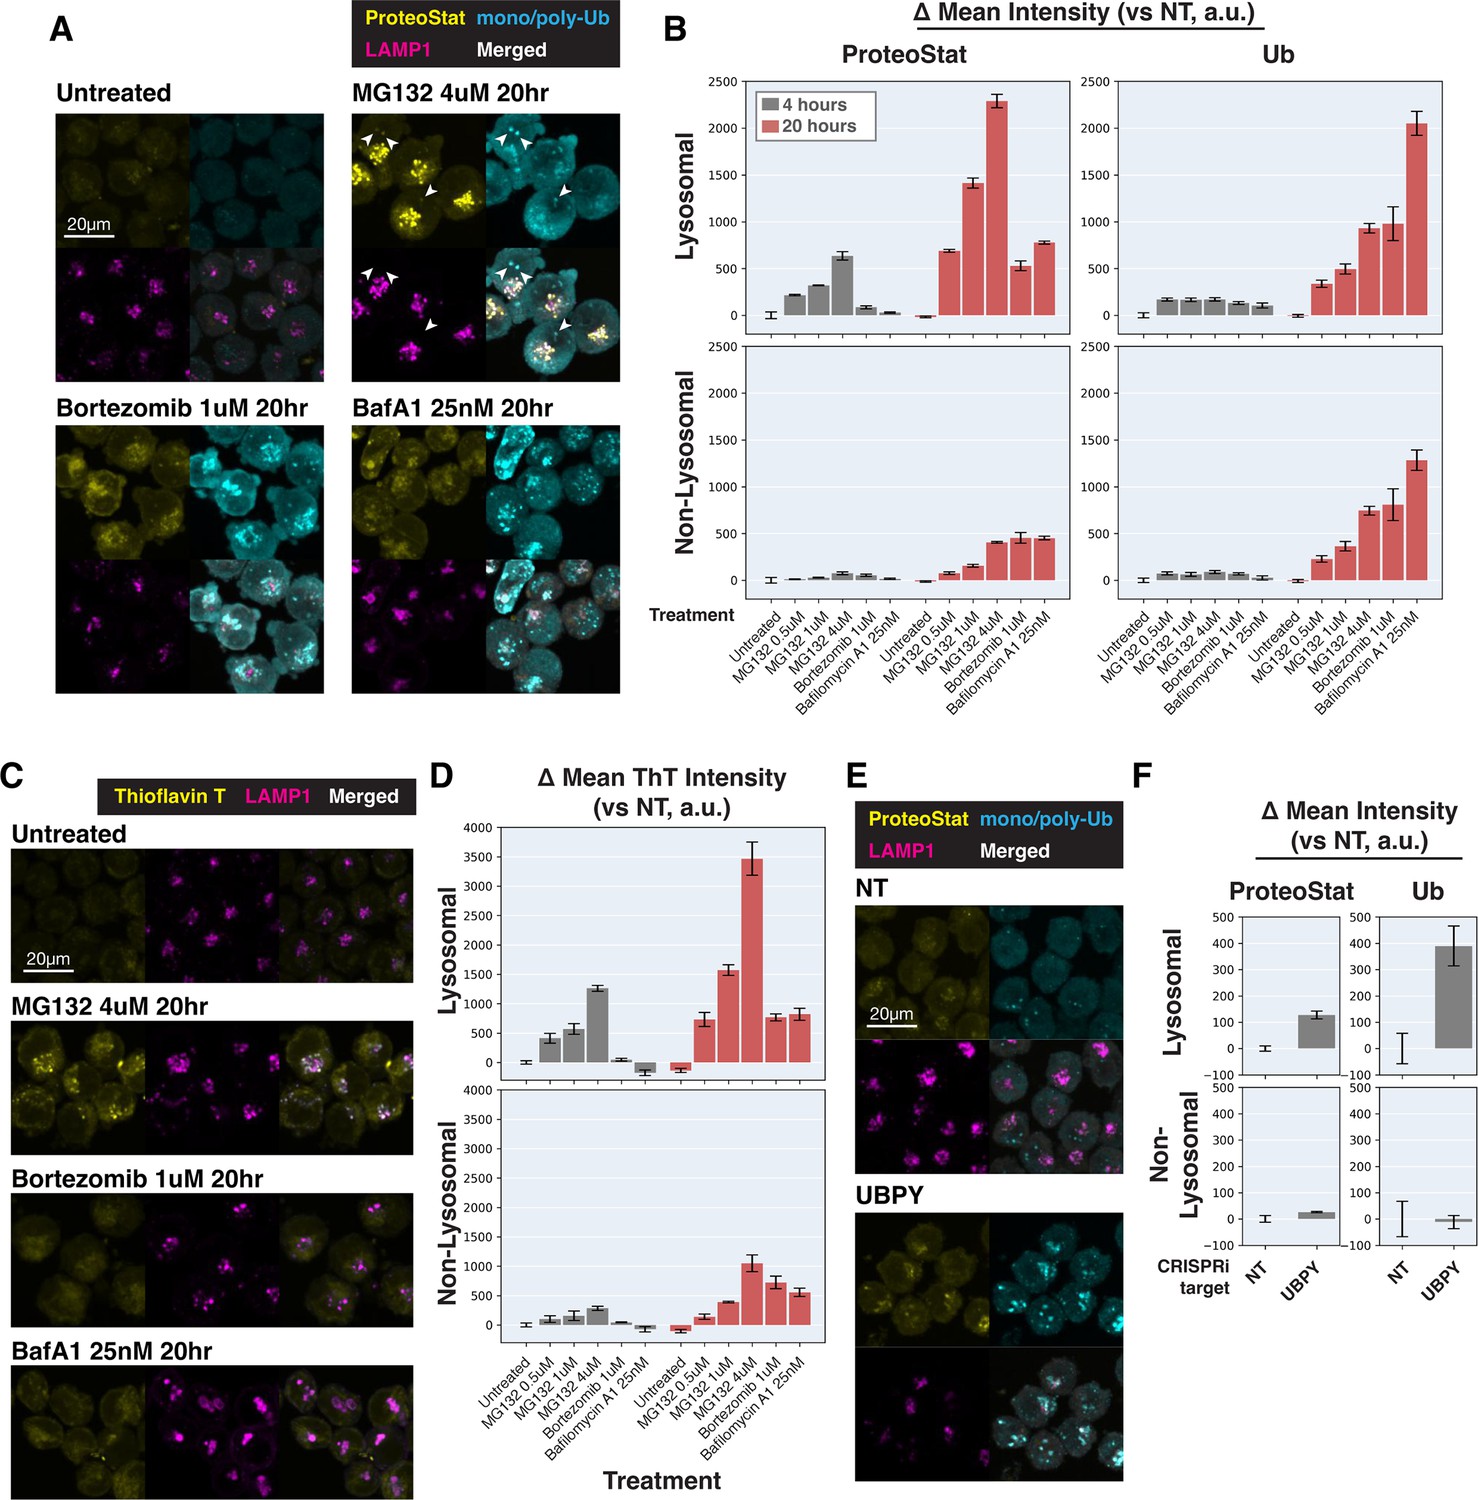
Characterization of sub-cellular distribution of ProteoStat, Thioflavin T, and ubiquitinated proteins under various perturbations.
(A and C) K562 cells with various treatments were co-stained with ProteoStat and antibodies against ubiquitinated proteins or lysosomes (A), or Thioflavin T and antibodies against lysosomes (C), and imaged with confocal microscopy. White arrowheads highlight cytoplasmic Ub-high/ProteoStat-medium puncta. (B and D) Quantification (n=3) of ProteoStat, mono/poly-ubiquitinated proteins (B), or Thioflavin T (D) signals, segregated according to co-localization with lysosome (representative images of select conditions shown in A and C, respectively). (E) K562 cells with control or UBPY KD were co-stained with ProteoStat and antibodies against ubiquitinated proteins or lysosomes. (F) Quantification (n=3) of ProteoStat and mono/poly-ubiquitinated proteins (representative images shown in E) segregated according to co-localization with lysosome (LAMP1 staining). Maximum projection of multiple z-slices shown for all microscopy images.
Figure 3—figure supplement 2
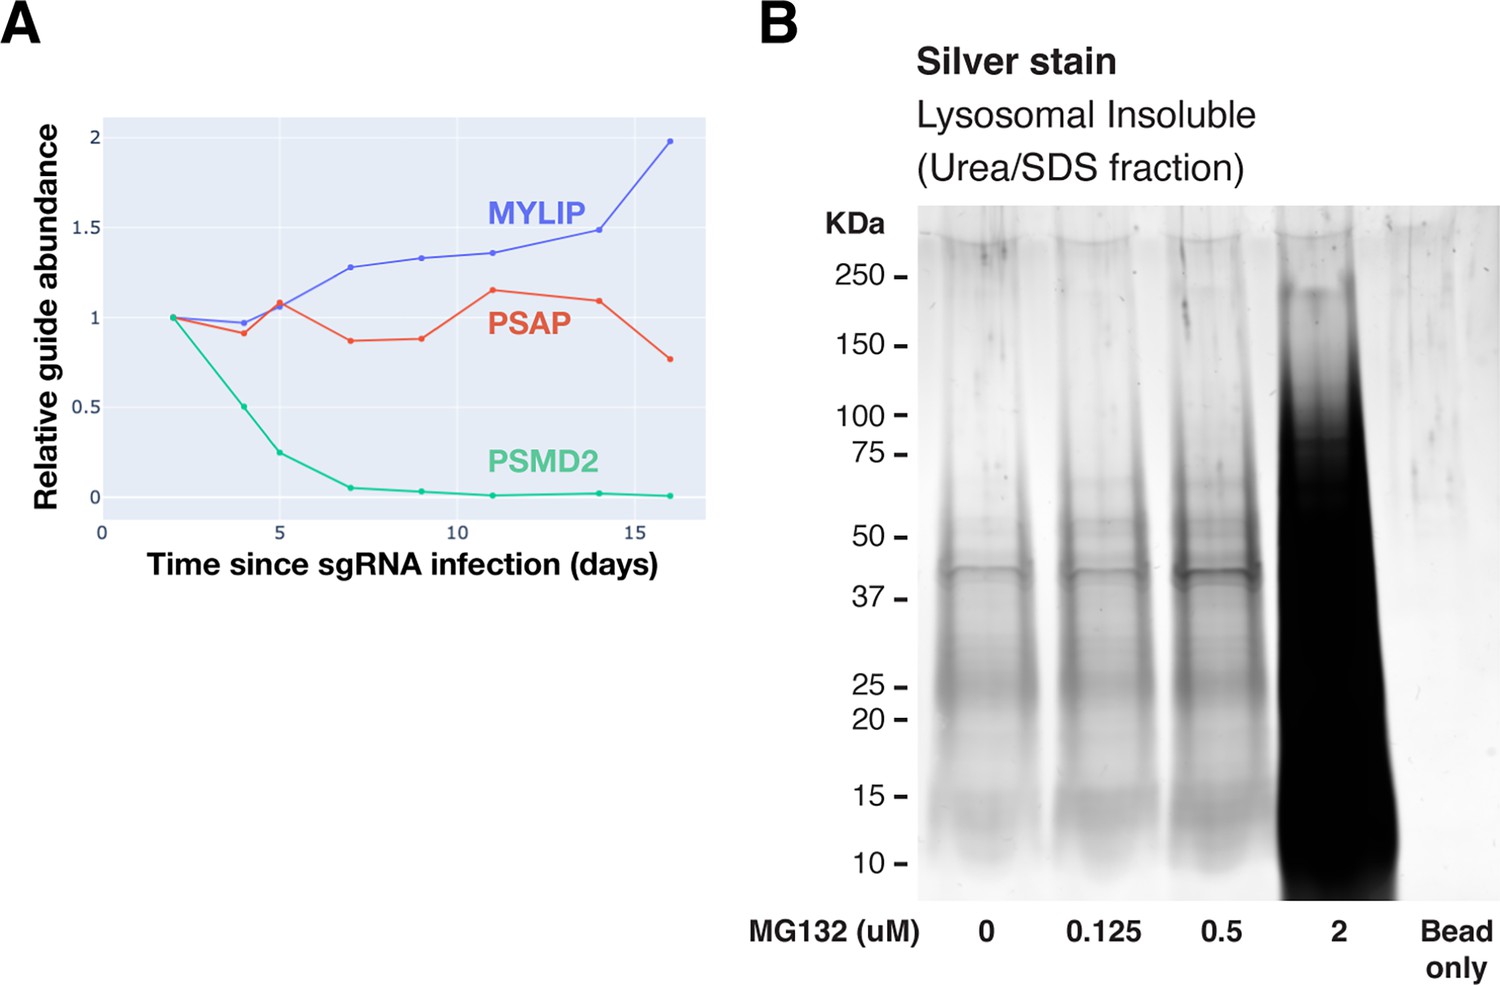
Evaluating the effect of lipid perturbations on growth rate, and lysosomal protein aggregates characterization under proteasome inhibition.
(A) Effect on growth rates of various gene KDs. (B) Polyacrylamide gel with Silver Stain showing Lysosomal Insoluble fractions from cells treated with various concentrations of MG132 for 20 hr, followed by Lyso-IP and differential extraction.
-
Figure 3—figure supplement 2—source data 1
PDF file containing original gel image for Figure 3—figure supplement 2B, indicating the treatment for each lane.
- https://cdn.elifesciences.org/articles/86194/elife-86194-fig3-figsupp2-data1-v1.pdf
-
Figure 3—figure supplement 2—source data 2
Original gel image for Figure 3—figure supplement 2B.
- https://cdn.elifesciences.org/articles/86194/elife-86194-fig3-figsupp2-data2-v1.zip
Figure 4 with 1 supplement
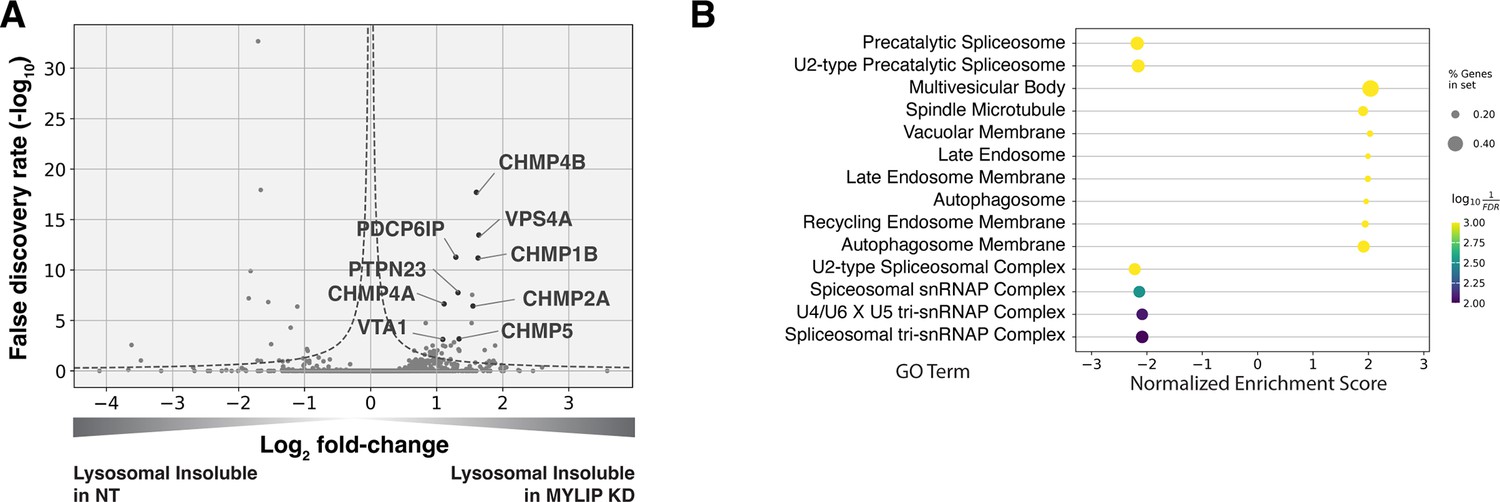
Lysosomal protein aggregates under lipid accumulation are enriched in ESCRT components.
(A) Volcano plot of Lyso-IP proteomics experiment highlighting ESCRT components and associated proteins that became more insoluble in the lysosome in MYLIP KD vs control cells. Dotted line denotes where the product of |log2(fold-change)| and -log10(False discovery rate) is constant and equals to 1*-log10(0.05). (B) GO Terms (Cellular Component) identified with GSEA on Lyso-IP Proteomics results. Positive Enrichment scores indicate an increased likelihood of genes in the GO Term to be enriched in Lysosomal Insoluble fraction in MYLIP KD vs control cells.
-
Figure 4—source data 1
Lyso-IP proteomics results in the Lysosomal Insoluble fractions, comparing MYLIP KD vs NT control.
Depicted in Figure 4A–B.
- https://cdn.elifesciences.org/articles/86194/elife-86194-fig4-data1-v1.csv
Figure 4—figure supplement 1
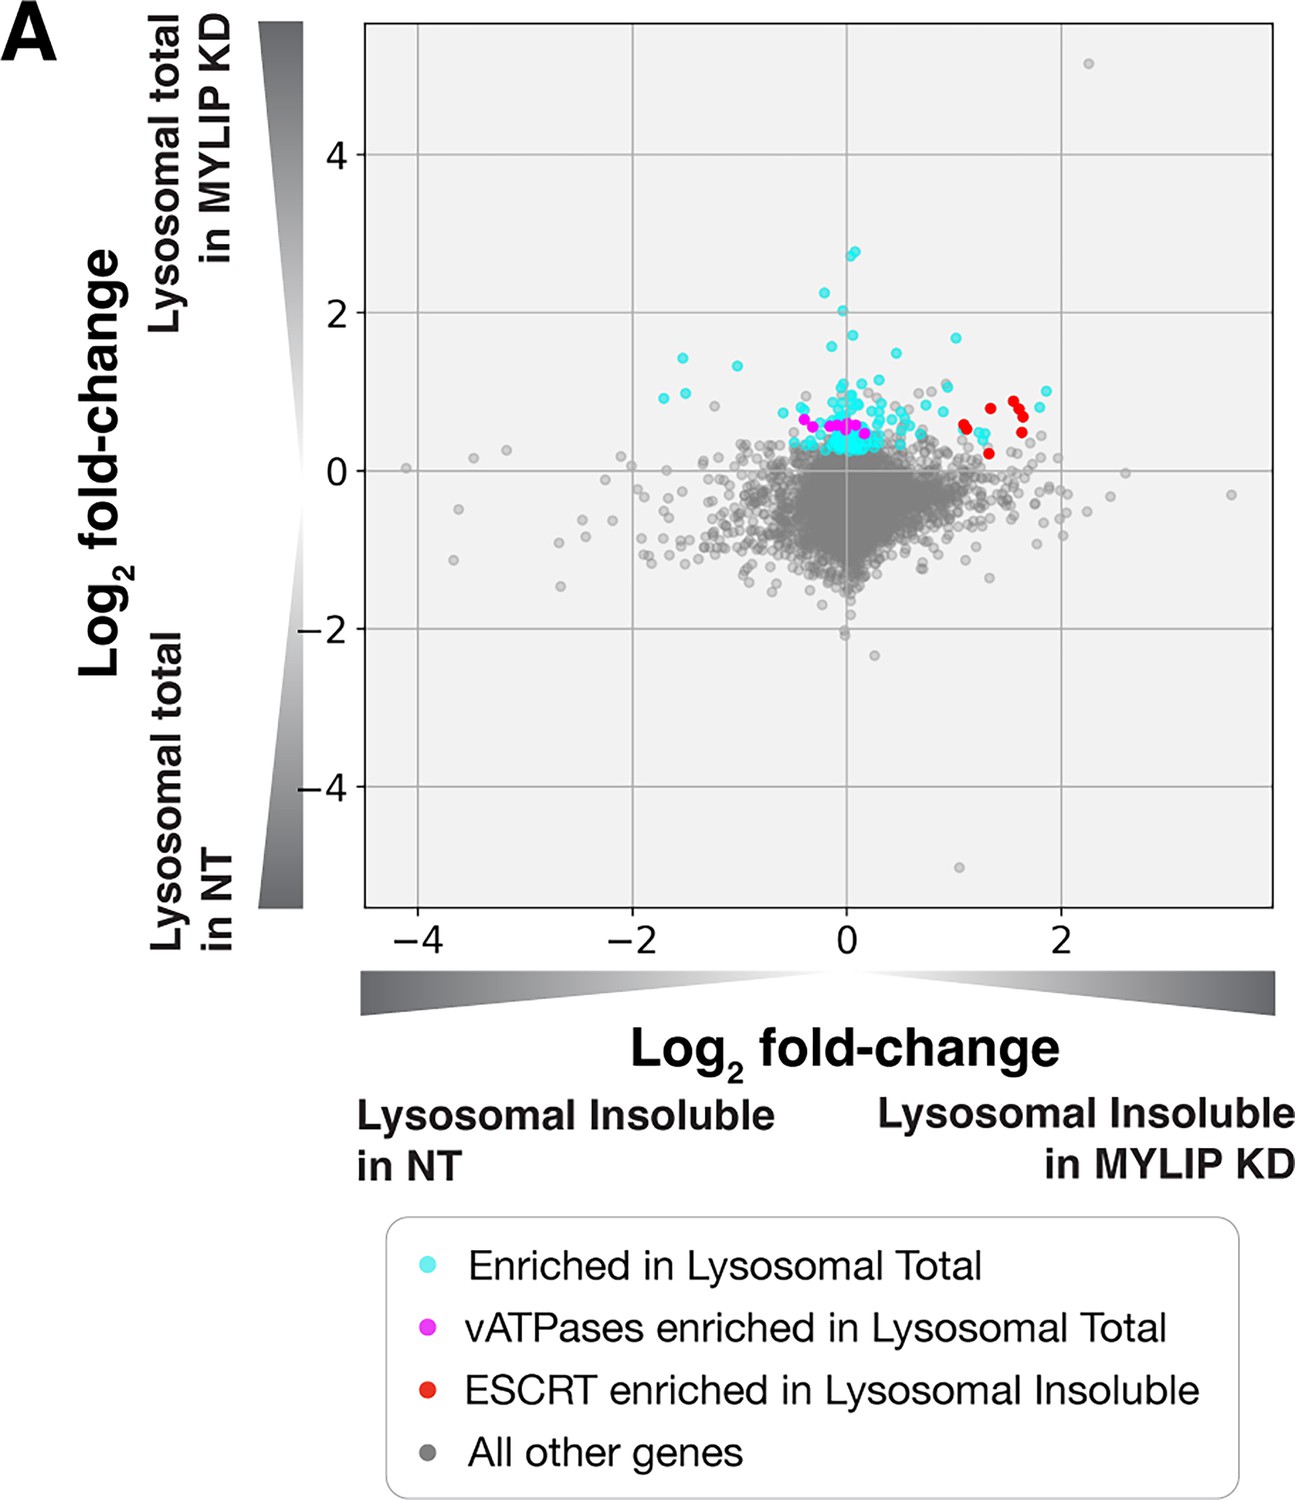
Increased lysosomal abundance alone does not cause insolubility.
(A) Relative enrichment of proteins in MYLIP KD over NT control, in Lysosomal Total Fraction vs Lysosomal Insoluble Fraction. Highlighted are proteins with statistically significant enrichment in the stated categories.
-
Figure 4—figure supplement 1—source data 1
Lyso-IP proteomics results in the Lysosomal Total fractions, comparing MYLIP KD vs NT control.
Depicted in Figure 4—figure supplement 1A.
- https://cdn.elifesciences.org/articles/86194/elife-86194-fig4-figsupp1-data1-v1.csv
Figure 5
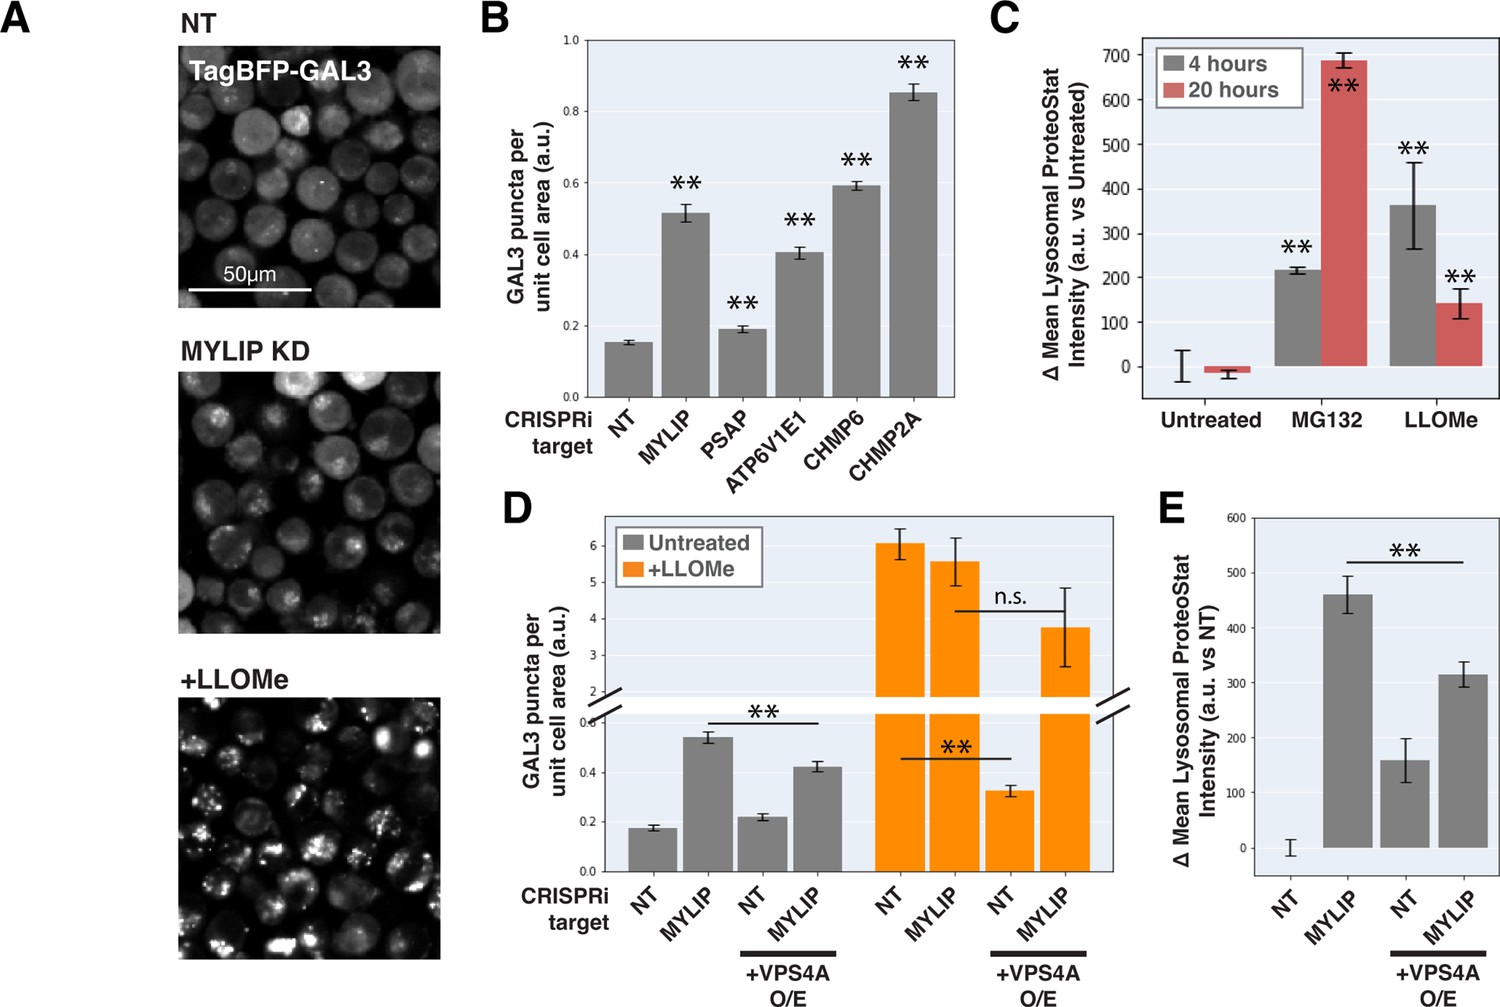
Lysosomal membrane permeabilization contributes to proteostasis impairment.
(A) Representative fluorescence microscopy images of K562 cells expressing TagBFP-GAL3, with NT control, sgRNA targeting MYLIP, or treated with LLOMe at 120 uM for 4 hr. (B) Quantification (n=3) of TagBFP-GAL3 puncta in cells with various KDs. (C) Quantification (n=3) of lysosomal ProteoStat signal under various treatments. (D) Quantification (n=3) of TagBFP-GAL3 puncta in cells with a combination of control vs MYLIP KD,±LLOMe treatment (120 µM for 4 hr), and ±VPS4 A overexpression. (E) Quantification (n=3) of lysosomal ProteoStat signal in cells with a combination of control vs MYLIP KD and ±VPS4A overexpression. (✻: p<0.05; ✻✻: p<0.01; n.s.: not significant; t-test vs NT / Untreated control or between pairs of samples as indicated with horizontal lines).
Figure 6 with 1 supplement
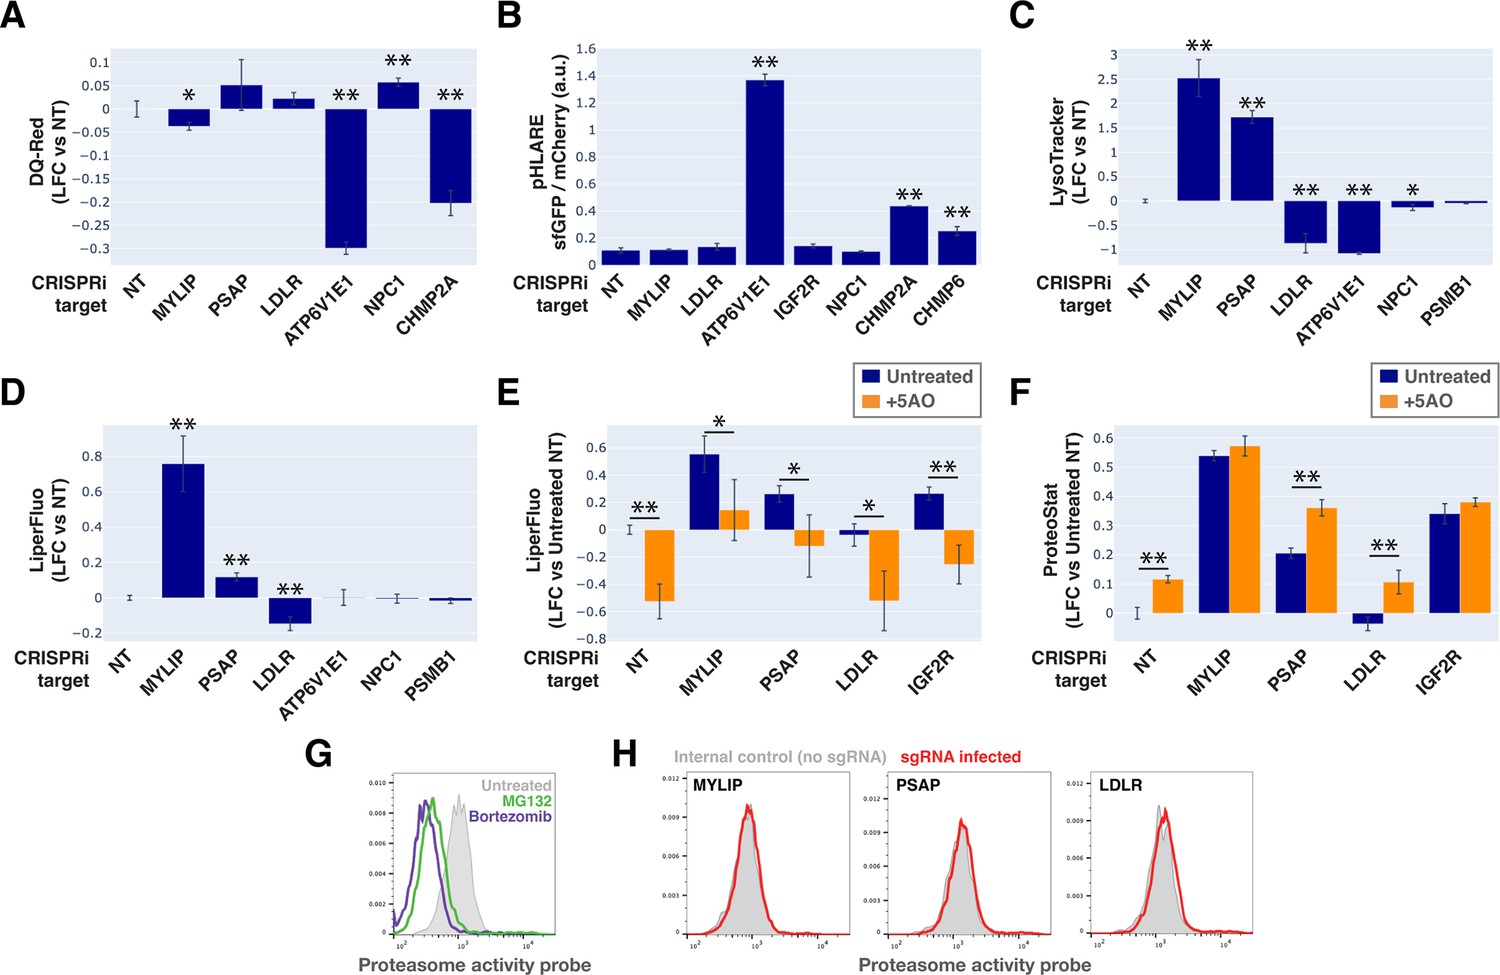
Lysosomal membrane permeabilization (LMP) contributes to proteostasis impairment.
(A–D) Flow cytometry quantification of phenotypes in K562 cells with various KDs (n=3 for all). (A) TR-X fluorescence (after protease-induced unquenching) as an indicator of lysosomal protease function; (B) Ratio of lysosome-targeted sfGFP fluorescence (pH sensitive) to mCherry fluorescence (pH insensitive) as an indicator of lysosomal pH; (C) LysoTracker-Red fluorescence as an indicator of lysosomal content and pH; (D) LiperFluo staining as an indicator of lipid peroxidation level; (E–F) Efficacy of the 5 antioxidant cocktail (5AO) in rescuing the effects of gene KDs on (E) LiperFluo or (F) ProteoStat phenotypes. (✻: p<0.05; ✻✻: p<0.01; t-test vs NT control or between pairs of samples as indicated with horizontal lines; n=3) (G) Flow cytometry-based assay with the Proteasome Activity Probe was validated with proteasome inhibitors (n=1). (H) Effect of gene KDs on proteasome activity (n=1).
Figure 6—figure supplement 1
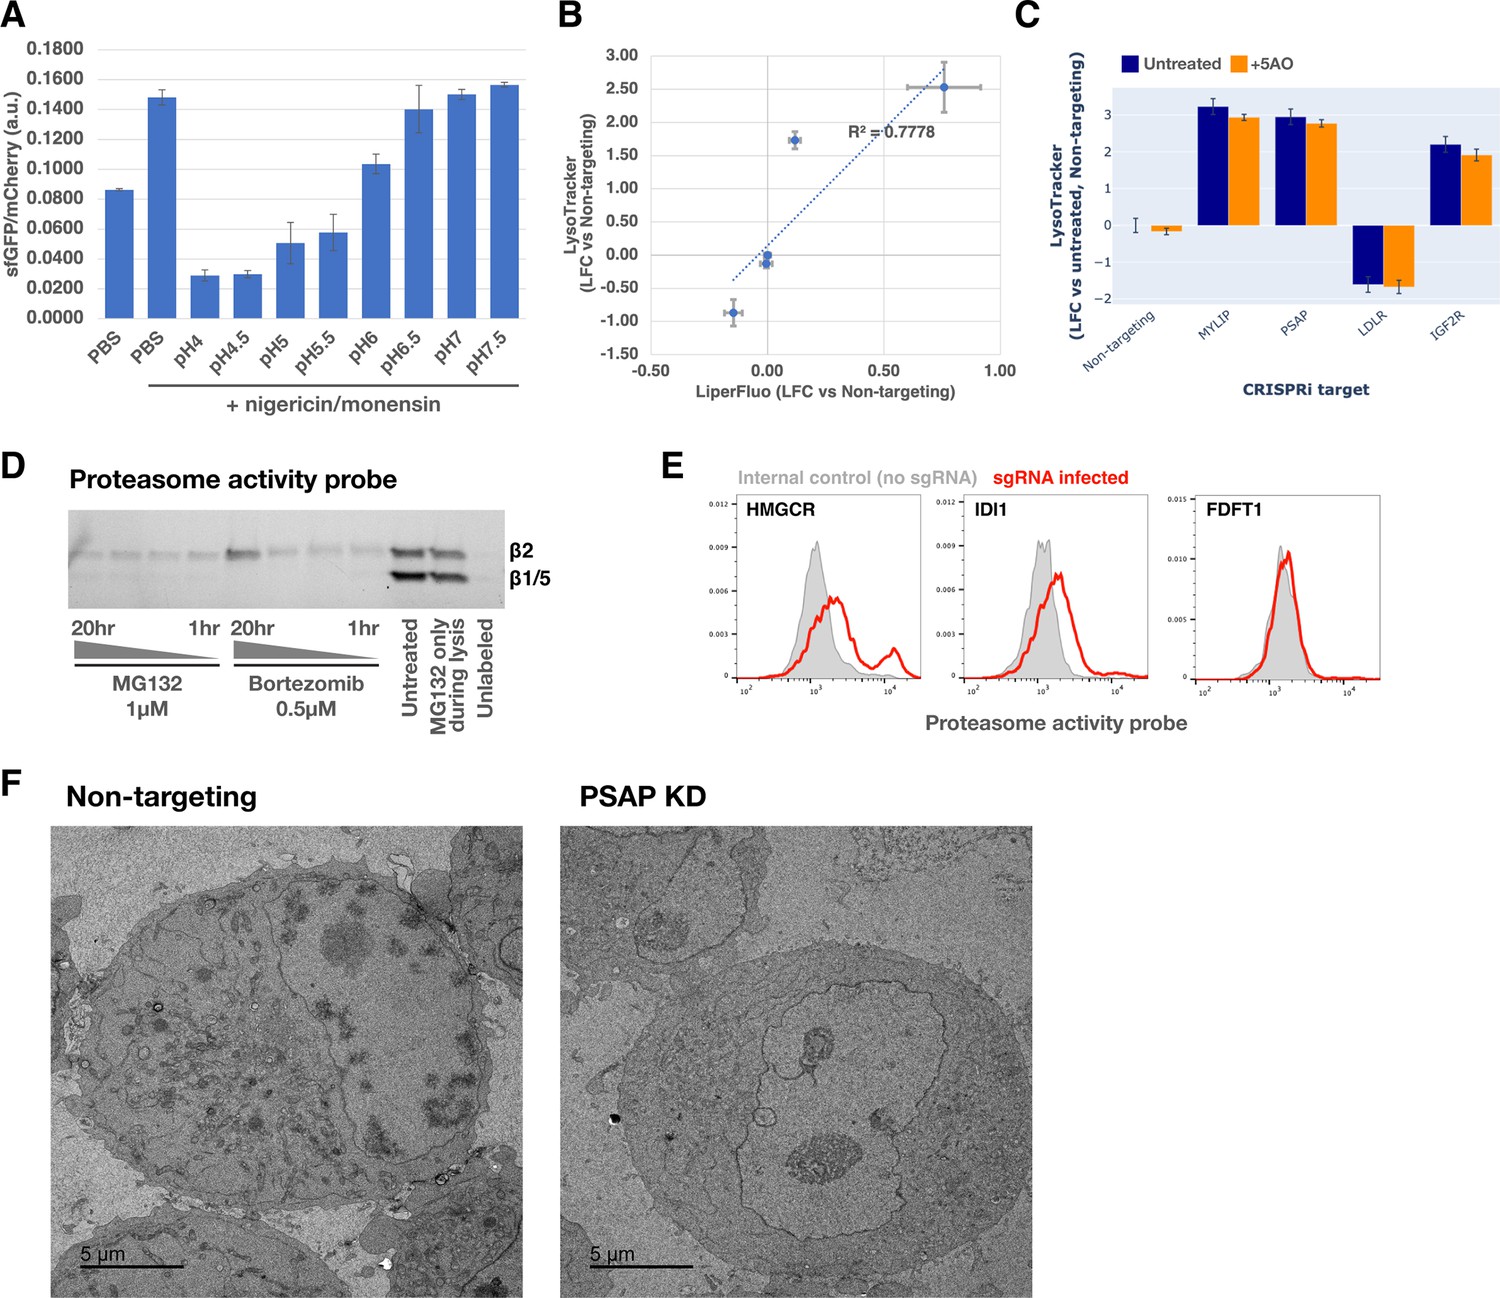
Validation and characterization of lysosomal pH sensor and proteasome activity probe.
(A) K562 cells stably expressing the pHLys sensor pHLARE were incubated with a pH buffer series in the presence of ionophores (nigericin and monensin) and analyzed with flow cytometry (n=3). (B) Effect of target gene KDs on LysoTracker vs LiperFluo phenotypes. R2 value was obtained with a linear regression model (dotted blue line). (C) LysoTracker-Red staining in K562 CRISPRi cells carrying sgRNAs targeting various genes, which were either untreated or treated with the five antioxidant cocktail (5AO) for the duration of the gene KD. (D) SDS-PAGE in-gel fluorescence of lysates from cells treated with MG132 or Bortezomib for 1, 2, 4, or 20 hr before labeling with the Proteasome activity probe for 1 hour followed by lysis. Expected migration distances of different proteasome subunits are marked. (E) Effect of KDs of select genes in the mevalonate pathway on proteasome activity (n=1). (F) Transmission Electron Microscopy (TEM) images of K562 CRISPRi cells harvested 6 days after transduction of either non-targeting or PSAP-targeting sgRNAs.
-
Figure 6—figure supplement 1—source data 1
PDF file containing original gel image for Figure 6—figure supplement 1D, indicating the treatment for each lane.
- https://cdn.elifesciences.org/articles/86194/elife-86194-fig6-figsupp1-data1-v1.pdf
-
Figure 6—figure supplement 1—source data 2
Original gel image for Figure 6—figure supplement 1D.
- https://cdn.elifesciences.org/articles/86194/elife-86194-fig6-figsupp1-data2-v1.zip
Figure 7
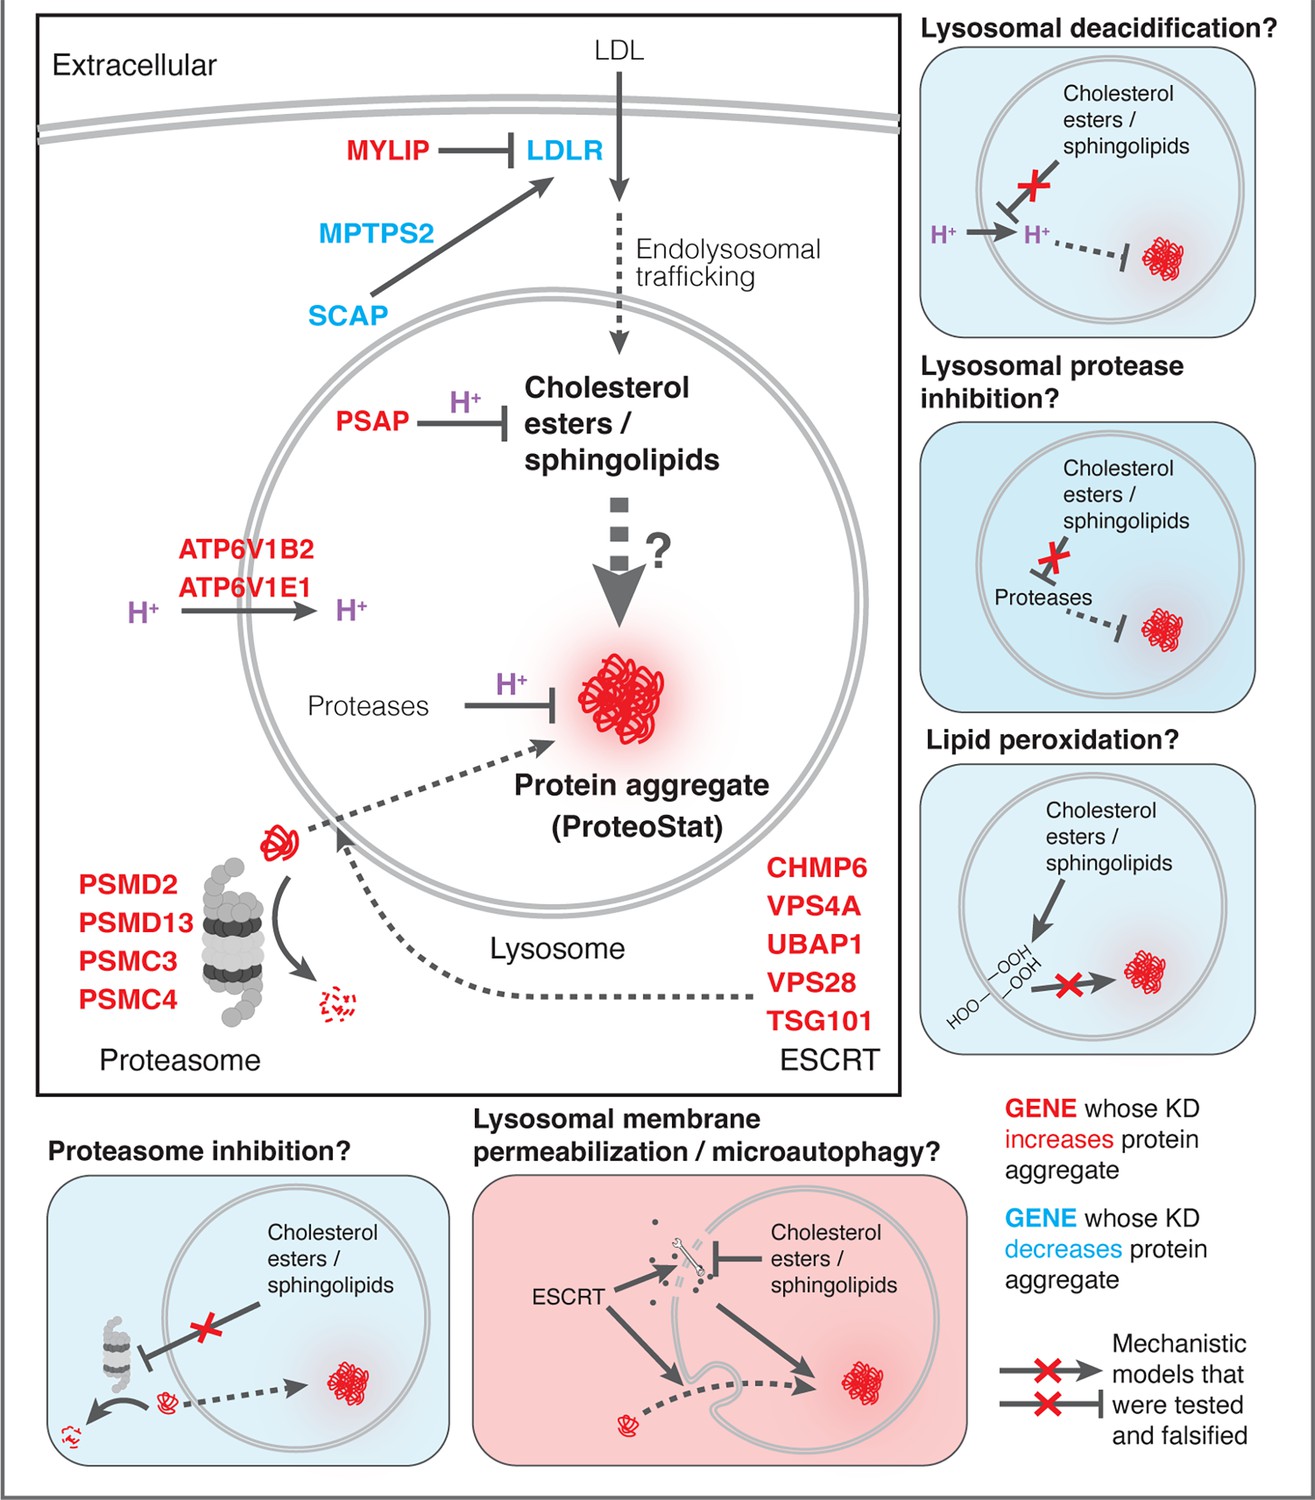
Mechanistic models linking pathways identified in CRISPRi screens and lysosomal proteomics to accrual of lysosomal protein aggregates.
Tables
Key resources table
| Reagent type (species) or resource | Designation | Source or reference | Identifiers | Additional information |
|---|---|---|---|---|
| cell line (H. sapiens) | K562 | ATCC | CCL-243 | |
| cell line (H. sapiens) | K562 CRISPRi | This paper | Cell line used to perform CRISPRi screen | |
| cell line (H. sapiens) | K562 CRISPRi +TagBFP-Gal3 | This paper | Cell line used to assay lysosomal membrane permeabilization | |
| cell line (H. sapiens) | K562 CRISPRi +pHLARE | This paper | Cell line used to assay lysosomal pH | |
| cell line (H. sapiens) | K562 CRISPRi +LysoIP | This paper | Cell line used to perform lysosomal proteomics | |
| antibody | anti-human-LAMP1 (mouse monoclonal) | Abcam | ab25630 | IF(1:50) |
| antibody | anti-mono/polyubiquitinated conjugates (mouse monoclonal) | Enzo | BML-PW8810-0100 | IF(1:1000) |
| antibody | Alexa Fluor Plus 647-conjugated anti-mouse (goat polyclonal secondary) | Invitrogen | A32728 | IF(1:1000) |
| recombinant DNA reagent | PSAP overexpression variant series | This paper | Lentiviral constructs to interrogate the effect of individual saposins. See Figure 2—figure supplement 2C | |
| sequence-based reagent | hCRISPRi_v2.1_top5 sgRNA library; Modified to include additional controls and target of interests | Horlbeck et al., 2016 | Cloned into an in-house lentiviral vector. See Supplementary file 1 for sgRNA sequences | |
| commercial assay or kit | Filipin III (in Cholesterol Assay Kit) | Abcam | ab133116 | |
| commercial assay or kit | ProteoStat Aggresome detection kit | Enzo | ENZ-51035-K100 | (1:10,000) |
| commercial assay or kit | Liperfluo | Dojindo Molecular Technologies | L24810 | |
| commercial assay or kit | DQ-Red BSA | Invitrogen | D12051 | |
| commercial assay or kit | LysoTracker Red DND-99 | Invitrogen | L7528 | |
| commercial assay or kit | Me4BoVS | R&D system | I-190–050 | |
| commercial assay or kit | Pierce anti-HA magnetic beads | Life Technologies | 88837 | |
| chemical compound, drug | MG132 | EMD Millipore | 474790 | |
| chemical compound, drug | Bafilomycin A1 | Invivogen | TLRL-BAF1 | |
| chemical compound, drug | VER155008 | Selleckchem | S7751 | |
| chemical compound, drug | Ganetespib | Selleckchem | S1159 | |
| chemical compound, drug | 17-DMAG | Invivogen | ant-dgl | |
| chemical compound, drug | MBCD | Sigma | C4555 | |
| chemical compound, drug | Bortezomib | Selleckchem | S1013 | |
| chemical compound, drug | LLOMe | MedKoo | 597431 | |
| chemical compound, drug | Cumene Hydroperoxide | Sigma-Aldrich | 247502 | |
| chemical compound, drug | Lipoprotein depleted FBS | Kalen Biomed | 880100 | |
| chemical compound, drug | catalase | Sigma-Aldrich | C40 | |
| chemical compound, drug | glutathione | Sigma-Aldrich | G6013 | |
| chemical compound, drug | superoxide dismutase | Sigma-Aldrich | S5395 | |
| chemical compound, drug | DL-alpha tocopherol | Sigma-Aldrich | T3251 | |
| chemical compound, drug | DL-alpha tocopherol acetate | Sigma-Aldrich | T3001 | |
| chemical compound, drug | Halt Protease and Phosphatase Inhibitor Cocktail | Thermo Scientific | 78440 | |
| software, algorithm | MAGeCK | Li et al., 2014 | ||
| software, algorithm | GSEAPY | Subramanian et al., 2005 | ||
| software, algorithm | MAVEN peak analysis program (version 2.20.21) | Seitzer et al., 2022 | RRID:SCR_022491 | https://github.com/eugenemel/maven |
Additional files
-
Supplementary file 1
hCRISPRi_v2.1_top5 sgRNA library.
Modified from Horlbeck et al., 2016 to include additional controls and target of interests.
- https://cdn.elifesciences.org/articles/86194/elife-86194-supp1-v1.txt
-
MDAR checklist
- https://cdn.elifesciences.org/articles/86194/elife-86194-mdarchecklist1-v1.docx
Download links
A two-part list of links to download the article, or parts of the article, in various formats.
Downloads (link to download the article as PDF)
Open citations (links to open the citations from this article in various online reference manager services)
Cite this article (links to download the citations from this article in formats compatible with various reference manager tools)
Impairment of lipid homeostasis causes lysosomal accumulation of endogenous protein aggregates through ESCRT disruption
eLife 12:RP86194.
https://doi.org/10.7554/eLife.86194.3


