Autonomous metabolic reprogramming and oxidative stress characterize endothelial dysfunction in acute myocardial infarction
- Department of Biochemistry and Molecular Biology, Faculty of Biology, University of Barcelona, Spain
- Institute for Molecular Biology of Barcelona, National Research Council (IBMB-CSIC), Spain
- Centro de Investigación Biomédica en Red de Enfermedades Hepáticas y Digestivas (CIBER-EDH), Spain
- Department of Pulmonary Medicine, Hospital Clínic-Institut d’Investigacions Biomèdiques August Pi I Sunyer (IDIBAPS); University of Barcelona, Spain
- Centro de Investigación Biomédica en Red de Enfermedades Respiratorias (CIBERES), Spain
- Department of Pulmonary Medicine, Dr. Josep Trueta University Hospital de Girona, Santa Caterina Hospital de Salt and Girona Biomedical Research Institute (IDIBGI), Spain
- University/BHF Centre for Cardiovascular Science, University of Edinburgh, United Kingdom
- Department of Pharmaceutical Sciences, Università degli Studi di Milano, Italy
- Universidad Peruana Cayetano Heredia, Peru
- Institute of Biomedicine (IBUB), University of Barcelona, Spain
Figures
Figure 1
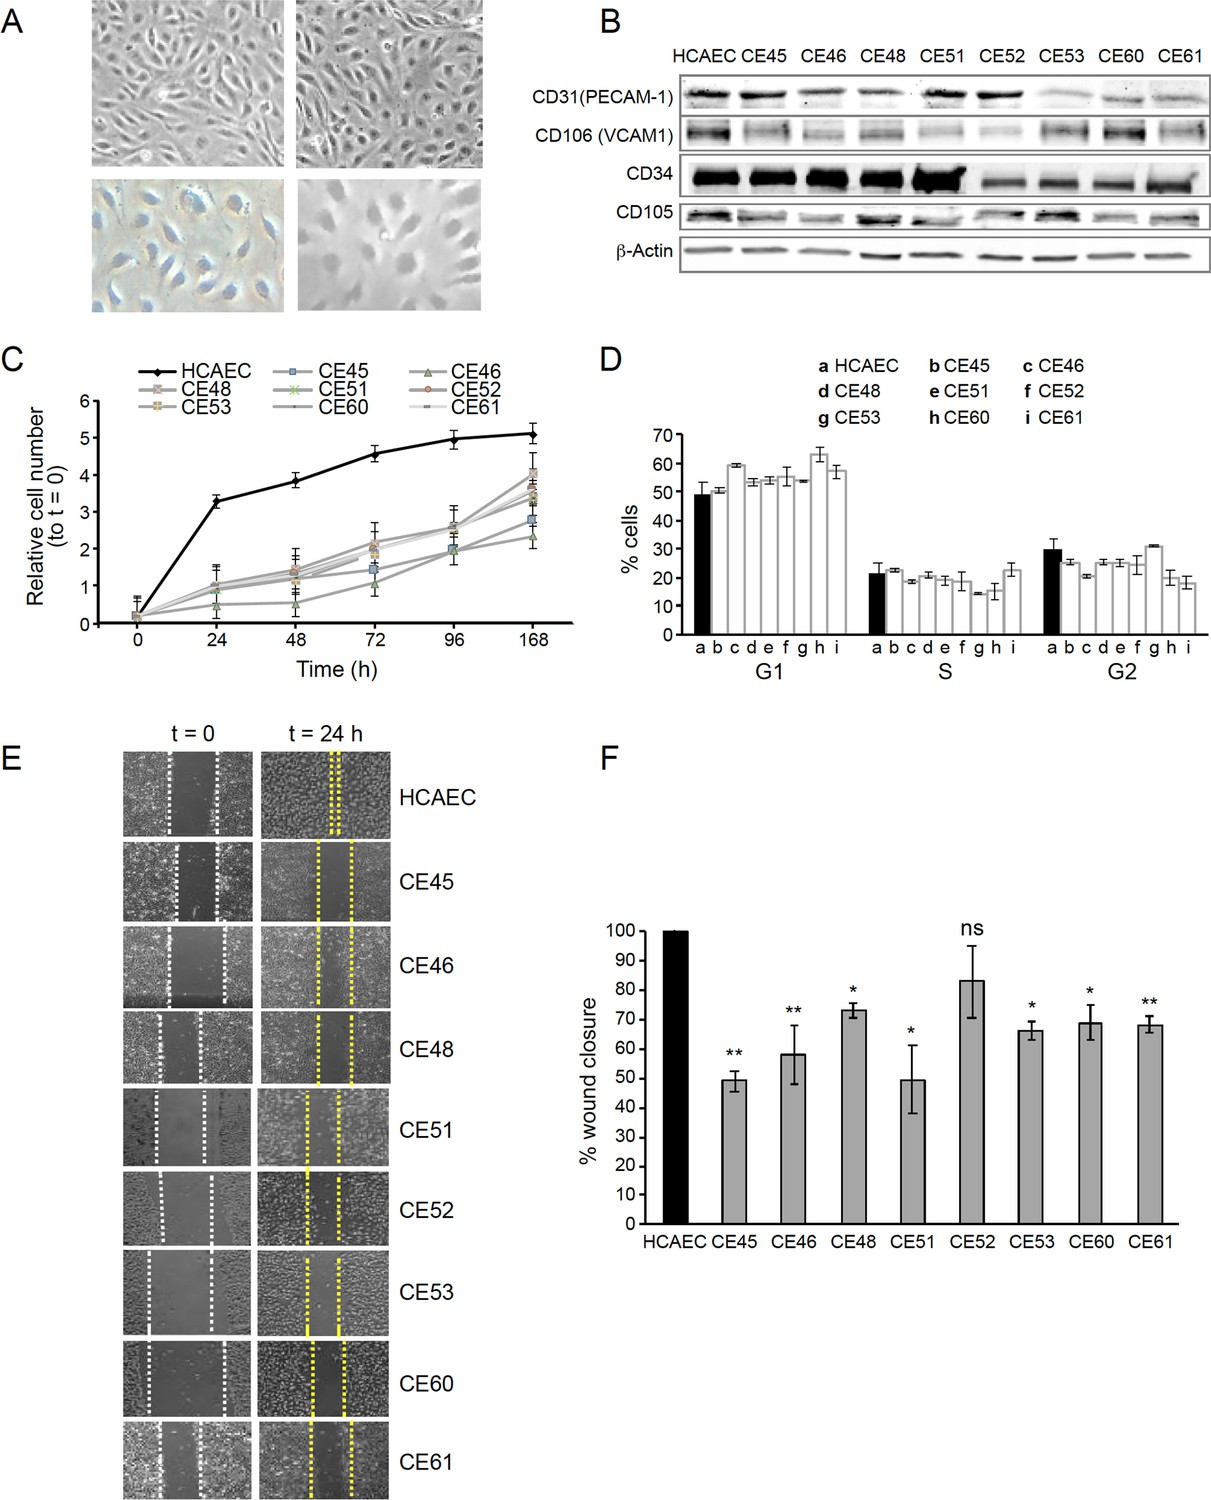
AMI-derived endothelial cells (AMIECs) display impaired growth and migration.
(A) Bright field images of human coronary artery endothelial cells (HCAECs) (left panels) vs. AMIECs (right panels), captured under 10 x and 20 x objectives on a Leica microscope. (B) Representative Western blotting experiments for the endothelial markers, PECAM-1, V-CAM1, CD-34, and CD-10 (Figure 1—source data 1 and 2). (C) Growth rate of AMIECs and control HCAEC, expressed as fold change relative to initial cell number seeded. Error bars represent mean ± SD (n=3). (D) Cell cycle analysis of AMIECs and HCAECs under logarithmic growth conditions, showing a non-significant trend for AMIECs to accumulate G1 phase as compared to HCAEC. Error bars represent mean ± SD (n=3). (E) Representative images of Mito C-treated migration in scratch wound assays, showing reduced migration of AMIECs compared to control HCAECs. (F) Quantification of cell migration in scratch wound assays, represented as % of wound closure. Values are mean ± SD (n=3). Student’s t-test significance values were calculated for AMIECs vs. HCAEC: *p≤0.05 **p≤0.01, ***p≤0.001.
-
Figure 1—source data 1
Western blotting experiments for endothelial markers.
- https://cdn.elifesciences.org/articles/86260/elife-86260-fig1-data1-v2.zip
-
Figure 1—source data 2
Western blotting experiments for endothelial markers.
- https://cdn.elifesciences.org/articles/86260/elife-86260-fig1-data2-v2.zip
Figure 2
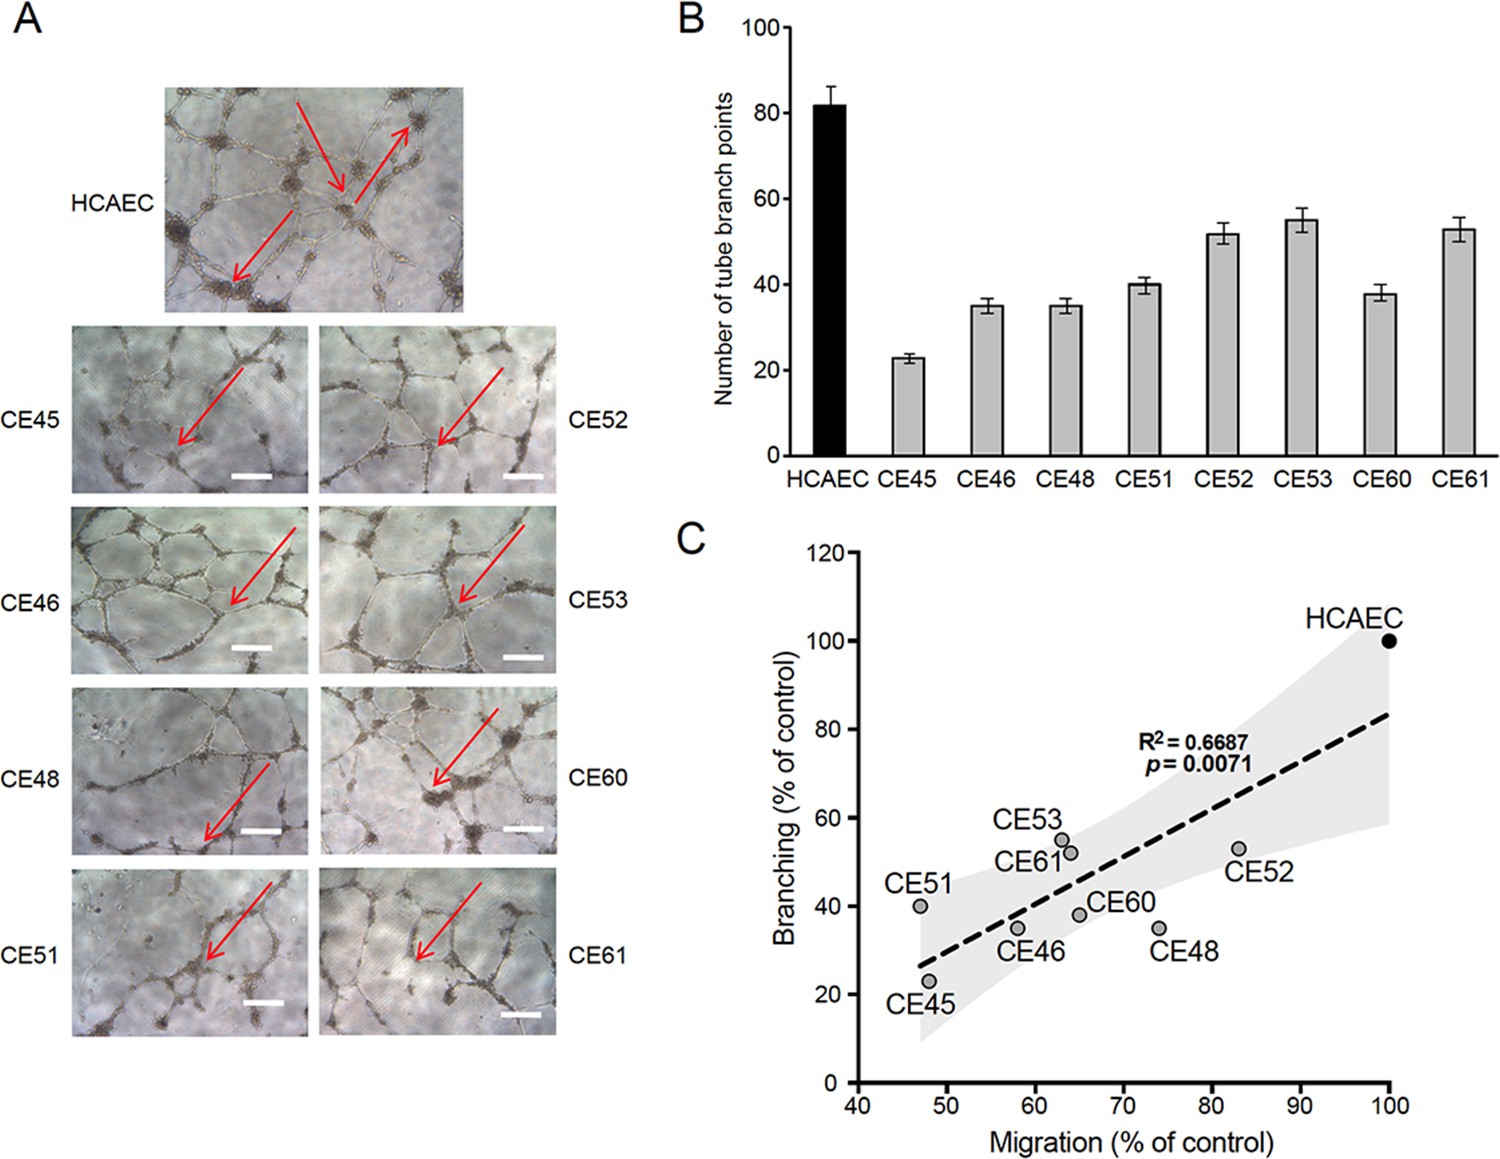
Defective tubulogenesis of AMI-derived endothelial cells (AMIECs).
(A) Endothelial tube network formation after 12 hr of VEGF stimulation. Shown are representative bright field images from triplicate experiments. Scale bar = 100 μm. (B) Tube branch point quantification of images from experiments performed as in (A). Values are mean ± SD (n=3). Student’s t-test significance values were calculated for AMIECs vs. human coronary artery endothelial cell (HCAEC): *p≤0.05 **p≤0.01, ***p≤0.001. (C) Correlation between relative migration (Figure 1F) and tubulogenesis in AMIECs and HCAECs.
Figure 3
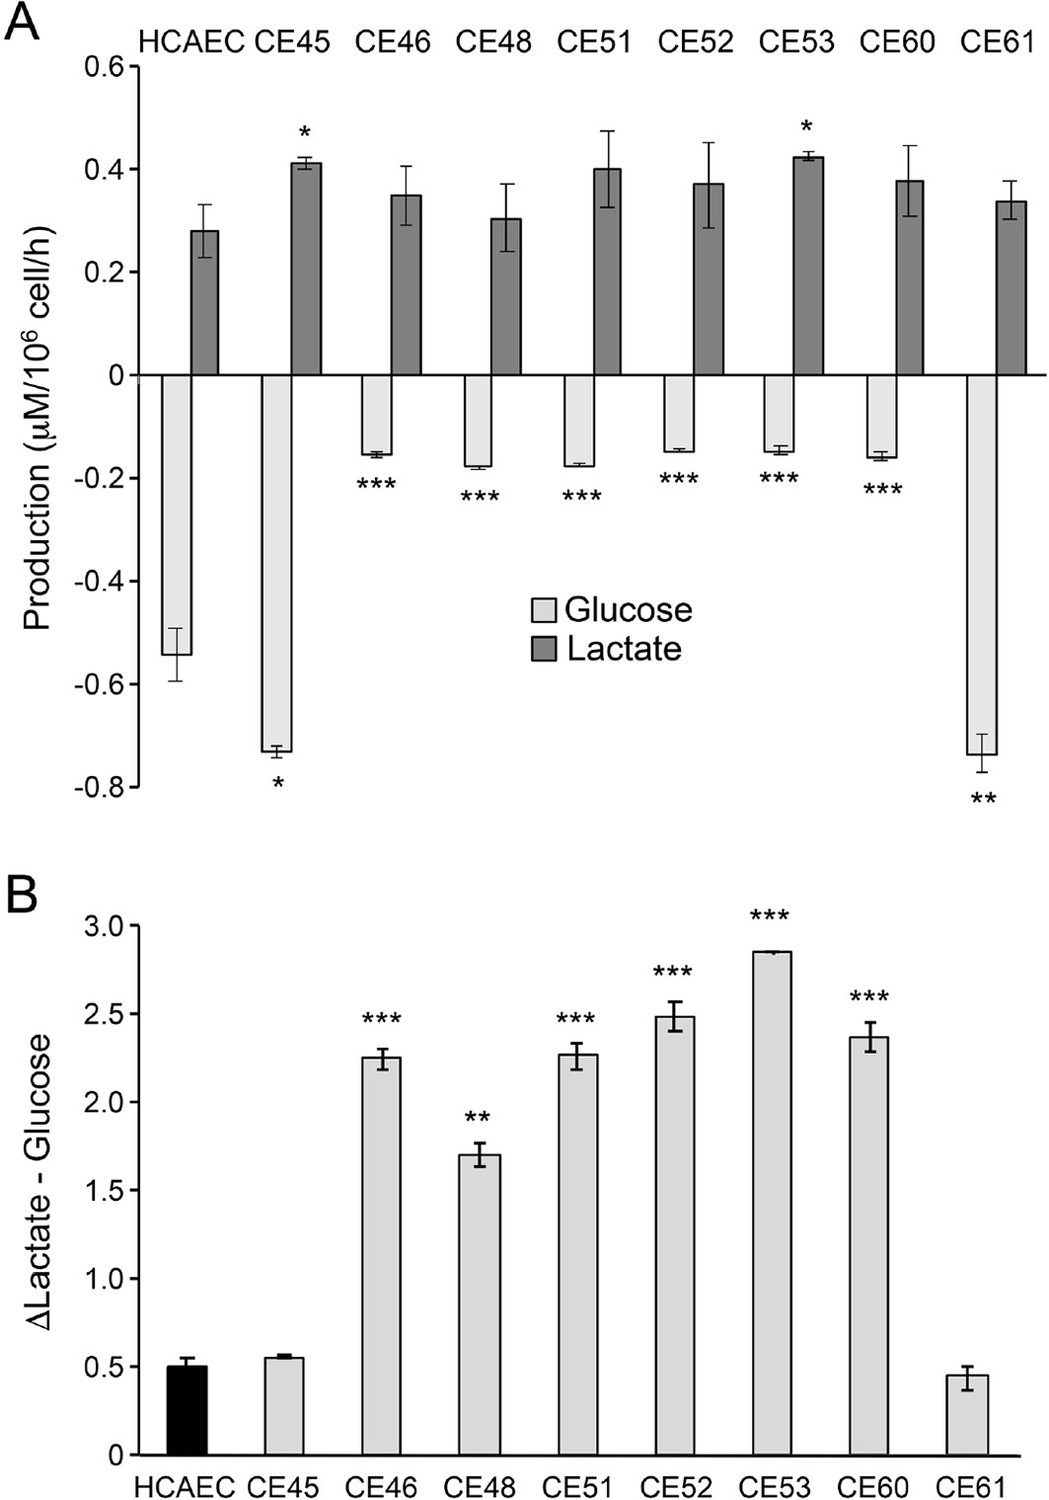
AMI-derived endothelial cells (AMIECs) display low glucose consumption and high lactate production.
(A) Glucose consumption and Lactate production have been measured after 48 hr. (B) Conversion rate of glucose to lactate. Error bars represent mean ± SD (n=3). Student’s t-test significance values were calculated for AMIECs vs. Human coronary artery endothelial cell (HCAECs): *p≤0.05 **p≤0.01, and ***p≤0.001.
Figure 4
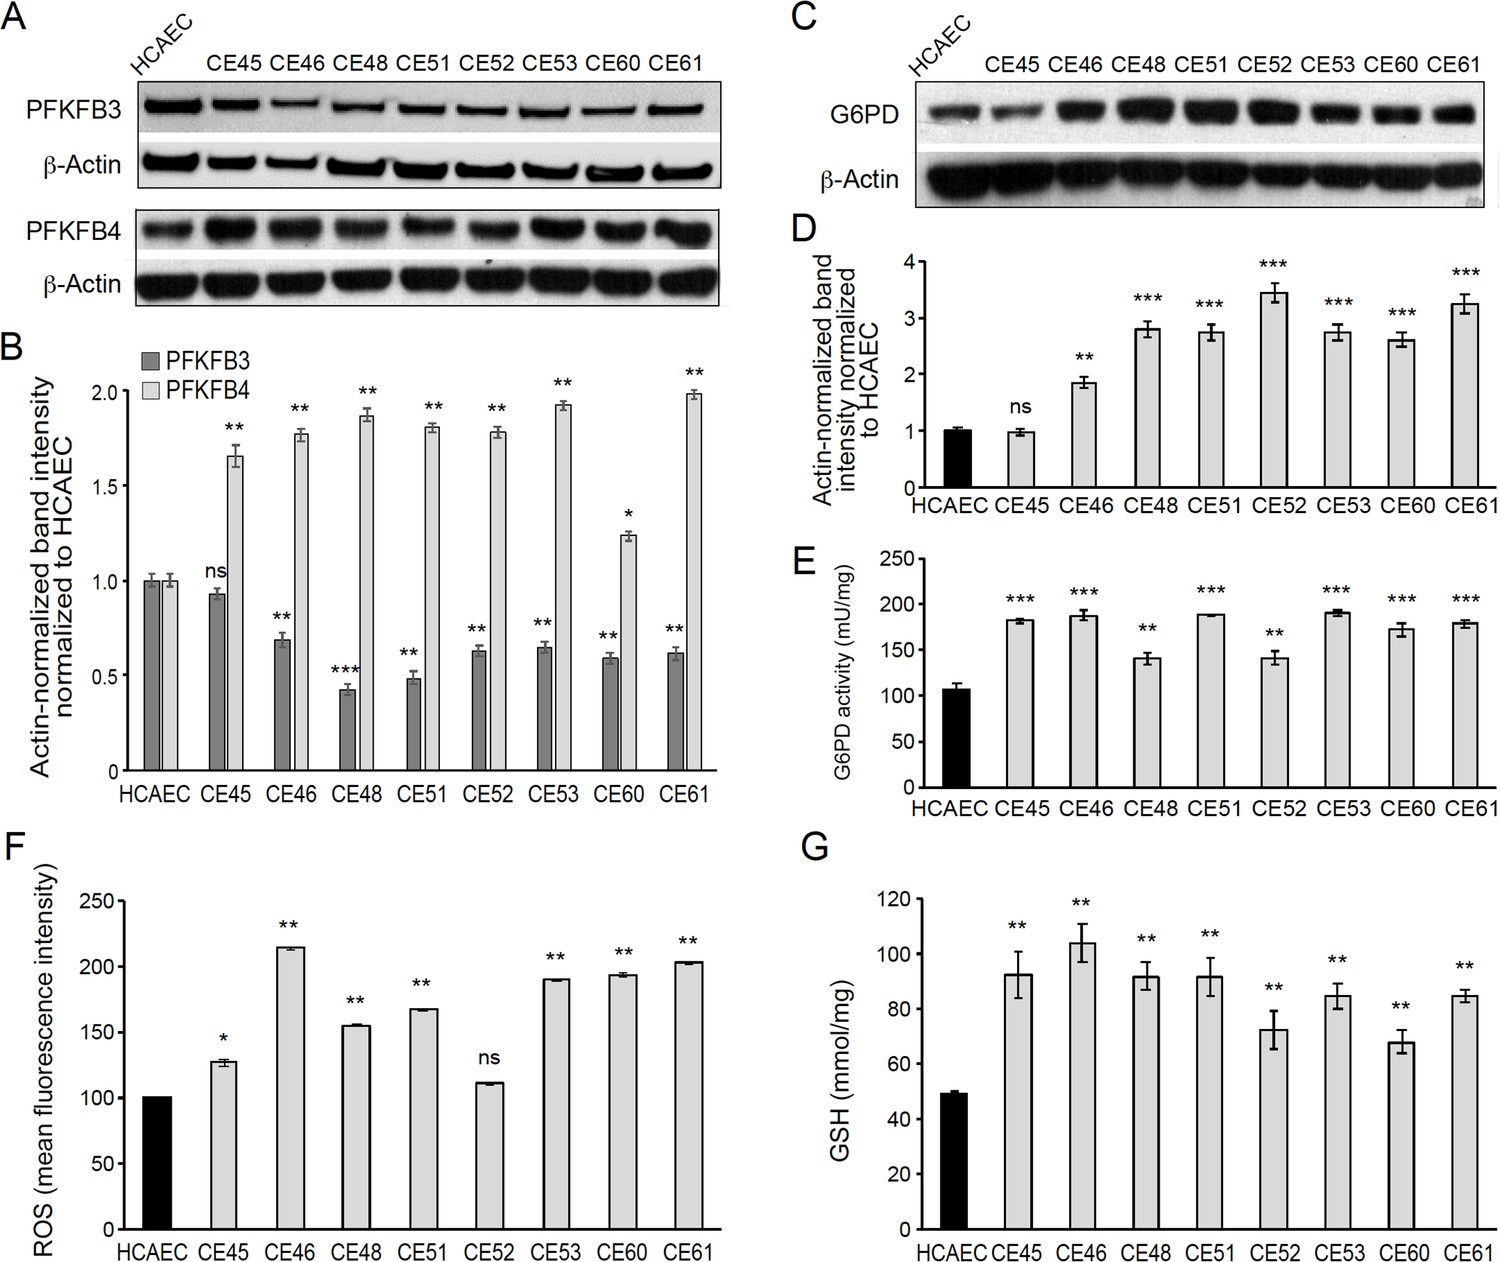
AMI-derived endothelial cells (AMIECs) shunt glycolysis towards pentose phosphate pathway (PPP) and NADPH generation.
(A) Representative Western blotting of PFKFB3 and PFKFB4 in AMIECs and human coronary artery endothelial cells (HCAECs) (Figure 4—source data 1 ). (B) Quantification of band intensities for PFKFB3 and PFKFB4 in triplicate western blotting experiments, normalized to β-actin band intensities. Values are mean ± SD (n=3). (C) Representative Western blotting for glucose-6-phosphate dehydrogenase (G6PD) in AMIECs and HCAECs (Figure 4—source data 2). (D) Quantification of band intensities for G6PD in triplicate Western blotting experiments, normalized to β-actin band intensities. (E) G6PD enzyme activities normalized to intracellular protein content (n=3). (F) Reactive oxygen species (ROS) levels are determined by flow cytometry. Results are expressed as the mean fluorescent intensity. (G) Total intracellular reduced glutathione content. Values are normalized to cellular protein concentration. Error bars represent mean ± SD (n=3). For all experiments, Student’s t-test significance values were calculated for AMIECs vs. HCAECs: *p≤0.05 **p≤0.01, and ***p≤0.001.
-
Figure 4—source data 1
Western blotting of PFKFB3 and PFKFB4 in AMIECs and HCAECs.
- https://cdn.elifesciences.org/articles/86260/elife-86260-fig4-data1-v2.zip
-
Figure 4—source data 2
Western blotting for G6PD in AMIECs and HCAECs.
- https://cdn.elifesciences.org/articles/86260/elife-86260-fig4-data2-v2.zip
Figure 5
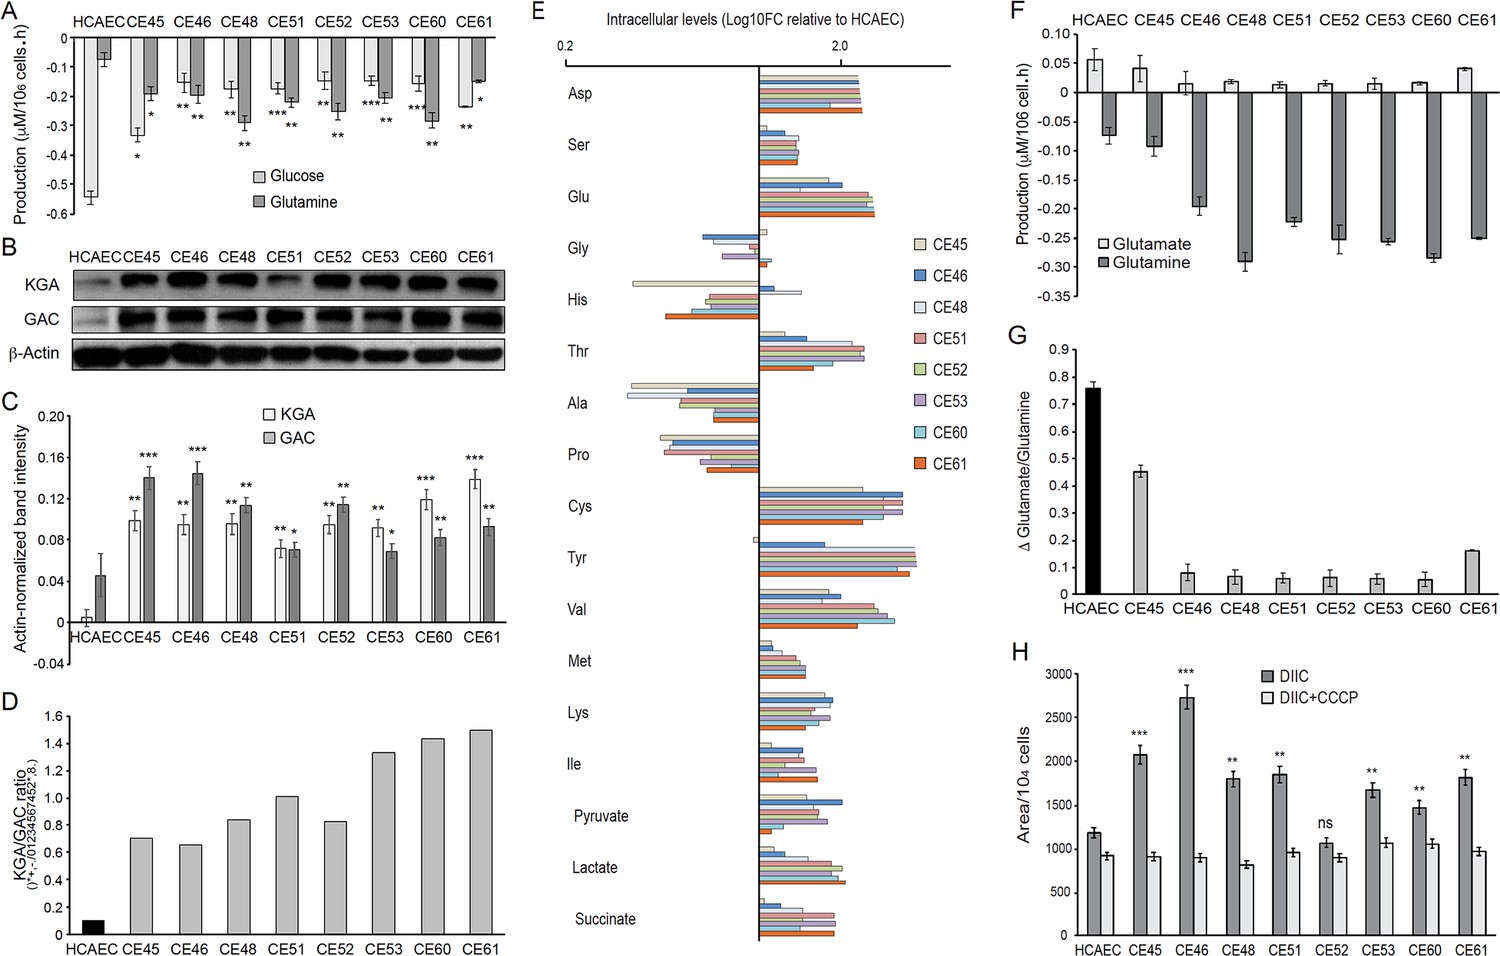
AMI-derived endothelial cells (AMIECs) display a strong glutamine metabolism.
(A) Glutamine and glucose production levels in cell culture medium after 48 hr. Negative values reflect net consumption. (B) Representative Western blotting experiments in AMIECs and human coronary artery endothelial cells (HCAECs) for the two major isoforms of GLS1, kidney-type glutaminase (KGA), and glutaminase C (GAC), using isoform-specific antibodies (Figure 5—source data 1). (C) Quantification of band intensities for KGA and GAC in triplicate western blotting experiments, normalized to β-actin band intensities. (D) Ratio of KGA vs. GAC isoform expression levels, calculated from the actin-normalized band intensities quantitated in (C). (E) Intracellular amino acid levels (F) Glutamate and glutamine production levels in cell culture medium after 48 hr. Negative values reflect net consumption. (G) Glutamine/glutamate consumption ratio. (H) Mitochondrial metabolic potential of AMIECs and control HCAEC cells. Cells were stained with 50 nM DiIC1(5) without or with 50 µM carbonyl cyanide 3-chlorophenylhydrazone (CCCP). Error bars represent mean ± SD (n=3). For all experiments, Student’s t-test significance values were calculated for AMIECs vs. HCAECs: *p≤0.05 **p≤0.01, and ***p≤0.001.
-
Figure 5—source data 1
Western blotting experiments in AMIECs and HCAECs for the two major isoforms of GLS1, KGA and GAC.
- https://cdn.elifesciences.org/articles/86260/elife-86260-fig5-data1-v2.zip
Tables
Table 1
Clinical characteristics of patients providing coronary endothelial outgrowth following thrombectomy for ST-segment elevation myocardial infarction.
Values are number (%) or mean ± standard deviation. ACE = angiotensin-converting enzyme; CABG = coronary artery bypass grafting; PCI = percutaneous coronary intervention.
| n=8 | |
|---|---|
| Age, years | 60±15 |
| Gender, male | 5 (66%) |
| Medical history and risk factors | |
| Previous myocardial infarction | 1 (12%) |
| Previous PCI/CABG | 1 (12 %) |
| Current smoker | 3 (37%) |
| Ex-smoker | 2 (25%) |
| Hypertension | 1 (12%) |
| Hyperlipidaemia | 4 (50%) |
| Family history of premature coronary heart disease | 1 (12%) |
| Diabetes mellitus | 0 |
| Medication on admission | |
| Aspirin | 2 (25%) |
| Clopidogrel | 1 (12%) |
| B-Blockers | 1 (12%) |
| ACE-Inhibitors | 1 (12%) |
| Statins | 3 (38%) |
| Myocardial injury | |
| Troponin I concentration, micrograms/L | 27.9±20.0 |
| Culprit vessel | |
| Left anterior descending artery, n=12 | 1 |
| Circumflex artery, n=2 | 1 |
| Right coronary artery, n=23 | 4 |
Additional files
Download links
A two-part list of links to download the article, or parts of the article, in various formats.
Downloads (link to download the article as PDF)
Open citations (links to open the citations from this article in various online reference manager services)
Cite this article (links to download the citations from this article in formats compatible with various reference manager tools)
Autonomous metabolic reprogramming and oxidative stress characterize endothelial dysfunction in acute myocardial infarction
eLife 12:e86260.
https://doi.org/10.7554/eLife.86260


