Aerobic exercise reverses aging-induced depth-dependent decline in cerebral microcirculation
- Athinoula A Martinos Center for Biomedical Imaging, Massachusetts General Hospital, Harvard Medical School, United States
- Neuroprotection Research Laboratory, Departments of Radiology and Neurology, Massachusetts General Hospital, Harvard Medical School, United States
- Department of Bioengineering, Northeastern University, United States
- Department of Biochemistry and Biophysics, University of Pennsylvania, United States
- Department of Chemistry, University of Pennsylvania, United States
- Biophotonics Research Center, Mallinckrodt Institute of Radiology, Department of Radiology, Washington University School of Medicine, United States
- Brain Cognition and Brain Disease Institute, Shenzhen Institute of Advanced Technology, Chinese Academy of Sciences, China
- Neurovascular Research Laboratory, Department of Radiology, Massachusetts General Hospital, Harvard Medical School, United States
- Stroke Service, Department of Neurology, Massachusetts General Hospital, Harvard Medical School, United States
- Department of Biomedical Engineering, Boston University, United States
Figures
Figure 1 with 4 supplements
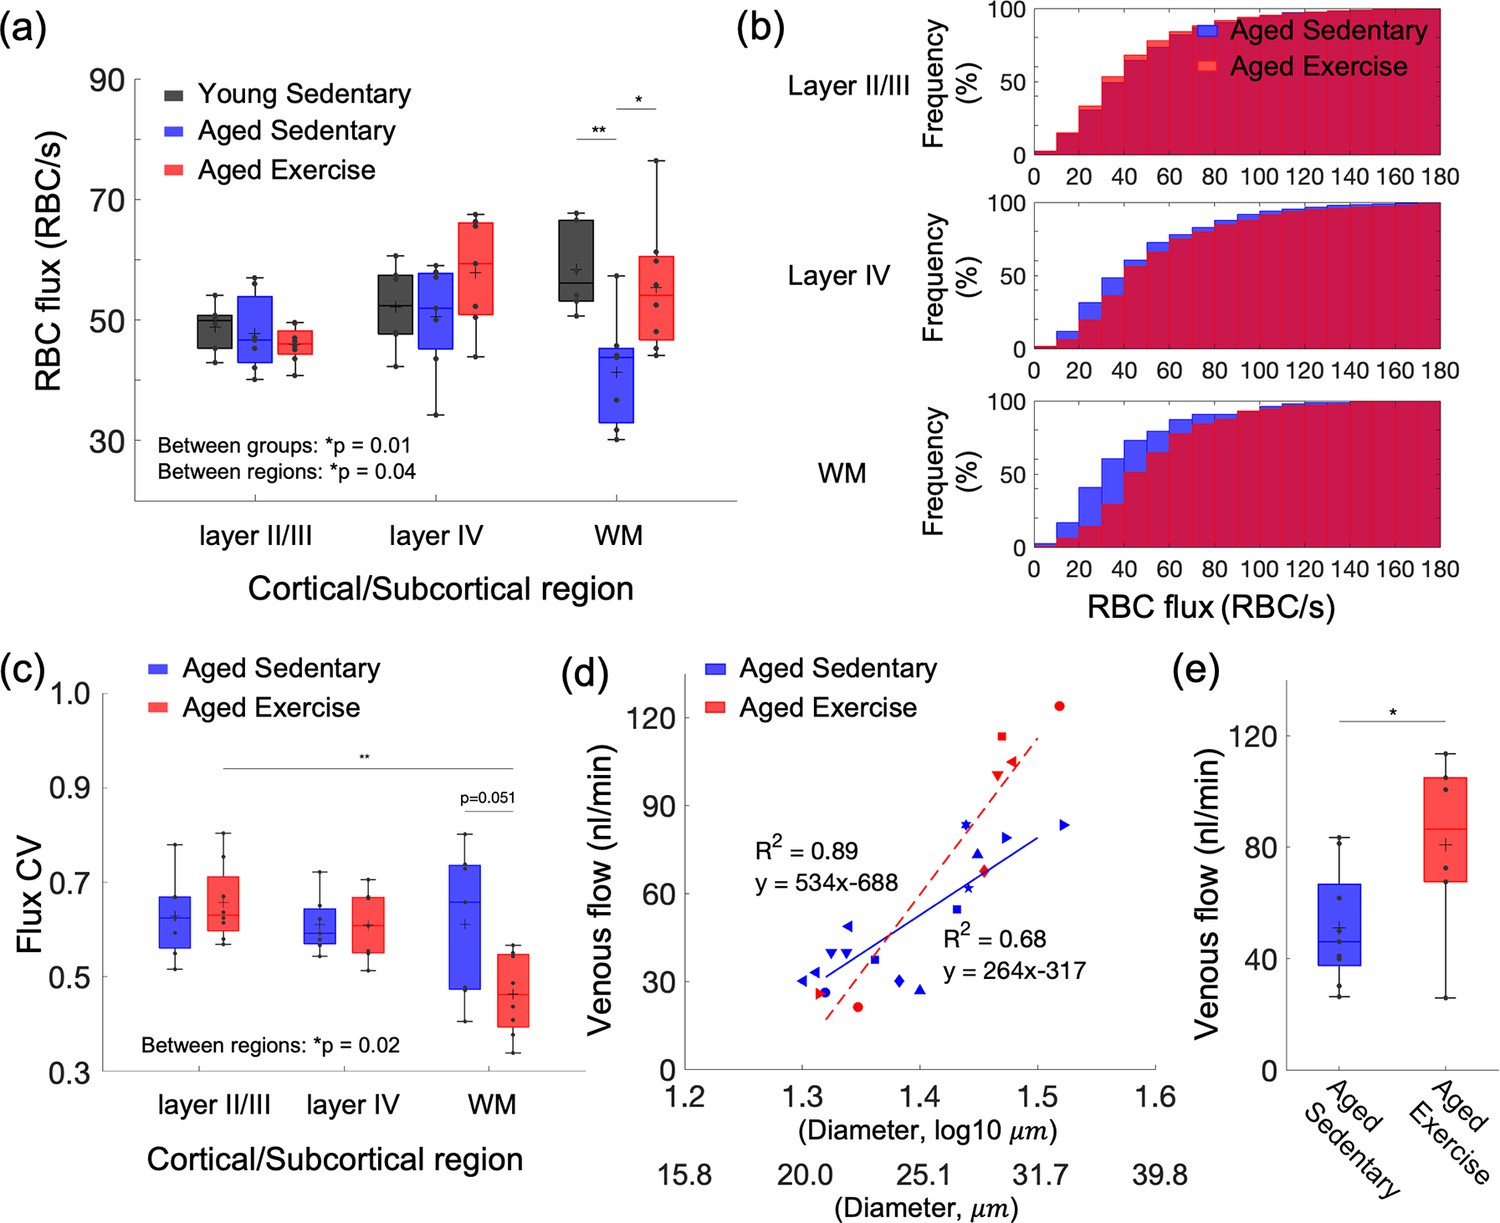
Aging- and exercise-induced alterations in cerebral microcirculation.
(a) Capillary red-blood-cell (RBC) flux across cortical layers II/III and IV, and subcortical white matter in young sedentary, aged sedentary, and aged exercise groups. (b) Cumulative histograms of capillary RBC flux in the gray and white matter in aged sedentary and aged exercise groups. (c) The coefficient of variance (CV) of capillary RBC flux across cortical layers II/III and IV, and subcortical white matter in each animal group. (d) Venular flow versus vessel diameter. Different symbols represent different animals. The red dashed and blue solid line is the best fit result of each linear regression for aged sedentary and aged exercise groups, respectively. (e) Mean venular flow in ascending venules in (d) in aged sedentary and exercise groups. The measured flow values from all the venules were first averaged to obtain the mean flow for each mouse. The mean flow values for each animal group were then obtained by averaging over mice from that group. The data in (a) are from 264, 142, and 168 capillaries in six mice in the young sedentary group, 921, 486, and 112 capillaries in seven mice in the aged sedentary group, and 1046, 465, and 238 capillaries in eight mice in the aged exercise group, in cortical layers II/III, IV, and the white matter, respectively. The data in (d) and (e) are from 14 and 7 ascending venules in 9 and 6 mice in the aged sedentary and aged exercise groups, respectively. Statistical analysis was carried out using two-way analysis of variance (ANOVA) with post hoc Tukey’s in (a) and (c) and Student’s t-test in (e). *p < 0.05; **p < 0.01. Additional details on boxplots and animals excluded from the analyses are provided in the Supplementary document.
-
Figure 1—source data 1
Capillary red-blood-cell (RBC) flux measured in young and aged mice.
- https://cdn.elifesciences.org/articles/86329/elife-86329-fig1-data1-v2.xlsx
-
Figure 1—source data 2
Capillary red-blood-cell (RBC) flux coefficient of variance (CV) measured in aged mice.
- https://cdn.elifesciences.org/articles/86329/elife-86329-fig1-data2-v2.xlsx
-
Figure 1—source data 3
Venous flow measured in aged mice.
- https://cdn.elifesciences.org/articles/86329/elife-86329-fig1-data3-v2.xlsx
Figure 1—figure supplement 1
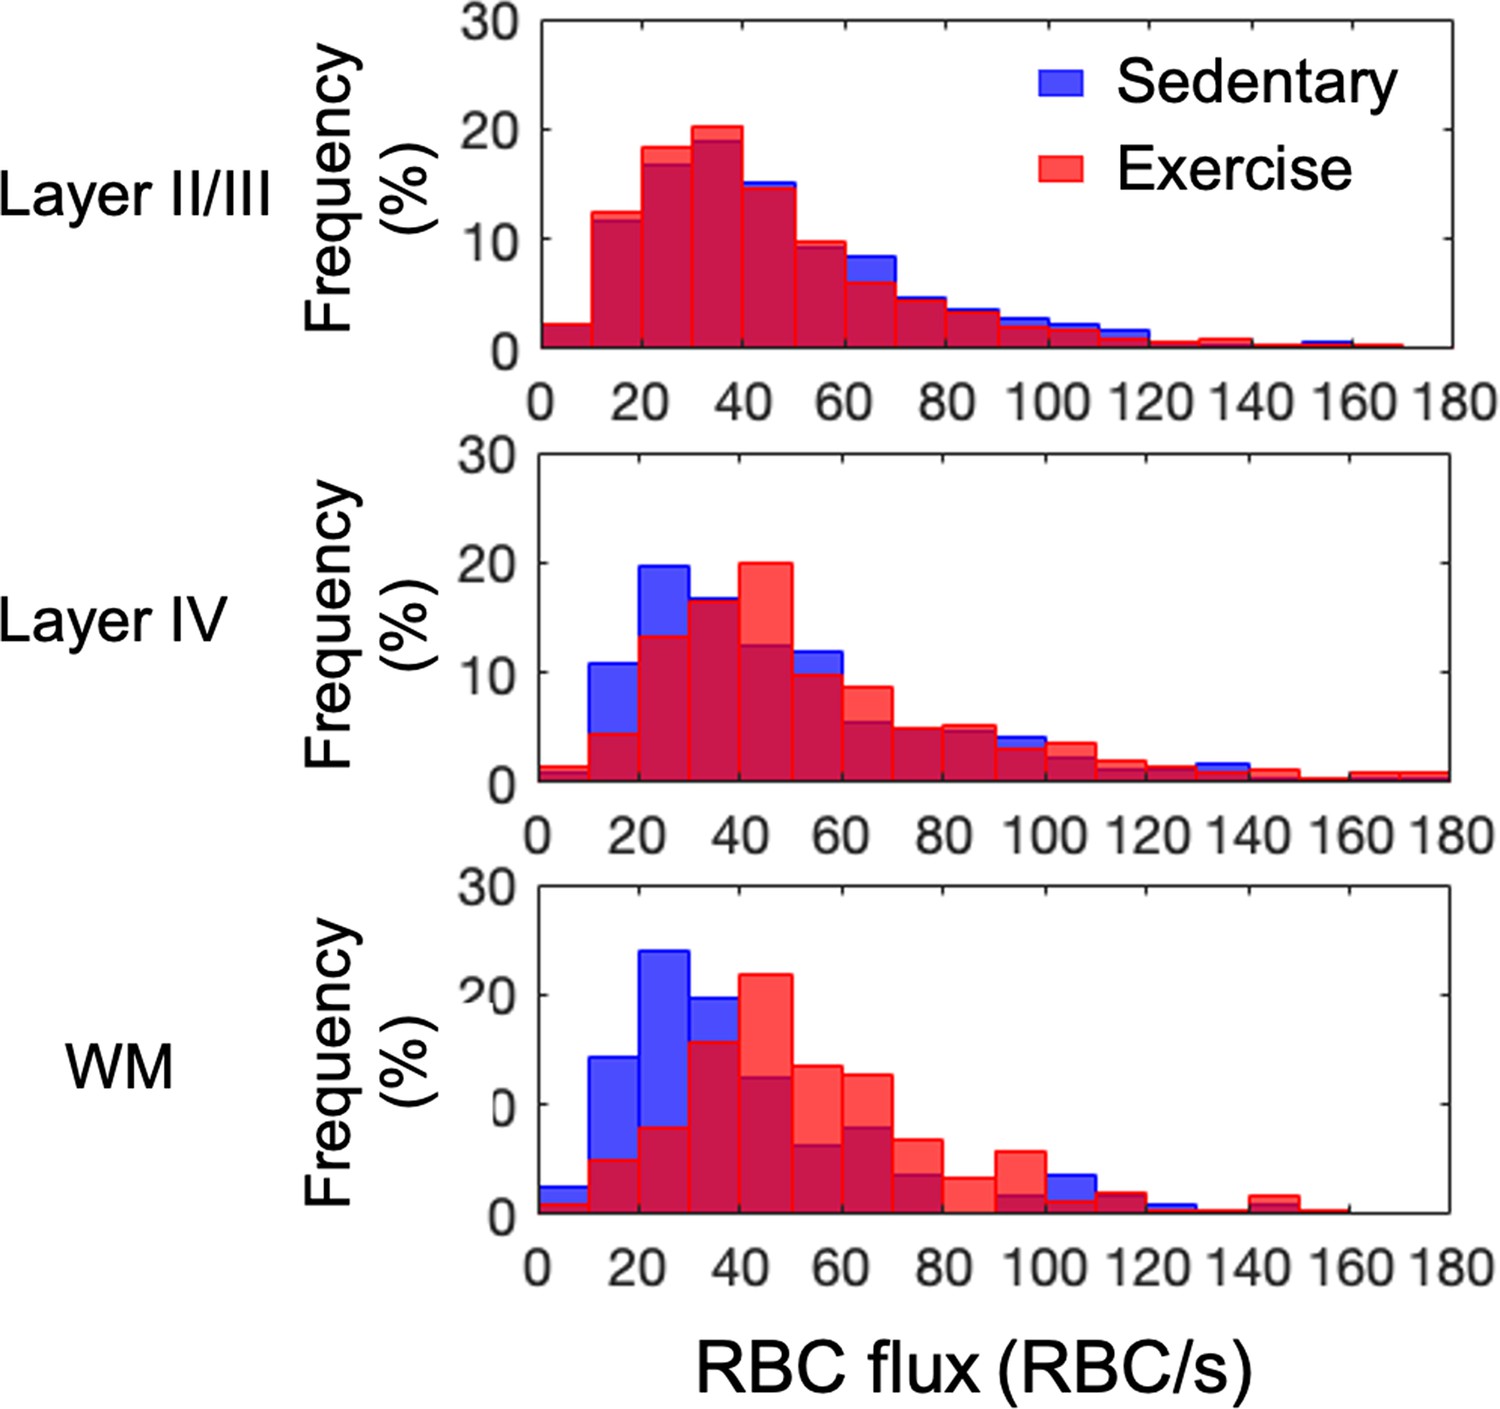
Histograms of capillary red-blood-cell (RBC) flux in the gray and white matter in each animal group.
The analysis was made with 921, 486, and 112 capillaries in seven mice in the aged sedentary group and 1046, 465, and 238 capillaries in eight mice in the aged exercise group, in cortical layers II/III, IV, and the white matter, respectively.
Figure 1—figure supplement 2
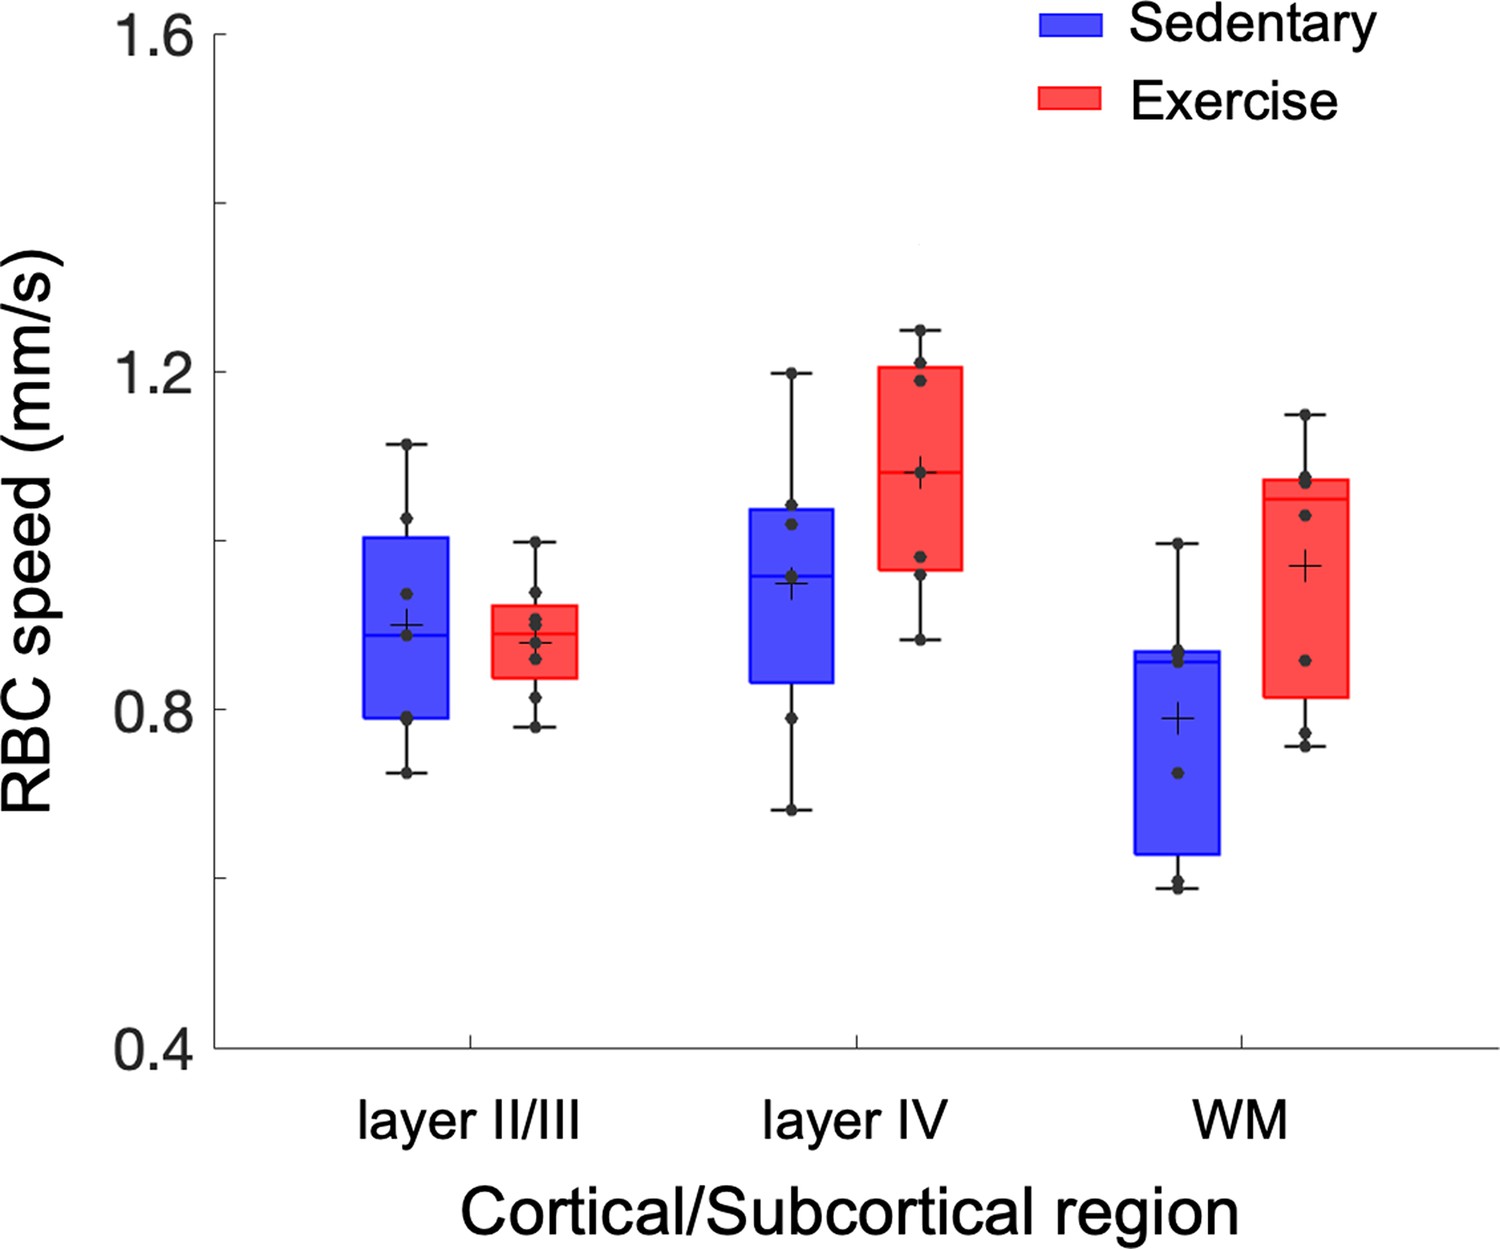
Exercise-induced alterations in capillary red-blood-cell (RBC) speed.
Capillary RBC speed across cortical layers II/III and IV, and subcortical white matter in aged sedentary and running mice, respectively. The analysis was made with 921, 486, and 112 capillaries across n = 7 mice in the aged sedentary group and 1046, 465, and 238 capillaries across n = 8 mice in the aged exercise group in cortical layers II/III, IV, and the white matter. Statistical comparisons were carried out using two-way analysis of variance (ANOVA) with Tukey post hoc test.
Figure 1—figure supplement 3
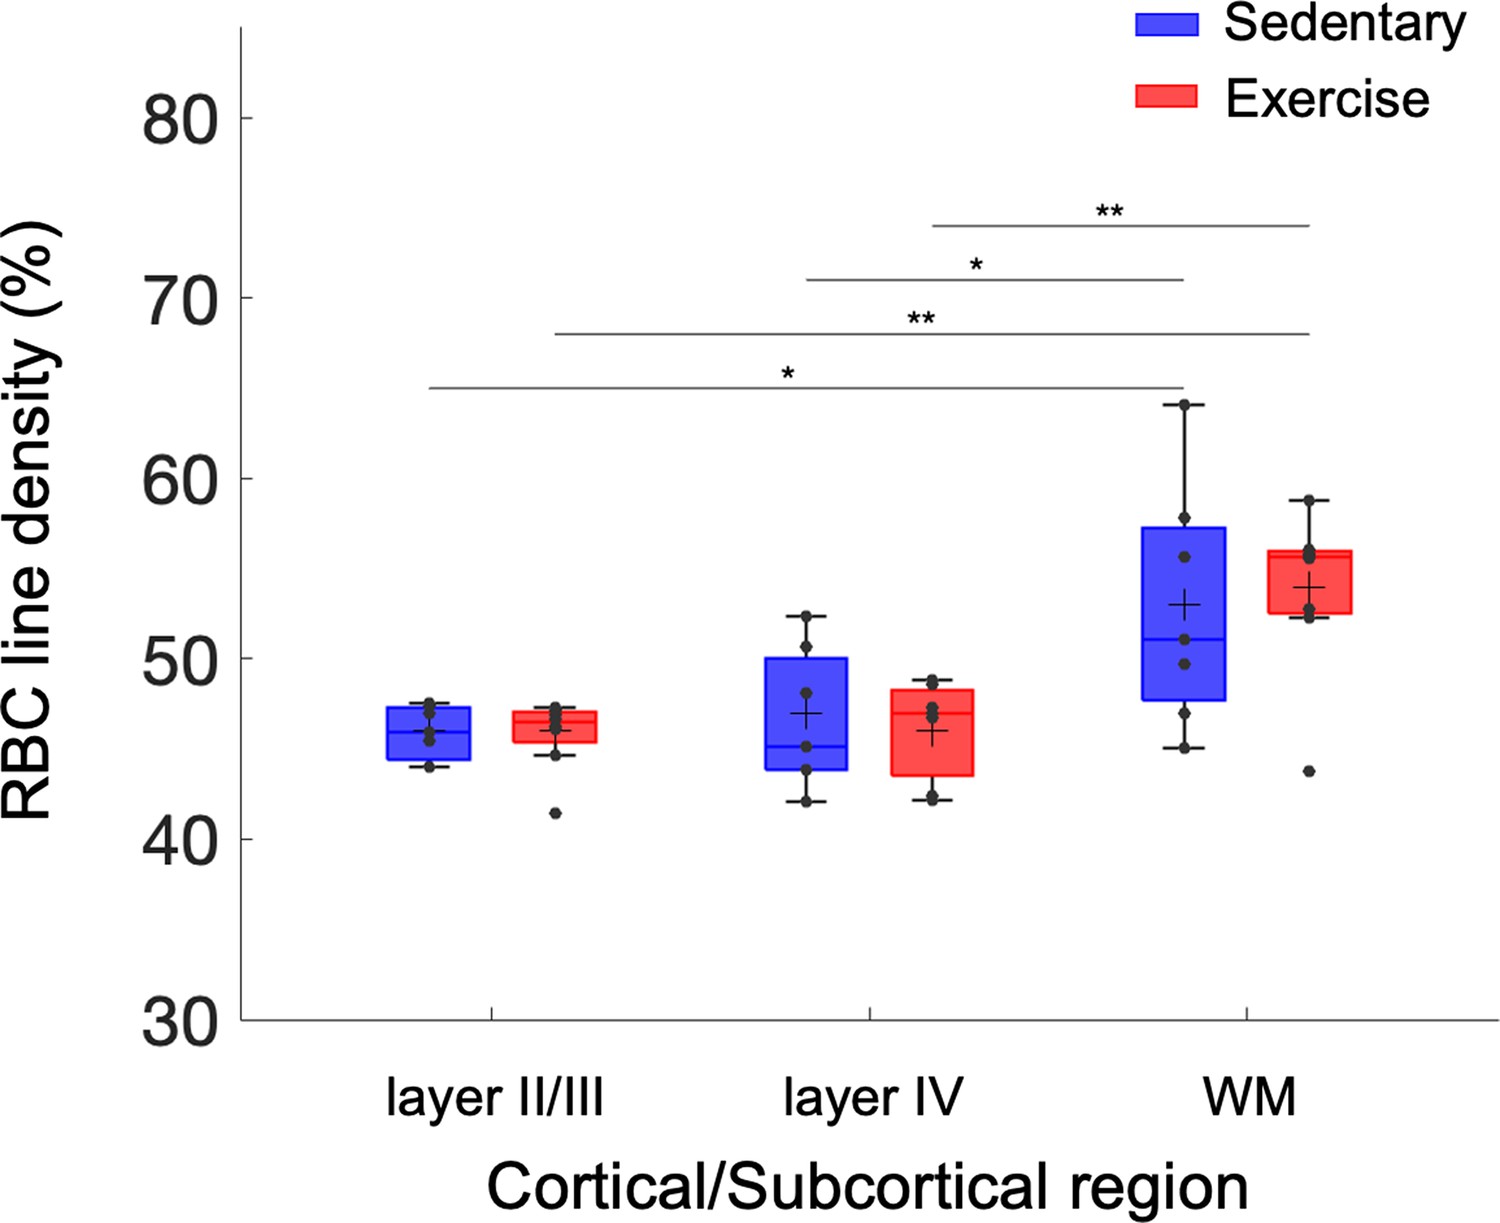
Exercise-induced alterations in capillary red-blood-cell (RBC) line-density.
Capillary RBC line-density across cortical layers II/III and IV, and subcortical white matter in aged sedentary and running mice. The analysis was made with 921, 486, and 112 capillaries across n = 7 mice in aged sedentary group and 1046, 465, and 238 capillaries across n = 8 mice in the aged exercise group in cortical layers II/III, IV, and the white matter. Statistical comparisons were carried out using two-way analysis of variance (ANOVA) with Tukey post hoc test. The single-asterisk symbol (*) indicates p < 0.05; the double-asterisk symbol (**) indicates p < 0.01.
Figure 1—figure supplement 4

Correlations between the capillary red-blood-cell (RBC) flux and coefficient of variance (CV), and the running activity.
Each data point represents an individual animal. The black solid line is the best linear regression fit. (a, b) Correlations between the capillary RBC flux and CV in the white matter and the average daily running distance, respectively. (c, d) Correlations between the CV of capillary RBC flux and CV in the gray matter and the average daily running distance, respectively. For each animal, the gray matter capillary RBC flux was calculated by averaging the acquired flux values from cortical layers II/III and IV.
Figure 2 with 2 supplements
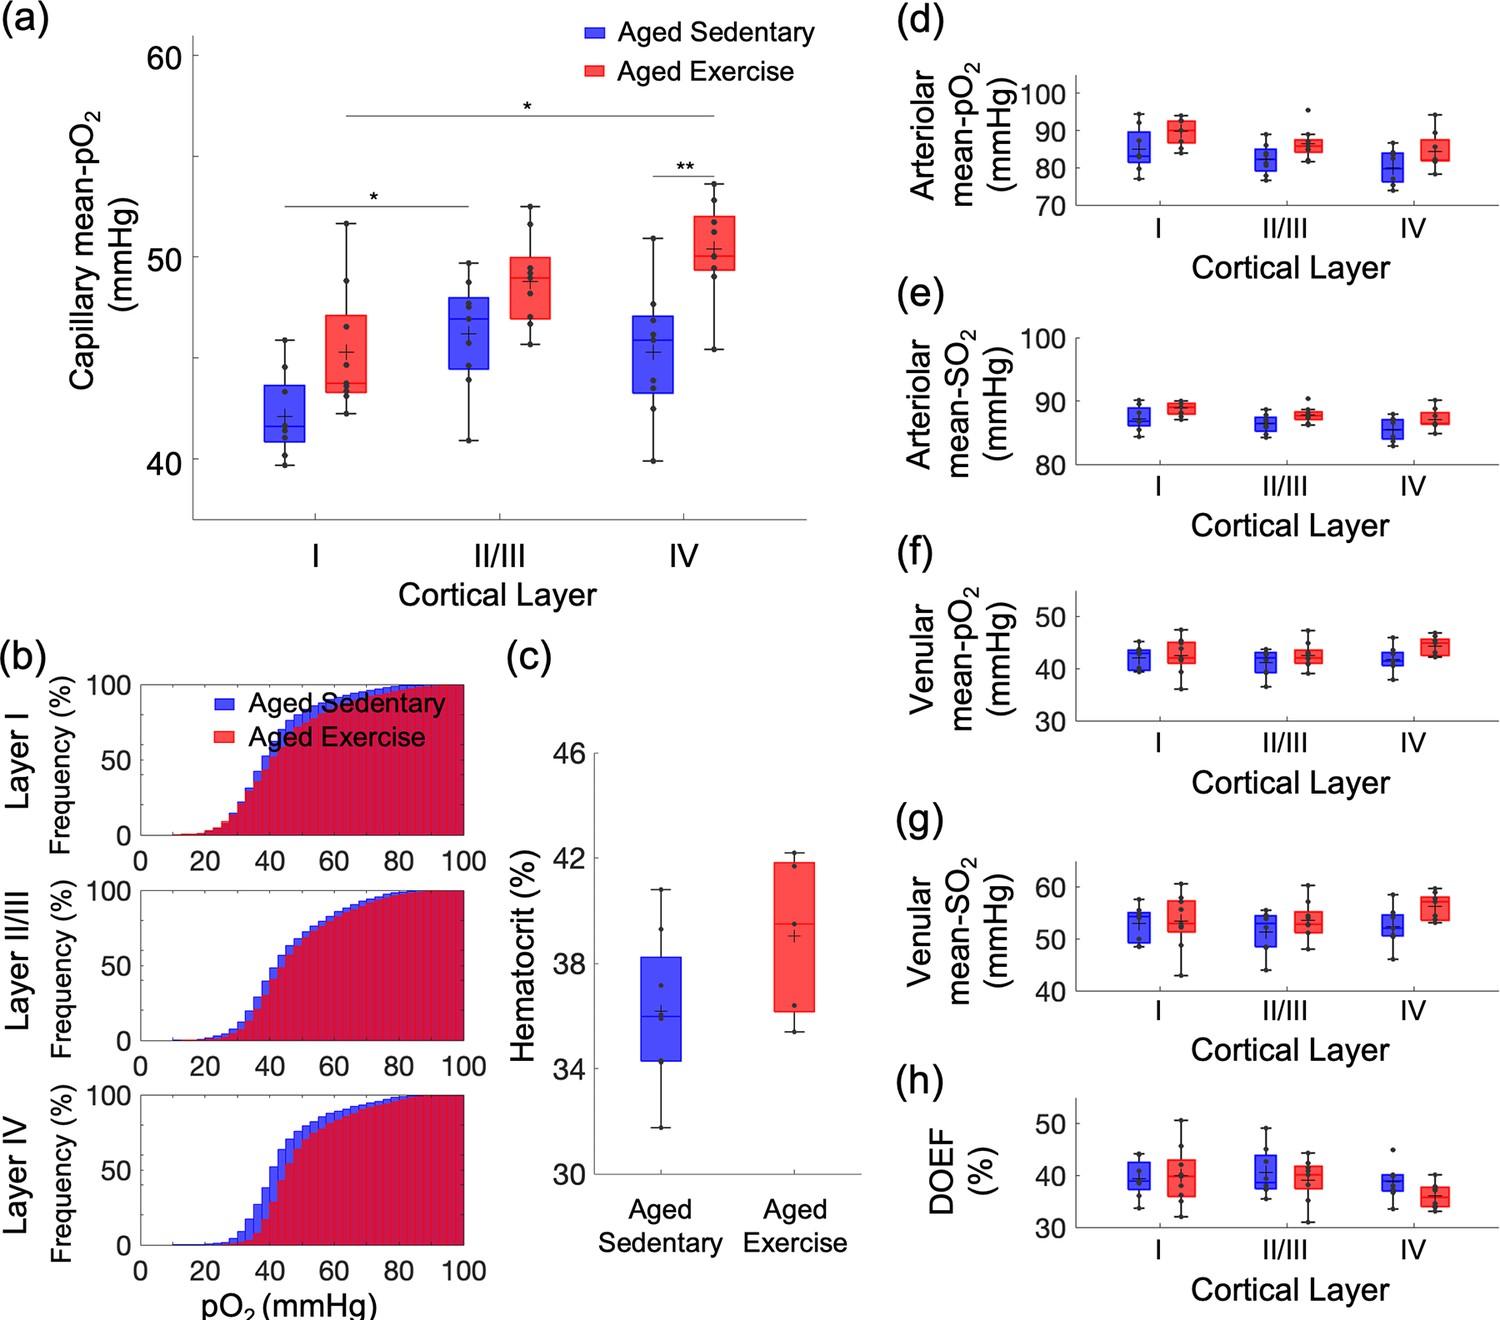
Exercise-induced changes in microvascular pO2 across cortical layers in old mice.
(a) Capillary mean pO2 across cortical layers in aged sedentary controls and exercising mice. (b) Cumulative histograms of capillary pO2 in layers I, II/III, and IV. (c) The mean Hct levels from aged sedentary (n = 8) and aged exercise groups (n = 5). (d, e) Intravascular pO2 and SO2 in the diving arterioles across cortical layers I–IV in aged sedentary (blue boxplots) and aged exercise (red boxplots) groups, respectively. (f, g) Intravascular pO2 and SO2 in the surfacing venules across cortical layers I–IV in aged sedentary (blue boxplots) and aged exercise (red boxplots) groups, respectively. (h) Depth-dependent OEF in aged sedentary (blue boxplots) and aged exercise (red boxplots) groups. The analysis in (a) and (b) was made with 1224, 2601, and 922 capillaries across n = 9 mice in aged sedentary group and 1334, 2840, and 1078 capillaries across n = 9 mice in aged exercise group in cortical layers I, II/III, and IV, respectively. The analysis in (d–h) was made with 13 arterioles and 12 venules from n = 9 mice in aged sedentary group and 14 arterioles and 12 venules from n = 9 mice in aged exercise group. Statistical analysis was carried out using two-way analysis of variance (ANOVA) with post hoc Tukey’s in (a) and (d–h) and Student’s t-test in (f). *p < 0.05; **p < 0.01. Additional details on boxplots and exclusions are provided in the Supplementary document.
-
Figure 2—source data 1
Capillary pO2 measured in aged mice.
- https://cdn.elifesciences.org/articles/86329/elife-86329-fig2-data1-v2.xlsx
-
Figure 2—source data 2
Blood hematocrit level measured in aged mice.
- https://cdn.elifesciences.org/articles/86329/elife-86329-fig2-data2-v2.xlsx
-
Figure 2—source data 3
Arterial (and venous) pO2 measured in aged mice.
- https://cdn.elifesciences.org/articles/86329/elife-86329-fig2-data3-v2.xlsx
Figure 2—figure supplement 1
Histograms of capillary pO2 in layers I, II/III, and IV.
The analysis was made with 1224, 2601, and 922 capillaries across n = 9 mice in aged sedentary group and 1334, 2840, and 1078 capillaries across n = 9 mice in aged exercise group in cortical layers I, II/III, and IV, respectively.
Figure 2—figure supplement 2
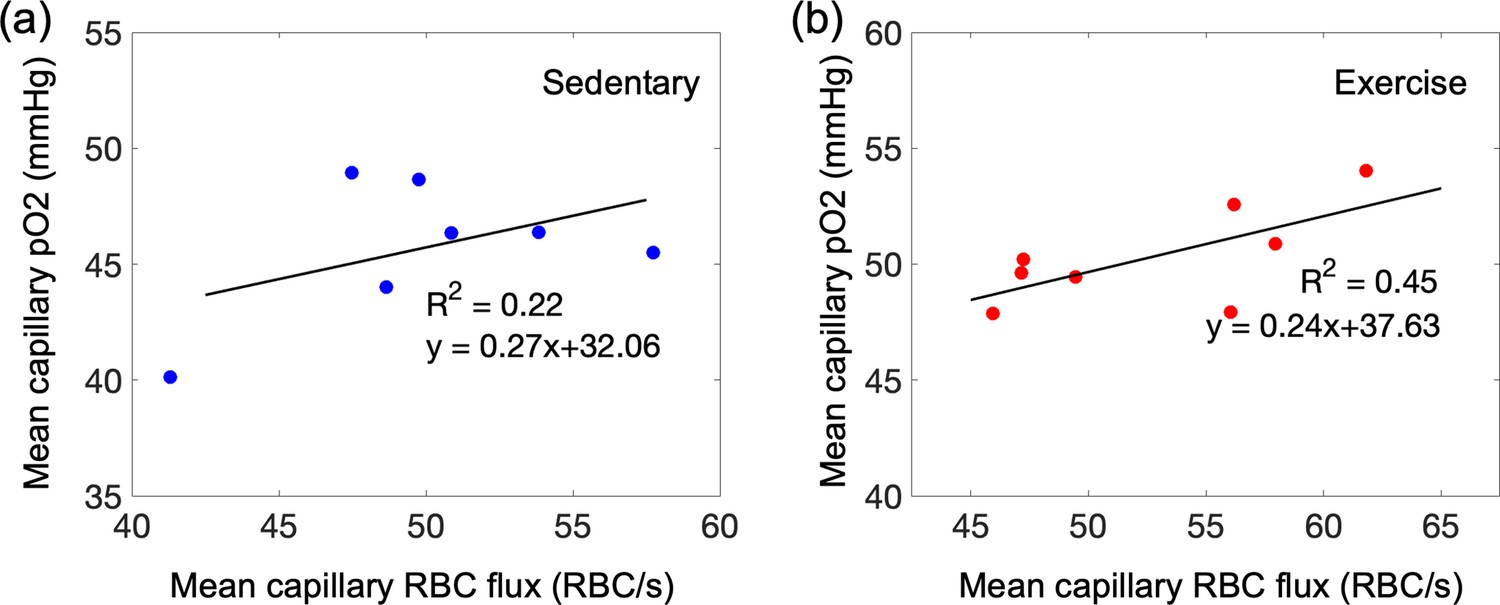
Capillary mean pO2 versus capillary red-blood-cell (RBC) flux in the mouse cortex.
(a, b) Correlations between the mean capillary pO2 and the mean capillary RBC flux in aged sedentary and exercise mice, respectively. The black solid line is the best fit result of each linear regression (, for aged sedentary mice and , for running mice). Each data point represents an individual animal. For each animal, the mean capillary RBC flux and the mean capillary pO2 were calculated by averaging the acquired RBC flux and pO2 values from cortical layers II/III and IV, and cortical layers I, II/III, and IV, respectively. The correlation coefficient (the R value) for each group was converted to Fisher z value to compare difference between correlation coefficients of aged sedentary and exercise mice, and no significant difference was found (the observed z value = 0.44).
Figure 3 with 1 supplement
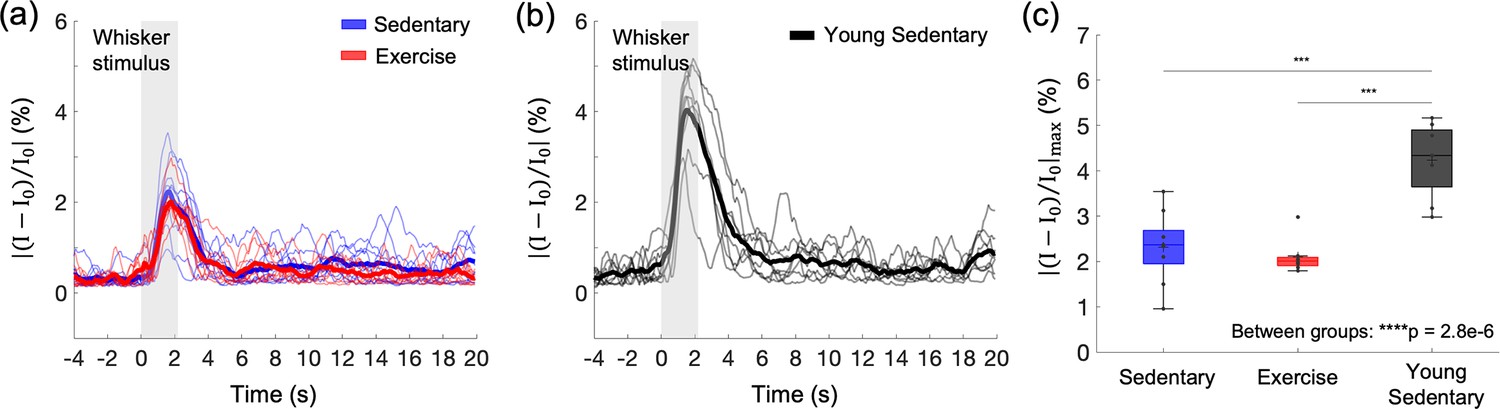
Effects of aging and exercise on functional hemodynamic response.
Optical intrinsic signal time courses in the whisker barrel cortex of individual old mice in aged sedentary (blue; n = 9) and aged exercise (red; n = 8) mice (a), and young (7 months old) sedentary mice (n = 8) (b). Thick curves represent averages. (c) Average changes in the peak intensity in aged sedentary, aged exercise, and young groups. One-way analysis of variance (ANOVA) with Tukey post hoc test. **p < 0.01; ***p < 0.001; ****p < 0.0001. Please see Supplementary document for exclusions.
-
Figure 3—source data 1
Peak hemodynamic response amplitude measured in young and aged mice.
- https://cdn.elifesciences.org/articles/86329/elife-86329-fig3-data1-v2.xlsx
Figure 3—figure supplement 1
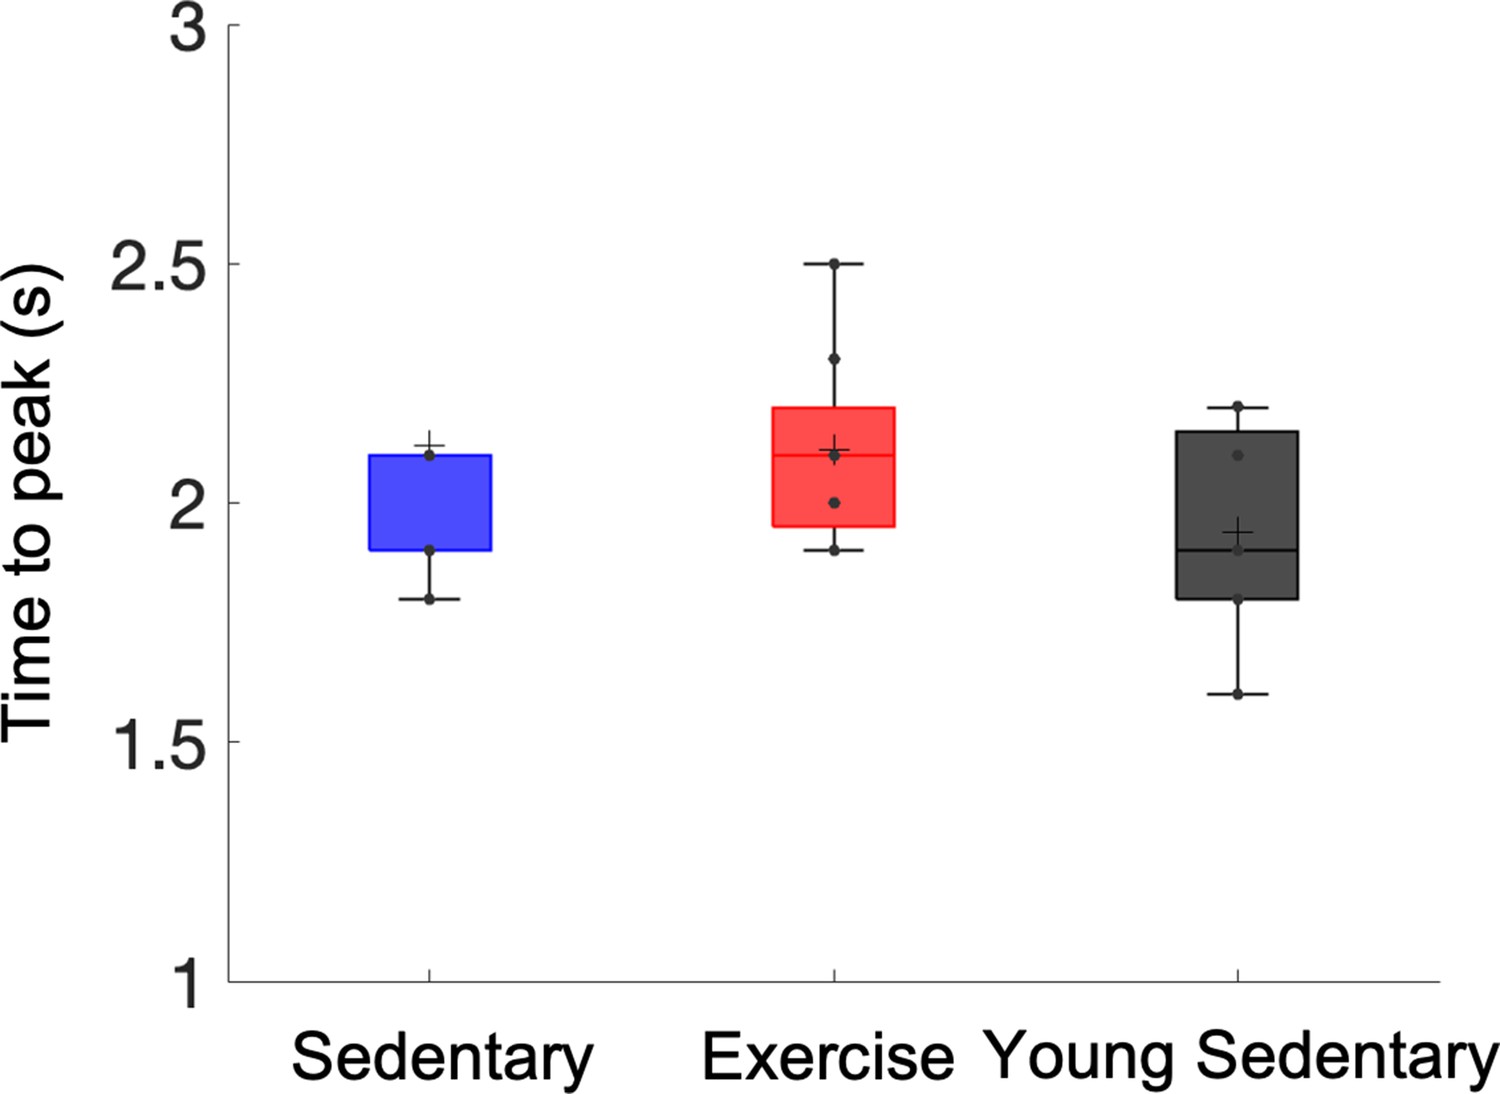
Differences in the latency (time to peak) of stimulus-induced hemodynamic response between aged sedentary, aged exercise, and young sedentary mice.
Statistical comparisons were carried out using one-way analysis of variance (ANOVA) with Tukey post hoc test.
Figure 4
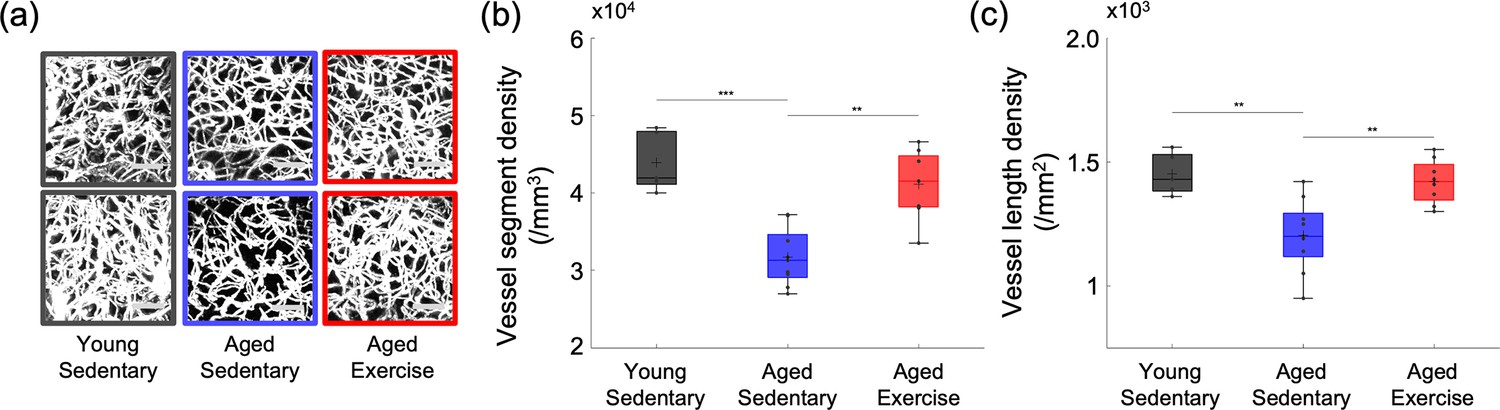
Cortical microvascular density in aged mice.
(a) Representative maximum intensity projection (MIP) images of the three-dimensional angiograms of three mice in the young sedentary group, three mice in the aged sedentary group, and three mice in the aged exercise group, over the cortical depth range from 50 to 400 μm, and 200 × 200 μm2 field of view (FOV). Scale bars: 50 μm. (b) Vessel segment density and (c) vessel length density of cortical capillaries from young sedentary (n = 5 mice), aged sedentary (n = 9 mice), and aged exercise (n = 8 mice) groups. Student’s t-test. **p < 0.01; ***p < 0.001. Please see Supplementary document for exclusions.
-
Figure 4—source data 1
Cortical capillary segment/length density measured in young and aged mice.
- https://cdn.elifesciences.org/articles/86329/elife-86329-fig4-data1-v2.xlsx
Figure 5
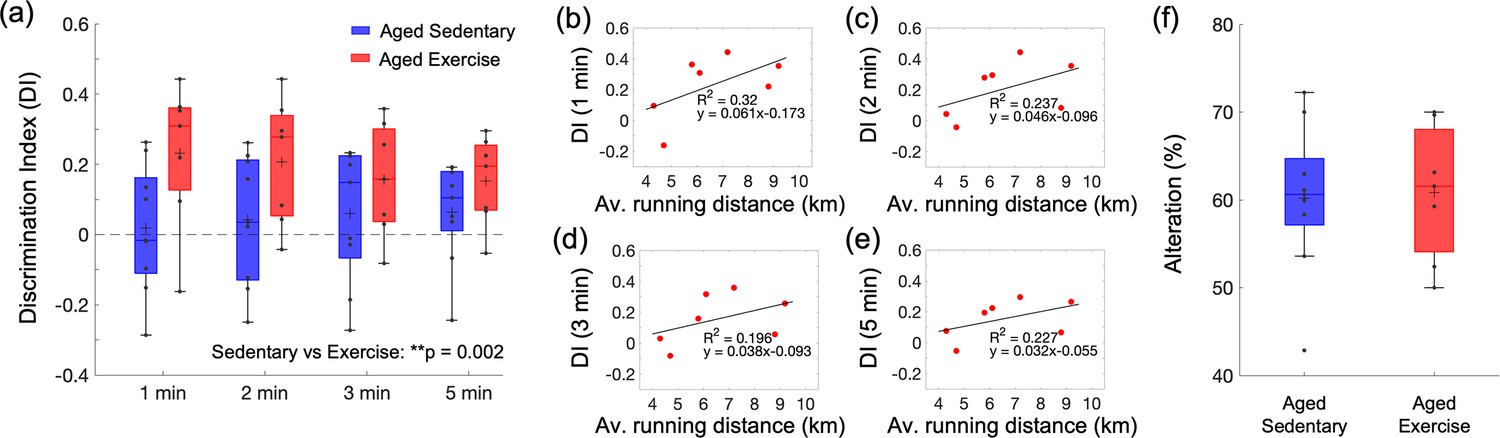
Effect of exercise in the old mice on cognitive performance.
(a) Discrimination index (DI) scores in novel object recognition test (NORT), calculated with four different exploration time periods in the aged sedentary (n = 9) and aged exercise (n = 7) groups. The calculated DI values at each time interval were subsequently averaged across animals. (b–e) Correlations between the daily average running distance and four different DI scores: 1, 2, 3, and 5 min, respectively. (f) Spontaneous alteration scores in the Y-maze test in the aged sedentary (n = 9) and aged exercise (n = 7) groups. Statistical analysis was carried out using two-way analysis of variance (ANOVA) with post hoc Tukey’s in (a) and Student’s t-test in (f). **p < 0.01. Please see Supplementary document for exclusions.
-
Figure 5—source data 1
Behavioral scores from novel object recognition test (NORT) and Y-maze test measured in aged mice.
- https://cdn.elifesciences.org/articles/86329/elife-86329-fig5-data1-v2.xlsx
Figure 6
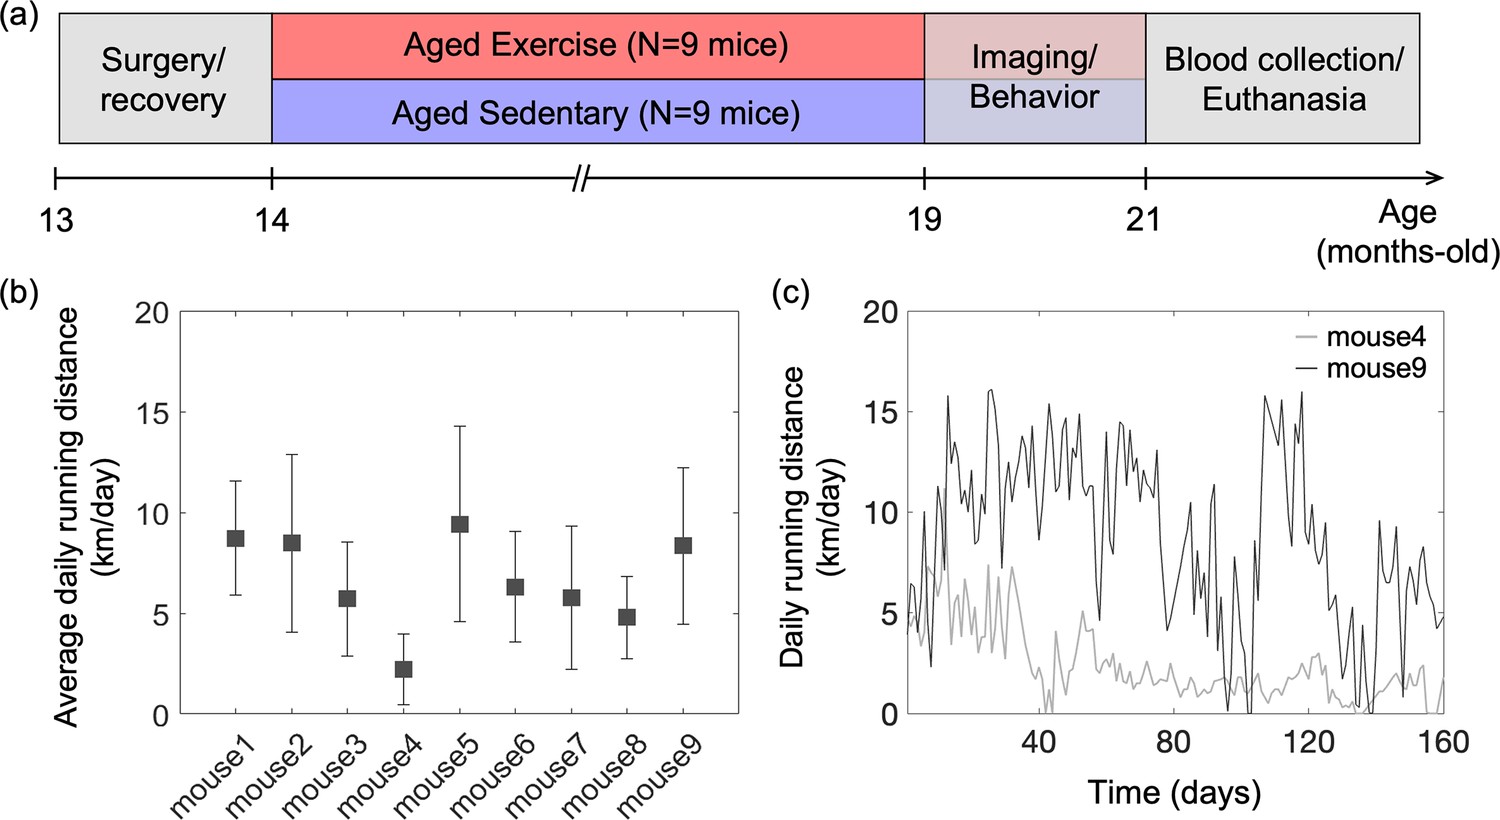
Animal preparation and experiment design.
(a) Timeline of the study. Optical measurements and behavioral testing were performed after 5 months of voluntary exercise when the animals were 19–21 months of age. (b) Average daily running distance in km per day for each mouse in the aged exercise group, calculated as the sum of daily running distance divided by a total running period of 5 months. Data are shown as mean ± standard deviation (SD). (c) Daily running distance for two representative mice in the aged exercise group across time.
Figure 7
Experimental setup and imaging protocols.
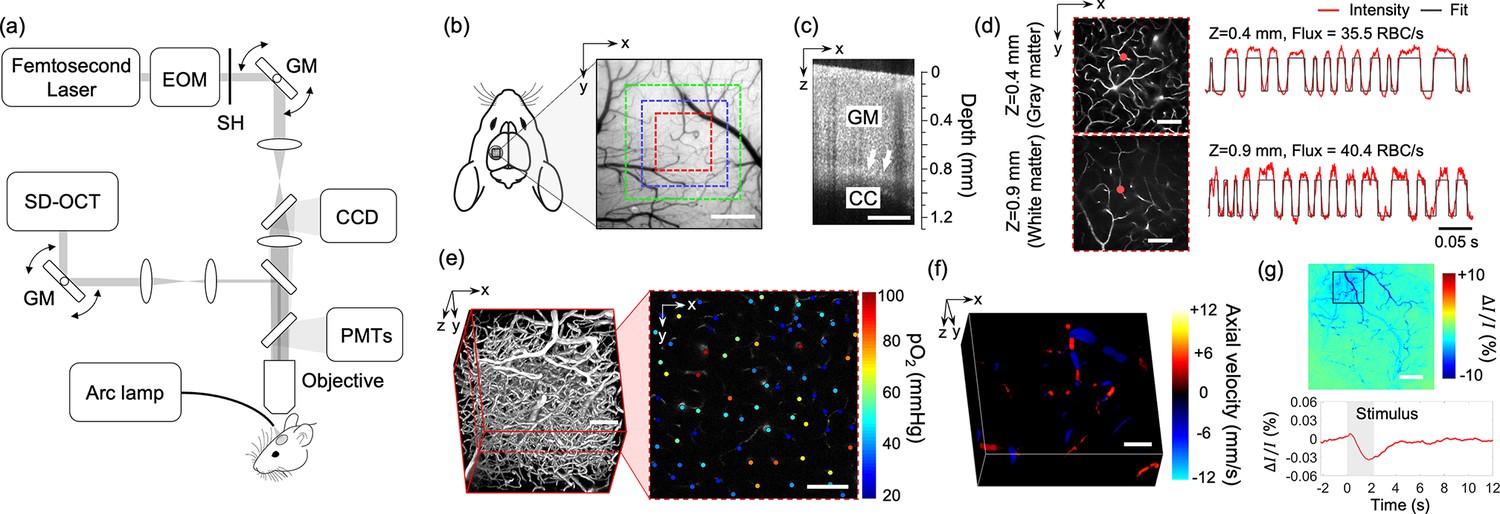
(a) Schematic of our home-built multimodal optical system featuring primary components of the system. A 50-kHz spectral-domain optical coherence tomography (OCT) system was designed to partially share the imaging optics with the two-photon microscope. A Hg:Xe arc lamp in combination with a CCD camera was used for optical intrinsic signal imaging (OISI). EOM: electro-optic modulator, SH: shutter, GM: galvanometer mirror pair. (b) A CCD image of brain surface vasculature in the mouse barrel cortex showing the regions of interest (ROIs) where various optical measurements were performed (red ROI: capillary red-blood-cell [RBC] flux, pO2, and microvasculature imaging, blue ROI: Doppler OCT imaging, and green ROI: OCT intensity imaging). (c) A representative OCT intensity B-scan image extracted from a volumetric OCT image. White arrows indicate the boundary between the gray matter (GM) and the corpus callosum (CC), which appears as a bright band in the image. (d) Survey scan images of cerebral microvasculature of the region outlined with the red square in (b) obtained by two-photon microscope at two imaging depths (z = 0.4 and 0.9 mm). Two representative fluorescent intensity time courses acquired within the capillaries at the locations indicated by the red dots in the survey angiograms are presented on the right. (e) A 3D angiogram of the mouse cortex acquired by the two-photon microscope at the location outlined by the red square in (b). One representative 2D plane from the angiogram acquired at a depth of 200 μm showing pO2 measurements from different capillary segments. pO2 values were color coded (in mmHg) and spatially co-registered with the angiogram. (f) A 3D Doppler OCT image showing an axial velocity map of the diving vessels at the location outlined by the blue square in (b). (g) An OIS image of the cranial window obtained by calculating the relative intensity difference between the post-stimulus response image and pre-stimulus baseline. The region of activation is manually selected from the OIS image as indicated by a black square. The lower panel shows a time course of the relative intensity change due to sensory-evoked hemodynamic response induced by a 2-s-long whisker stimulation, averaged over the selected region of interest. Scale bars: 400 μm for (b) and (c), 100 μm for (d–f), and 500 μm for (g).
Author response image 1

Correlations between capillary flow and running activity in the aged exercise group.
(a) and (b) Correlations of the average running distance with the white matter capillary RBC flux and CV, respectively. (c) and (d) Correlations of the total running distance with the white matter capillary RBC flux and CV, respectively. (a) and (b) Correlations of the average running distance with the gray matter capillary RBC flux and CV, respectively. (c) and (d) Correlations of the total running distance with the gray matter capillary RBC flux and CV, respectively.
Author response image 2

Correlations between behavioral performance and running activity in the exercise group.
(a-d) Correlations between the total running distance and four different DI scores: 1, 2, 3, and 5 minutes, respectively. (a-d) Correlations between the average running distance and four different DI scores: 1, 2, 3, and 5 minutes, respectively.
Additional files
Download links
A two-part list of links to download the article, or parts of the article, in various formats.
Downloads (link to download the article as PDF)
Open citations (links to open the citations from this article in various online reference manager services)
Cite this article (links to download the citations from this article in formats compatible with various reference manager tools)
Aerobic exercise reverses aging-induced depth-dependent decline in cerebral microcirculation
eLife 12:e86329.
https://doi.org/10.7554/eLife.86329


