Altered hierarchical auditory predictive processing after lesions to the orbitofrontal cortex
- RITMO Centre for Interdisciplinary Studies in Rhythm, Time and Motion, Department of Psychology, University of Oslo, Norway
- RITMO Centre for Interdisciplinary Studies in Rhythm, Time and Motion, Department of Musicology, University of Oslo, Norway
- Helen Wills Neuroscience Institute and Department of Psychology, University of California, Berkeley, United States
- Université de Franche-Comté, SUPMICROTECH, CNRS, Institut FEMTO-ST, France
- Université Paris Cité, Institute of Psychiatry and Neuroscience of Paris (IPNP), INSERM U1266, Team TURC, France
- Department of Neuropsychology, Helgeland Hospital, Norway
- Regional Department of Eating Disorders, Oslo University Hospital, Norway
- Department of Neurosurgery, National Hospital, Denmark
- Department of Neurosurgery, Oslo University Hospital, Norway
Figures
Figure 1 with 4 supplements
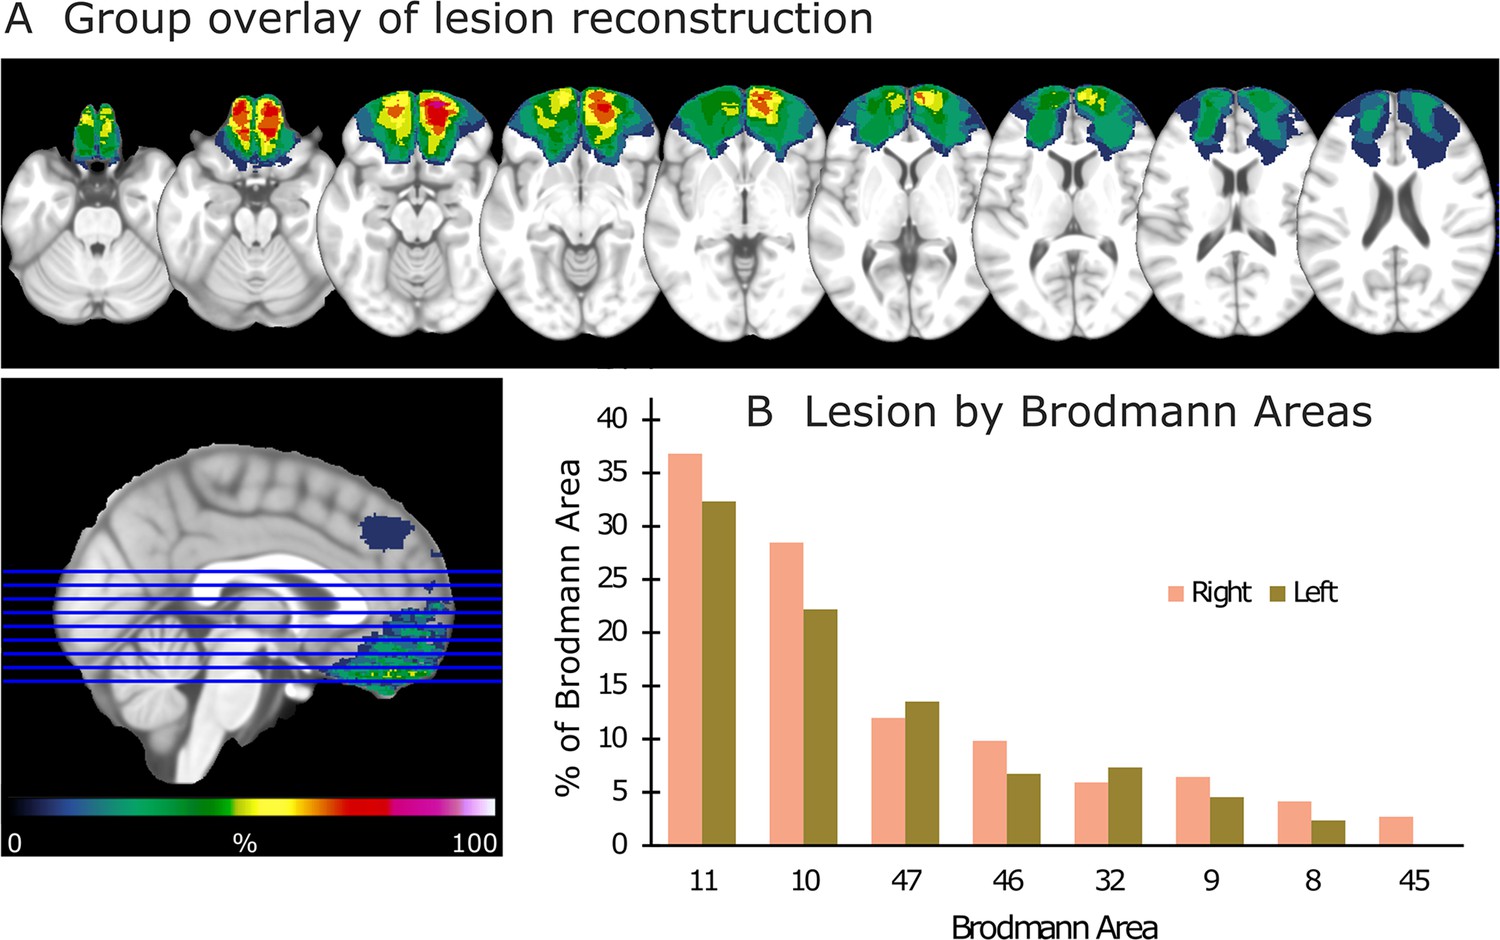
Lesion reconstruction for the group with orbitofrontal cortex (OFC) damage.
(A) Aggregate lesion overlay maps in axial view. The color code (from 0 to 100%) for the group overlay indicates the percentage of shared lesion coverage across patients. The redder the color, the greater the lesion overlap. Neurological convention: the right side of the brain is depicted on the right side of the image and vice versa. (B) Average percentage of damaged tissue within each Brodmann area (BA) per hemisphere. BAs with less than 2% damage are not presented.
Figure 1—figure supplement 1
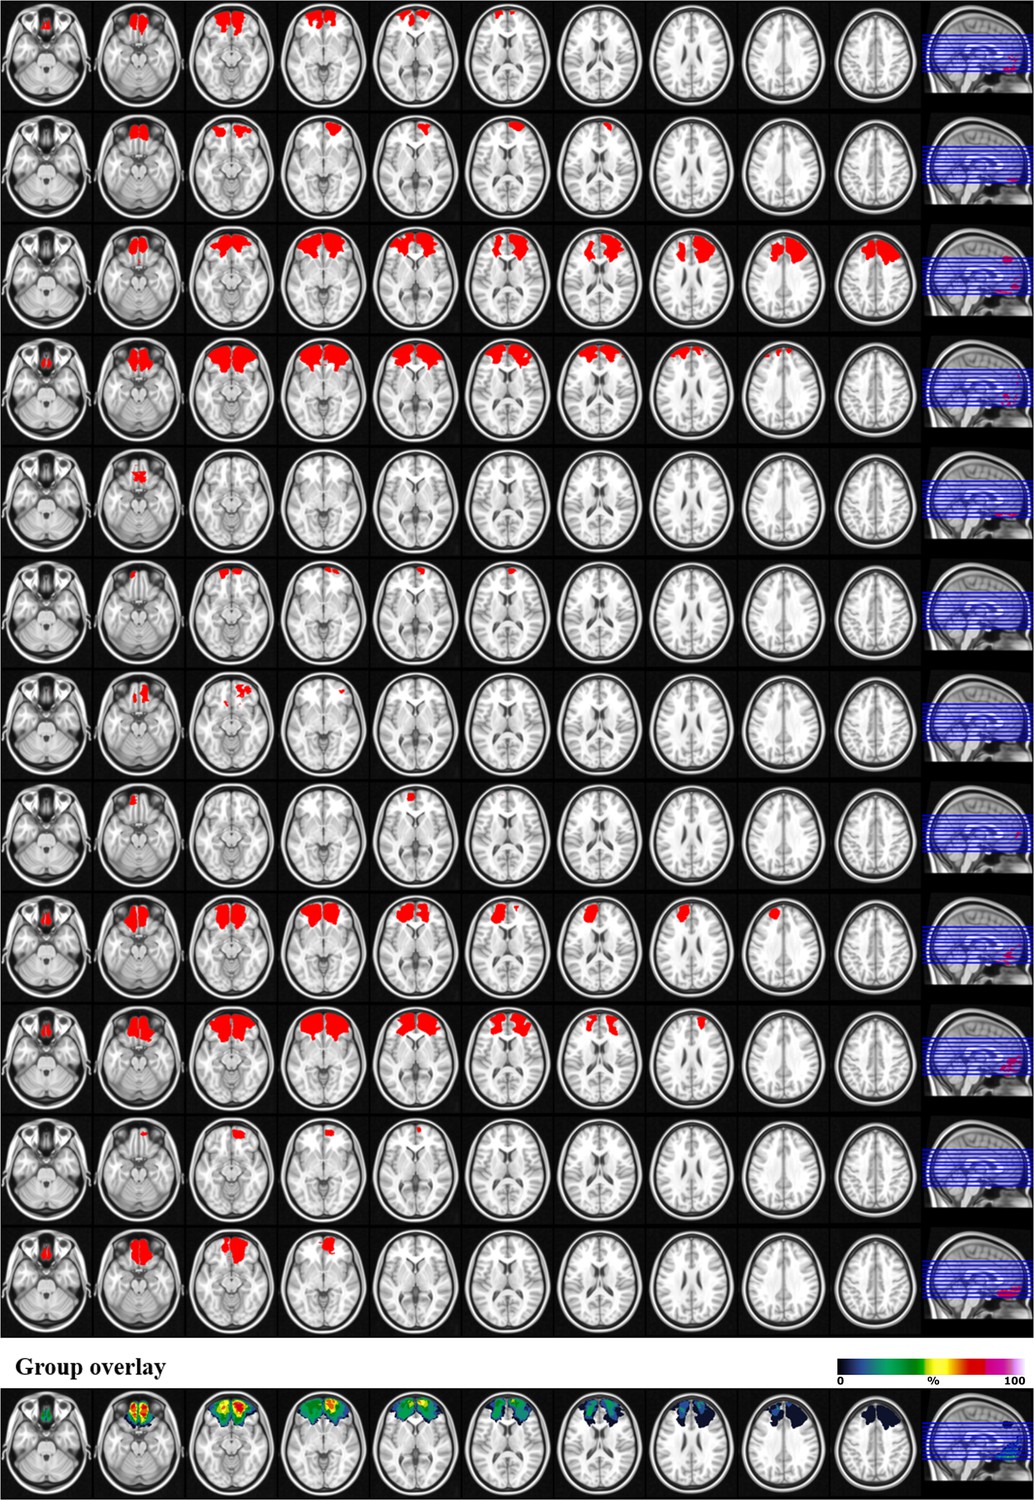
Lesion reconstructions for the orbitofrontal cortex (OFC) group.
Individual patients (1–12) and group overlay (bottom row). The color code for the group overlay indicates the number of patients with damaged tissue in that area.
Figure 1—figure supplement 2
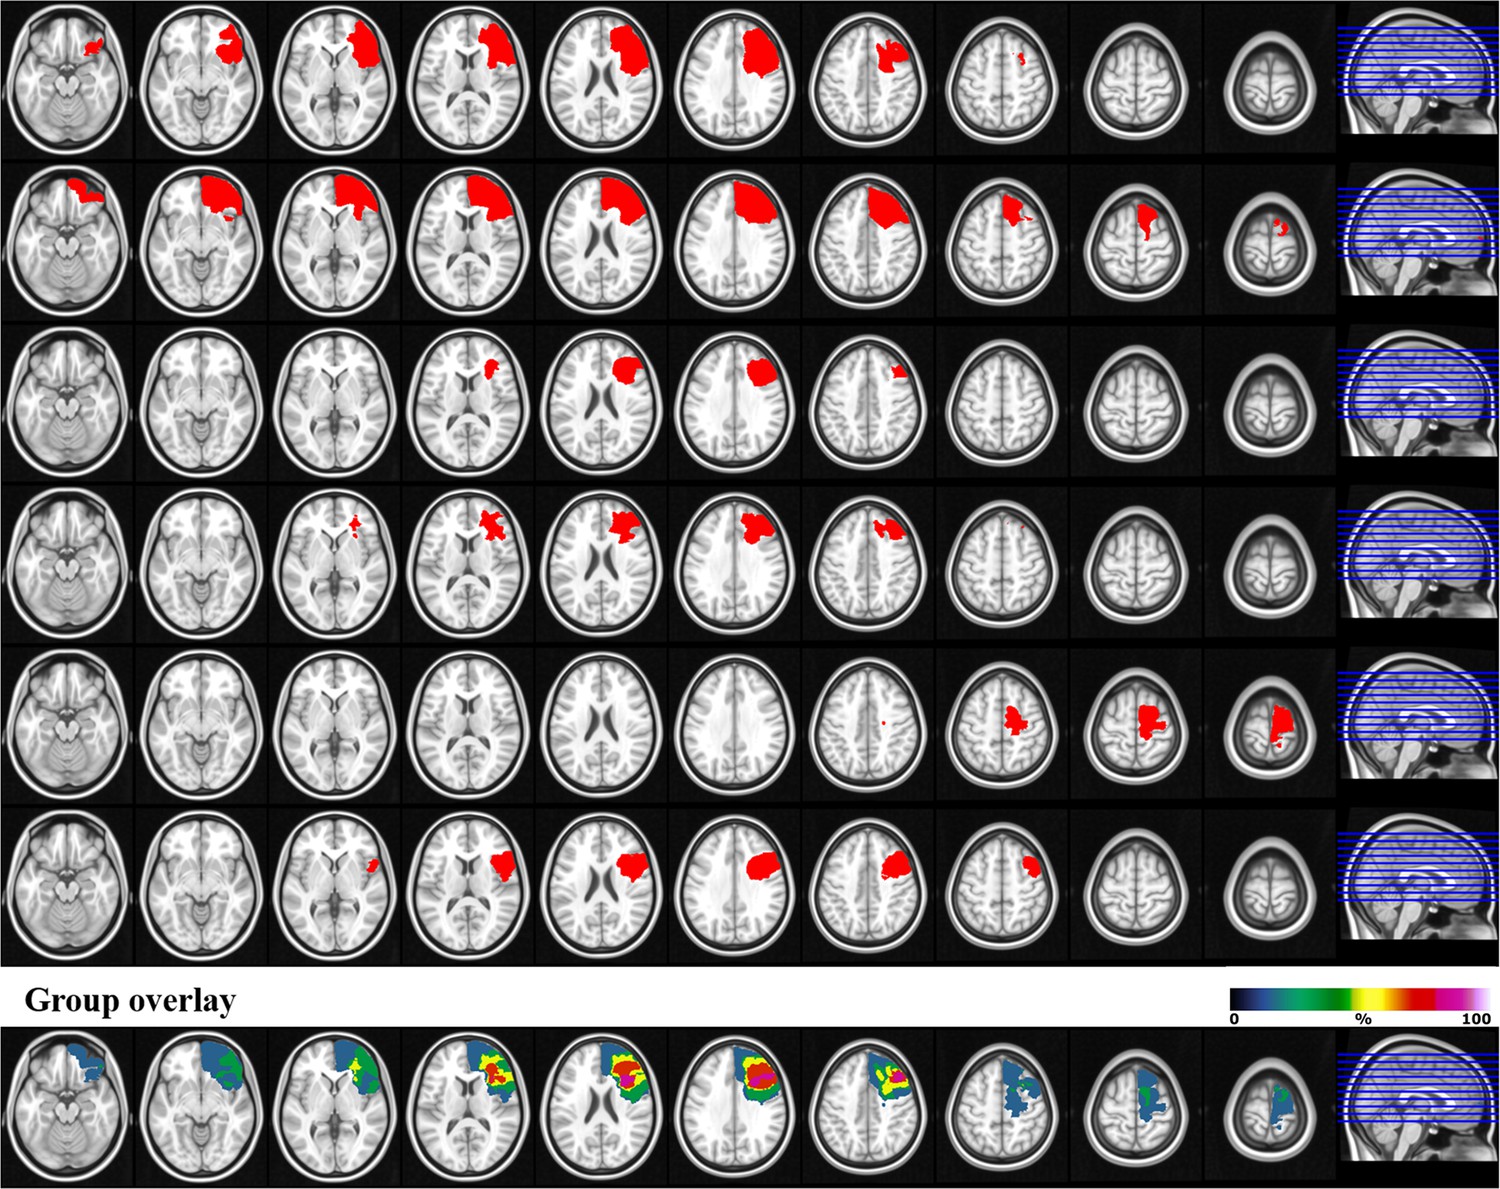
Lesion reconstructions for the right lateral prefrontal cortex (PFC) group.
Individual patients (1–6) and group overlay (bottom row). The color code for the group overlay indicates the number of patients with damaged tissue in that area.
Figure 1—figure supplement 3
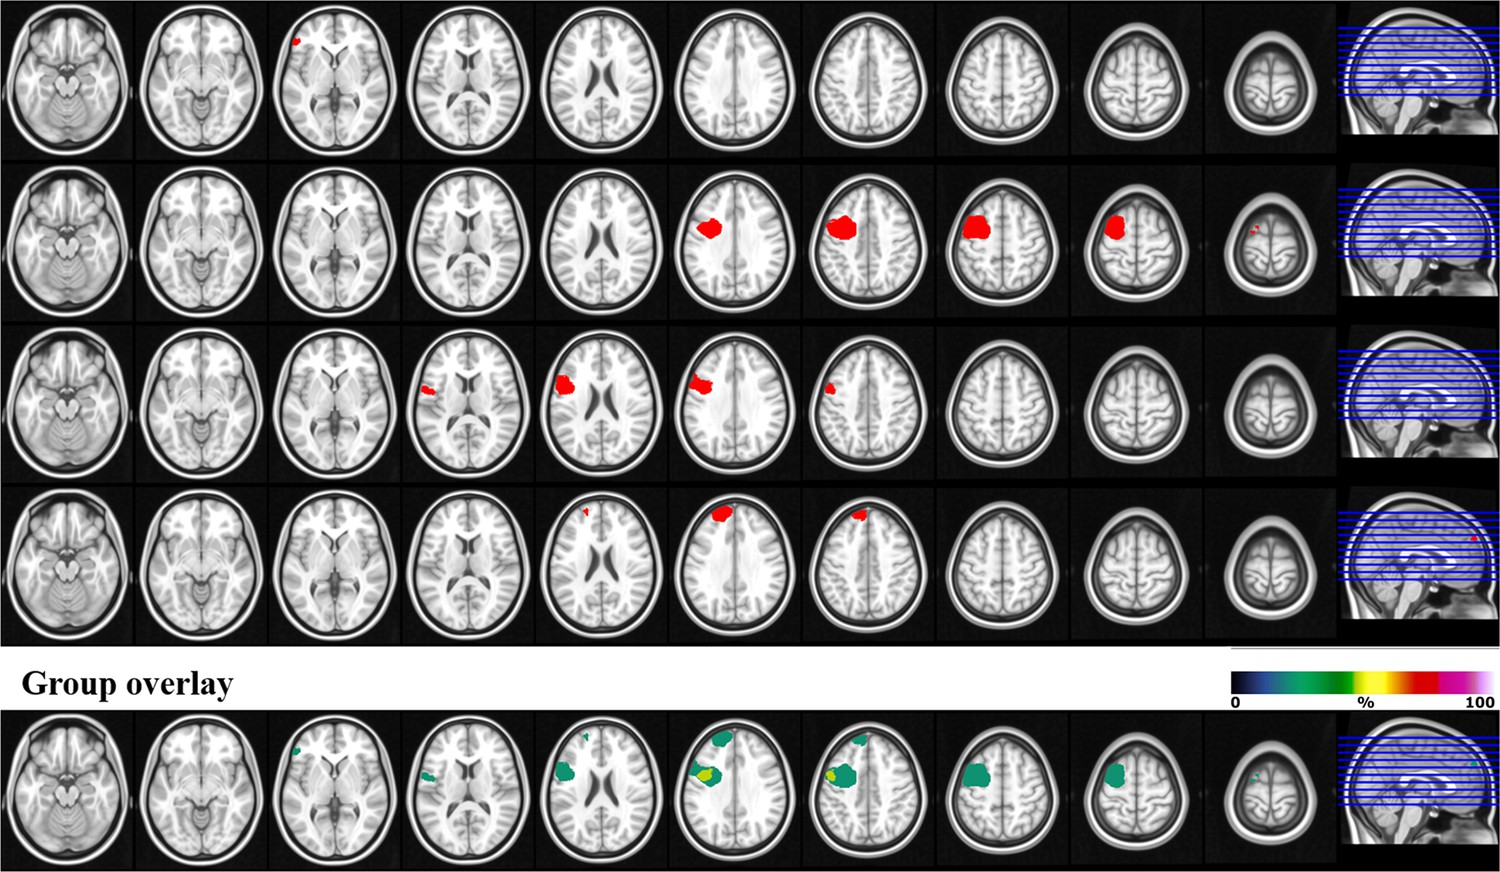
Lesion reconstructions for the left lateral prefrontal cortex (PFC) group.
Individual patients (1–4) and group overlay (bottom row). The color code for the group overlay indicates the number of patients with damaged tissue in that area.
Figure 1—figure supplement 4
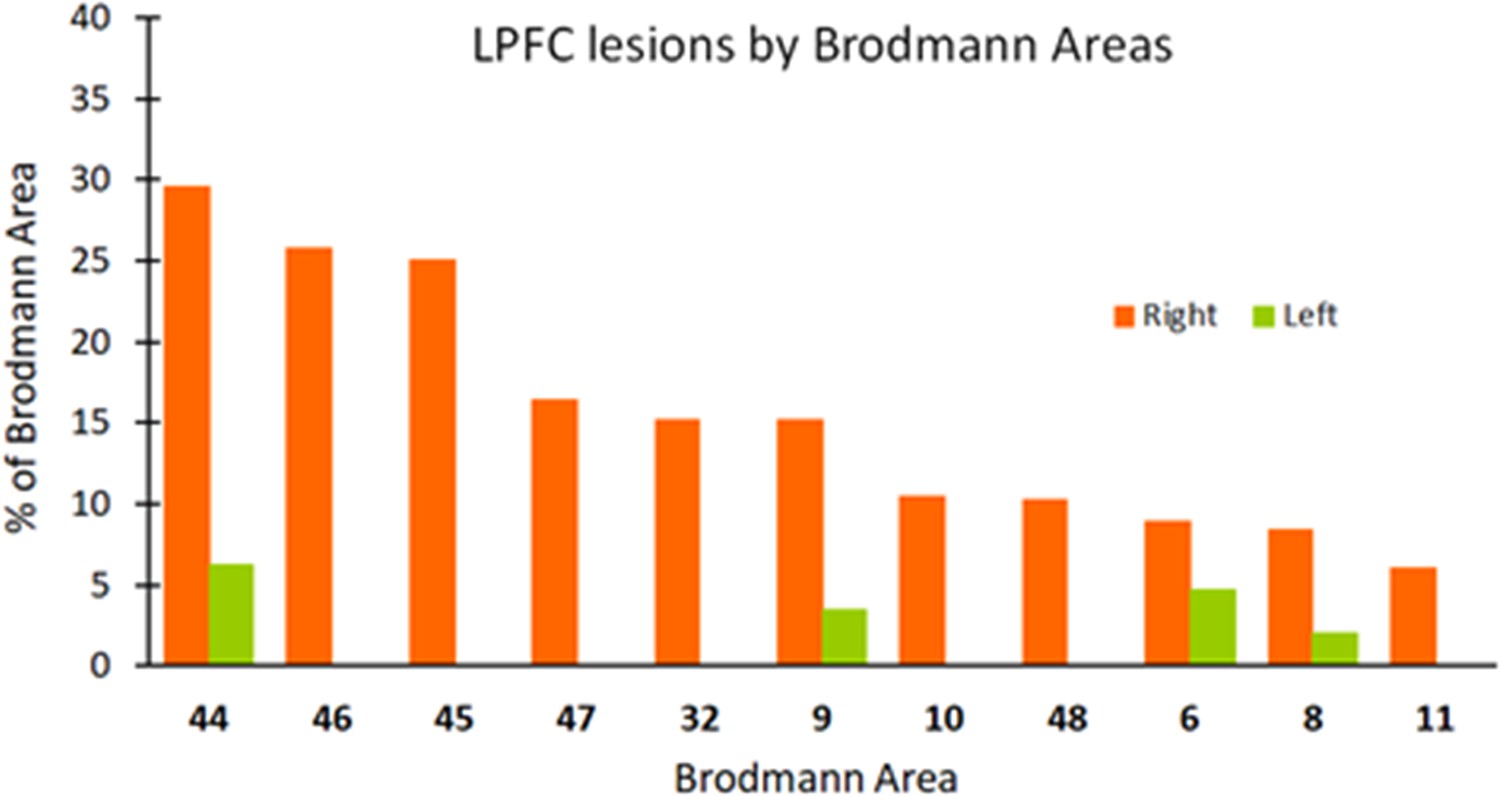
Lateral prefrontal cortex (PFC) lesion by Brodmann areas (BA).
Average percentage of damaged tissue within each BA per hemisphere. BAs with less than 2% damage are not presented.
Figure 2
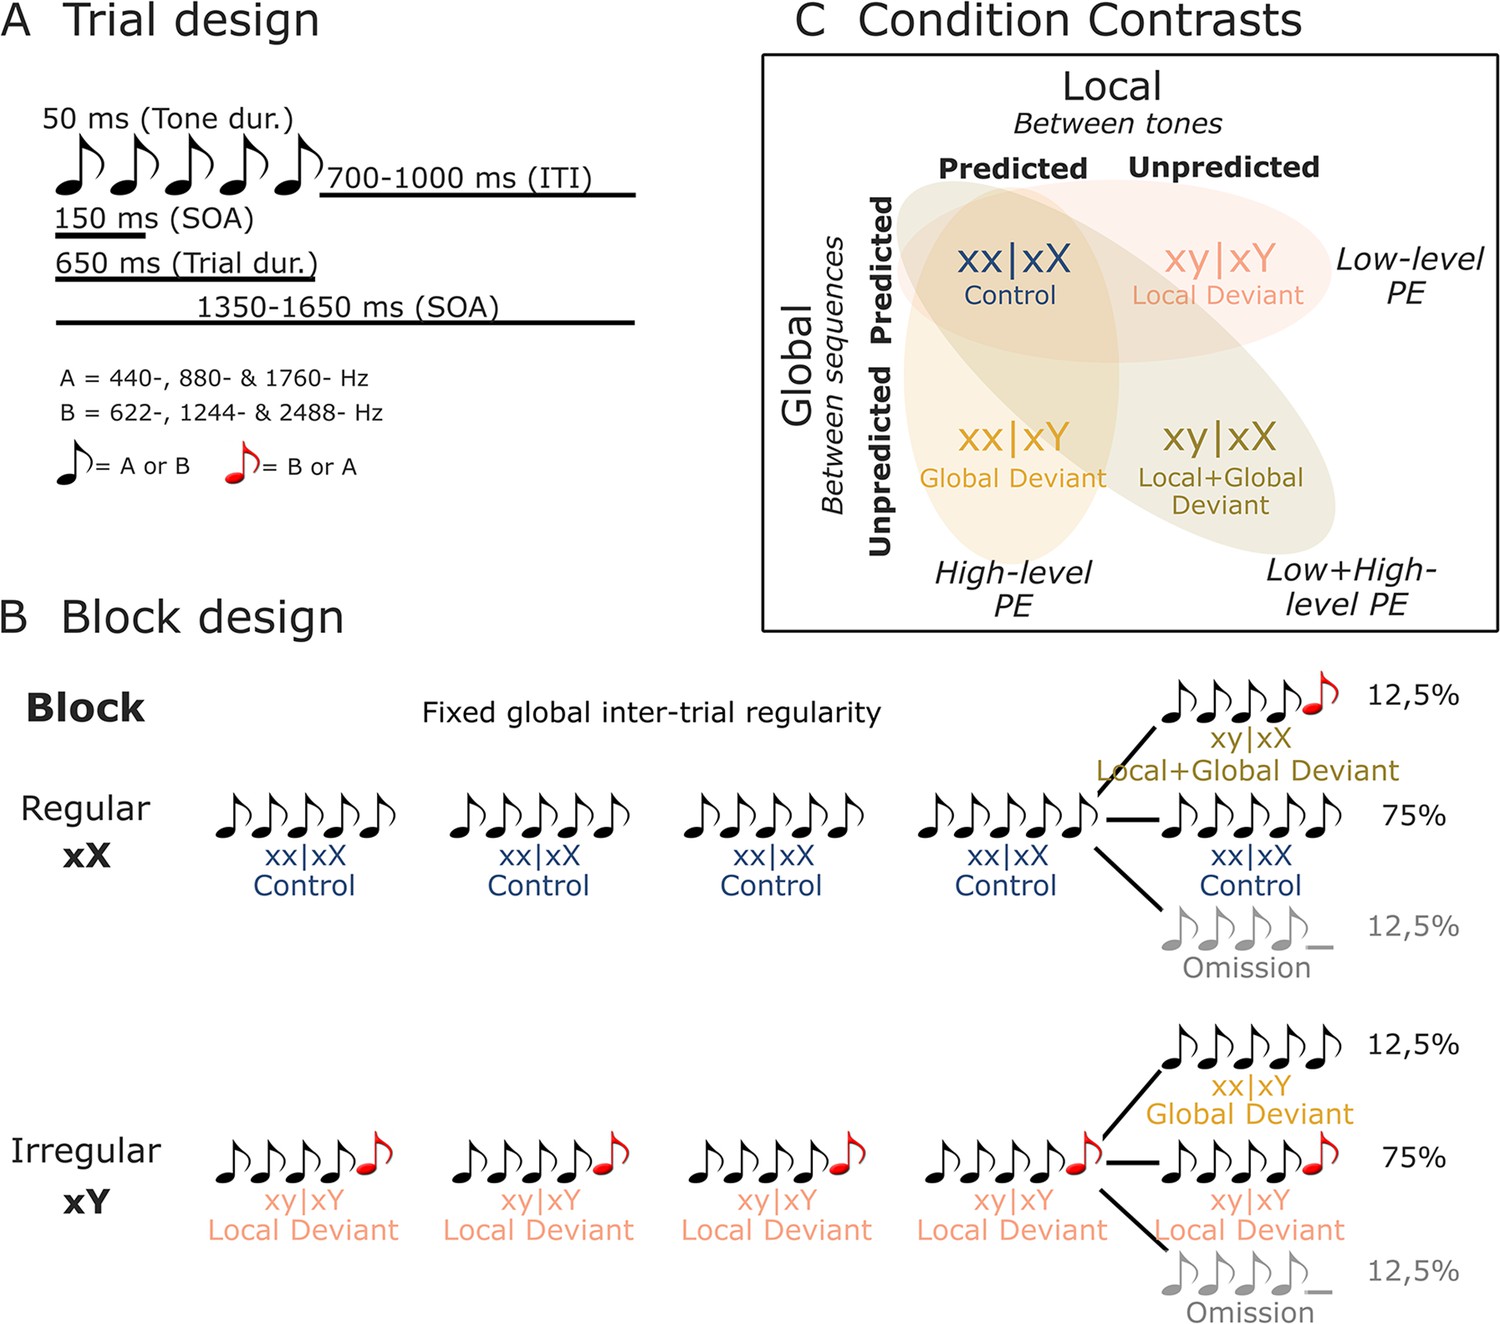
Illustration of stimuli and experimental design.
(A) On each trial, five or four complex tones of 50 ms duration each were presented with a fixed SOA of 150 ms. Two types of tones were used to generate these trials: tone A (composed of 440, 880, and 1760 Hz sinusoidal tones) and tone B (composed of 622, 1244, and 2488 Hz sinusoidal tones). (B) Each block started with 20 frequent sequences of tones to establish the block’s global rule. In regular xX blocks, standard sequences (75%) consisted of five repetitions of the same tone (i.e., xx│xX or control trials). These were interspersed with rare local deviant sequences (12.5% each) where the fifth sound was either different in frequency type (i.e., xy│xX or local + global deviant trials), or was omitted. The irregular xY blocks were similar, except that the standard sequences (75%) had a fifth sound differing in frequency type (i.e., xy│xY or local deviant trials), interspersed with rare (12.5%) local standard sequences (i.e., xx│xY or global deviant trials), or omission sequences. (C) By contrasting control (xx│xX) trials with local deviant (xy│xY), global deviant (xx│xY), and local + global deviant (xy│xX) trials, we isolated low-level, high-level, and combined low- and high-level prediction error (PE) responses, respectively. dur., duration; ITI, inter-trial interval; SOA, stimulus onset asynchrony.
Figure 3 with 2 supplements
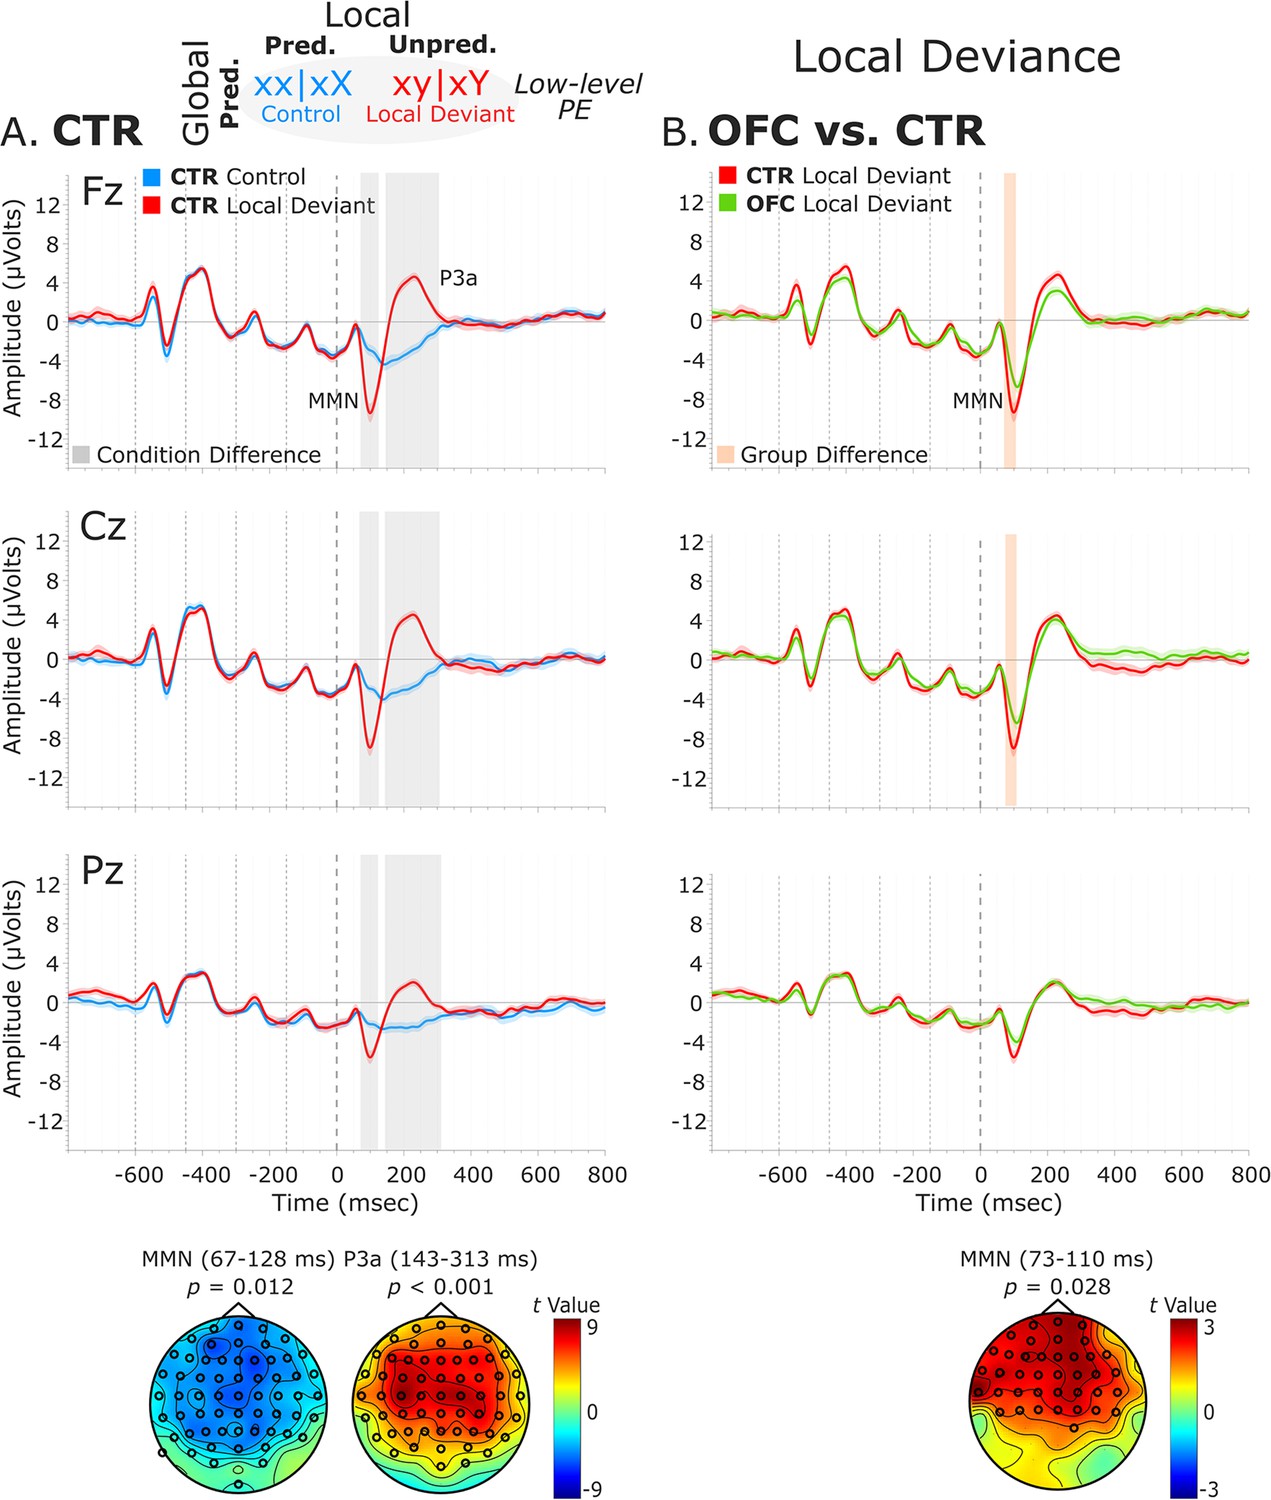
Local deviance event-related potentials (ERPs).
(A) Local deviance response CTR group. To the left are the healthy control participants’ grand average ERP waveforms at midline electrodes (from top to bottom: Fz, Cz, and Pz). ERPs from the processing of (standard) tones predicted at both levels (control: xx│xX trials) are in blue, and ERPs from the processing of (deviant) tones unpredicted at the local level (local deviant: xy│xY trials) are in red. Gray shaded bars indicate times when the electrode was part of a cluster showing significant within-group condition differences. At the bottom, the topographic scalp maps represent the statistical difference values for the t-contrast of the two experimental conditions computed for the time window corresponding to the cluster with significant differences. (B) Group differences (CTR vs. OFC). To the right are the CTR and OFC grand average ERP waveforms at the same midline electrodes. ERPs from the processing of tones unpredicted at the local level (local deviant: xy│xY trials) are in red for CTR and in green for OFC. Orange shaded bars indicate times when the electrode was part of a cluster showing significant differences between the groups. At the bottom, the topographic scalp map represents the statistical difference values for the t-contrast of the two groups computed for the time window corresponding to the cluster showing differences. MMN and P3a latencies did not show statistically significant differences between groups. Dashed lines at −600, –450, −300,–150, and 0 ms depict tone onsets. Shaded areas around the waveforms represent the standard error of the mean (SEM). OFC, orbitofrontal cortex.
Figure 3—figure supplement 1
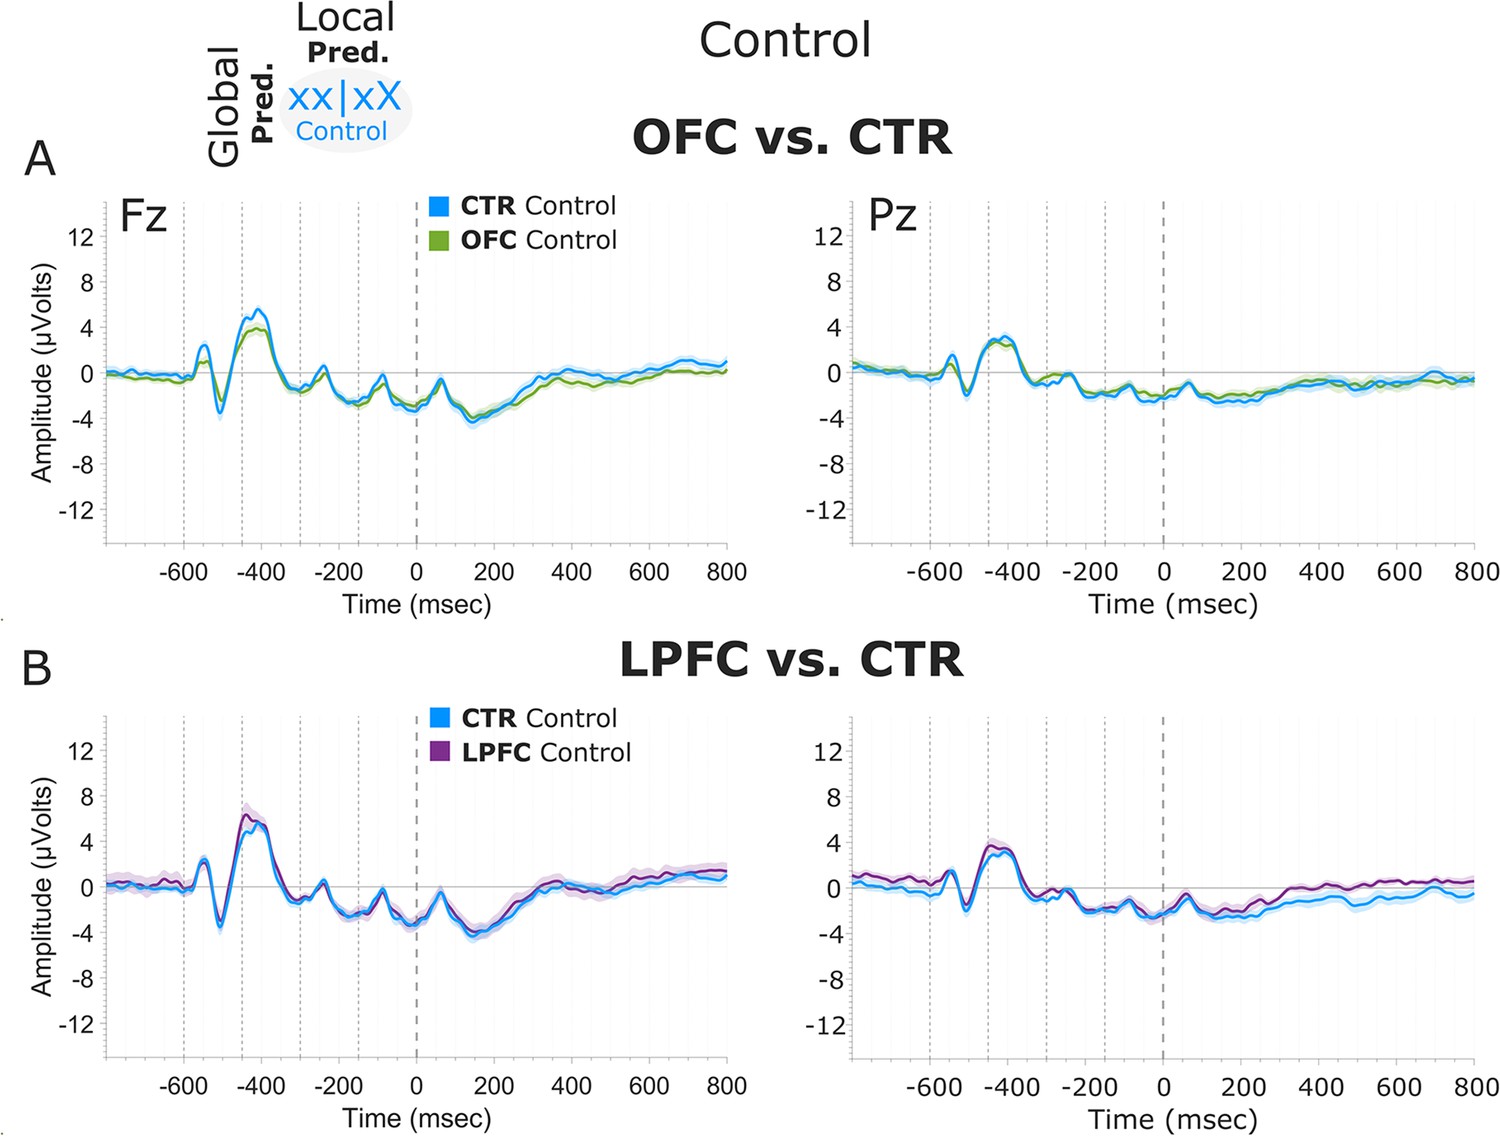
Predicted standard tone response.
(A) Group differences (CTR vs. OFC). CTR and OFC grand average ERP waveforms at the Fz and Pz electrodes. ERPs from the processing of tones predicted at both local and global levels (control: xx | xX trials) are in blue for the CTR group and in green for the OFC lesion group. (B) Group differences (CTR vs. LPFC). CTR and LPFC grand average ERP waveforms at the Fz and Pz electrodes. ERPs from the processing of tones predicted at both local and global levels (control: xx | xX trials) are in blue for the CTR group and in purple for the LPFC lesion group. Dashed lines at −600, –450, −300, –150, and 0 ms depict tone onsets. Shaded areas around the waveforms represent the standard error of the mean (SEM). OFC, orbitofrontal cortex; ERP, event-related potential; LPFC, lateral prefrontal cortex.
Figure 3—figure supplement 2
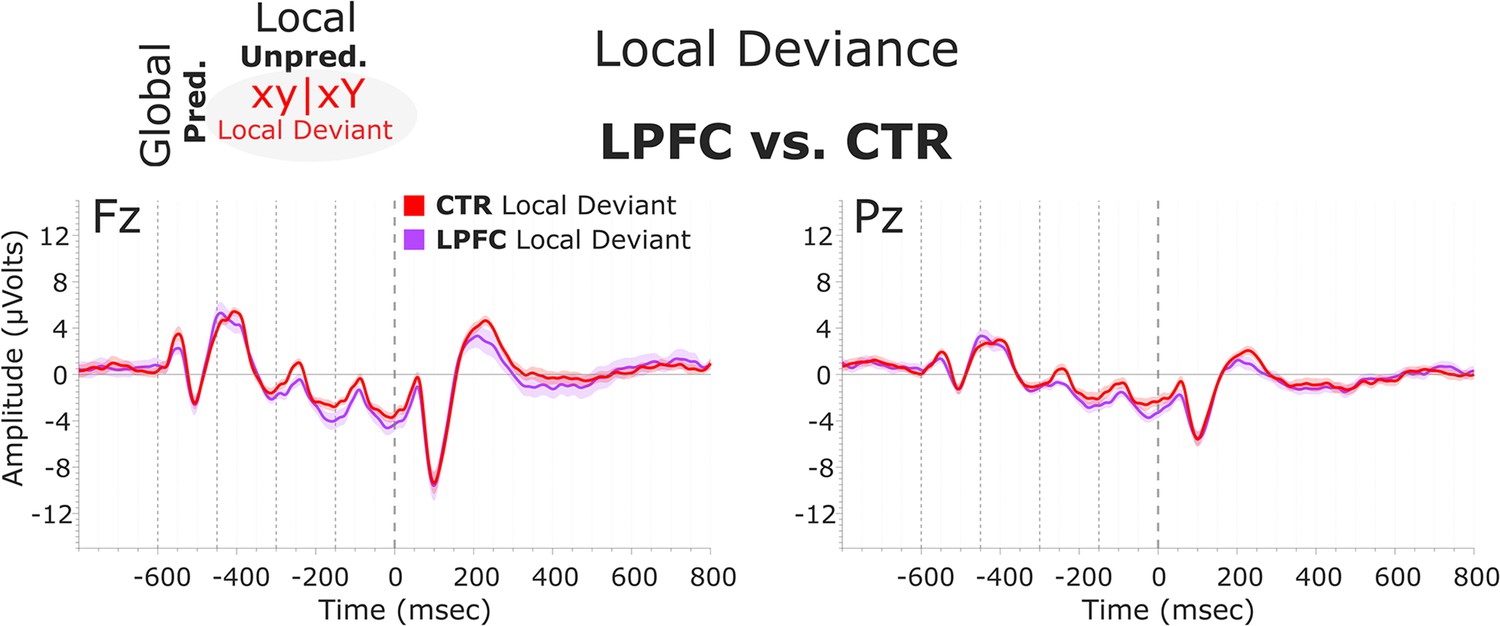
Local deviance response. group differences (CTR vs. LPFC).
CTR and LPFC grand average ERP waveforms at the Fz and Pz electrodes. ERPs from the processing of tones unpredicted at the local level (local deviant: xy | xY trials) are in red for the CTR group and in light purple for the LPFC group. Dashed lines at −600, –450, −300, –150, and 0 ms depict tone onsets. Shaded areas around the waveforms represent the standard error of the mean (SEM). ERP, event-related potential; LPFC, lateral prefrontal cortex.
Figure 4 with 1 supplement
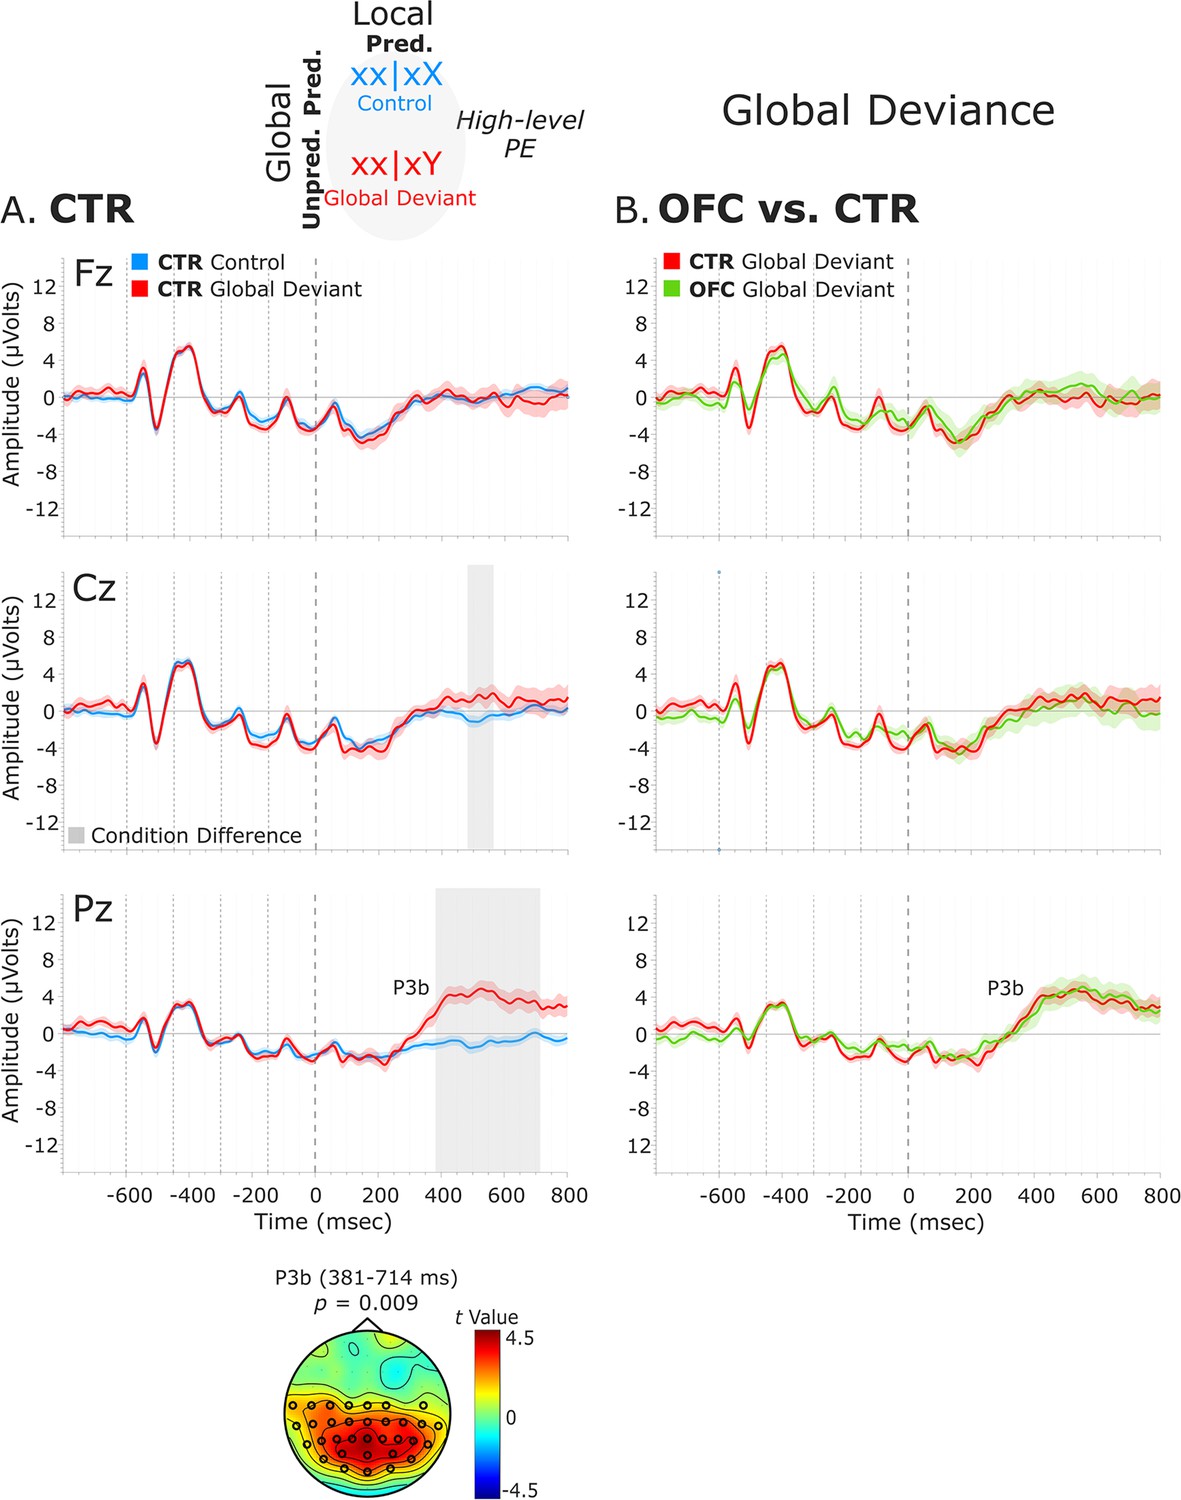
Global deviance event-related potentials (ERPs).
(A) Global deviance response CTR group. To the left are the healthy control participants’ grand average ERP waveforms at three midline electrodes (from top to bottom: Fz, Cz, and Pz). ERPs from the processing of (standard) tones predicted at both local and global levels (control: xx│xX trials) are in blue, and ERPs from the processing of (standard) tones unpredicted only at the global level (global deviant: xx│xY trials) are in red. Gray shaded bars indicate times when the electrode was part of a cluster showing significant within-group condition differences. At the bottom, the topographic scalp map represents the statistical difference values for the t-contrast of the two experimental conditions computed for the time window corresponding to the cluster showing significant differences. (B) Group differences (CTR vs. OFC). To the right are the CTR and OFC grand average ERP waveforms at the same midline electrodes. ERPs from the processing of standard tones unpredicted at the global level (global deviant: xx│xY trials) are in red for the CTR group and green for the OFC group. P3b latency did not show statistically significant differences between groups. Dashed lines at −600, –450, −300, –150, and 0 ms depict tone onsets. Shaded areas around the waveforms represent the standard error of the mean (SEM). OFC, orbitofrontal cortex.
Figure 4—figure supplement 1
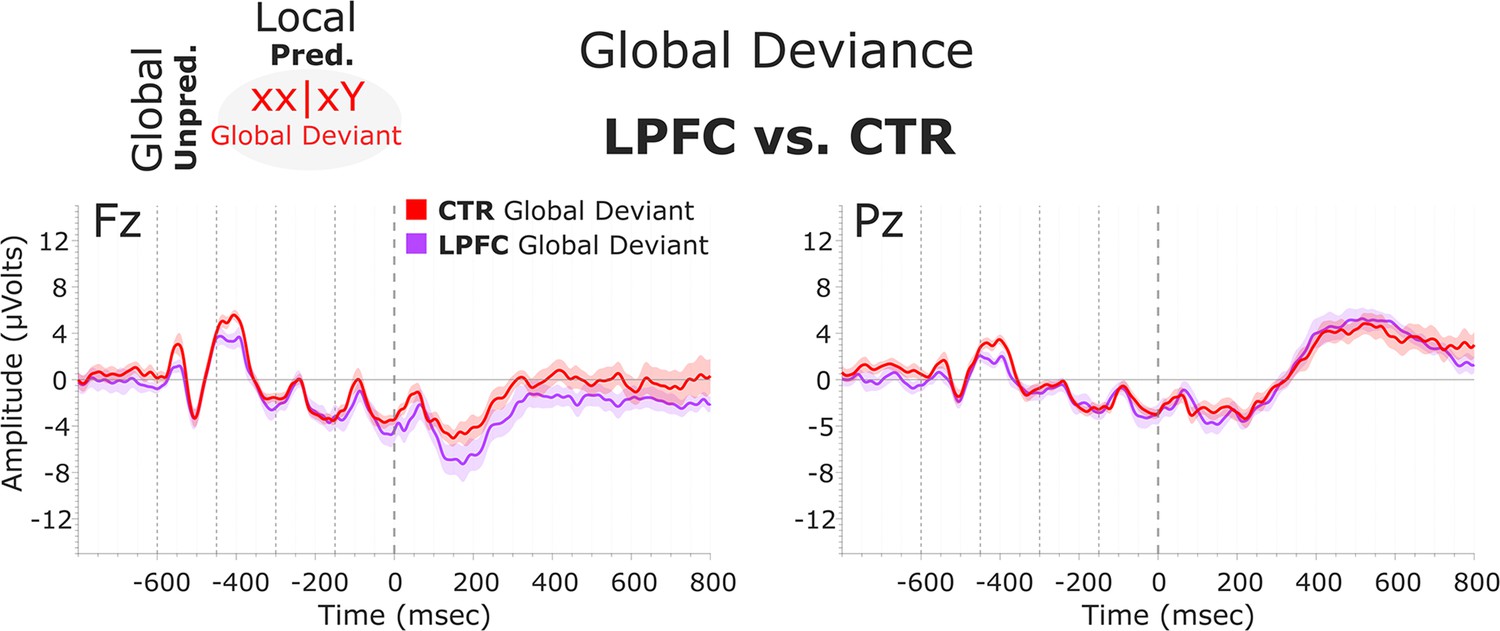
Global deviance response. group differences (CTR vs. LPFC).
CTR and LPFC grand average ERP waveforms at the Fz and Pz electrodes. ERPs from the processing of standard tones unpredicted at the global level (global deviant: xx | xY trials) are in red for the CTR group and light purple for the LPFC group. Dashed lines at −600, –450, −300, –150, and 0 ms depict tone onsets. Shaded areas around the waveforms represent the standard error of the mean (SEM). ERP, event-related potential; LPFC, lateral prefrontal cortex.
Figure 5 with 2 supplements
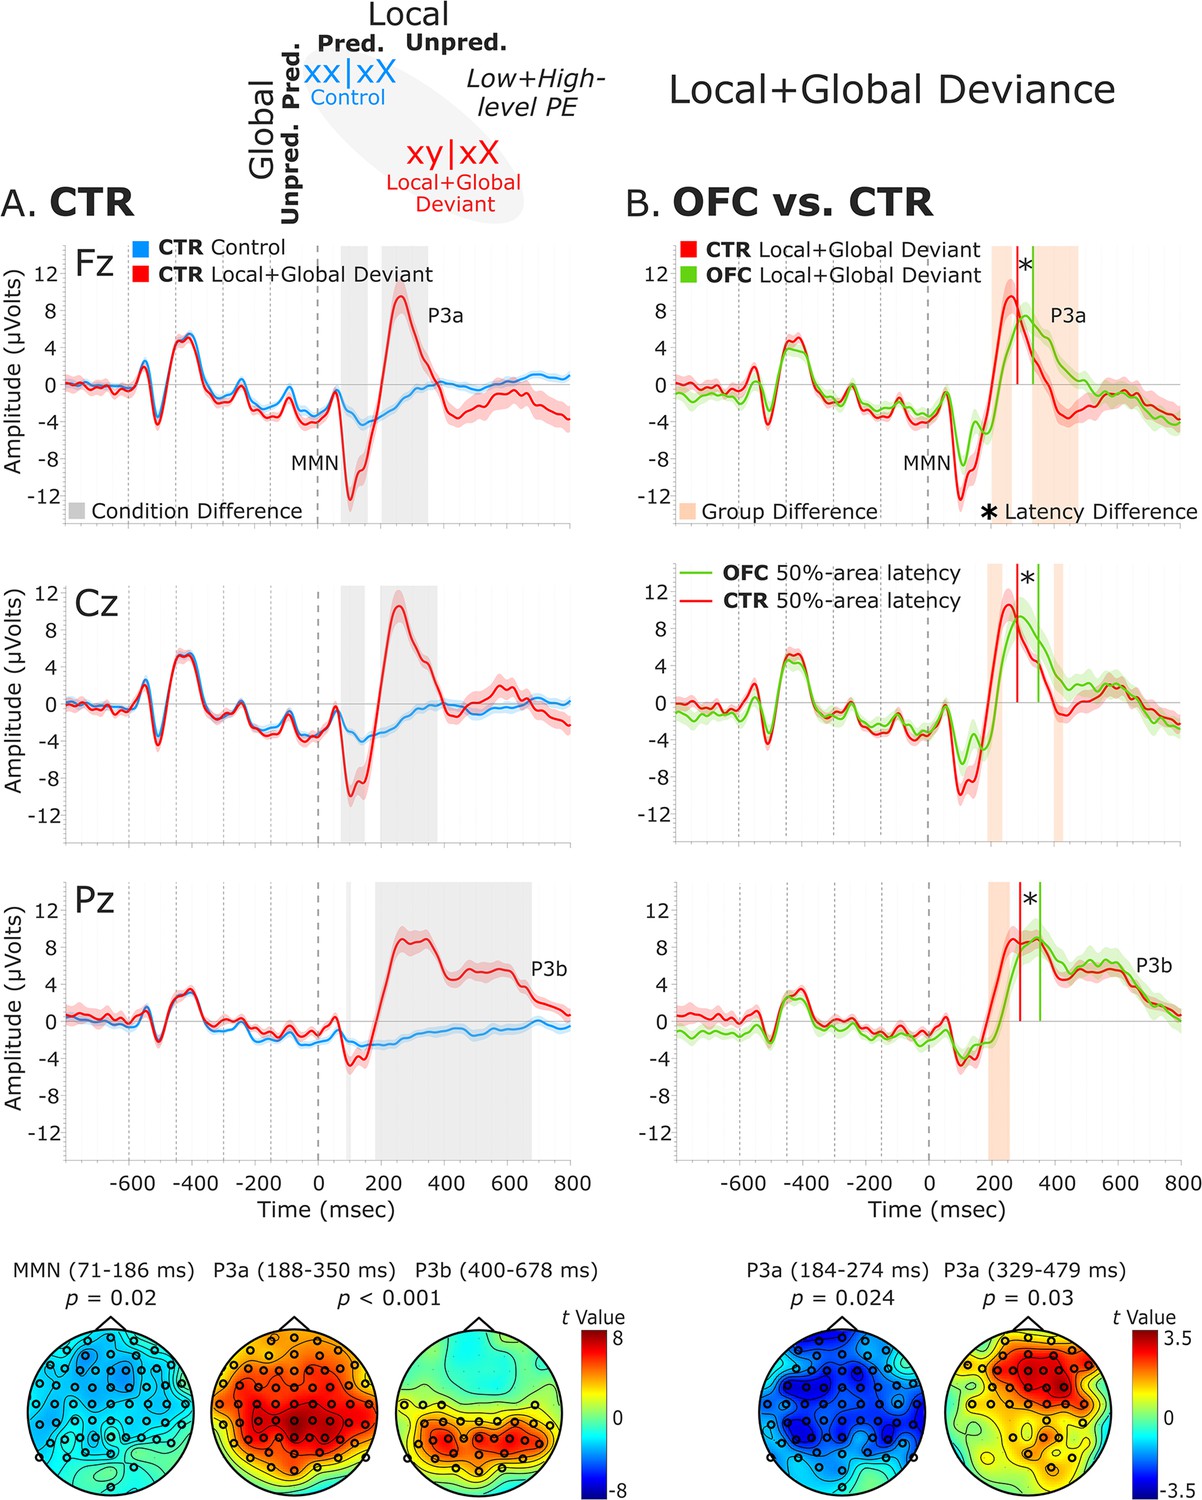
Local + global deviance event-related potentials (ERPs).
(A) Local + global deviance response CTR group. To the left are the healthy control participants’ grand average ERP waveforms at midline electrodes (from top to bottom: Fz, Cz, and Pz). ERPs from the processing of (standard) tones predicted at both local and global levels (control: xx│xX trials) are in blue, and ERPs from the processing of (deviant) tones unpredicted at both levels (local + global deviant: xy│xX trials) are in red. Gray shaded bars indicate times when the electrode was part of a cluster showing significant within-group condition differences. At the bottom, the topographic scalp maps reflect the statistical difference values for the t-contrast of the two experimental conditions computed for the time window corresponding to the cluster with significant differences. (B) Group differences (CTR vs. OFC). To the right are the CTR and OFC grand average ERP waveforms at the same midline electrodes. ERPs from the processing of (deviant) tones unpredicted at both local and global level (local + global deviant: xy│xX trials) are in red for CTR and in green for OFC. Orange shaded bars indicate times when the electrode was part of a cluster showing significant differences between the groups. Vertical red lines indicate the 50% area latency for the CTR group while vertical green lines indicate the latency for the OFC group for the corresponding components (i.e., MMN and P3a). Asterisks (*) denote significant latency differences. At the bottom, the topographic scalp maps represent the statistical difference values for the t-contrast of the two groups computed for the time window corresponding to the cluster with observed differences. Dashed lines at −600, –450, −300, –150, and 0 ms depict tone onsets. Shaded areas around the waveforms represent the standard error of the mean (SEM). OFC,orbitofrontal cortex; MMN, mismatch negativity.
Figure 5—figure supplement 1
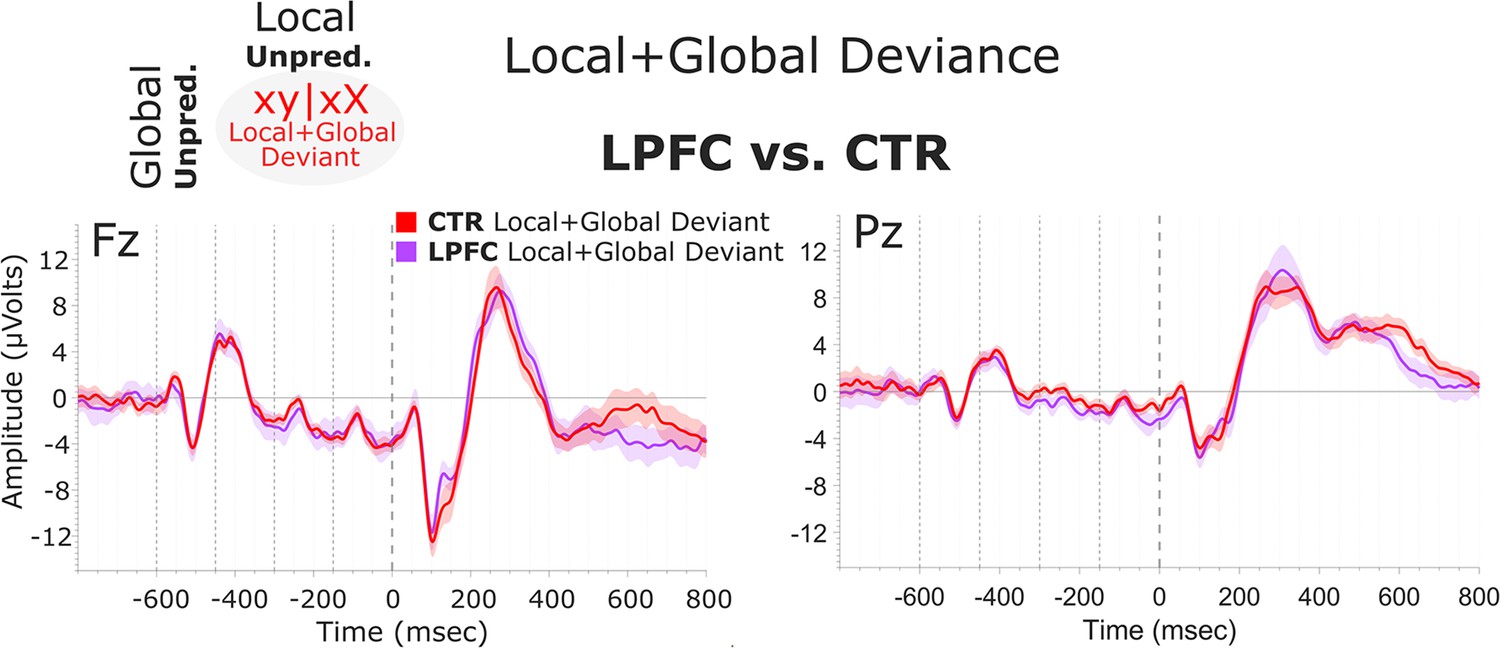
Local + global deviance response. group differences (CTR vs. LPFC).
CTR and LPFC grand average ERP waveforms at the Fz and Pz electrodes. ERPs from the processing of (deviant) tones unpredicted at both levels (local + global deviant: xy | xX trials) are in red for the CTR group and light purple for the LPFC group. Dashed lines at −600, –450, −300, –150, and 0 ms depict tone onsets. Shaded areas around the waveforms represent the standard error of the mean (SEM). ERP, event-related potential; LPFC, lateral prefrontal cortex.
Figure 5—figure supplement 2
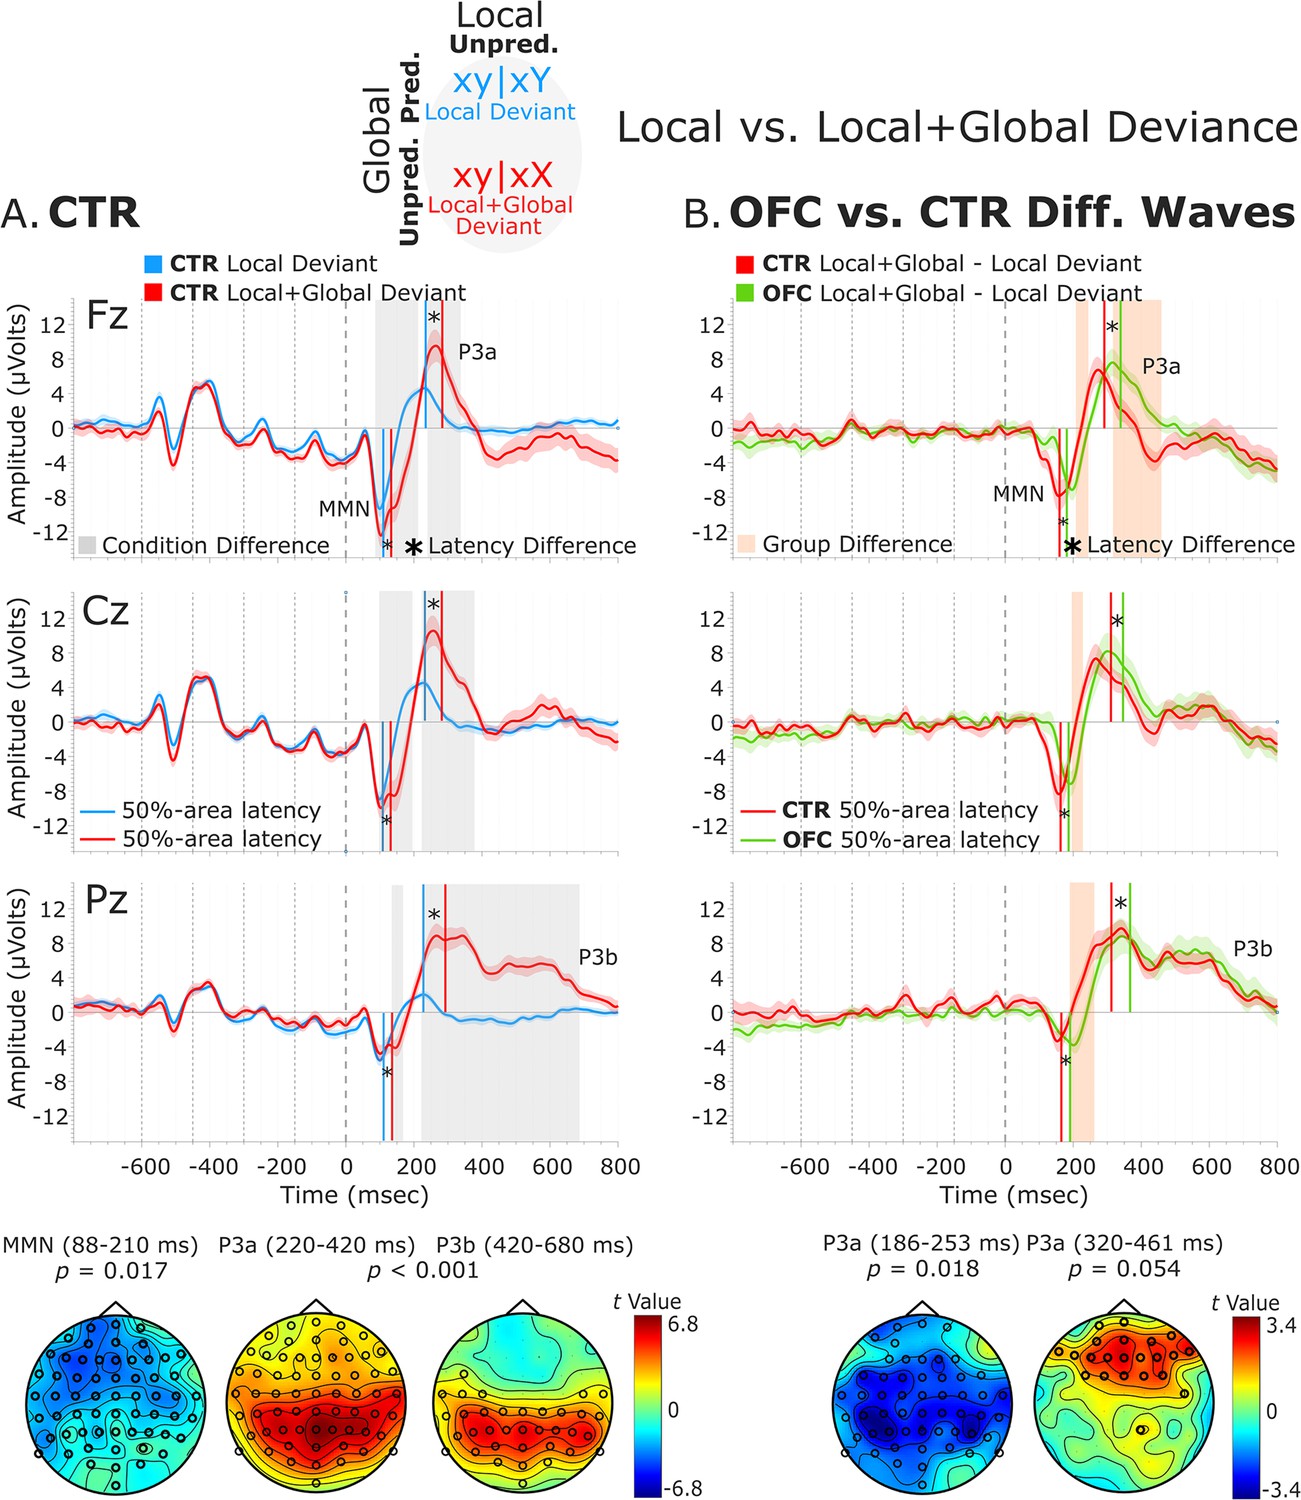
Local versus local + global deviance event-related potentials (ERPs).
(A) Local vs. local + global deviance response CTR group. To the left, healthy control participants’ grand average ERP waveforms at midline electrodes (from top to bottom: Fz, Cz, and Pz). ERPs from the processing of deviant tones predicted at the global level (local deviant: xy│xY trials) are in blue, and ERPs from the processing of deviant tones unpredicted at the global level (local + global deviant: xy│xX trials) are in red. Gray shaded bars indicate times when the electrode was part of a cluster showing significant within-group condition differences. At the bottom, the topographic scalp maps reflect the statistical difference values for the t-contrast of the two experimental conditions computed for the time window corresponding to the cluster with significant differences. (B) Group differences (CTR vs. OFC difference waves). To the right, CTR and OFC grand average ERP waveforms at the same midline electrodes. Difference wave ERPs from the processing of local deviant tones minus the processing of local + global deviant tones (xy│xX minus xy│xY trials) are in red for the CTR group and in green for the OFC group. Orange shaded bars indicate times when the electrode was part of a cluster showing significant differences between the two groups. At the bottom, the topographic scalp maps represent the statistical difference values for the t-contrast of the two groups computed for the time window corresponding to the cluster with observed group differences. Dashed lines at −600, –450, −300, –150, and 0 ms depict tone onsets. Shaded areas around the waveforms represent the standard error of the mean (SEM). OFC, orbitofrontal cortex.
Tables
Table 1
50% area latency of MMN and P3a for the local + global deviance response.
| MMN | P3a | |||||||
|---|---|---|---|---|---|---|---|---|
| Latency (SD) | Diff. (ms) | p-Value | Latency (SD) | Diff. (ms) | p-Value | |||
| CTR | OFC | CTR | OFC | |||||
| Fz | 127.40 (20.09) | 138.28 (26.14) | 10.88 | 0.242 | 279.88 (21.37) | 334.90 (35.13) | 55.01 | <0.001 |
| FCz | 127.54 (20.07) | 148.21 (26.54) | 20.67 | 0.033 | 280.02 (26.27) | 332.78 (31.74) | 52.76 | <0.001 |
| Cz | 128.38 (19.57) | 147.07 (33.21) | 18.69 | 0.088 | 282.95 (28.77) | 352.47 (45.17) | 69.52 | <0.001 |
| CPz | 129.07 (23.87) | 139.67 (30.96) | 10.89 | 0.330 | 283.79 (24.57) | 347.59 (63.79) | 63.80 | 0.002 |
| Pz | 130.61 (22.36) | 149.19 (33.54) | 18.58 | 0.105 | 292.58 (33.90) | 355.57 (40.10) | 62.99 | <0.001 |
-
50% area latency measures in milliseconds (ms) from the onset of the fifth tone of the sequence for the MMN and the P3a components, separately for the healthy control participants (CTR) and the OFC lesion patients (OFC). Diff. is the latency difference between the two groups (OFC vs. CTR) given in ms; p-values as a result of independent samples t-tests comparing the component’s 50% area latency between the two groups. Standard deviation (SD) is given in brackets.
-
OFC, orbitofrontal cortex; MMN, mismatch negativity.
Table 2
Characteristics of lesions to the orbitofrontal cortex (OFC).
| Etiology | Lesion size (cm3) | BA (left hemisphere) | BA (right hemisphere) | |||
|---|---|---|---|---|---|---|
| OFC | Total | L | R | |||
| 1 | Olfactory meningioma | 43.0 | 23.2 | 19.8 | 10, 11 | 10, 11 |
| 2 | Traumatic brain injury | 24.9 | 6.4 | 18.5 | 11 | 10, 11, 47 |
| 3 | Traumatic brain injury | 157.4 | 59.8 | 97.6 | 8–11, 32, 45–48 | 6, 8–11, 24, 32, 44–48 |
| 4 | Olfactory meningioma | 117.9 | 56.4 | 61.5 | 9–11, 32, 46, 47 | 10, 11, 32, 45–47 |
| 5 | Olfactory meningioma | 6.6 | 3.2 | 3.4 | 11 | 11 |
| 6 | Olfactory meningioma | 8.6 | 3.1 | 5.4 | 11 | 10, 11 |
| 7 | Olfactory meningioma | 8.8 | 1.3 | 7.5 | 11 | 11, 47 |
| 8 | Olfactory meningioma | 3.7 | 3.7 | 0 | 10, 11 | _ |
| 9 | Olfactory meningioma | 85.7 | 55.1 | 30.6 | 9–11, 25, 32, 46, 47 | 10, 11, 47 |
| 10 | Olfactory meningioma | 109.0 | 48.8 | 60.3 | 10, 11, 32, 46, 47 | 9–11, 32, 45–47 |
| 11 | Low-grade glioma | 6.4 | 0 | 6.4 | _ | 10, 11 |
| 12 | Olfactory meningioma | 32.6 | 10.1 | 22.5 | 11 | 10, 11, 25 |
-
Etiology, size (L, left; and R, right hemisphere), and affected Brodmann areas (BA) for each hemisphere. The sign ‘_’ is used when no lesion was present in a given hemisphere. Lesions that comprise <0.2 cm3 in any given BA are not reported.
Table 3
Demographics and neuropsychological performance measures per group.
| Demographics | CTR | SD | OFC | SD | F-value | p-value | Stat. |
|---|---|---|---|---|---|---|---|
| N | 14 | 12 | |||||
| Gender (females: males) | 8:6 | 8:4 | |||||
| Age years (range) | 47.6 (34–66) | 10.3 | 47.9 (27–61) | 11.7 | 0.002 | 0.96 | ns |
| Education years (range) | 16.1 (13-21) | 2.0 | 15 (9–21) | 3.1 | 1.30 | 0.27 | ns |
| Neuropsychological tests | |||||||
| Total IQ | 115.4 | 10.3 | 112.2 | 8.5 | 0.73 | 0.40 | ns |
| Digit Span total | 14.8 | 2.9 | 15 | 3.8 | 0.013 | 0.91 | ns |
| Digit Span – forward | 8.5 | 1.5 | 8.8 | 2.1 | 0.09 | 0.77 | ns |
| Digit Span – backward | 6.3 | 1.8 | 6.3 | 2.2 | 0.005 | 0.94 | ns |
| Trail Making Test (TMT) | U-value | ||||||
| TMT 2 – number sequencing | 30.6 | 10.1 | 33.8 | 14.6 | 92.00 | 0.71 | ns |
| TMT 3 – letter sequencing | 27.9 | 10.5 | 30.3 | 9.9 | 97.50 | 0.49 | ns |
| TMT 4 – number-letter switching | 73.8 | 27.1 | 72.9 | 35.4 | 72.00 | 0.56 | ns |
| Color-Word Interference Test (CWIT) | |||||||
| CWIT 1 – color naming | 31.2 | 6.1 | 30.3 | 4.4 | 75.00 | 0.89 | ns |
| CWIT 2 – word reading | 22.4 | 3.3 | 22.1 | 3.7 | 69.00 | 0.65 | ns |
| CWIT 3 – inhibition | 52.0 | 9.0 | 52.3 | 11.0 | 76.50 | 0.94 | ns |
| CWIT 4 – inhibition/switching | 58.2 | 11.9 | 60.8 | 18.3 | 74.50 | 0.85 | ns |
| California Verbal Learning Test (CVLT-II) | |||||||
| Total learning trial 1–5 | 57.7 | 12.4 | 51.6 | 8.5 | 49.50 | 0.12 | ns |
| Short-term free recall | 15.2 | 1.2 | 14.8 | 1.4 | 66.50 | 0.54 | ns |
| Long-term free recall | 13.7 | 2.6 | 13.1 | 2.2 | 66.00 | 0.54 | ns |
-
Comparison of the age, years of education, IQ, and Digit Span Test between the two groups (one-way ANOVA). Comparison of the non-normally distributed raw test scores, Trail Making Test (TMT), Color-Word Interference Test (CWIT) and the California Verbal Learning Test 2nd Edition (CVLT-II) between the two groups (non-parametric independent samples Mann–Whitney U-test). Values given are means, with standard deviation (SD).
-
CTR, healthy control group; OFC, group with lesion to the orbitofrontal cortex; ns, the statistical test was not significant.
Additional files
-
MDAR checklist
- https://cdn.elifesciences.org/articles/86386/elife-86386-mdarchecklist1-v2.pdf
-
Supplementary file 1
Additional measurements.
Table a: mean amplitude centered ±25 ms around the individual peaks for the MMN and P3a components elicited for the local deviance response for the two groups (CTR vs. OFC). Table b: mean amplitude centered ±40 ms around the individual peaks for the MMN and P3a components elicited for the local + global deviance response for the two groups. Table c: 50% area latency for the MMN and P3a components elicited for local and local + global deviance response for the healthy control participants. Table d: 50% area latency for the MMN and P3a components for the difference wave (local + global minus local deviance response) for the two groups. Table e: characteristics of lesions to the LPFC lesion group (LPFC). Table f: demographics and neuropsychological performance measures per group (CTR vs. LPFC). Table g: Additional measurements that could bias the neural data for the CTR and OFC group (e.g., number of blinks, noisy channels, and noisy trials).
- https://cdn.elifesciences.org/articles/86386/elife-86386-supp1-v2.docx
Download links
A two-part list of links to download the article, or parts of the article, in various formats.
Downloads (link to download the article as PDF)
Open citations (links to open the citations from this article in various online reference manager services)
Cite this article (links to download the citations from this article in formats compatible with various reference manager tools)
Altered hierarchical auditory predictive processing after lesions to the orbitofrontal cortex
eLife 13:e86386.
https://doi.org/10.7554/eLife.86386


