Homeostatic activation of aryl hydrocarbon receptor by dietary ligands dampens cutaneous allergic responses by controlling Langerhans cells migration
- Institut Curie, PSL Research University, INSERM, U932, France
- Institut Curie, PSL Research University, Plateforme de Pathologie Expérimentale, France
- Institut Curie, PSL Research University, Plateforme de Métabolomique et Lipidomique, France
Figures
Figure 1 with 1 supplement
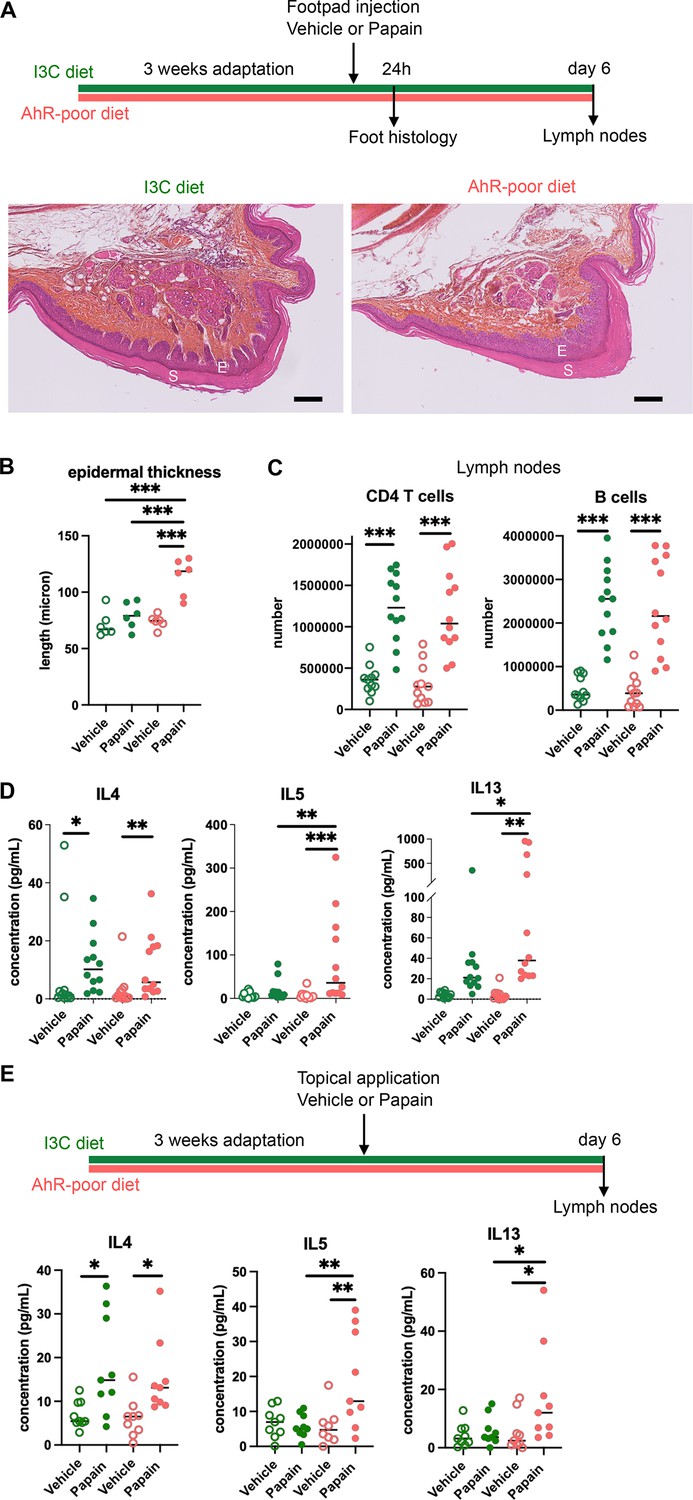
Lack of dietary aryl hydrocarbon receptor (AhR) ligands exacerbates cutaneous allergic type 2 responses.
Mice were placed on AhR-poor diet or enriched in indole-3-carbinol (I3C diet) for 3 wk of adaptation prior to the start of experiments. (A–D) Papain or vehicle (PBS) was injected in the footpad at day 0. Mice were sacrificed for analysis either after 24 hr or at day 6. (A, B) Tissues were analyzed by histology 24 hr after papain injection (hematoxylin, eosin, and Safran staining). (A) Representative results (n = 6 per condition). E = epidermis, S = stratum corneum. Bar = 100 μm. (B) Epidermal thickness was measured on images. Median is shown (n = 6 in two independent experiments). One-way ANOVA. (C, D) After 6 d, cells from the draining lymph nodes were analyzed. (C) CD4 T cells and B cells counts. (D) Normalized numbers of T cells were restimulated ex vivo, and cytokine secretion was measured in the supernatant after 24 hr. Median is shown (n = 11–12 in three independent experiments). Kruskal–Wallis test. (E) Papain or vehicle (PBS) was applied topically at day 0. Mice were sacrificed for lymph nodes analysis at day 6. Normalized numbers of T cells were restimulated ex vivo, and cytokine secretion was measured in the supernatant after 24 hr. Median is shown (n = 9 in three independent experiments). Kruskal–Wallis test. For all panels *p<0.05; **p<0.01; ***p<0.001.
Figure 1—figure supplement 1
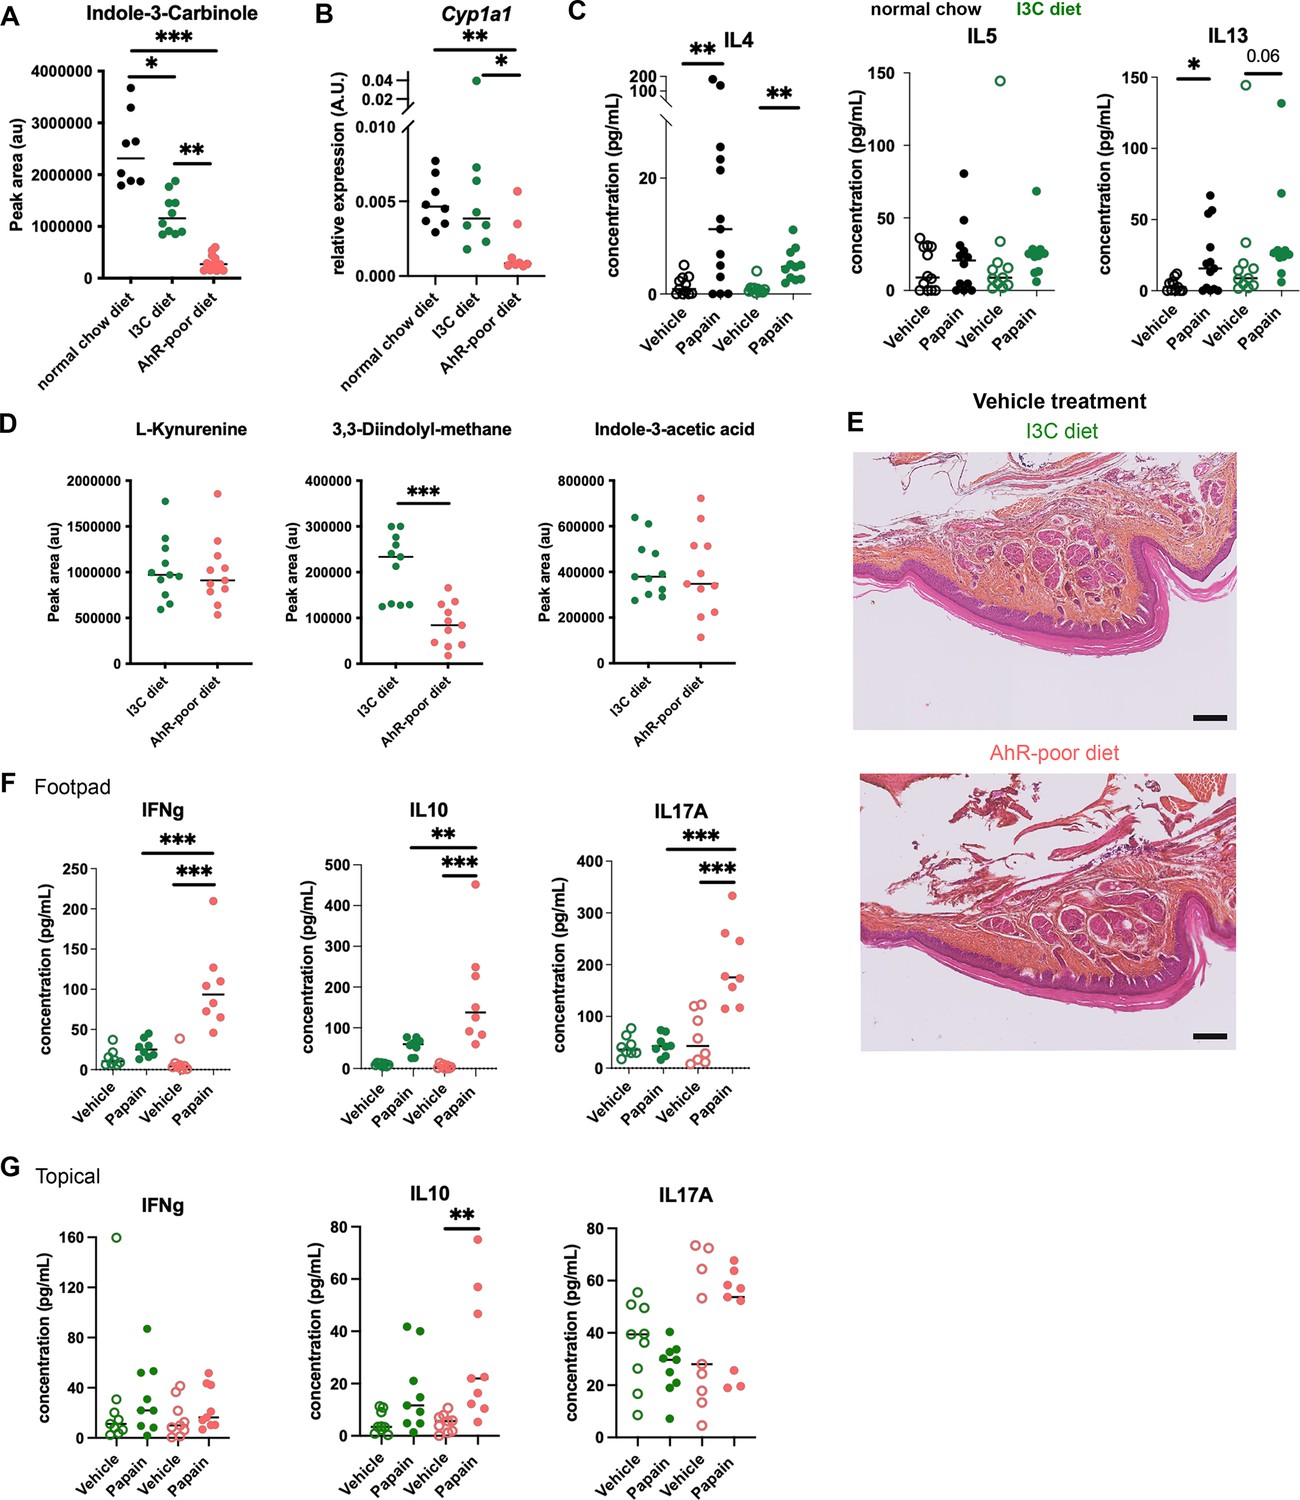
Comparable cutaneous allergic Th2 responses in mice fed with normal chow and indole-3-carbinol (I3C) diet.
Mice were placed on aryl hydrocarbon receptor (AhR)-poor or I3C diet for 3 wk of adaptation prior to the start of experiments. (A) Relative abundance of I3C was measured in the serum at day 0. Median is shown (n = 8–11 in two independent experiments). (B) Liver lysates were analyzed by RT-qPCR at day 0. Median is shown (n = 8 in two independent experiments). One-way ANOVA. (C) Papain or vehicle (PBS) was injected in the footpad at day 0. After 6 d, normalized numbers of lymph node T cells were restimulated ex vivo and cytokine secretion was measured in the supernatant. Median is shown (n = 11–13 in three independent experiments). Kruskal–Wallis test. (D) Relative abundance of AhR agonists was measured in the serum at day 0. Median is shown (n = 11 in two independent experiments). (E) 24 hr after vehicle injection, tissues were analyzed by histology (hematoxylin, eosin and Safran staining). Representative results (n = 6 per condition). Bar = 100 μm. (F, G) 6 d after footpad injection (F) or topical application (G), normalized numbers of lymph node T cells were restimulated ex vivo and cytokine secretion was measured in the supernatant. Median is shown (n = 11–12 in three independent experiments). Kruskal–Wallis test. For all panels *p<0.05; **p<0.01; ***p<0.001.
Figure 2 with 1 supplement
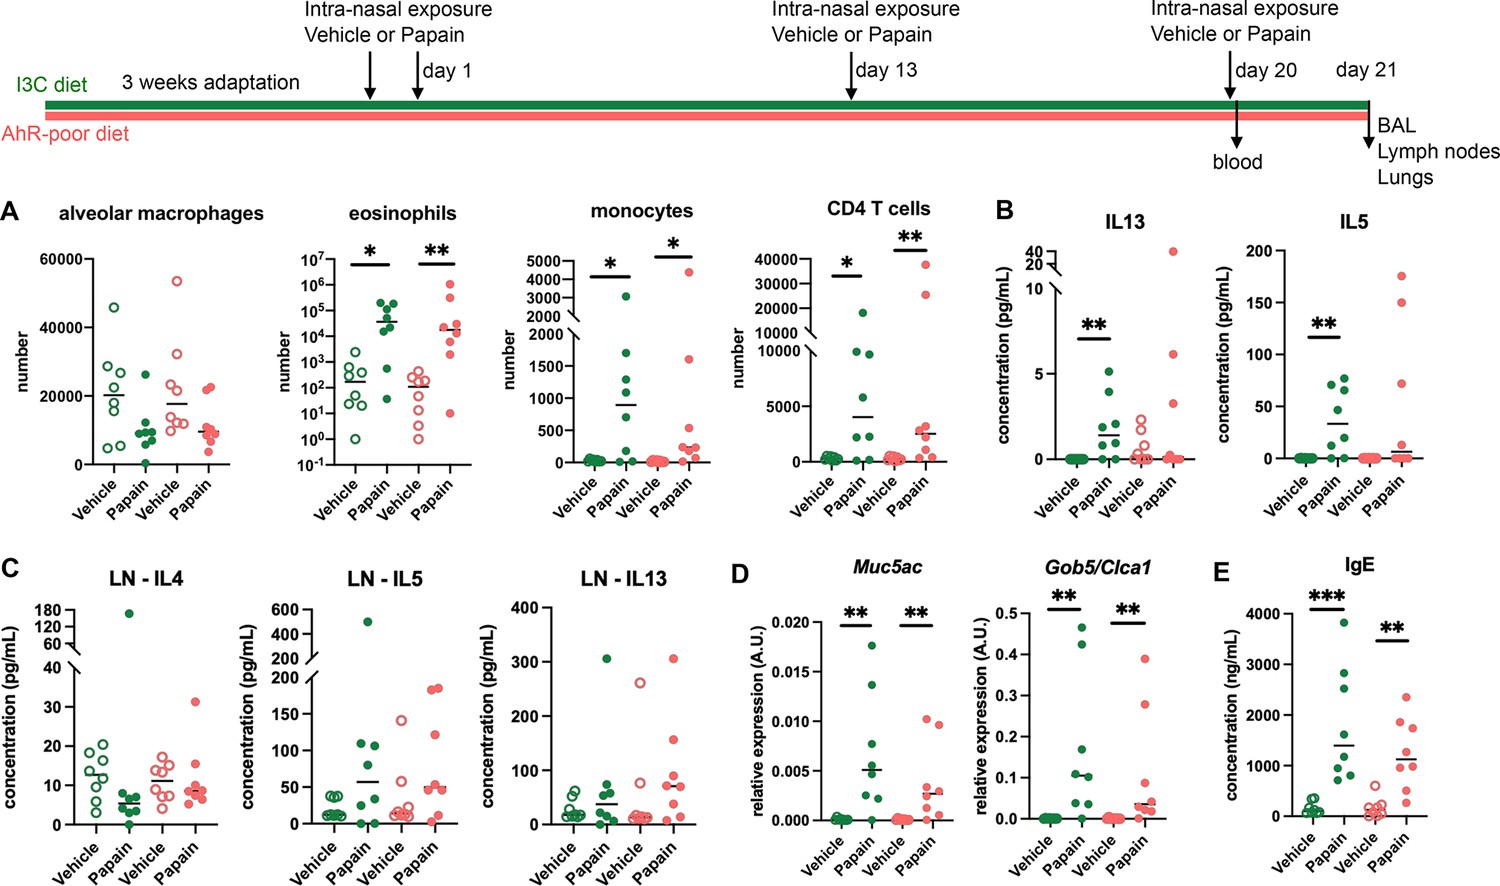
Lack of dietary aryl hydrocarbon receptor (AhR) ligands does not impact airway allergic type 2 inflammation.
Mice were placed on AhR-poor or indole-3-carbinol (I3C) diet for 3 wk of adaptation prior to the start of experiments. Mice were exposed to papain or vehicle (PBS) intranasally four times at days 0, 1, 13, and 20. (A–D) 24 hr after the last exposure, tissues were analyzed. (A) Cell counts in bronchoalveolar lavage. (B) Cytokine concentration in bronchoalveolar lavage. (C) Normalized numbers of lymph nodes T cells were restimulated ex vivo, and cytokine secretion was measured in the supernatant after 24 hr. LN = lymph nodes. (D) Lung lysates were analyzed by RT-qPCR. (E) Blood was collected at day 20 and IgE concentration measured in the serum. For all panels, median is shown (n = 8 in two independent experiments). Kruskal–Wallis test. *p<0.05; **p<0.01; ***p<0.001.
Figure 2—figure supplement 1
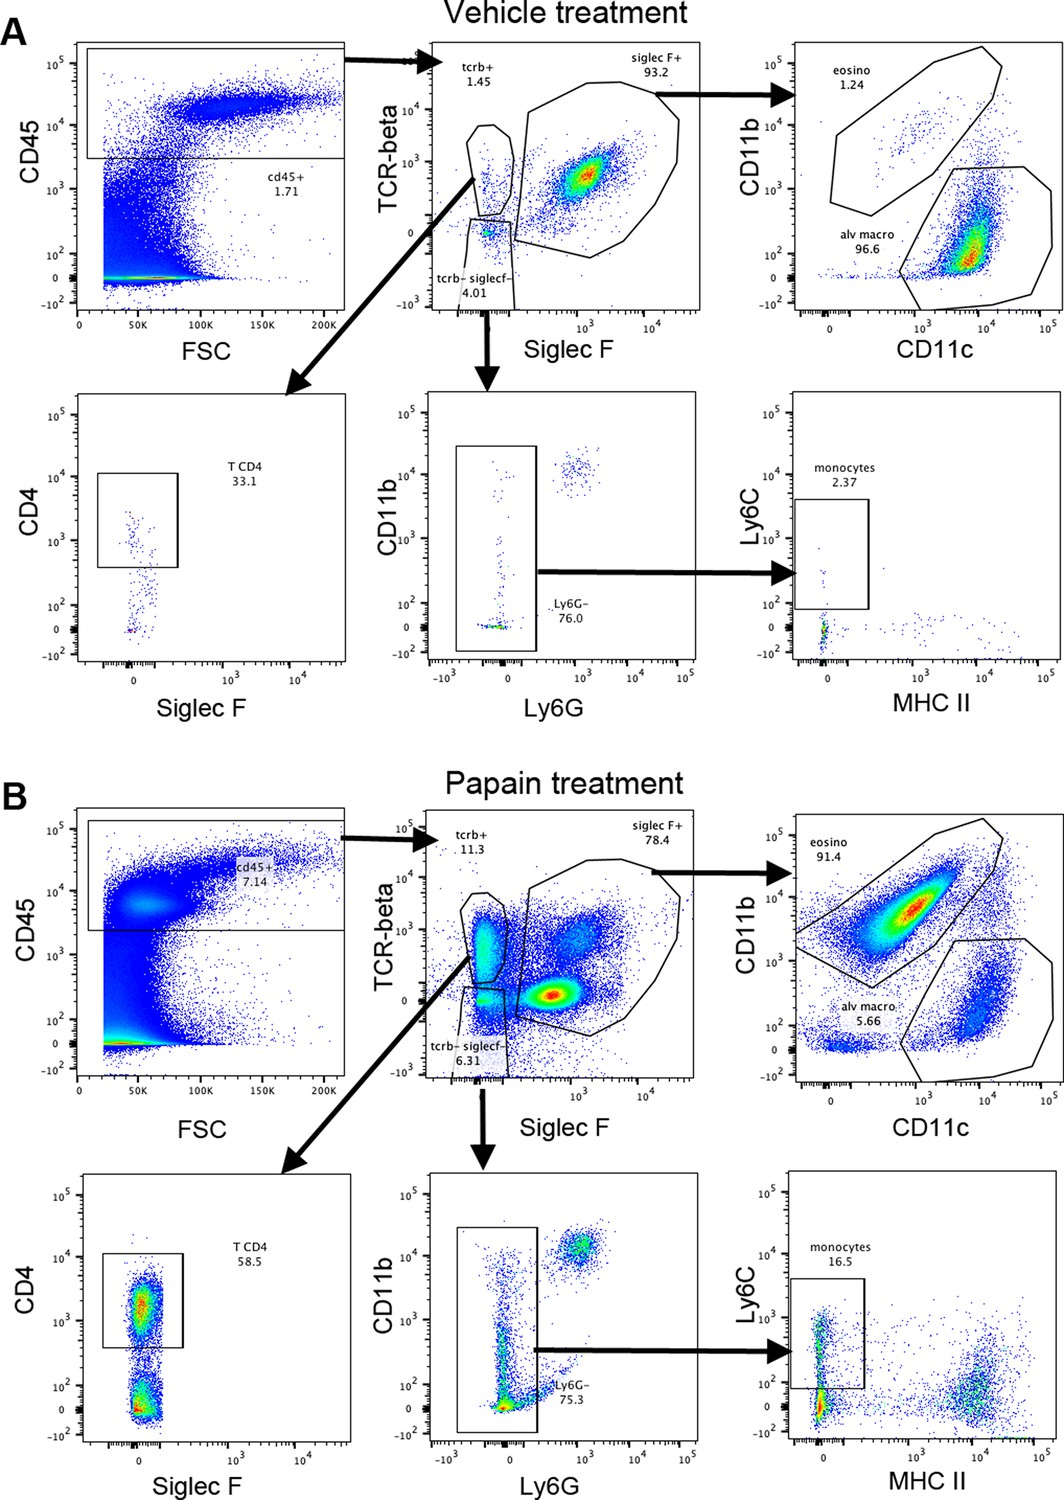
Gating strategy for bronchoalveolar cells.
Bronchoalveolar cells were gated on live singlets. One representative example for mice treated with vehicle (A) or papain (B).
Figure 3
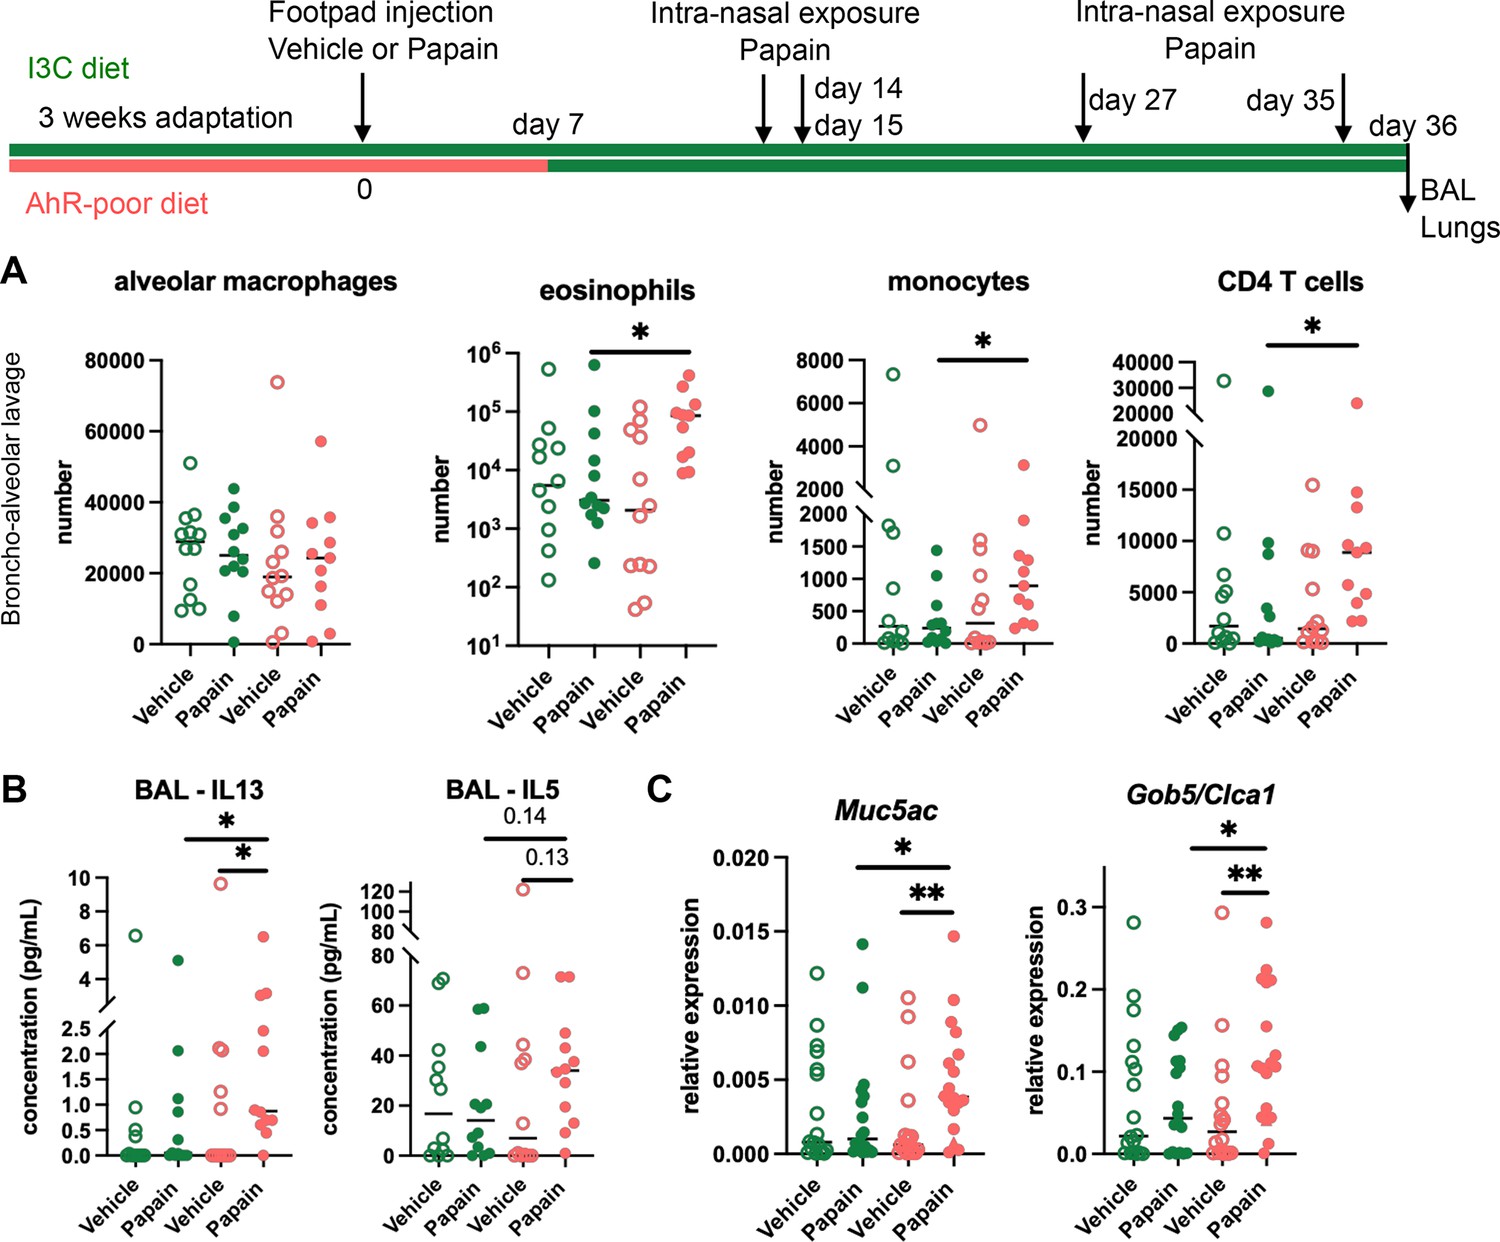
Lack of dietary aryl hydrocarbon receptor (AhR) ligands worsens airway allergy after skin sensitization.
Mice were placed on AhR-poor or indole-3-carbinol (I3C) diet for 3 wk of adaptation prior to the start of experiments. Papain or vehicle (PBS) was injected in the footpad at day 0. At day 7, all mice were placed on the I3C diet. Mice were exposed to papain intranasally four times at days 14, 15, 27, and 35. 24 hr after the last exposure, bronchoalveolar lavage (BAL) and lung tissue were analyzed. (A) Cell counts in BAL (n = 12 in three independent experiments). (B) Cytokine concentration in BAL (n = 12 in three independent experiments). (C) Lung lysates were analyzed by RT-qPCR (n=18 in four independent experiments). For all panels, median is shown. Kruskal–Wallis test. *p<0.05; **p<0.01.
Figure 4 with 1 supplement

Lack of dietary aryl hydrocarbon receptor (AhR) ligands impairs Langerhans cells migration, thereby increasing Th2 responses.
(A, B) Mice were placed on AhR-poor or indole-3-carbinol (I3C) diet for 3 wk of adaptation prior to the start of experiments. (A) Density of epidermal Langerhans cells was assessed by imaging Cd207(Langerin)-eGFP+ cells. Representative images are shown (n = 5 per condition). Median is shown. (B–D) Papain or vehicle (PBS) was injected in the footpad at day 0. (B) After 24 hr (vehicle and papain) or 48 hr (papain), dendritic cells numbers were assessed in the draining lymph nodes. Median is shown (n = 11–14 in three independent experiments). (C, D) Mice were fed with the I3C diet for 3 wk of adaptation prior to the start of experiments. (C) Mice were treated with vehicle or AhR inhibitor CH-223191 at day 0. After 48 hr, dendritic cells numbers were assessed in the draining lymph nodes. Median is shown (n = 9 in three independent experiments). (D) Cd207(Langerin)-DTR mice or WT littermates were injected with Diphtheria Toxin 3 d prior to papain treatment. At day 6 after papain treatment, cells from the draining lymph nodes were analyzed. Normalized numbers of lymph nodes T cells were restimulated ex vivo, and cytokine secretion was measured in the supernatant after 24 hr. Median is shown (n = 11–17 in three independent experiments). One-way ANOVA. For all panels *p<0.05; **p<0.01; ***p<0.001.
Figure 4—figure supplement 1
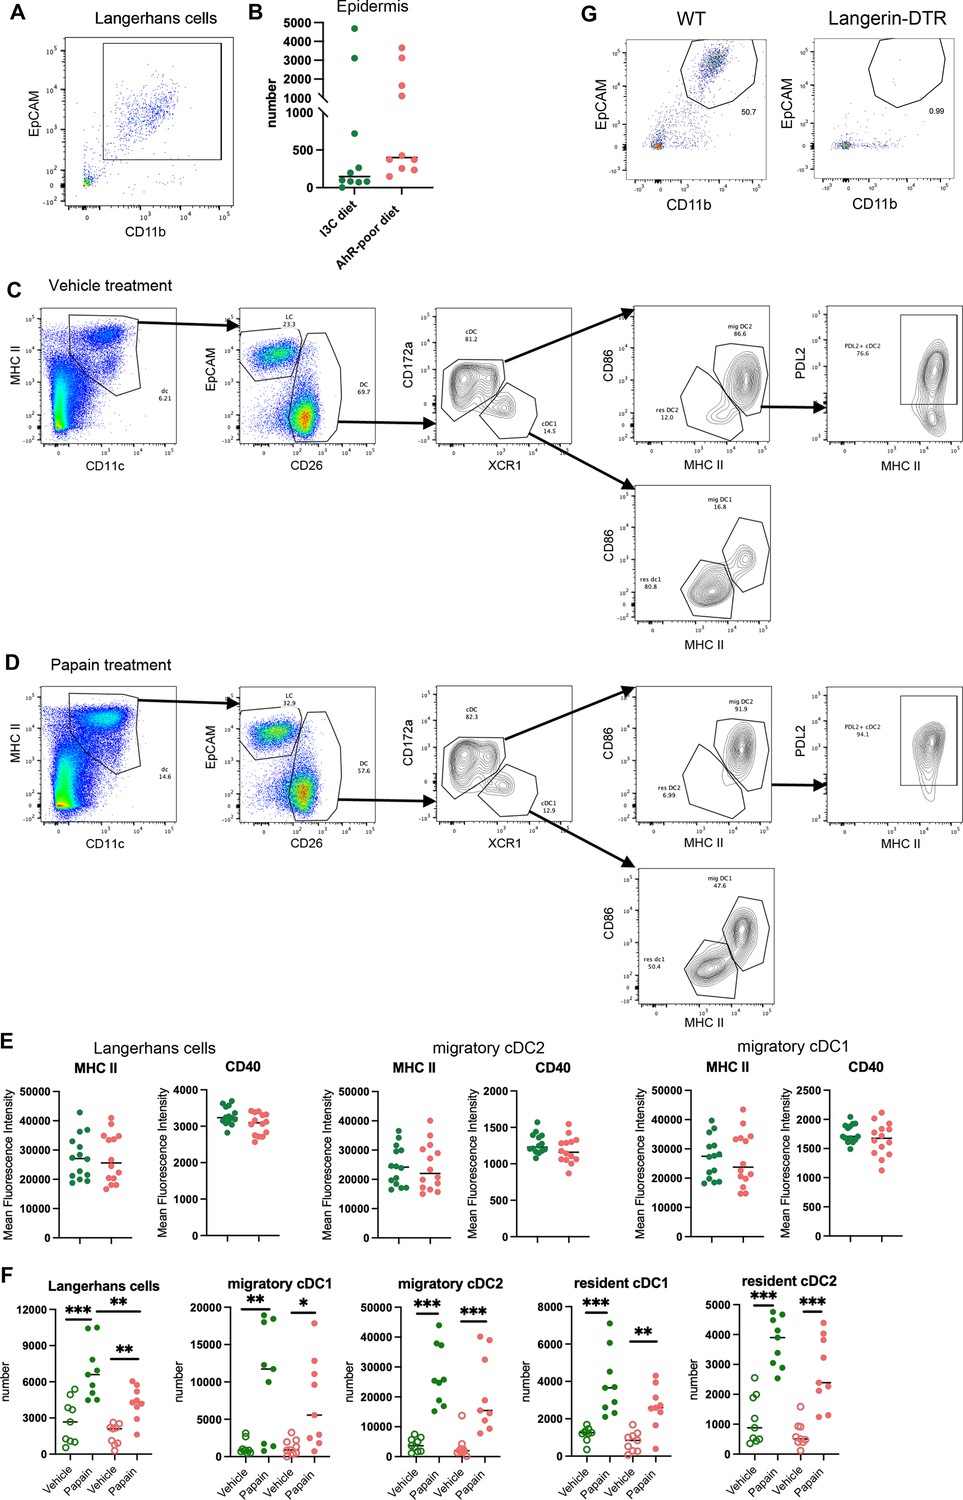
Analysis of cutaneous allergy.
Mice were fed on aryl hydrocarbon receptor (AhR)-poor or indole-3-carbinol (I3C) diet for 3 wk of adaptation prior to the start of experiments. (A) Gating strategy for epidermal Langerhans cells. Cells were gated on live singlets CD45+ cells. (B) Number of Langerhans cells in the footpad epidermis at day 0. Median is shown (n = 10 in three independent experiments). (C, D) Gating strategy for lymph nodes analysis. Lymph node cells were gated on live singlets CD19- CD3- cells. One representative example for mice treated with vehicle (C) or papain (D). (E) Mean fluorescence intensity for MHC II molecules and CD40 in indicated cell types 48 hr after papain footpad injection. Median is shown (n = 14 in three independent experiments). (F) 48 hr after topical application of papain or vehicle, dendritic cells numbers were assessed in the draining lymph nodes. Median is shown (n = 9 in three independent experiments). One-way ANOVA. (G) Cd207(Langerin)-DTR mice and WT littermates were injected with Diphtheria Toxin. After 3 d, footpad epidermis was analyzed by flow cytometry. Representative results (n = 5 in two independent experiments). For all panels, *p<0.05; **p<0.01; ***p<0.001, absence of asterisk indicates ‘not significant’.
Figure 5 with 3 supplements
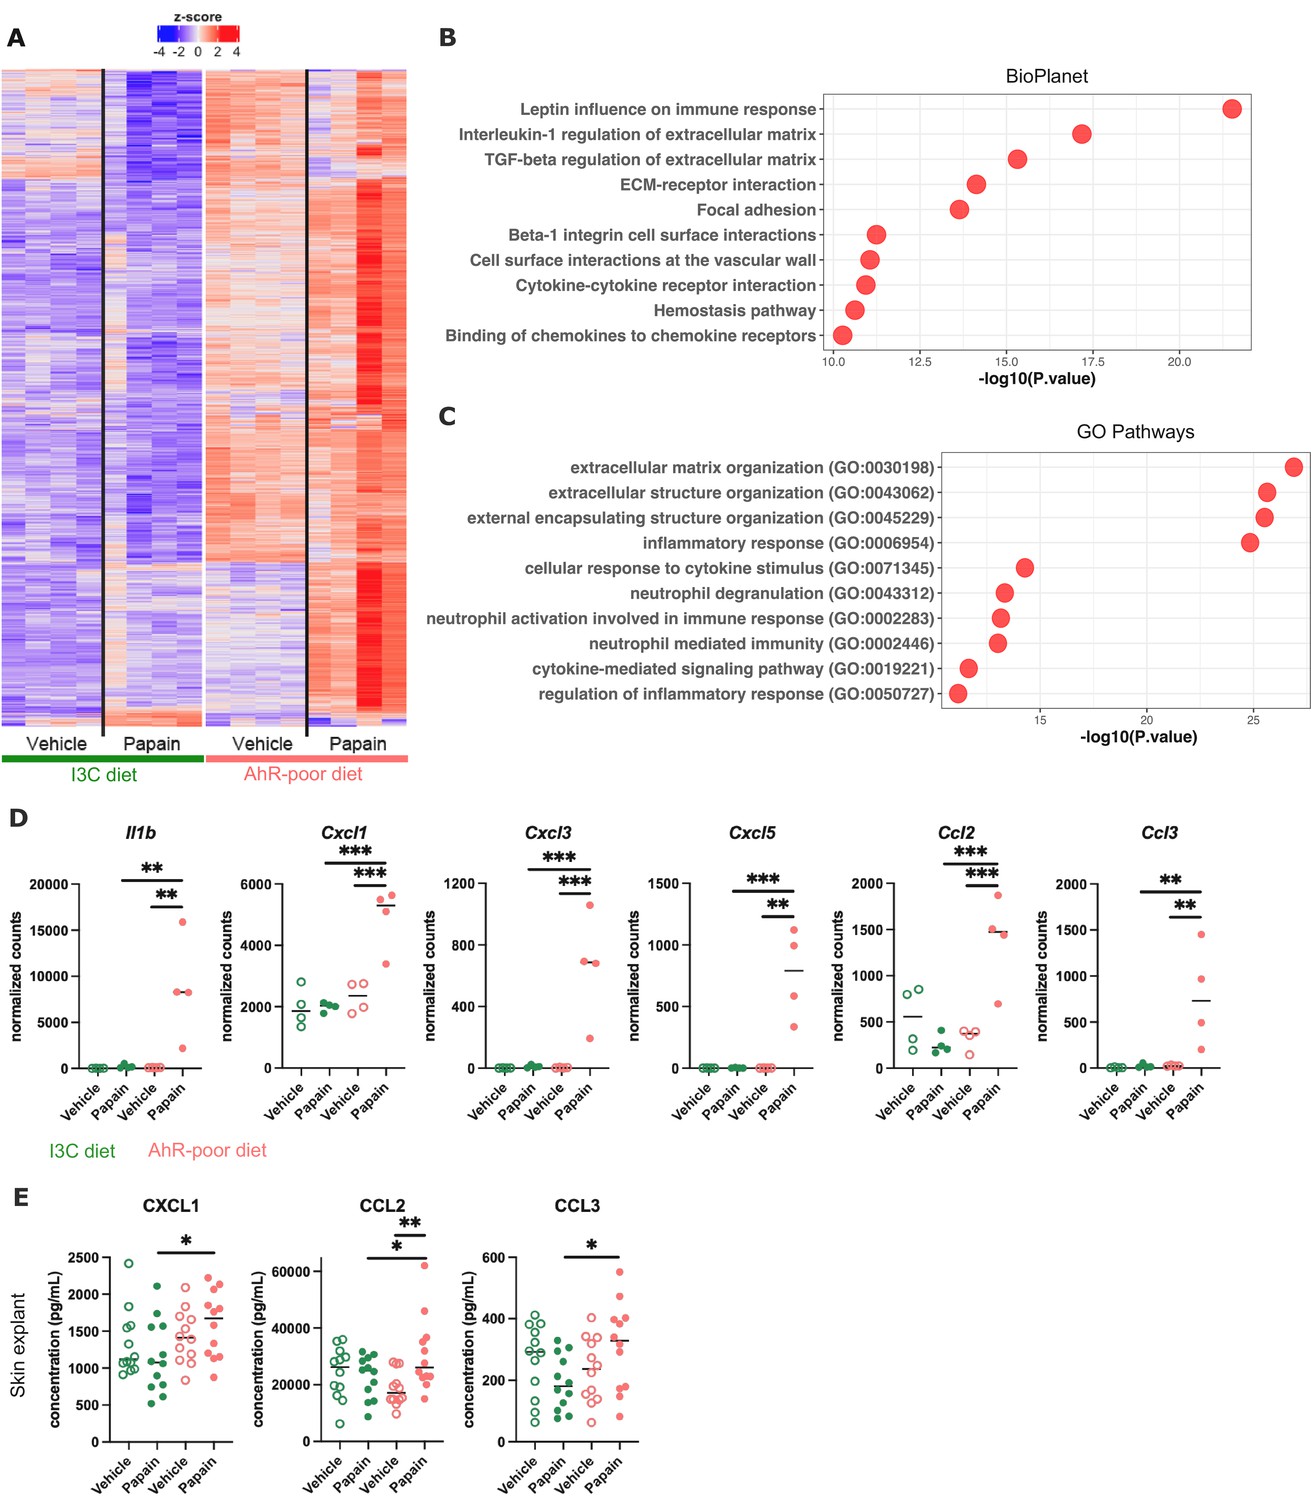
Dietary aryl hydrocarbon receptor (AhR) ligands regulate the inflammatory profile of epidermal cells.
Mice were placed on AhR-poor or indole-3-carbinol (I3C) diet for 3 wk of adaptation prior to the start of experiments. Papain or vehicle (PBS) was injected in the footpad at day 0. (A–D) After 6 hr, epidermal cells were extracted and subjected to RNA-seq analysis. n = 4 biological replicates. (A) Diet-dependent differentially expressed genes. (B, C) Enrichment for biological pathways using BioPlanet (B) or Gene Ontology Biological Process databases (C). (D) Normalized counts for selected genes, median is shown. One-way ANOVA. (E) After 24 hr, footpad skin was collected and explants were cultured for 24 hr to prepare conditioned medium. Chemokine concentrations were measured in the medium. Median is shown (n = 12 in three independent experiments). Kruskal–Wallis test. For all panels *p<0.05; **p<0.01; ***p<0.001.
-
Figure 5—source data 1
List of differentially expressed genes between conditions.
- https://cdn.elifesciences.org/articles/86413/elife-86413-fig5-data1-v2.xlsx
Figure 5—figure supplement 1
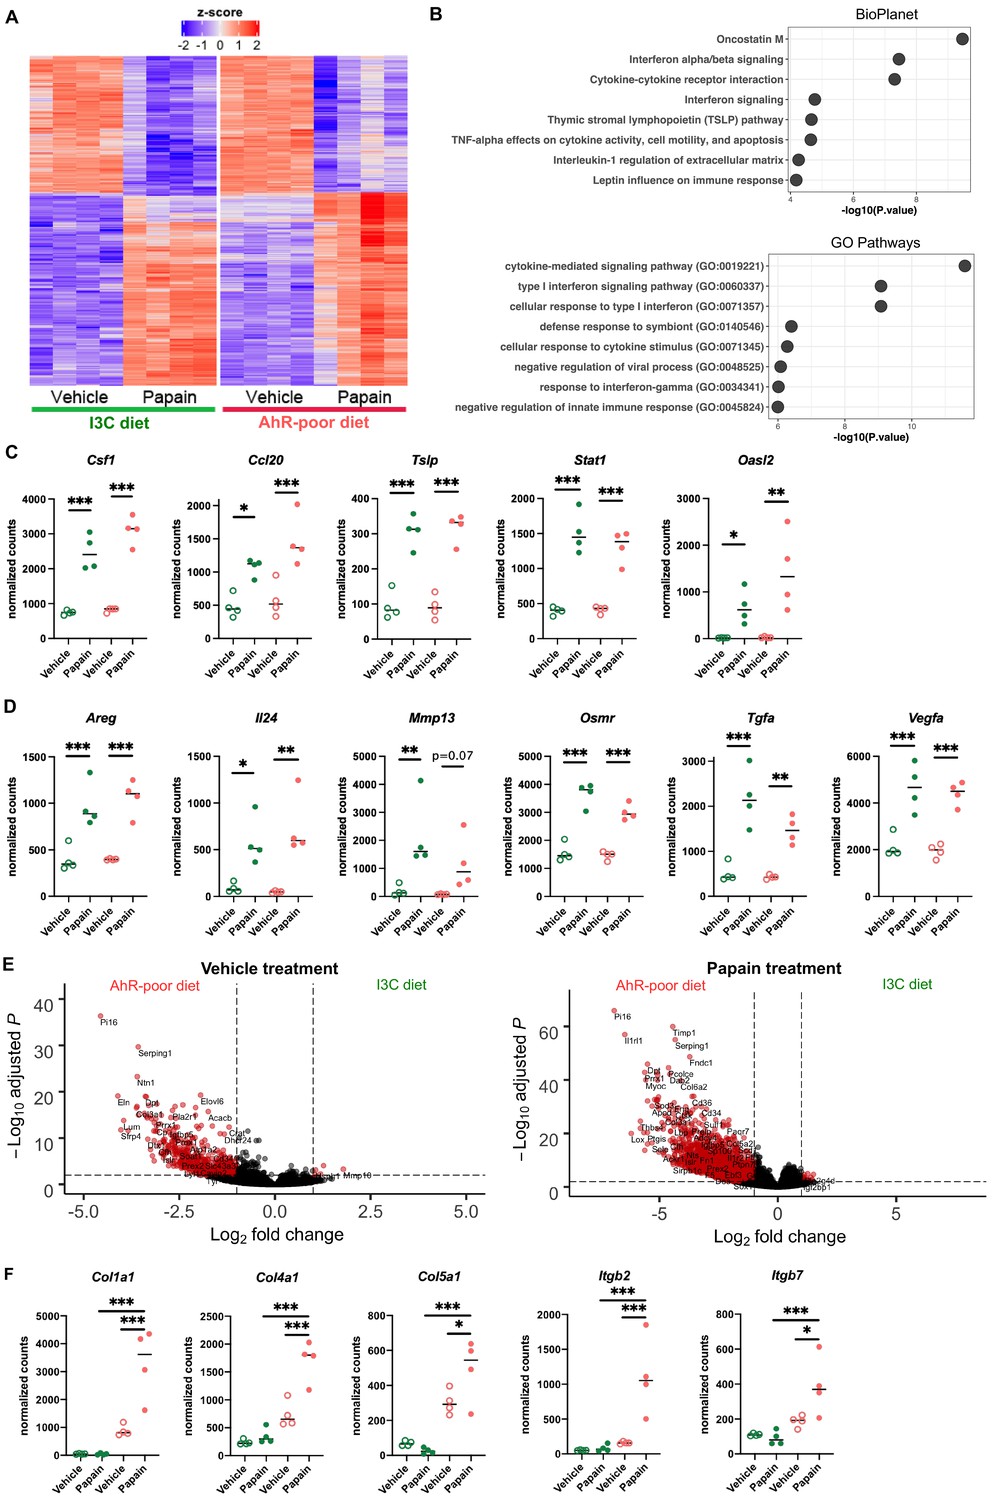
Dietary aryl hydrocarbon receptor (AhR) ligands modulate the transcriptomic profile of epidermal cells.
Mice were fed on AhR-poor or indole-3-carbinol (I3C) diet for 3 wk of adaptation prior to the start of experiments. Papain or vehicle (PBS) was injected in the footpad at day 0. After 6 hr, epidermal cells were extracted and subjected to RNA-seq analysis. n = 4 biological replicates. (A) Diet-independent differentially expressed genes. (B) Enrichment for biological pathways using BioPlanet or Gene Ontology Biological Process databases. (C, D) Normalized counts for selected genes, median is shown. One-way ANOVA. (E) Differentially expressed genes between mice fed on AhR-poor or I3C diet in vehicle-treated mice (left) or papain-treated mice (right). (F) Normalized counts for selected genes, median is shown. One-way ANOVA. For all panels *p<0.05; **p<0.01; ***p<0.001.
Figure 5—figure supplement 2
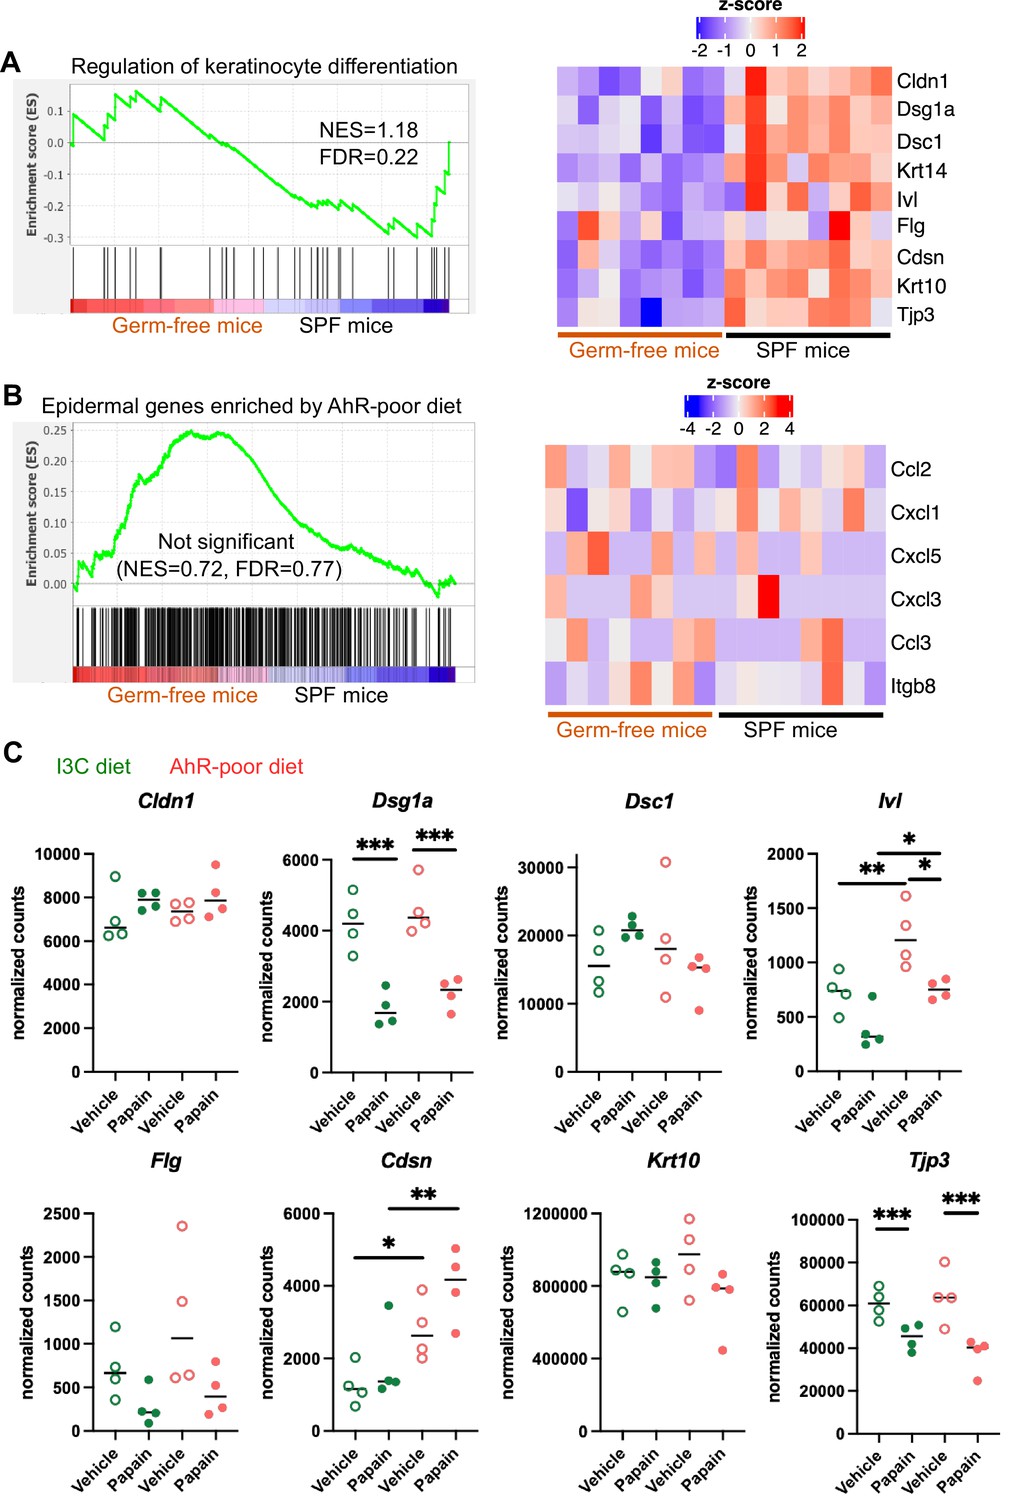
Diet-derived aryl hydrocarbon receptor (AhR) ligands do not impact keratinocyte barrier genes.
(A, B) RNA-seq data of the epidermis of germ-free or specific pathogen-free (SPF) mice (n = 8) was extracted from public source (GSE162925). Gene set enrichment analysis was performed for Gene Ontology Biological Pathway ‘Regulation of keratinocyte differentiation’ signature (A) or the top 500 differentially expressed genes enriched in mice fed on AhR-poor diet (B). NES = normalized enrichment score. FDR = false discovery rate. Results are considered significant when NES > 1 and FDR < 0.25. (A, B) Scaled expression of selected genes. (C) Mice were placed on AhR-poor or indole-3-carbinol (I3C) diet for 3 wk of adaptation prior to the start of experiments. Papain or vehicle (PBS) was injected in the footpad at day 0. After 6 hr, epidermal cells were extracted and subjected to RNA-seq analysis. n = 4 biological replicates. Normalized counts for selected genes, median is shown. One-way ANOVA. For all panels *p<0.05; **p<0.01; ***p<0.001; absence of asterisk indicates ‘not significant’.
Figure 5—figure supplement 3
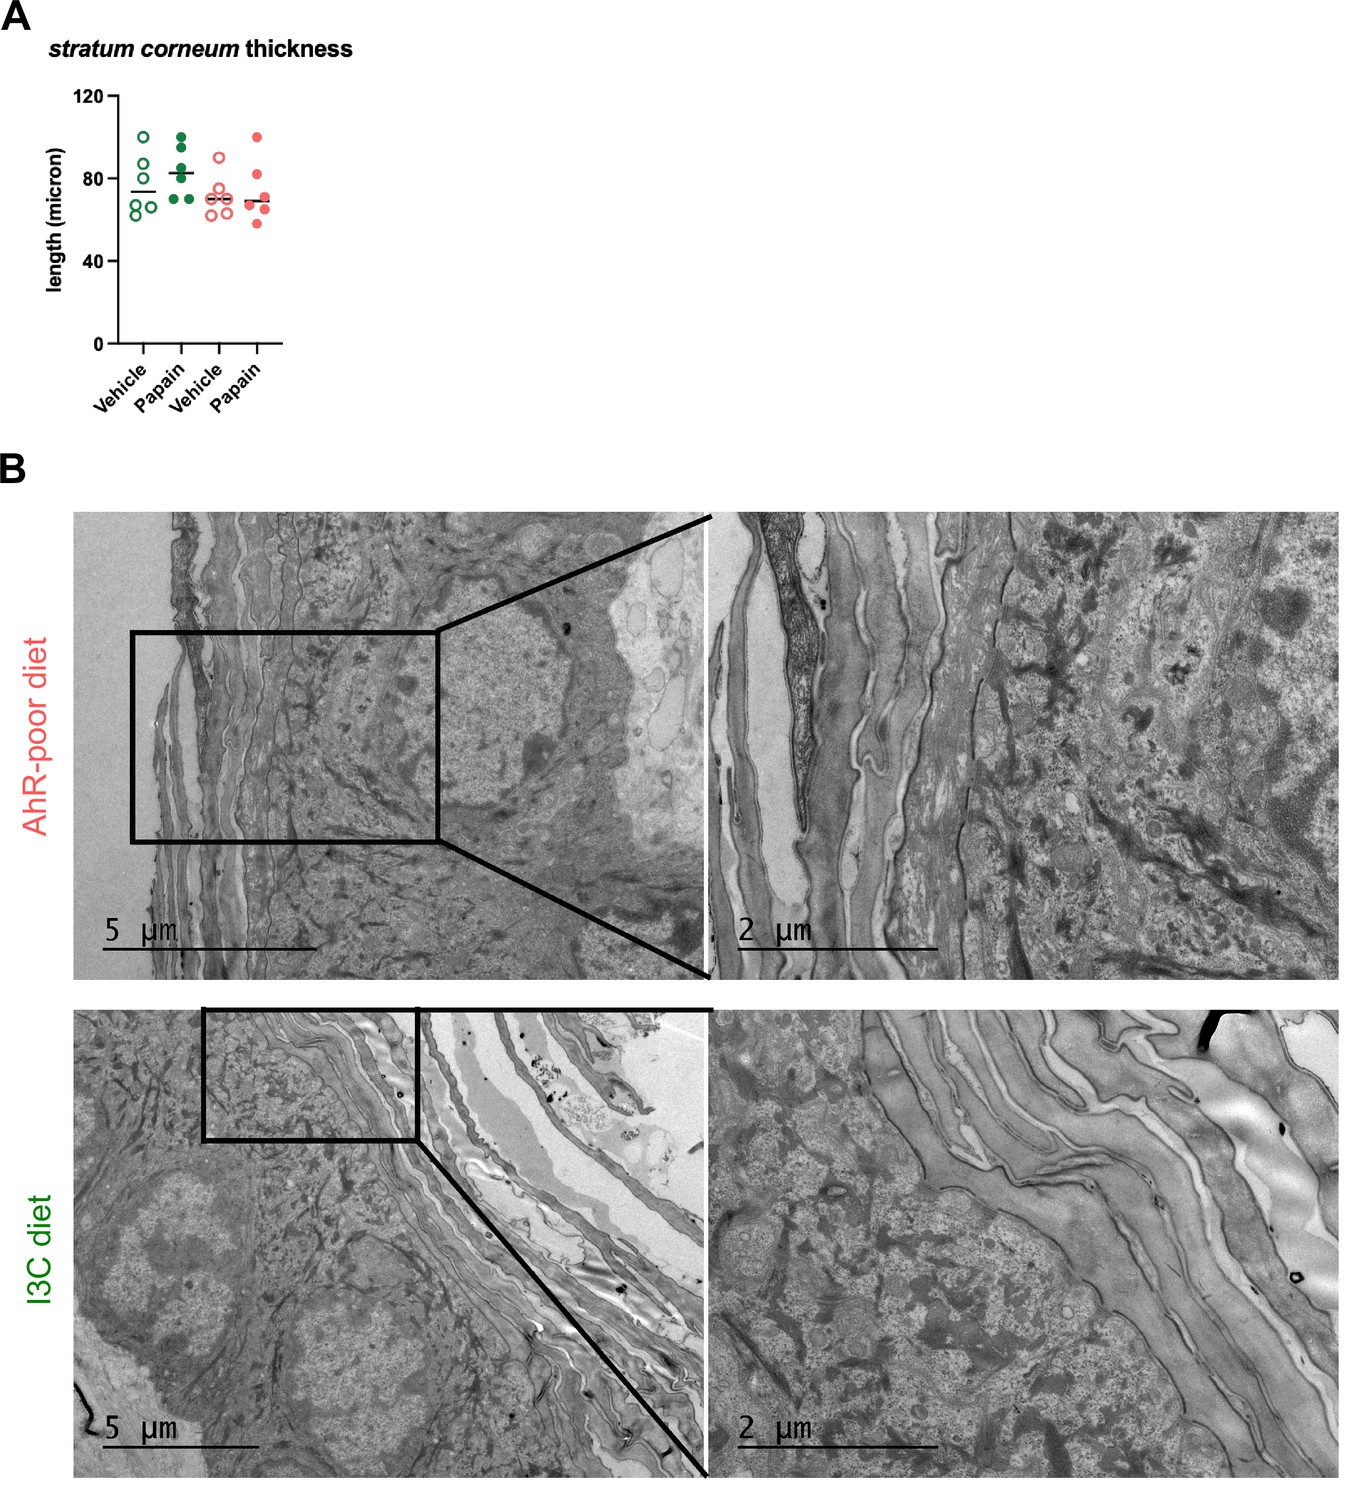
Diet-derived aryl hydrocarbon receptor (AhR) ligands do not impact the structure of the skin barrier.
Mice were placed on AhR-poor diet or enriched in indole-3-carbinol (I3C diet) for 3 wk of adaptation prior to the start of experiments. (A) Papain or vehicle (PBS) was injected in the footpad at day 0. Mice were sacrificed for analysis after 24 hr. Footpad tissues were analyzed by histology. Stratum corneum thickness was measured on images. Median is shown (n = 6 in two independent experiments). Absence of asterisk indicates ‘not significant.’ (B) Ear skin (without any challenge) was analyzed by electron microscopy. Representative results (n = 3).
Figure 6
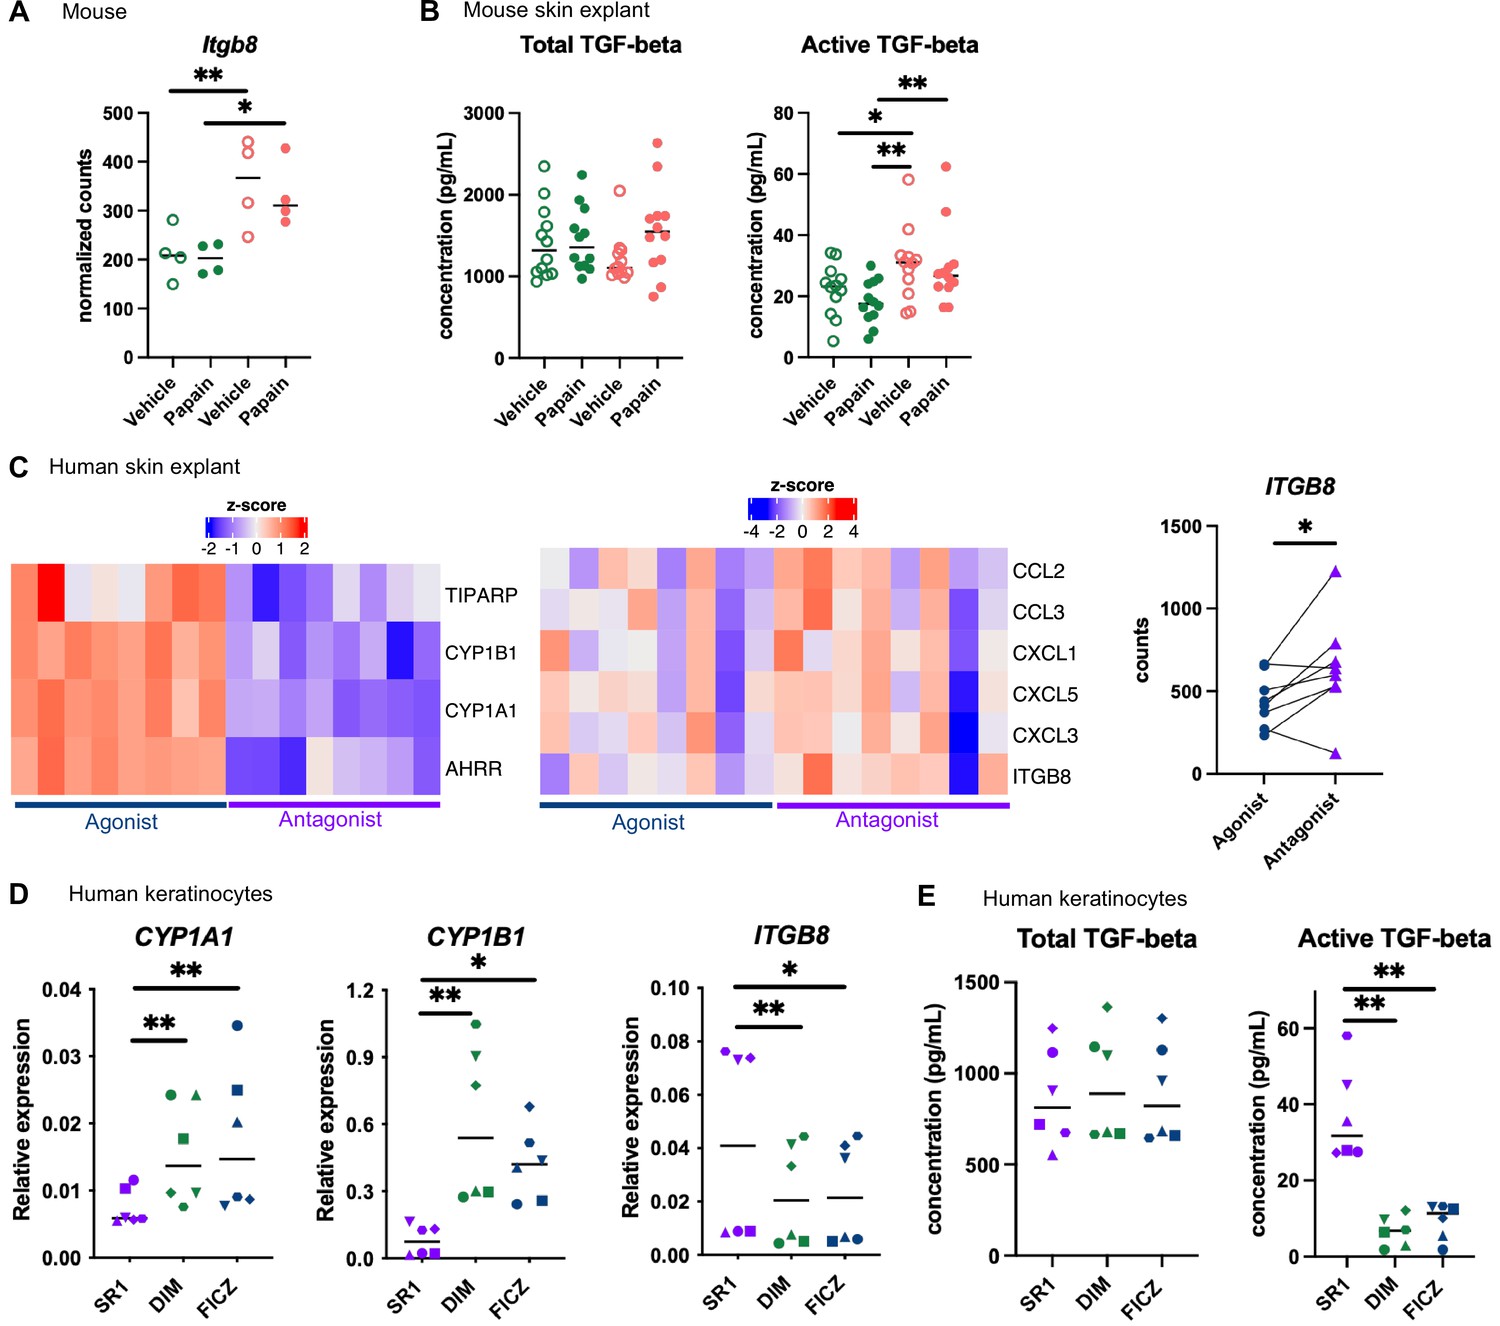
Aryl hydrocarbon receptor (AhR) activation regulates keratinocyte production of TGF-β in mouse and human.
(A, B) Mice were placed on AhR-poor or indole-3-carbinol (I3C) diet for 3 wk of adaptation prior to the start of experiments. Papain or vehicle (PBS) was injected in the footpad at day 0. (A) After 6 hr, epidermal cells were extracted and subjected to RNA-seq analysis. n = 4 biological replicates. Normalized counts, median is shown. One-way ANOVA. (B) After 24 hr, footpad skin was collected and explants were cultured for 24 hr to prepare conditioned medium. TGF-β concentration was measured in the medium. Median is shown (n = 12 in three independent experiments). Kruskal–Wallis test. (C) RNA-seq data of human skin explant cultured in the presence of AhR agonist (FICZ) or AhR antagonist (SR1) was extracted from public source (GSE47944) (n = 8). Scaled expression of selected genes. Normalized counts for ITGB8, paired t-test. (D, E) Human HaCaT keratinocytes were cultured for 24 hr in the presence of AhR antagonist (SR1) or AhR agonists (DIM or FICZ). (D) Expression of selected genes was measured by RT-qPCR. Median is shown (n = 6 in three independent experiments, individual symbols represent paired conditions). Friedman test. (E) TGF-β concentration was measured in the supernatant. Median is shown (n = 6 in three independent experiments, individual symbols represent paired conditions). Friedman test. For all panels *p<0.05; **p<0.01; ***p<0.001.
Tables
Key resources table
| Reagent type (species) or resource | Designation | Source or reference | Identifiers | Additional information |
|---|---|---|---|---|
| Strain, strain background (mouse) | Cd207(Langerin)-eGFP-DTR | Kissenpfennig et al., 2005 | RRID:IMSR_JAX:016940 | Founder animals were donated by M.Vocanson (CIRI, Lyon, France) |
| Cell line (human) | HaCaT | Wilson, 2014 | RRID:CVCL_0038 | |
| Antibody | Anti-TCRβ BUV737 (hamster monoclonal, clone H57-597) | BD Biosciences | AB_2740818 | 1:200 |
| Antibody | Anti-CD11c PerCpCy5.5 (hamster monoclonal, clone HL3) | BD Biosciences | AB_1727422 | 1:200 |
| Antibody | Anti-SiglecF BV480 (rat monoclonal, clone E50-2440) | BD Biosciences | AB_2743940 | 1:200 |
| Antibody | Anti-CD45 FITC (rat monoclonal, clone 30-F11) | BioLegend | AB_312973 | 1:200 |
| Antibody | Anti-CD11b Pe-CF594 (rat monoclonal, clone M1/70) | BD Biosciences | AB_11154422 | 1:400 |
| Antibody | Anti-MHCII BV786 (rat monoclonal, clone M5/114.15.2) | BioLegend | AB_2565977 | 1:200 |
| Antibody | Anti-Ly6G BV605 (rat monoclonal, clone 1A8) | BioLegend | AB_2565880 | 1:200 |
| Antibody | Anti-CD4 BV650 (rat monoclonal, clone RM4-5) | BioLegend | AB_2562529 | 1:200 |
| Antibody | Anti-Ly6C AF700 (rat monoclonal, clone HK1.4) | BioLegend | AB_10643270 | 1:300 |
| Antibody | Anti-EpCAM APCFire750 (rat monoclonal, clone G8.8) | BioLegend | AB_2629758 | 1:400 |
| Antibody | Anti-CD11b PerCPCy5.5 (rat monoclonal, clone M1/70) | BD Biosciences | AB_394002 | 1:400 |
| Antibody | Anti-TCRβ APC (hamster monoclonal, clone H57-597) | BioLegend | AB_313435 | 1:200 |
| Antibody | Anti-CD4 FITC (rat monoclonal, clone RM4-5) | BD Biosciences | AB_394582 | 1:200 |
| Antibody | Anti-CD19 APC-Cy7 (rat monoclonal, clone 1D3) | BD Biosciences | AB_396770 | 1:200 |
| Antibody | Anti-CD172a BUV737 (rat monoclonal, clone P84) | BD Biosciences | AB_2871154 | 1:200 |
| Antibody | Anti-CD19 BV480 (rat monoclonal, clone 1D3) | BD Biosciences | AB_2739509 | 1:200 |
| Antibody | Anti-CD3 BV480 (hamster monoclonal, clone 500A2) | BD Biosciences | AB_2744035 | 1:200 |
| Antibody | Anti-XCR1 BV510 (rat monoclonal, clone ZET) | BioLegend | AB_2565231 | 1:100 |
| Antibody | Anti-CD11c BV785 (hamster monoclonal, clone N418) | BioLegend | AB_2565268 | 1:100 |
| Antibody | Anti-CD86 FITC (rat monoclonal, clone GL1) | BD Biosciences | AB_394993 | 1:100 |
| Antibody | Anti-CD26 PE (rat monoclonal, clone H194-112) | BioLegend | AB_2293047 | 1:200 |
| Antibody | Anti-CD40 PerCP-efluor710 (rat monoclonal, clone 1C10) | eBioscience | AB_2573677 | 1:100 |
| Antibody | Anti-PDL2 APC (rat monoclonal, clone TY25) | BioLegend | AB_2566345 | 1:100 |
| Antibody | Anti-MHC II BV650 (rat monoclonal, clone M5/114.15.2) | BioLegend | AB_2565975 | 1:400 |
| Software, algorithm | DESeq2 | Love et al., 2014 | v1.22.2 | |
| Software, algorithm | GSEA | Subramanian et al., 2005 | v4.0.3 | |
| Software, algorithm | QuPath | Bankhead et al., 2017 | v.0.3.1 | |
| Software, algorithm | FlowJo | FlowJo LLC | v10 |
Additional files
Download links
A two-part list of links to download the article, or parts of the article, in various formats.
Downloads (link to download the article as PDF)
Open citations (links to open the citations from this article in various online reference manager services)
Cite this article (links to download the citations from this article in formats compatible with various reference manager tools)
Homeostatic activation of aryl hydrocarbon receptor by dietary ligands dampens cutaneous allergic responses by controlling Langerhans cells migration
eLife 12:e86413.
https://doi.org/10.7554/eLife.86413


