Courtship behaviour reveals temporal regularity is a critical social cue in mouse communication
- Institute of Behavioural Neuroscience, Department of Experimental Psychology, University College London, United Kingdom
- Idiap Research Institute, Switzerland
Figures
Figure 1
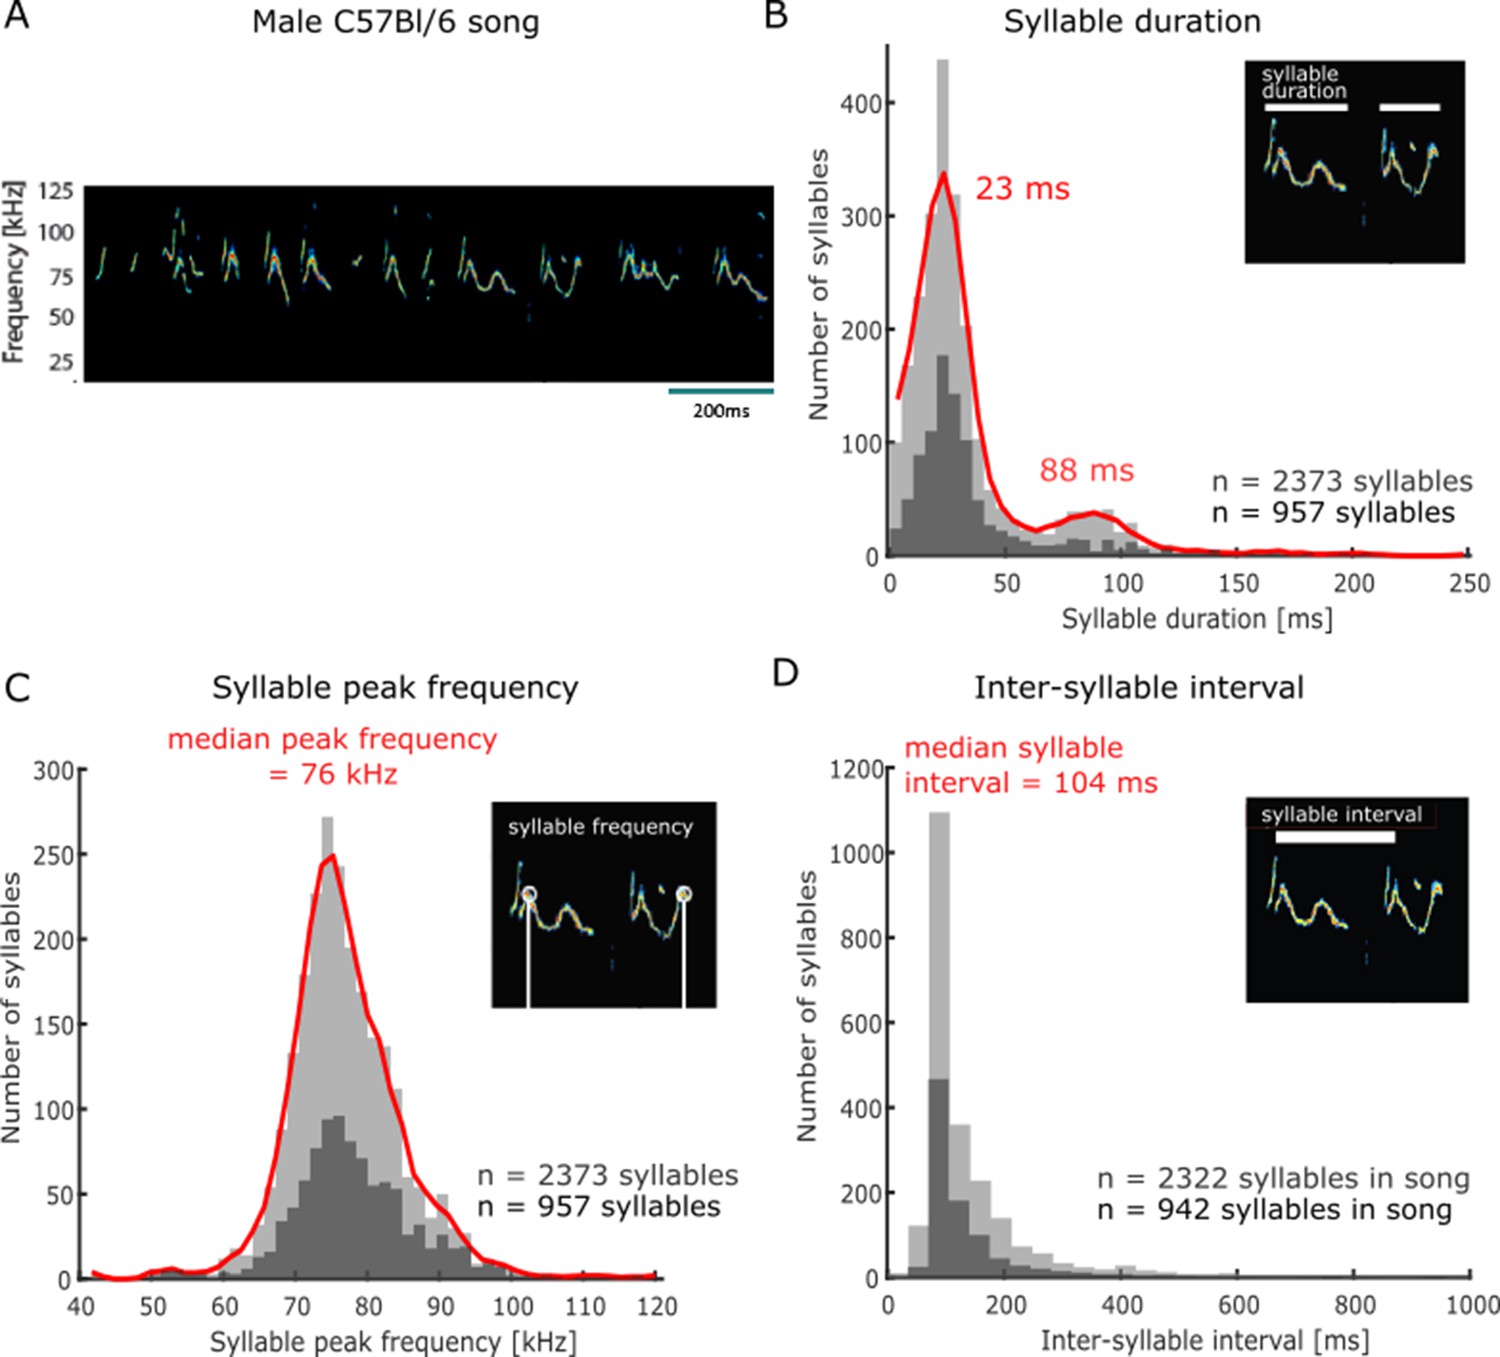
Acoustic features of C57Bl/6 mouse courtship songs.
(A) Spectrogram of a segment of ultrasonic male vocalisations used for stimulation. (B) Distribution of individual ultrasonic syllable durations across a large set of male mouse vocalisations (n = 2373 syllables, light grey histogram; red line is smoothed distribution), including the stimulus set used in subsequent playback experiments (n = 957 syllables, dark grey), emitted in response to the presentation of urine samples from females in oestrus. (C) Distribution of syllable peak frequency (point of maximum amplitude across the call element in kHz) across all recorded syllables (n = 2373,, light grey), and the subset of syllables used for playback (n = 957, dark grey). (D) Distribution of inter-syllable interval durations. The analysis was restricted to syllables with a subsequent syllable starting within 2 s (all recorded syllables: n = 2322, light grey; playback stimulus set: n = 942, dark grey).
Figure 2 with 4 supplements
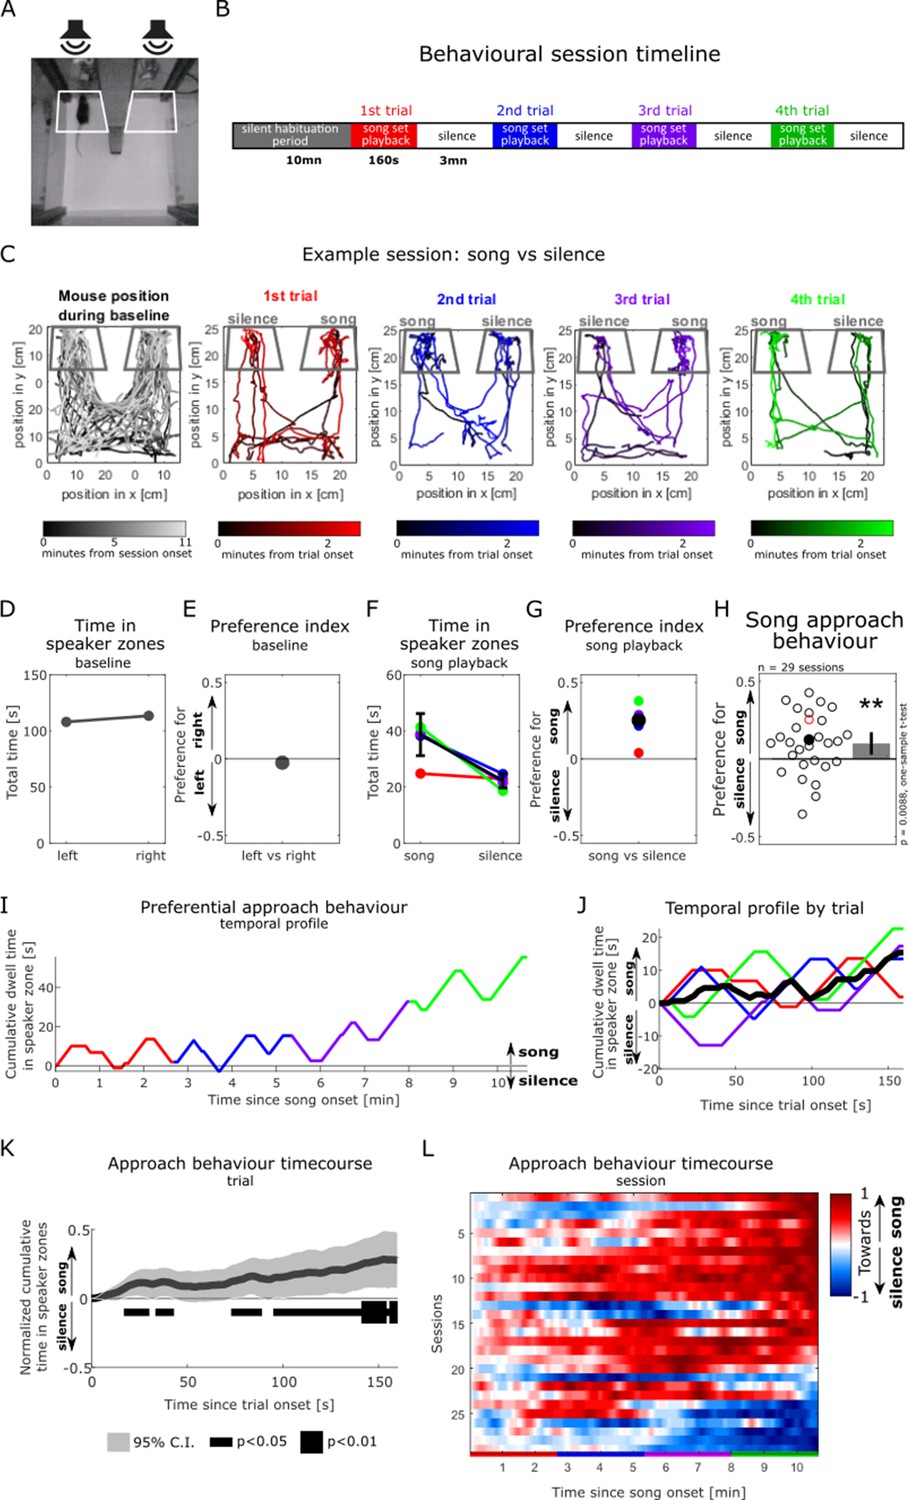
Female mice preferentially approach playbacks of male songs over silence.
(A) Video frame showing the testing box with a soundproof partition (middle) positioned between two ultrasonic loudspeakers. White outlines show the two ‘speaker zones’ used as regions of interest for quantifying the animal’s position. (B) Experimental timeline. (C) Tracking of the animal’s position during an example behavioural session, in which a silent baseline period (leftmost panel) is followed by the playback of intact songs from one side contrasted with silence from the other side (coloured panels). Colour saturation indicates time since start of the experimental period of interest. Dark grey outlines indicate the speaker zones. (D) Time the animal spent in the speaker zones during the silent baseline period in (C). (E) Index quantifying the animal’s relative place preference to the left vs right speaker zones during the silent baseline. This index was computed as the difference between the time spent in either speaker zones, normalised by the sum of the time in both speaker zones (see ‘Methods’). A preference index value close to zero indicates no preference to either side. (F) Time spent in the speaker zones corresponding to song playback and silence during each song presentation trial (coloured circles). The black circle shows the median of the four sound presentation trials. Error bars: standard error of the mean. (G) Preference index in response to the playback of intact songs compared to silence over the course of the example session. The black circle shows the median of the four sound presentation trials. The preference index is the difference between the time in the song playback and the silent speaker zones, divided by the sum of the time in both speaker zones. A positive index value reflects the animal’s preferential approach to the sources of song playback over silence. (H) Population summary of female approach response to playback of intact male songs (positive values) over silence (negative). Each circle is the preference index displayed by individual animals in one behavioural session (median of four sound presentation trials). The red circle corresponds to the example session in (C) and (G). Open circles: sound playback at 58 dB SPL, filled circles: 68 dB SPL. Bar plot shows mean preference index across sessions and 95% confidence interval (CI). One-sample two-tailed t-test, **p<0.01. (I) Temporal profile of approach behaviour over the four sound presentation trials in the example session in (C), calculated as the cumulative sum of time in the intact song playback (positively weighted) vs silent (negatively weighted) speaker zone. (J) Trial-averaged profile of approach behaviour to song playback in the example session, calculated as in (I). (K) Population-averaged approach behaviour time course in response to intact mouse songs vs silence, calculated as in (J). The dark grey trace indicates the mean of trial-based temporal profiles across all sessions (n = 29). For each session, the median of four sound presentation trials (e.g. black trace in J) was normalised to its maximal amplitude. The horizontal black bar indicates time bins during the course of a sound playback trial in which the cumulative approach behaviour significantly deviates from zero (one-sample two-tailed t-test). (L) Normalised temporal profiles of approach behaviour to mouse songs vs silence over the course of four sound presentation trials (x-axis, coloured bars) for each of the behavioural sessions (y-axis, each animal is one line, n = 29), calculated as in (I). Sessions (lines) are ordered by the amplitude of their last element. (F, G, I, J) Black traces indicate the session average (median) across the four sound presentation trials (coloured traces).
Figure 2—figure supplement 1
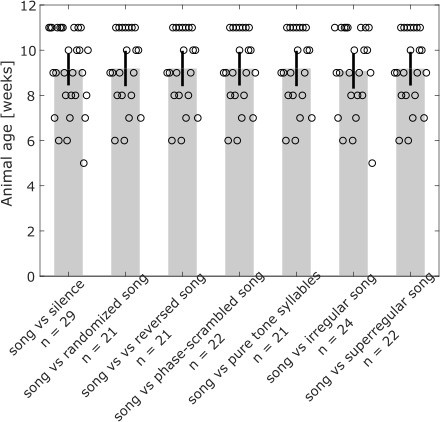
No difference in listener age across playback experiments.
The mice participating in each type of playback experiment were of similar age (one-way ANOVA, F(6, 153) = 0.013, p=1.0). Shown is mean and 95% confidence interval.
Figure 2—figure supplement 2
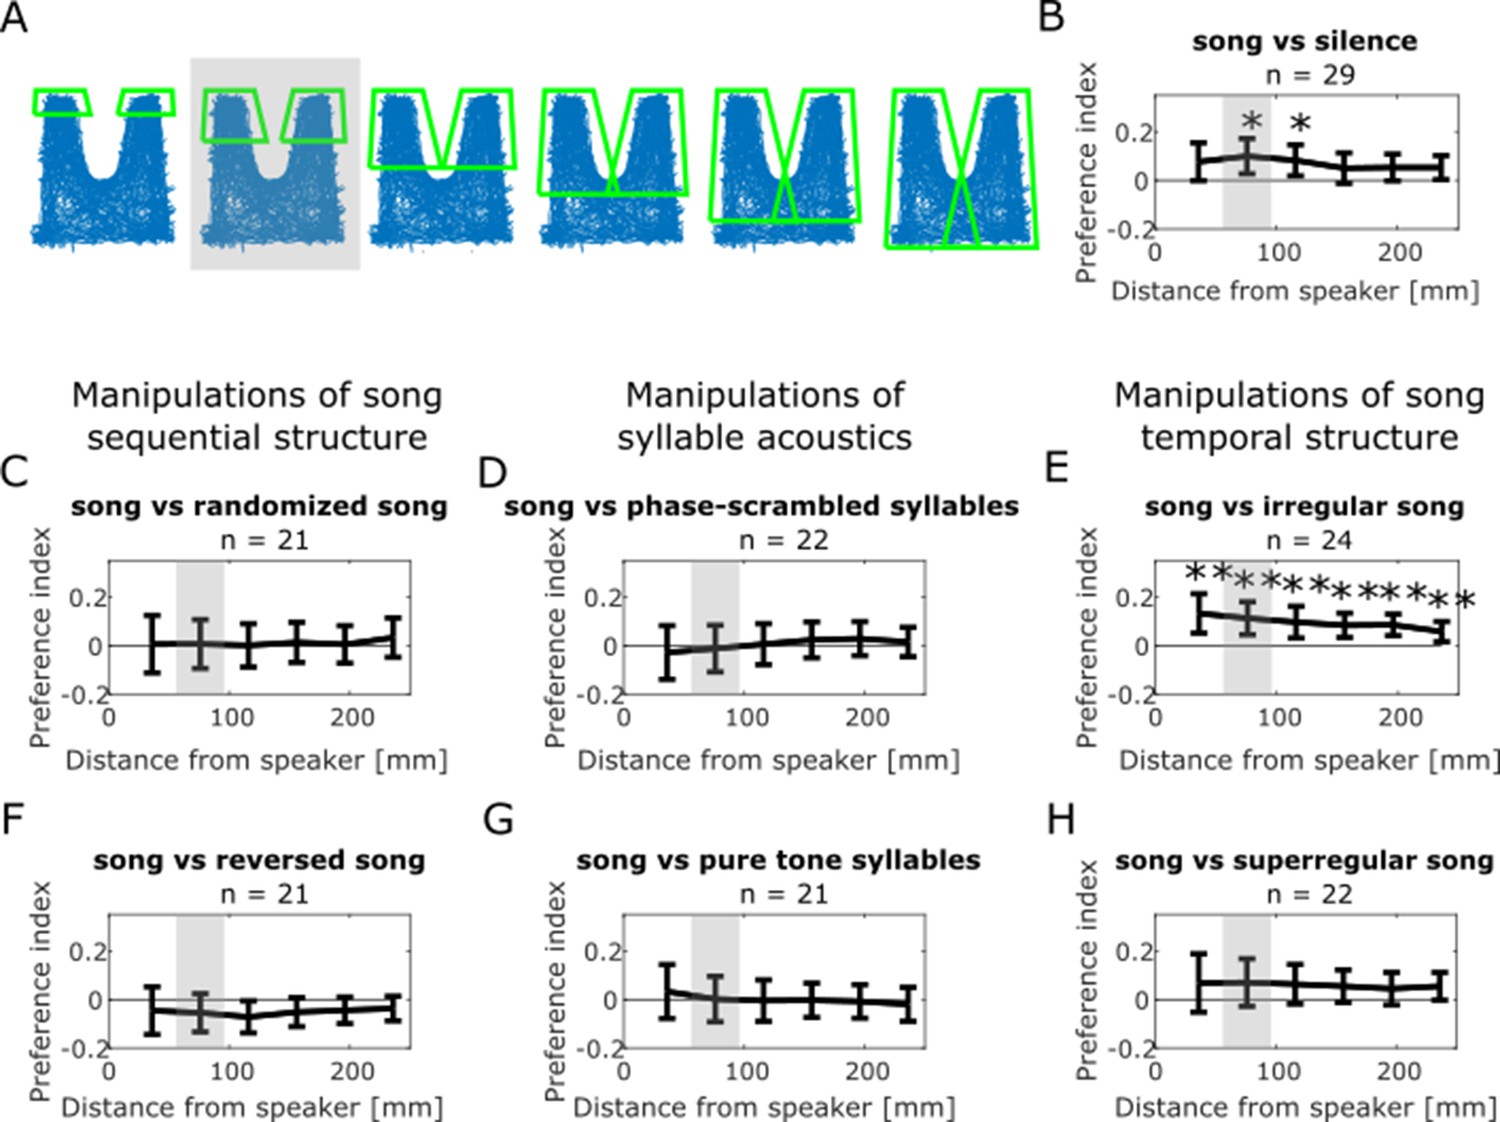
Approach behaviour is consistent across varying speaker zone lengths.
(A) Tracking of the mouse’s position over the course of a behavioural session in the two-compartment behavioural box with a soundproof partition (middle) positioned between two ultrasonic loudspeakers (top). Green outlines show the two ‘speaker zones’ used as regions of interest for quantifying the animal’s position. The grey-shaded image illustrates the speaker zone used throughout the study. Additional images illustrate speaker zones with varying lengths as the distal edge is moved closer and/or further away from the speakers. (B) Population preference index used to quantify approach behaviour in response to playback of intact songs (positive values) relative to silence (negative value) for varying speaker zone lengths in panel (A). The grey shading indicates the speaker zone used throughout the study. Shown is mean and 95% confidence interval. One-sample two-tailed t-test, **p<0.01, ns: non-significant, p>0.05. (C) Population preference index used to quantify approach behaviour in response to intact songs (positive values) relative to sequences of randomly ordered syllables (negative value), displayed as in panel (B). (D) Population preference index used to quantify approach behaviour in response to intact songs (positive values) relative to sequences of phase-scrambled syllables (negative value). (E) Population preference index used to quantify approach behaviour in response to intact (positive values) relative to temporally irregular (negative value) songs. (F) Population preference index used to quantify approach behaviour in response to intact (positive values) relative to reversed (negative value) songs. (G) Population preference index used to quantify approach behaviour in response to intact songs (positive values) relative to sequences of pure-tone approximation of syllables (negative value). (H) Population preference index used to quantify approach behaviour in response to intact (positive values) relative to temporally super-regular (negative value) songs.
Figure 2—video 1
Example video tracking of mouse approach behaviour.
Third sound presentation trial from example behavioural session (green trace in Figure 2C), with intact song playback from the left speaker.
Figure 2—video 2
Example video tracking of mouse approach behaviour.
Fourth sound presentation trial from example behavioural session (green trace in Figure 2C), with intact song playback from the left speaker.
Figure 3 with 1 supplement
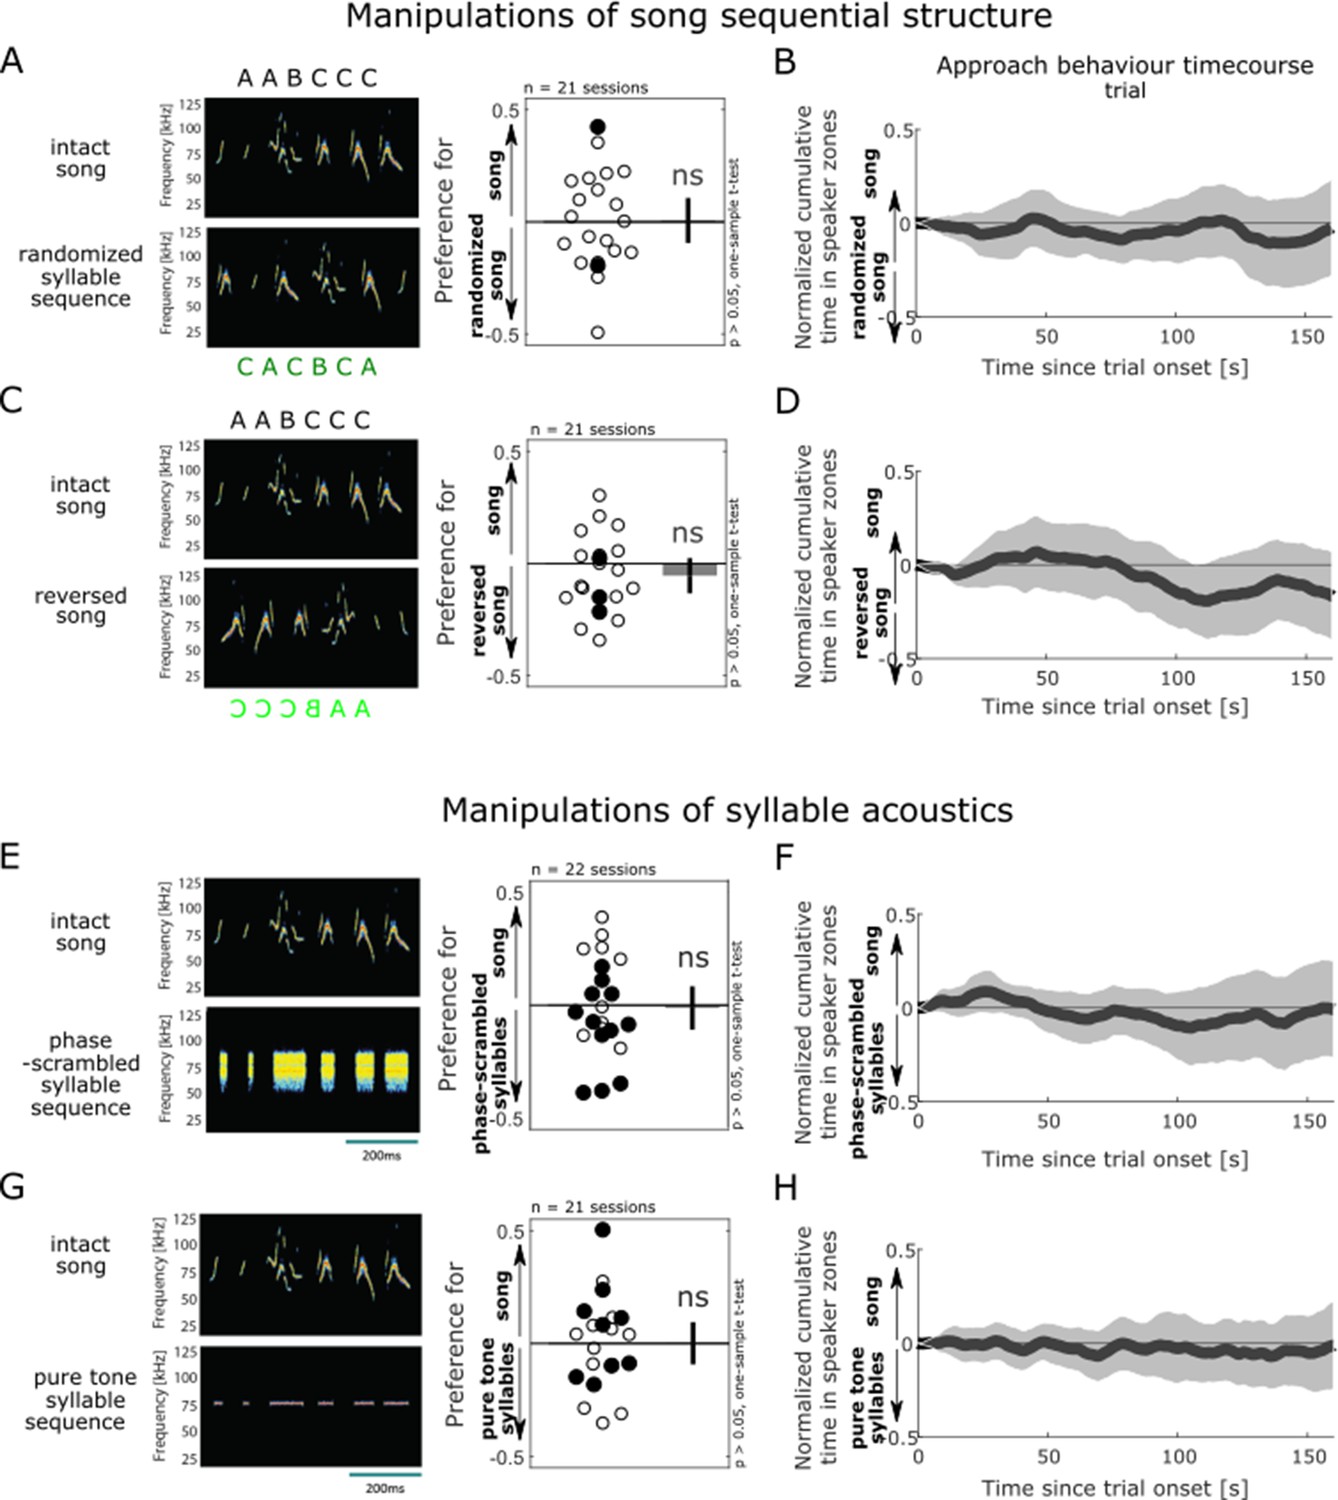
Female approach behaviour is not affected by changes to global song structure or the removal of syllable spectro-temporal dynamics.
(A) Female approach behaviour during simultaneous playback of intact male songs (top) and corresponding randomised syllable sequences (bottom), displayed as in Figure 2H. Each circle is the preference index displayed by individual animals in one behavioural session (median of four sound presentation trials). Open circles indicate sound playback at 58 dB SPL, filled circles at 68 dB SPL. Bar plot shows mean preference index across sessions, and error bar show 95% confidence interval (CI). One-sample two-tailed t-test, ns: non-significant, p>0.05. (B) Population time course of approach behaviour during the playback of intact (positively weighted) vs randomised songs (negatively weighted), displayed as in Figure 2K. The dark grey trace indicates the population mean of trial-based temporal profiles across all sessions (n = 21 sessions). For each session, the median of four sound presentation trials (e.g. black trace in J) was normalised to the absolute value of its maximal amplitude. At no time bins during the course of a sound playback trial did the cumulative approach behaviour significantly deviate from zero (one-sample two-tailed t-test, all p>0.05). (C) Playback of intact songs (top) contrasted with temporally reversed songs (bottom). (D) Typical time course of approach behaviour during the playback of intact (positively weighted) vs reversed songs (negatively weighted). (E) Playback of intact songs (top) and sequences of phase-scrambled syllables (bottom). (F) Typical time course of approach behaviour during the playback of intact (positively weighted) vs phase-scrambled syllable sequences (negatively weighted). (G) Playback of intact songs (top) contrasted with sequences of pure tones (bottom). (H) Typical time course of approach behaviour during the playback of intact (positively weighted) vs pure tone sequences (negatively weighted).
Figure 3—figure supplement 1
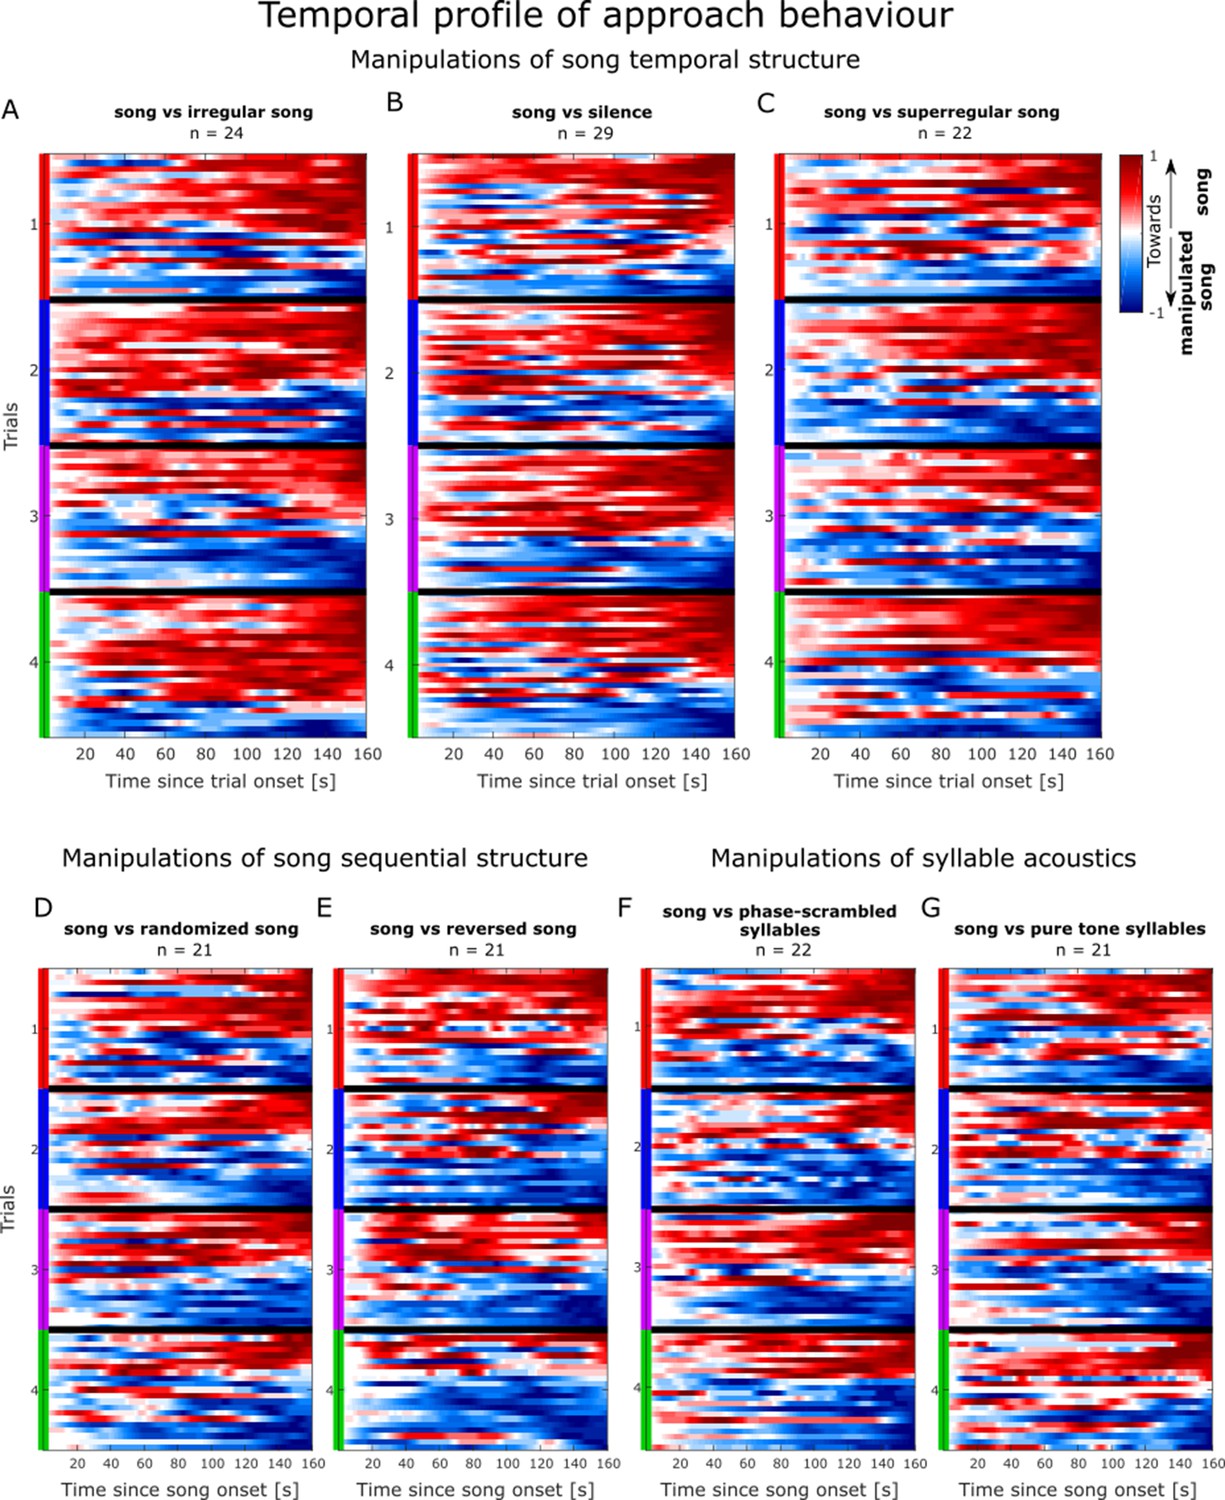
Trial-based temporal profiles of approach behaviour.
(A) Time course of approach behaviour during one presentation of intact (positively weighted) vs temporally irregular (negatively weighted) mouse song (see Figure 2E), grouped by sound presentation trial (coloured bars), for each behavioural session (n = 24, y-axis). Each trial’s trace was normalised to the absolute value of its maximal amplitude. Within a trial, sessions are ordered by the amplitude of their last element. (B) Time course of approach behaviour during one presentation of intact mouse songs (positively weighted) vs silence (negatively weighted). (C) Time course of approach behaviour during one presentation of intact (positively weighted) vs temporally super-regular (negatively weighted) mouse song. (D) Time course of approach behaviour during one presentation of intact mouse song (positively weighted) vs sequences of randomly ordered syllables (negatively weighted). (E) Time course of approach behaviour during one presentation of intact (positively weighted) vs reversed (negatively weighted) mouse song. (F) Time course of approach behaviour during one presentation of intact mouse songs (positively weighted) vs sequences of phase-scrambled syllables (negatively weighted). (G) Time course of approach behaviour during one presentation of intact mouse songs (positively weighted) vs sequences of pure-tone approximation of syllables (negatively weighted).
Figure 4
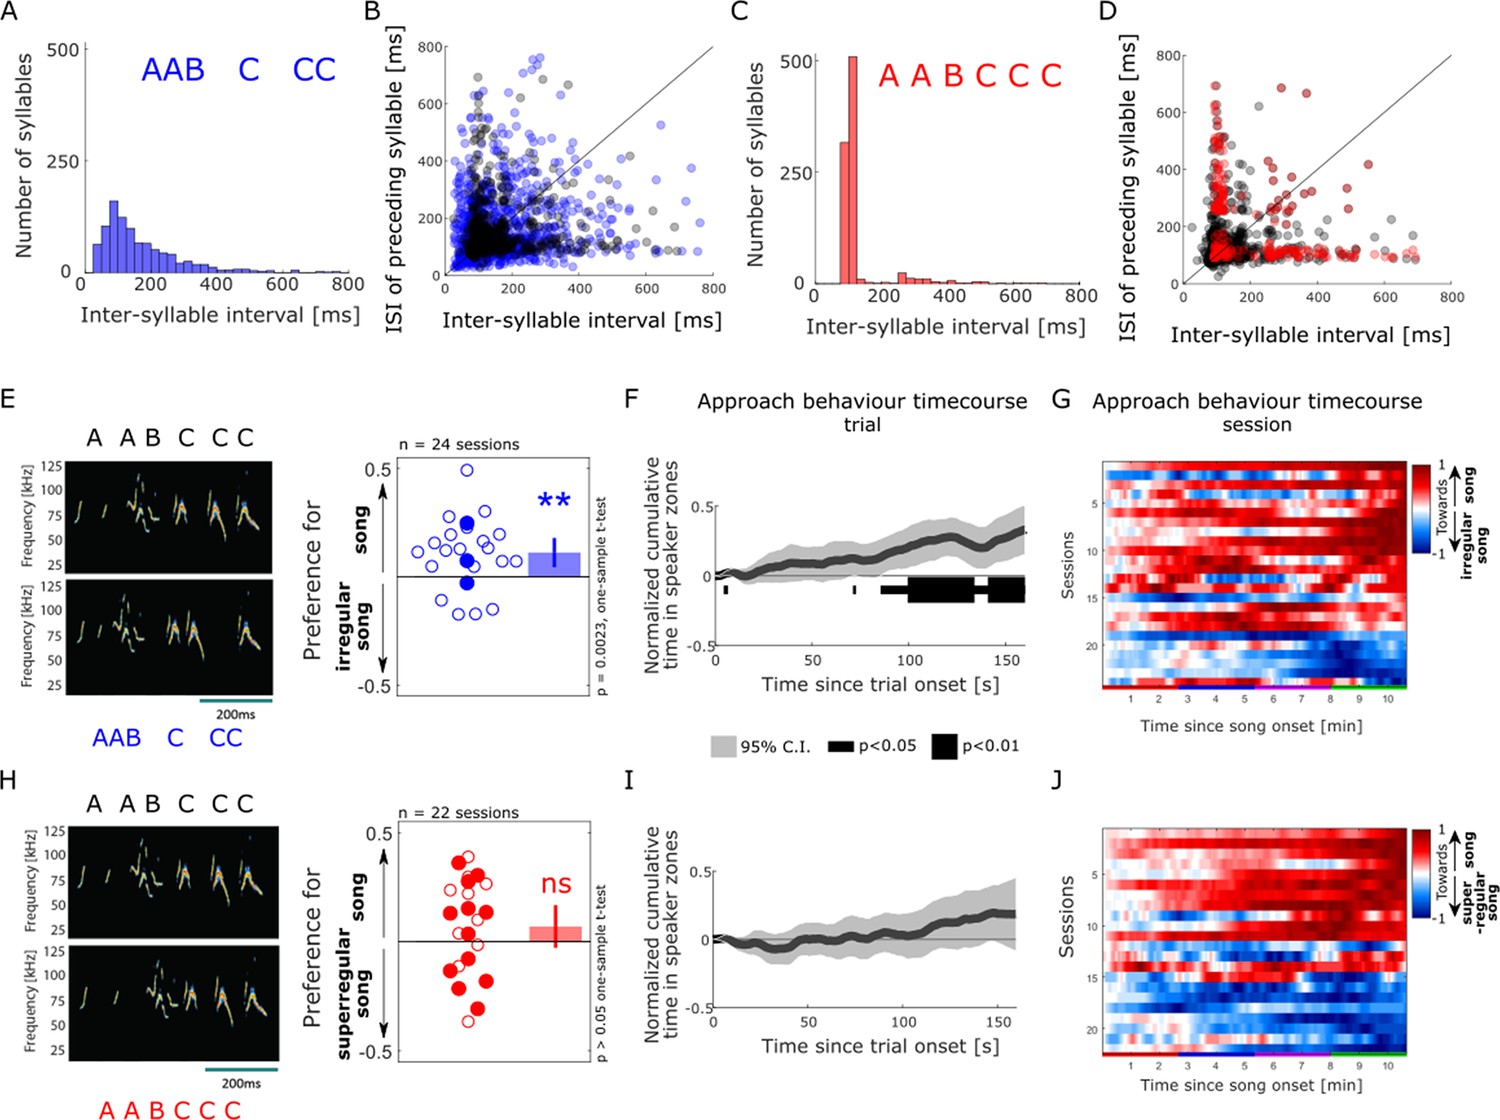
Female approach behaviour is sensitive to disruption of courtship temporal regularity.
(A) Distribution of inter-syllable interval (ISI) durations across the set of temporally irregular songs, calculated as in Figure 1D. (B) Sequential relationships of ISI durations in the intact (shaded grey dots) and temporally irregular (shaded blue dots). (C) Distribution of ISI durations across the super-regular song set. (D) Sequential relationship of ISI durations in the intact (shaded grey dots) and super-regular (shaded red dots). (A–D) n = 957 syllables. (E) Female approach behaviour during simultaneous playback of intact male songs (top) and temporally irregular songs (bottom), displayed as in Figure 2H. Each circle indicates the preference index displayed by individual animals in one behavioural session (median of four sound presentation trials). Open circles: sound playback at 58 dB SPL, filled circles: 68 dB SPL. One-sample two-tailed t-test. **p<0.01, ns: non-significant, p>0.05. Bar plots show means, and error bars show 95% CI. (F) Population-averaged time course of approach behaviour in response to intact (positively weighted) vs temporally irregular (negatively weighted) mouse songs, displayed as in Figure 2K. The dark grey trace indicates the mean of normalised, trial-based temporal profiles across all sessions (n = 24). The black bar indicates time bins in which the cumulative approach behaviour significantly deviates from zero (one-sample two-tailed t-test). (G) Temporal profiles of approach behaviour to intact vs temporally irregular songs over the course of four sound presentation trials (x-axis, coloured bars) for each of the behavioural sessions (y-axis. n=24), displayed as in Figure 2L. (H) Female approach behaviour during simultaneous playback of intact songs (top) and temporally super-regular songs (bottom), displayed as in panel (E). (I) Population time course of approach behaviour to intact (positively weighted) vs temporally super-regular (negatively weighted) mouse songs, displayed as in panel (F). (J) Temporal profiles of approach behaviour to intact vs temporally super-regular songs over the course of four sound presentation trials, displayed as in panel (G).
Additional files
-
MDAR checklist
- https://cdn.elifesciences.org/articles/86464/elife-86464-mdarchecklist1-v1.pdf
-
Supplementary file 1
Example of intact song – from top panel in Figure 3A.
- https://cdn.elifesciences.org/articles/86464/elife-86464-supp1-v1.zip
-
Supplementary file 2
Example of randomised song – from bottom panel in Figure 3A.
- https://cdn.elifesciences.org/articles/86464/elife-86464-supp2-v1.zip
-
Supplementary file 3
Example of reversed song – from bottom panel in Figure 3C.
- https://cdn.elifesciences.org/articles/86464/elife-86464-supp3-v1.zip
-
Supplementary file 4
Example of phase-scrambled song – from bottom panel in Figure 3E.
- https://cdn.elifesciences.org/articles/86464/elife-86464-supp4-v1.zip
-
Supplementary file 5
Example of pure tone syllables – from bottom panel in Figure 3G.
- https://cdn.elifesciences.org/articles/86464/elife-86464-supp5-v1.zip
-
Supplementary file 6
Example of irregular song – from bottom panel in Figure 4E.
- https://cdn.elifesciences.org/articles/86464/elife-86464-supp6-v1.zip
-
Supplementary file 7
Example of super-regular song – from bottom panel in Figure 4H.
- https://cdn.elifesciences.org/articles/86464/elife-86464-supp7-v1.zip
Download links
A two-part list of links to download the article, or parts of the article, in various formats.
Downloads (link to download the article as PDF)
Open citations (links to open the citations from this article in various online reference manager services)
Cite this article (links to download the citations from this article in formats compatible with various reference manager tools)
Courtship behaviour reveals temporal regularity is a critical social cue in mouse communication
eLife 12:RP86464.
https://doi.org/10.7554/eLife.86464.2


