Agonist efficiency links binding and gating in a nicotinic receptor
- Department of Physiology and Biophysics, University at Buffalo, State University of New York, United States
Figures
Figure 1
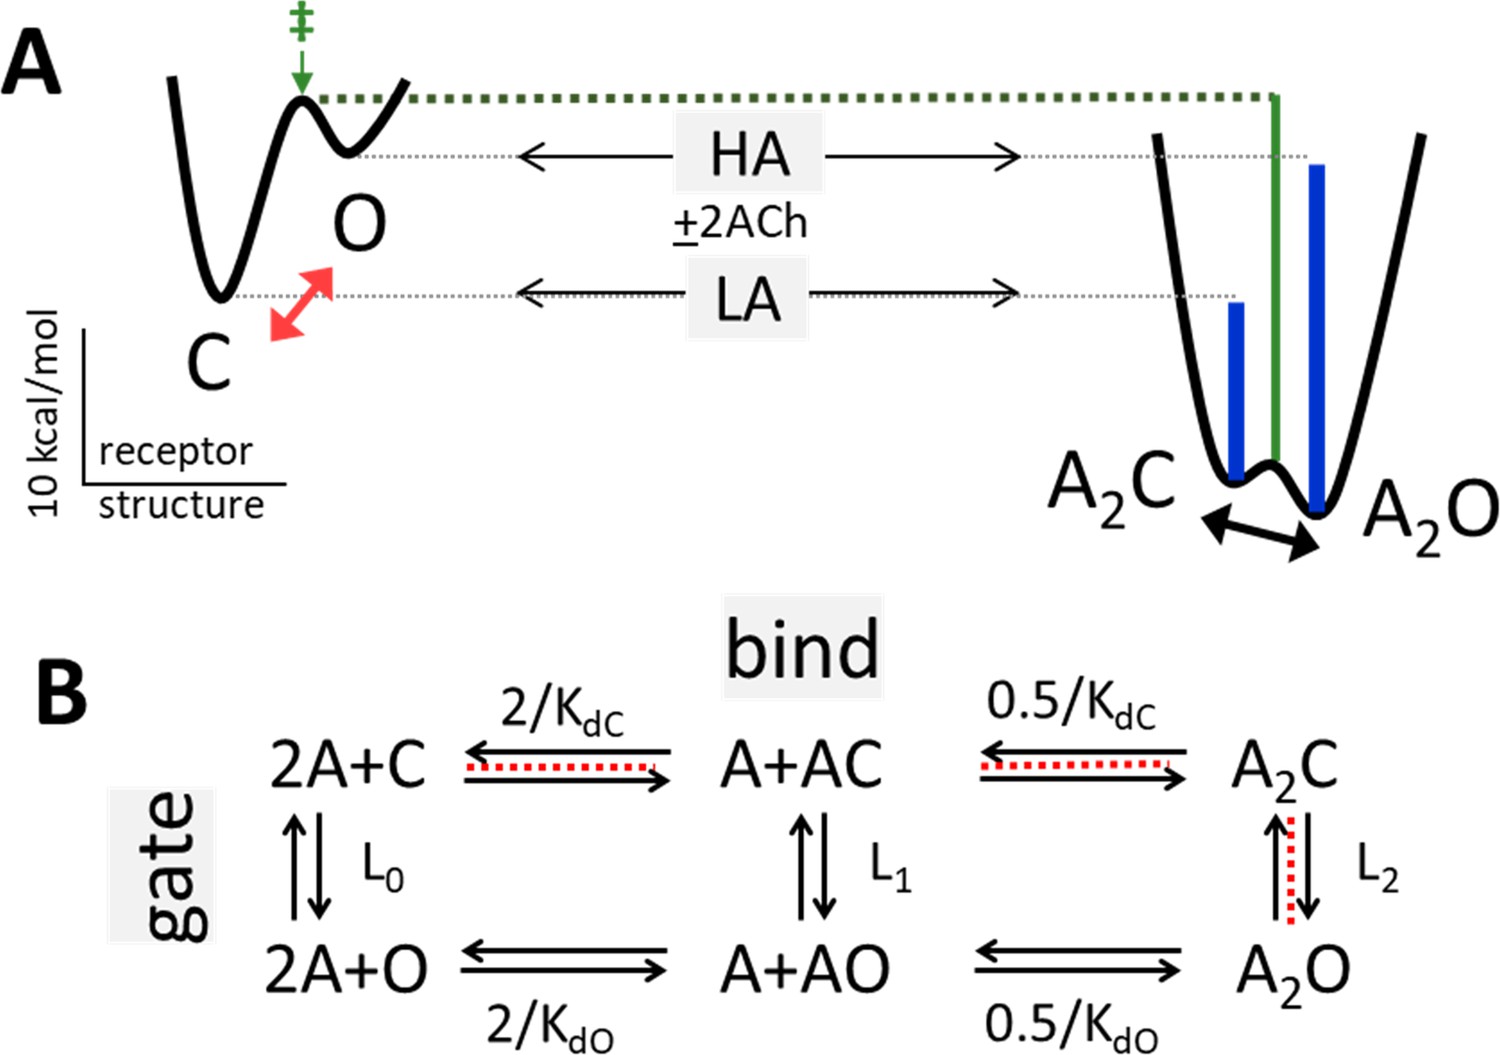
Bind and gate.
(A) Potential energy surfaces (landscapes) for receptor activation without (left) and with (right) bound agonists (A). C, closed channel and low affinity (LA); O, open channel and high affinity (HA). Red, without agonists intrinsic C→O gating is uphill; blue lines, agonists increase PO because they bind more favorably to O; green, agonists also stabilize the gating transition state (‡) to increase the opening rate constant because the LA→HA induced fit (‘hold’, Figure 2) occurs at the start of the gating conformational change. Calibration: ACh, adult-type AChRs, –100 mV, 23 °C. (B) Corresponding reaction scheme (2 equivalent and independent neurotransmitter sites). Horizontal, ligand-protein complex formation; KdC and KdO, LA and HA equilibrium dissociation constants to C and O. Vertical, global conformational change; Ln, gating equilibrium constant with n bound agonists. Red dashed line, pathway that determines the CRC when L0 is negligible (Equation 4a, Equation 4b, Equation 4c, Equation 4d, Methods).
Figure 2 with 1 supplement
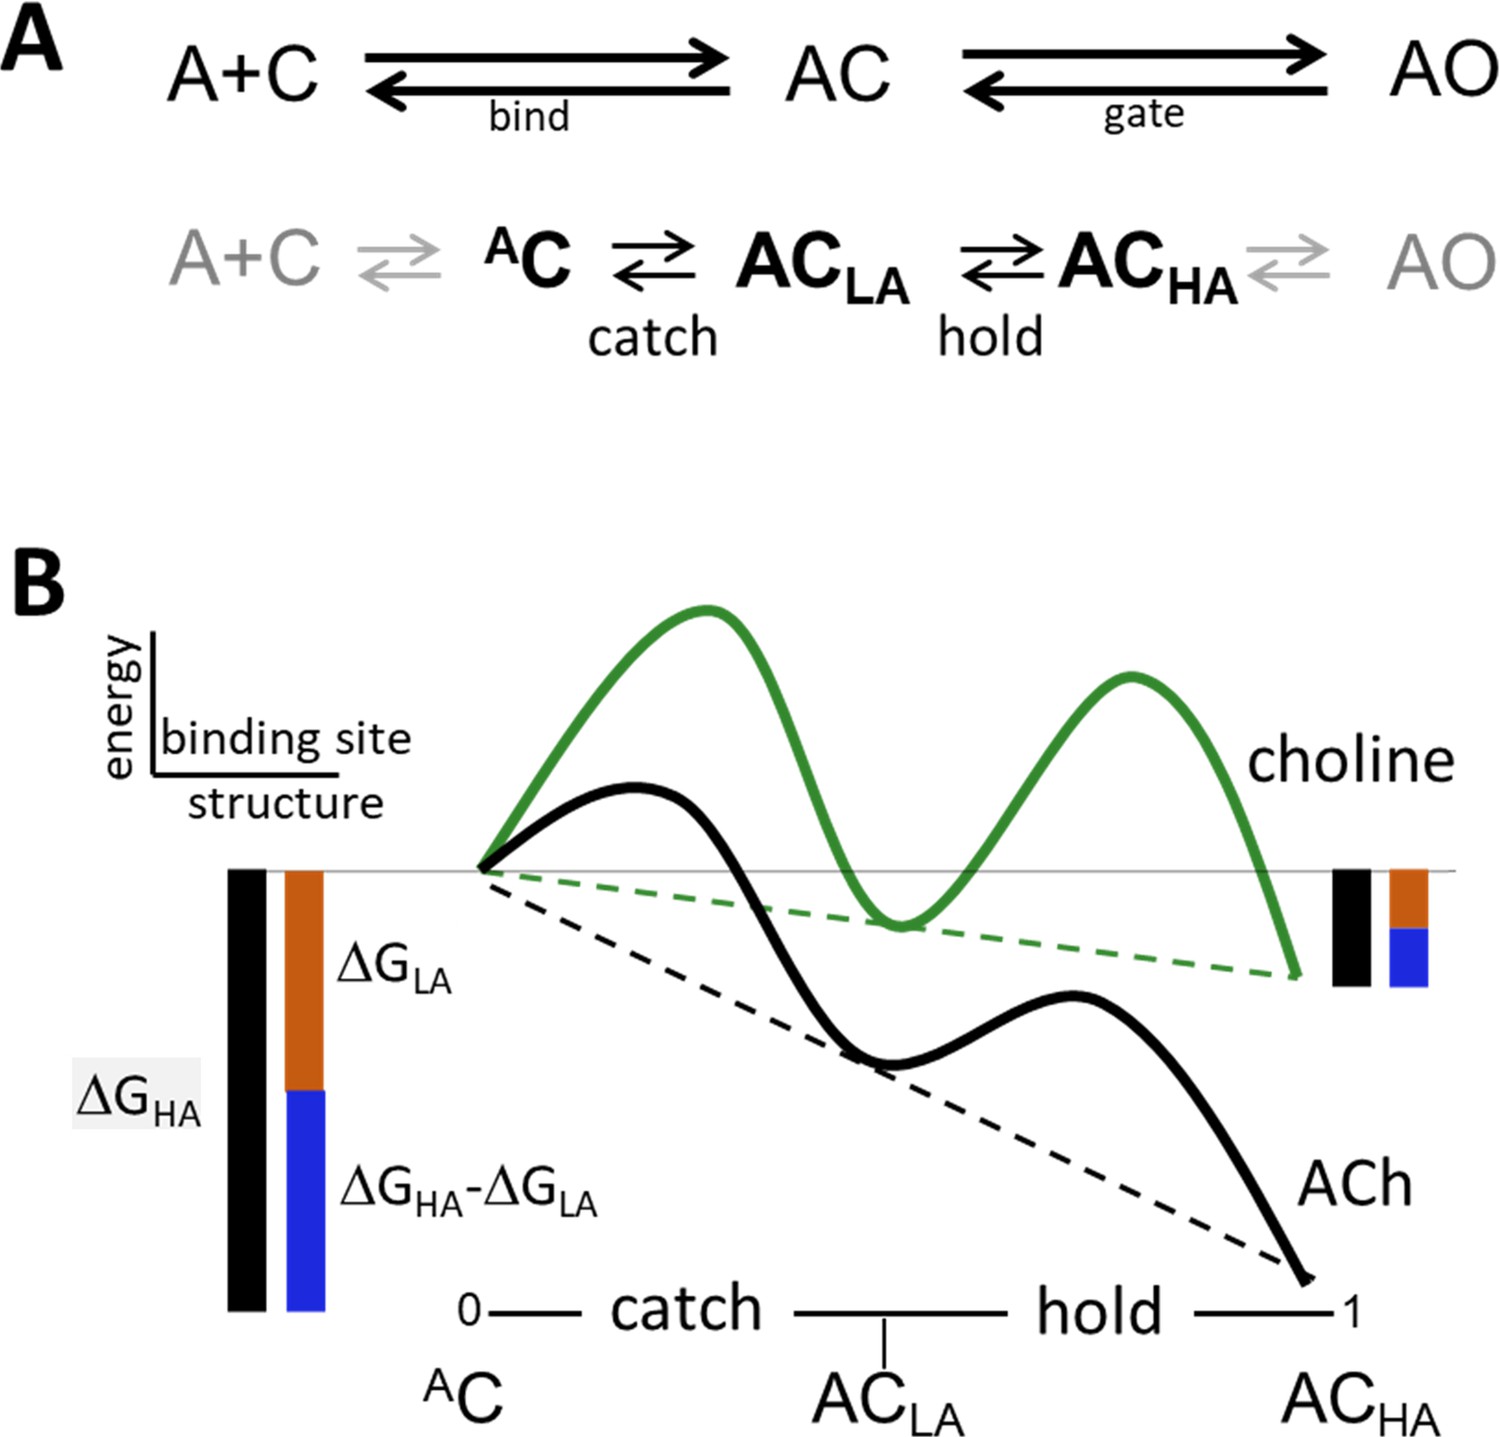
Catch and hold.
(A) Bind and gate. Top, as one-step reactions. Bottom, as composite reactions. The main undetected intermediate states are AC, the encounter complex (inside bind) and ACHA, a high affinity and closed channel state (inside gate). Black, the 2 agonist-dependent induced fit rearrangements are called catch (AC⇄ACLA) and hold (ACLA⇄ACHA). Gray, diffusion (A+C⇄AC) and receptor conformation changes in other domains (ACHA⇄AO) are approximately agonist-independent (see Figure 2—figure supplement 1). (B) Catch-and-hold free energy landscape. An η class indicates that catch and hold are linked in a linear free energy relationship (LFER; dashed lines) (Howard, 2001). Green, weak agonist; black, strong agonist. Ligand binding energy ‘tilts’ the entire landscape to the total extent ΔGHA (black side bars). For relative agonist actions, the energy change in catch (brown) determines KdC and the energy change in hold (blue) determines the coupling constant. η is the fraction of the total applied to hold (blue/black) and η is the fraction apllied to catch (brown/black). Agonist affinity and efficacy differ substantially, but η is constant and depends only on the left-right position of ACLA in the reaction.
Figure 2—figure supplement 1
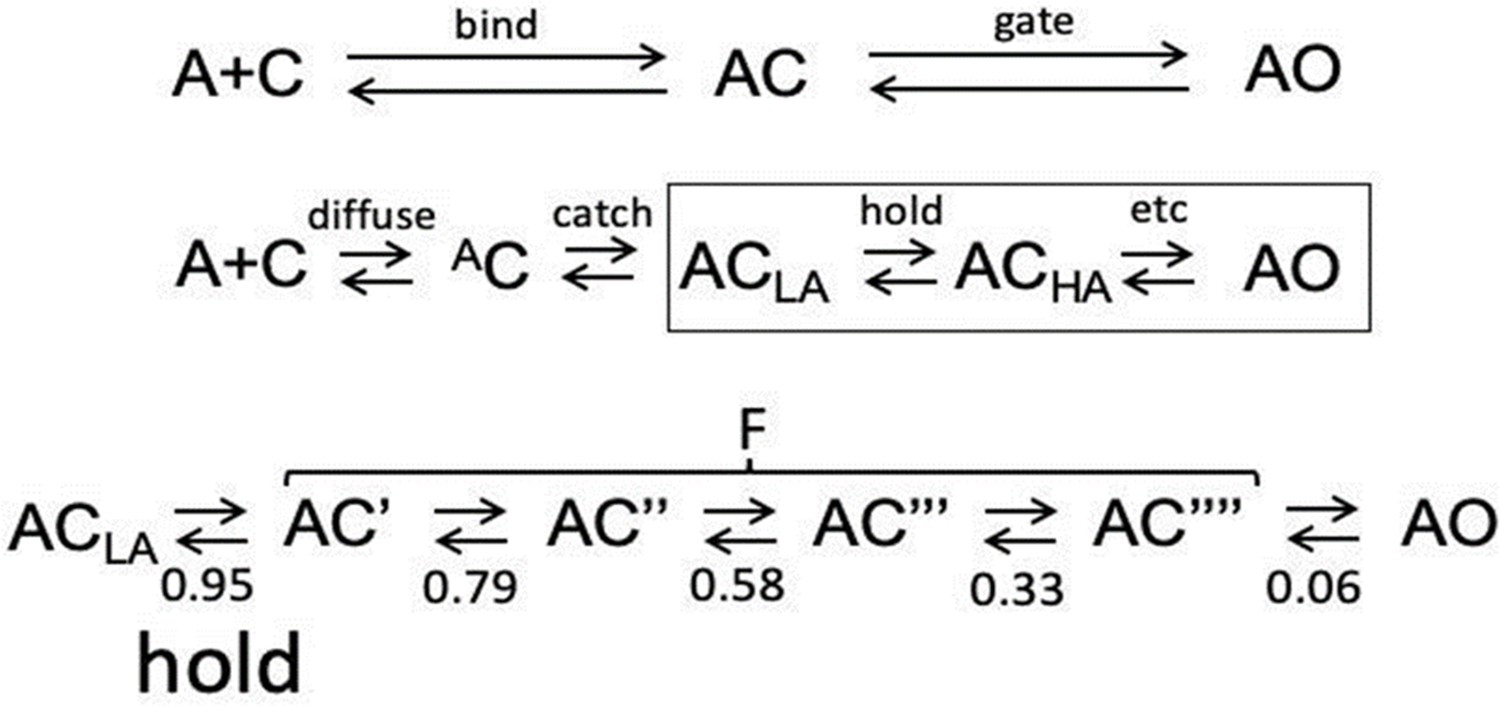
Inside bind and gate.
See Figure 1B for 2 equivalent sites. LA, low affinity; HA, high affinity. (Top). Standard activation scheme; bind and gate transitions bracket AC (a LA closed state, Delcastillo, et al., 1957). In gate, both channel conductance and binding site affinity increase (ACLA⇄AOHA). Middle. Expanded activation scheme showing undetected intermediates inside bind and gate. In bind, the agonist arrives at the target by diffusion (diffuse) and forms an ultra-LA AC encounter complex, followed by the first stage of the induced fit (catch1) that forms ACLA. In gate (boxed), the second stage of the rearrangement (hold) forms ACHA, followed by additional rearrangements in distant domains (etc) that eventually lead to AOHA. Experimental KdC and KdO values are dominated by energy changes in the two stages of the induced fit. Bottom. Expansion of gating. The distribution of Φ values2 suggests that the global isomerization involves passage through 4 short-lived (~100 ns) CHA states (denoted with ‘) associated with sequential rearrangements of the ECD (twist), TMD (tilt) and gate region (dilation), followed by pore water/membrane movements to allow ion transit (pop); Φ value given below each transition (Purohit et al., 2013; Gupta et al., 2017). The only agonist dependent rearrangements are catch (AC⇄ACLA; ΔGLA) and hold (ACLA⇄AC’; DGHA-ΔGLA), stages of the induced fit linked in a LFER (Figure 2). Together, sojourns in the ensemble of CHA states appear in single-channel currents as a brief gap (F for ‘flip’) (Auerbach, 1993; Lape et al., 2008; Mukhtasimova et al., 2005; Shi et al., 2023). The longitudinally-decreasing, coarse gradient in Φ suggests that the channel-opening gating transition is a conformational cascade (‘wave’) that propagates from the agonist to the gate, block-wise (Grosman et al., 2000), perhaps as an extended LFER. To emphasize that in AChRs binding ispart of gating, we show that a CRC and synaptic decay time constant can be calculated from the agonist association rate constant, kon to C (catch) if η and L0 are known a priori. (A) CRC. For many agonists, koff,C ~15,000 s–1 (Jadey and Auerbach, 2012). Calculate (i) KdC~1.5 × 10⁴ s–1/kon,C, (ii) KdO (Equation 2), (iii) L2 (Equation 1) and (iv) POmax and EC50 (Equation 4a, Equation 4b, Equation 4c, Equation 4d). For example, η=0.5 and L0=7.4 × 10⁻⁷ (at Vm=-100 mV). ACh: measure kon,C=108 M–1s–1, calculate KdC = 150 μM, KdO = 22 nM, L2=33, POmax = 0.97 and EC50=31 μM. Choline: measure konC = 5 × 10⁶ M–1s–1, calculate KdC = 3 mM, KdO = 9 μM, L2=0.08, POmax = 0.08 and EC50=6.8 mM. The procedure can be reversed (konC can be estimated from a CRC). (B) Synaptic decay time constant (τ). In adult-type AChRs the diliganded channel-closing rate constant (b2) for many agonists is ~2500 s–1 (–100 mV and 23 °C) (Grosman et al., 2000). τ~0.4 (1+f2/2*koff), where f2 is the diliganded opening rate constant, f2=L2*2500 s–1. Using the above kon,C for ACh yields τ=1.5ms. That the agonist’s association rate constant can approximate POmax, EC50 and τ demonstrates the entanglement between binding and gating. Unlike diffusion, natural selection can adjust the catch ‘induced fit’ (kon,C) to fine tune physiological responses.
1Experimental evidence for catch in AChRs: kon to C is (i) slower than the limit set by diffusion, (ii) correlated with agonist potency rather than diffusion constant, (iii) slower than kon to O that is approximately diffusional (Nayak and Auerbach, 2017)3 and (iv) for choline highly temperature dependent (Gupta et al., 2017). Evidence that the hold stage of the induced fit occurs at the start of the global isomerization is that (i) Φ~0.95 for agonists and binding site residues (Purohit et al., 2013) (see below), and (ii) agonists increase the channel-opening rate constant (the affinity increase occurs before the transition state; Figure 1A).
2 Φ is log f2/log L2 for a series of perturbations and reports the free energy change of the perturbed location at the gating transition state (relative to A2O). In AChRs, a longitudinal, blocky, decreasing gradient in Φ (neurotransmitter site to gate) suggests the allosteric transition is a cascade of discrete domain rearrangements that connects A2C and A2O (Auerbach, 2005). Although Φ values sequence (1–0, early to late) and locate gating rearrangements, they do not provide temporal information or quantify energy coupling between domains.
3 The barrier that prevents agonists from forming ACLA by diffusioserves a purpose. In AChRs, kon,C correlates with agonist potency (Jadey and Auerbach, 2012; Jadey et al., 2011; Nayak and Auerbach, 2017), so the weak-agonist choline (present at the synapse at a high concentration) that would otherwise interfere with signaling is excluded from the pocket, preventing competitive antagonism. Extracellular cations compete with agonists to slow kon,C (Cs+>K+>Na+>Li+) (Akk and Auerbach, 1996), and the mutation εE184Q eliminates this competition (Akk et al., 1999). We hypothesize that the ions and agonist compete at the encounter complex site (for instance, K++C⇄KC) rather that the aromatic pocket. Agonist occupancy of the ultra-low-affinity AC binding site triggers the catch-and hold rearrangement.
Figure 3 with 1 supplement
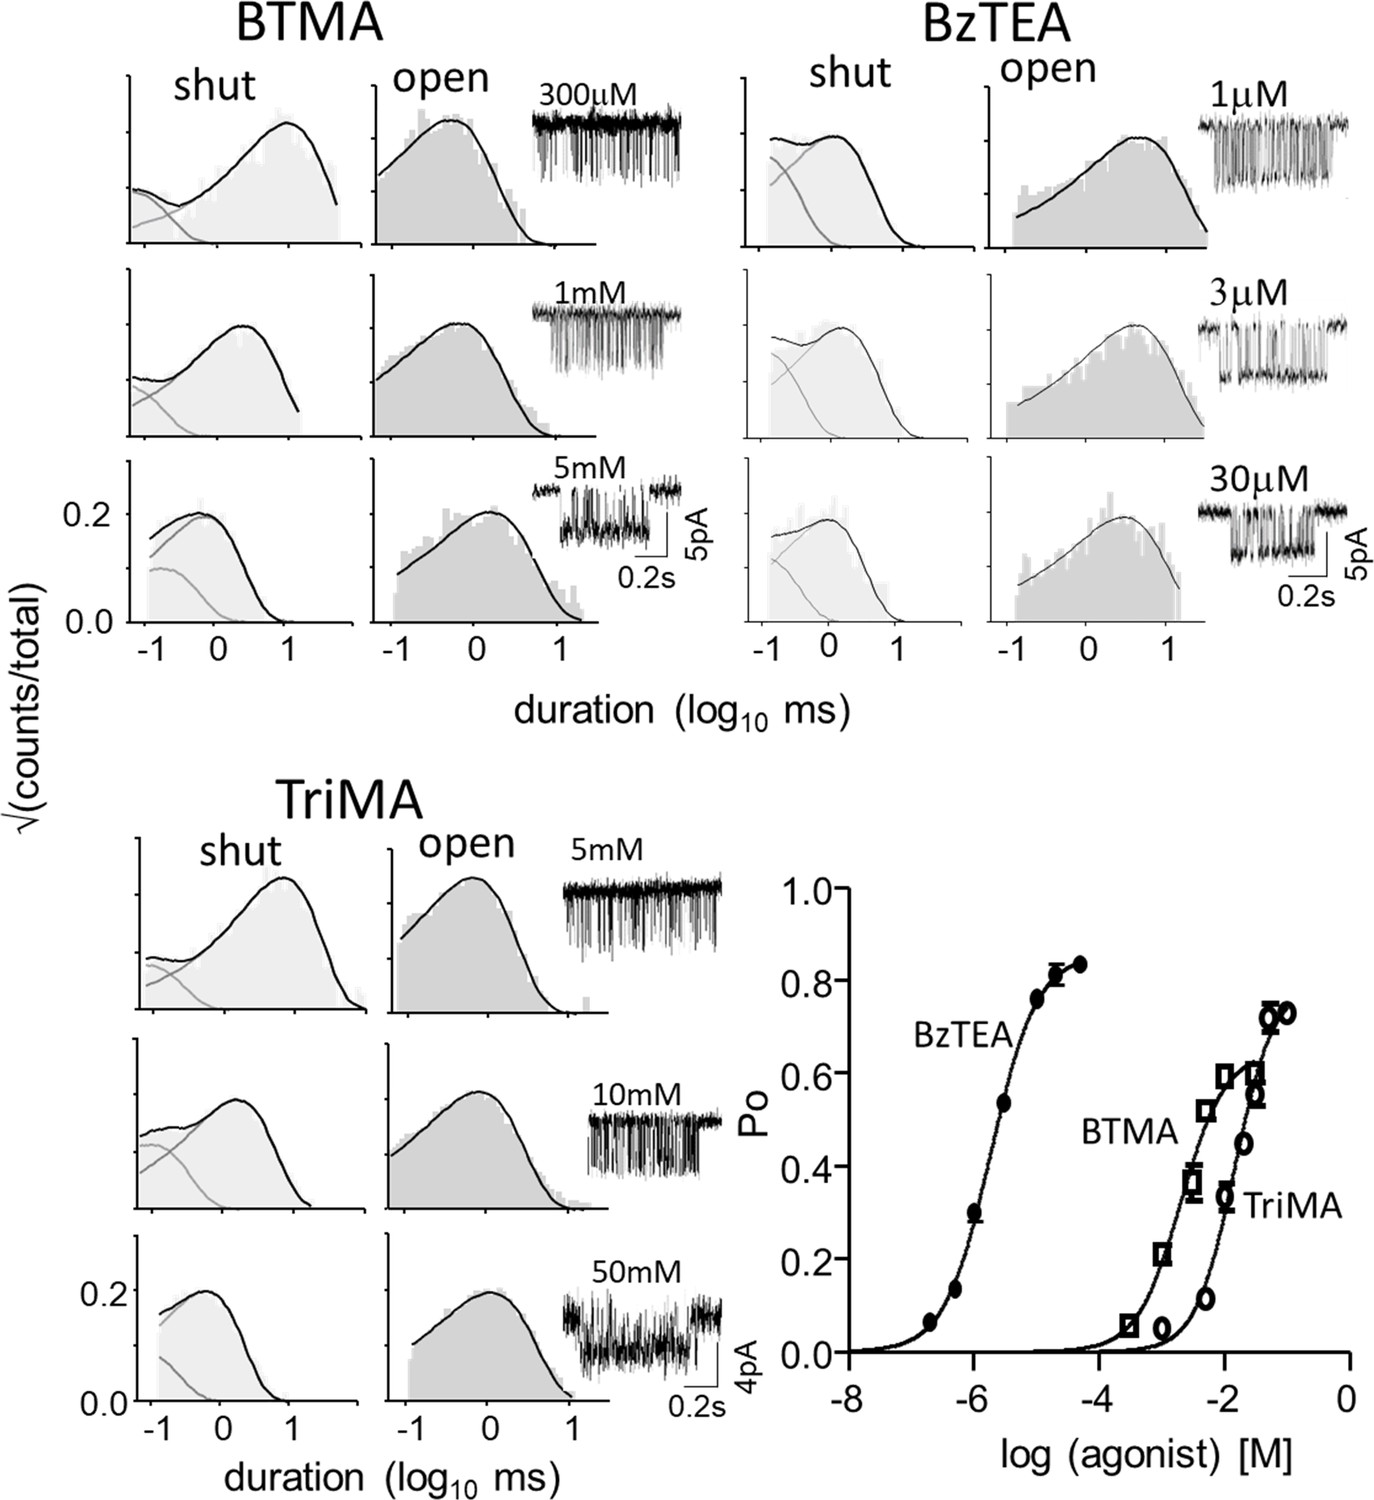
Measuring η.
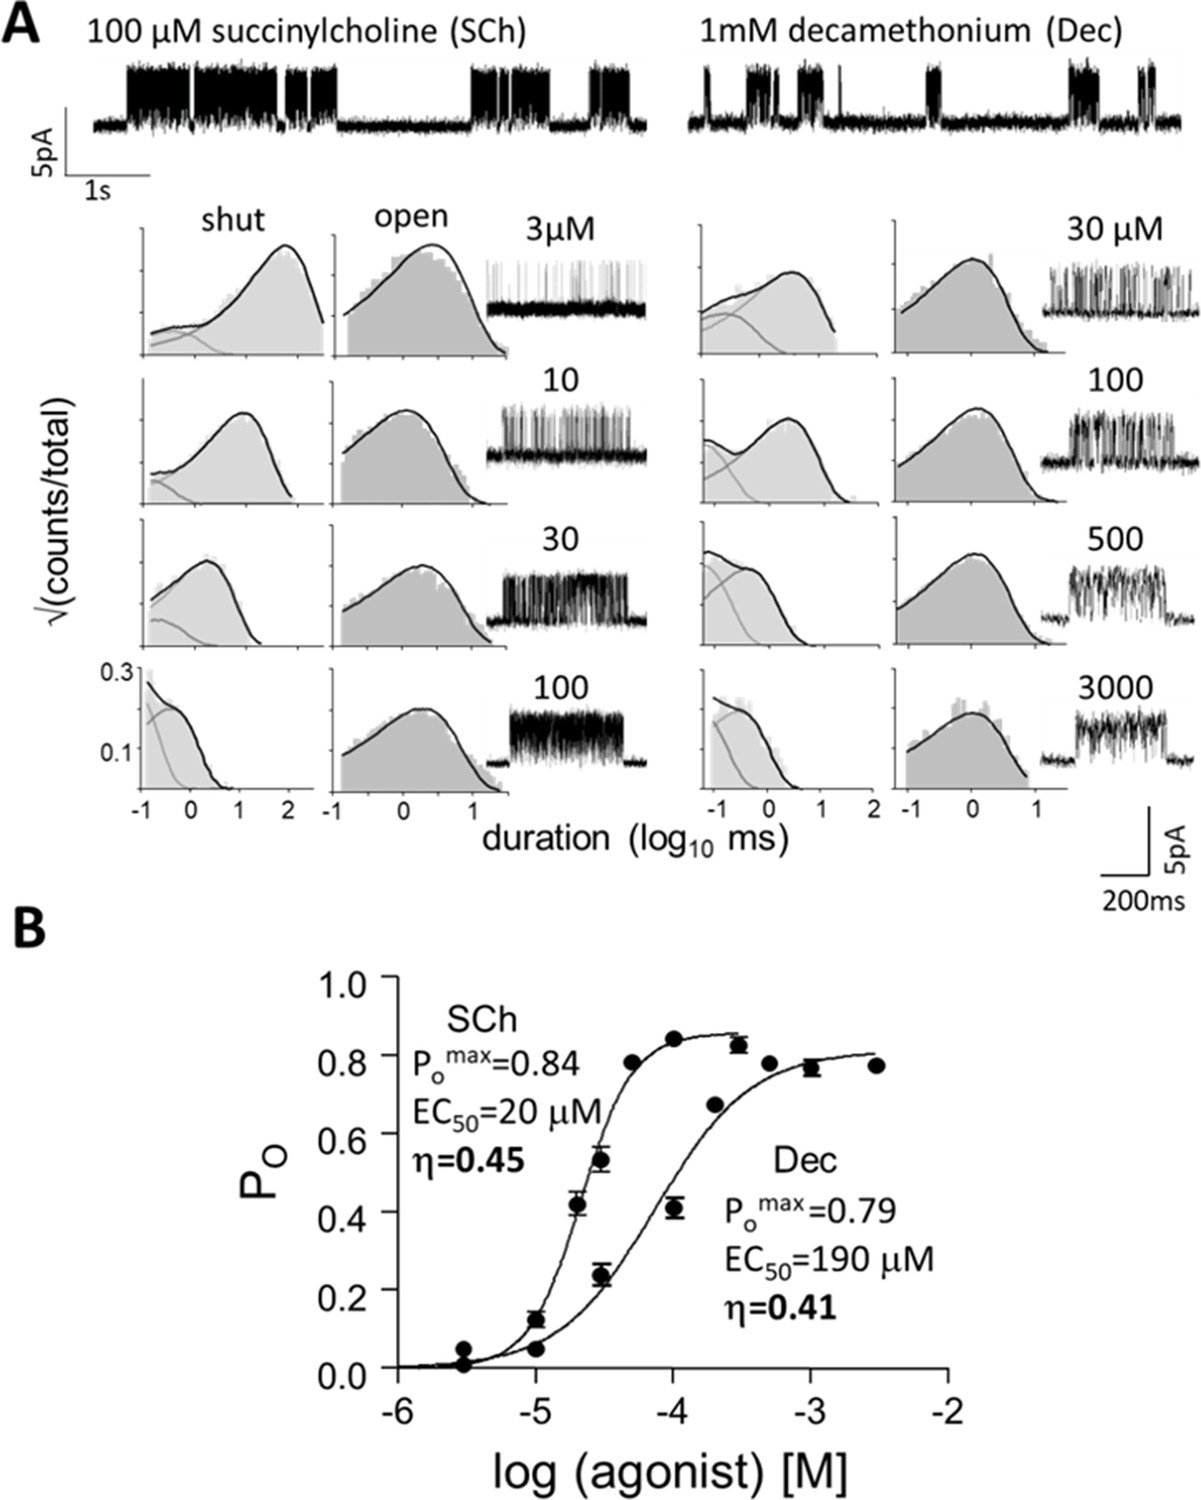
(A) Top, single-channel current traces, low time-resolution (Vm = +70 mV; O is up). Clusters of openings are bind-and-gate (Figure 1B); silent periods between clusters are desensitized. Bottom, example clusters and intra-cluster interval duration histograms. PO was calculated at each [agonist] from shut- and open-interval time constants. (B) CRCs. PO values were fitted to estimate POmax and EC50 from which KdC and KdO were calculated (Equation 4a, Equation 4b, Equation 4c, Equation 4d, Materials and methods) (Table 1). The logs of these constants are proportional to ΔGLA and ΔGHA, the ratio of which gives η (Equation 2). The profile for SCh is relatively left-shifted because this agonist is ~10% more efficient than Dec. Symbols are mean ± sem (Table 1; see Figure 3—figure supplement 1 for other agonists). The background mutation εS450W compensates for the effects of depolarization on the gating rate constants (see Materials and methods).
Figure 3—figure supplement 1
CRCs.
Figure 4
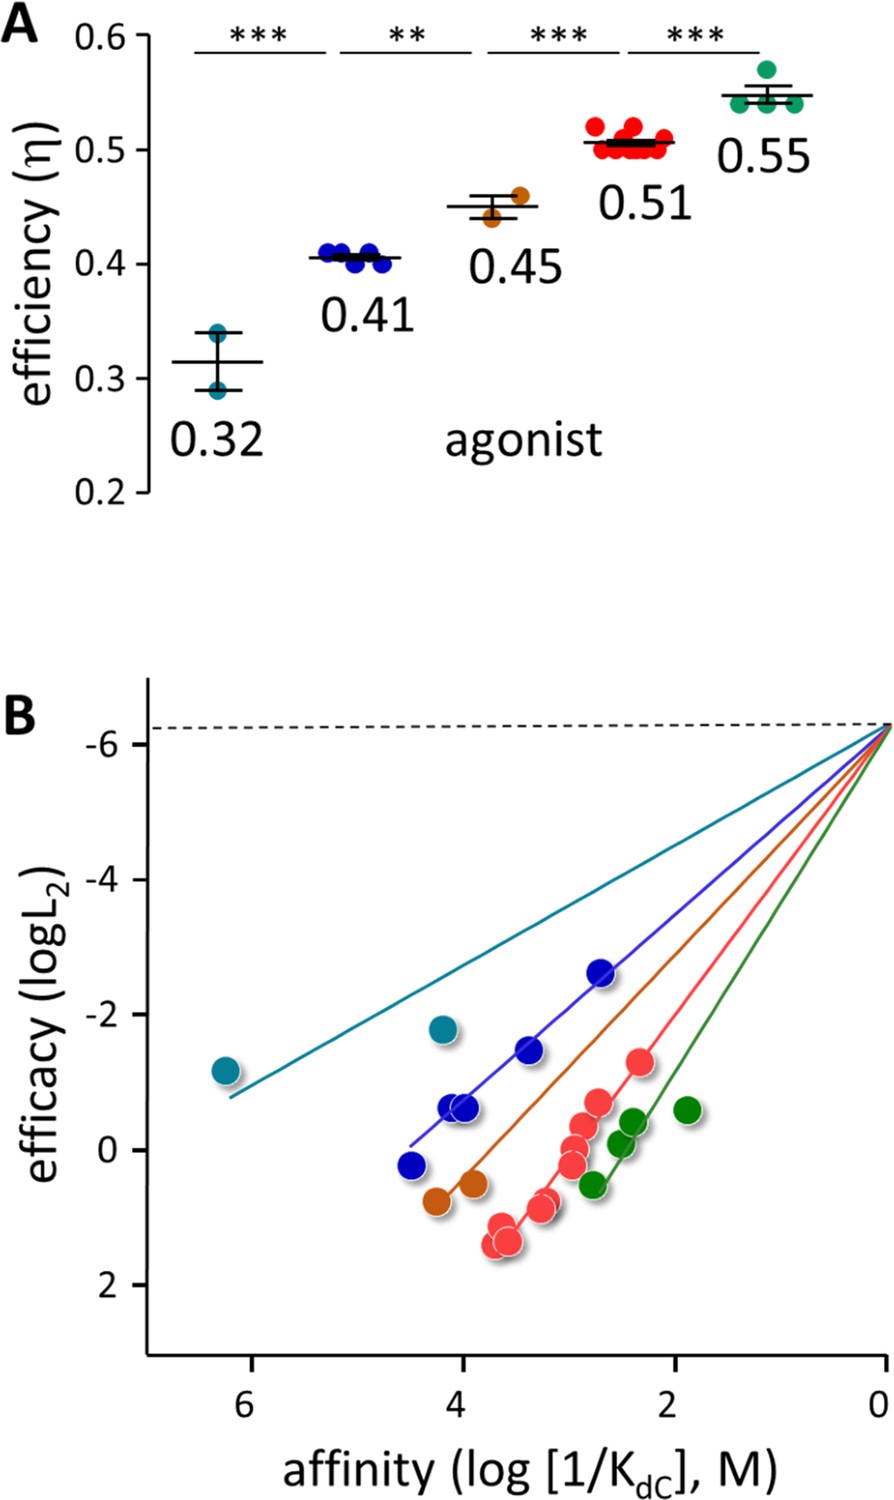
Agonist h values.
(A) Each symbol represents the average η value of one agonist, calculated from CRCs (Table 1, Table 1—source data 1). The x-means algorithm was used to separate the agonists into 5 η classes (mean, vertical bars are ± sd). (B) Efficiency plots. Each color group was fitted by a straight line (Equation 3) with L0=5.2 × 10⁻⁷ (sd of each point smaller than the symbol). η values calculated from the slopes are the same as in panel A. x- and y-axes are proportional to the agonist’s free energy changes in catch (ΔGLA) and hold (ΔGHA-ΔGLA) induced fits (Figure 2B).
Figure 5
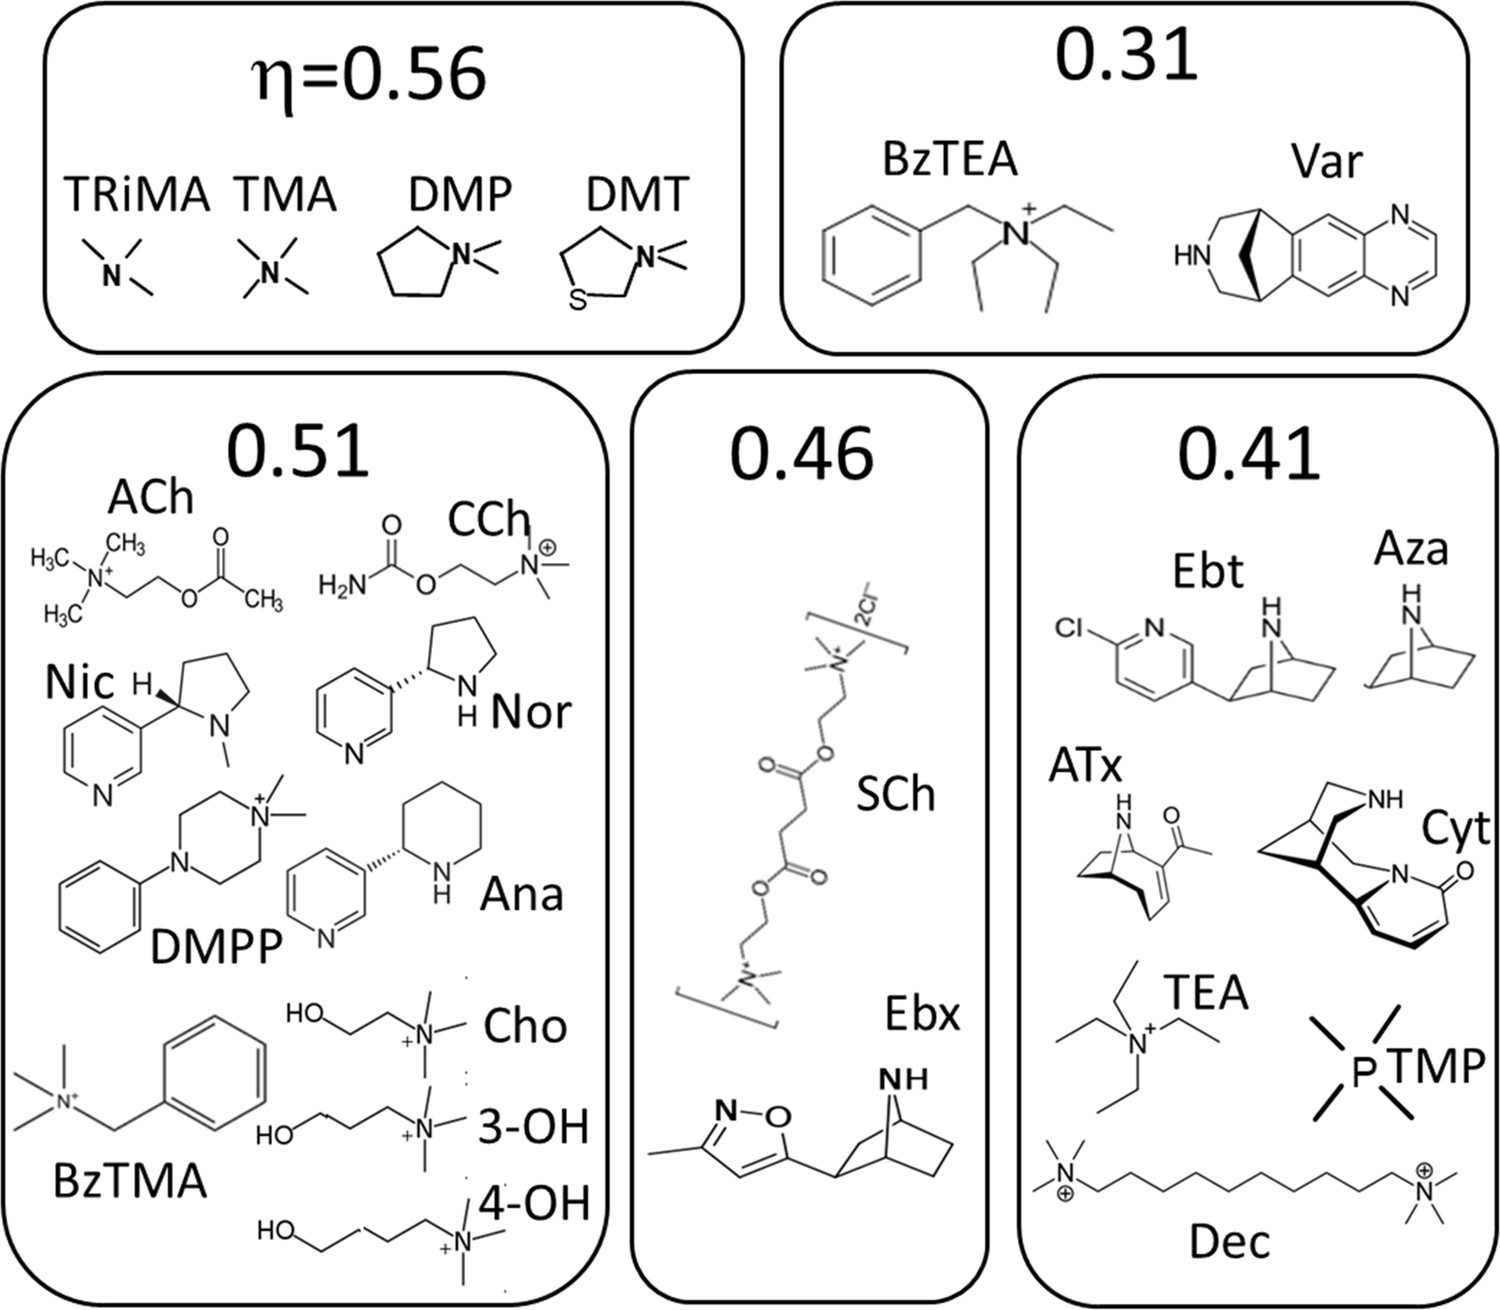
Agonists grouped by η class (Figure 4).
See Materials and methods for abbreviations.
Figure 6 with 2 supplements
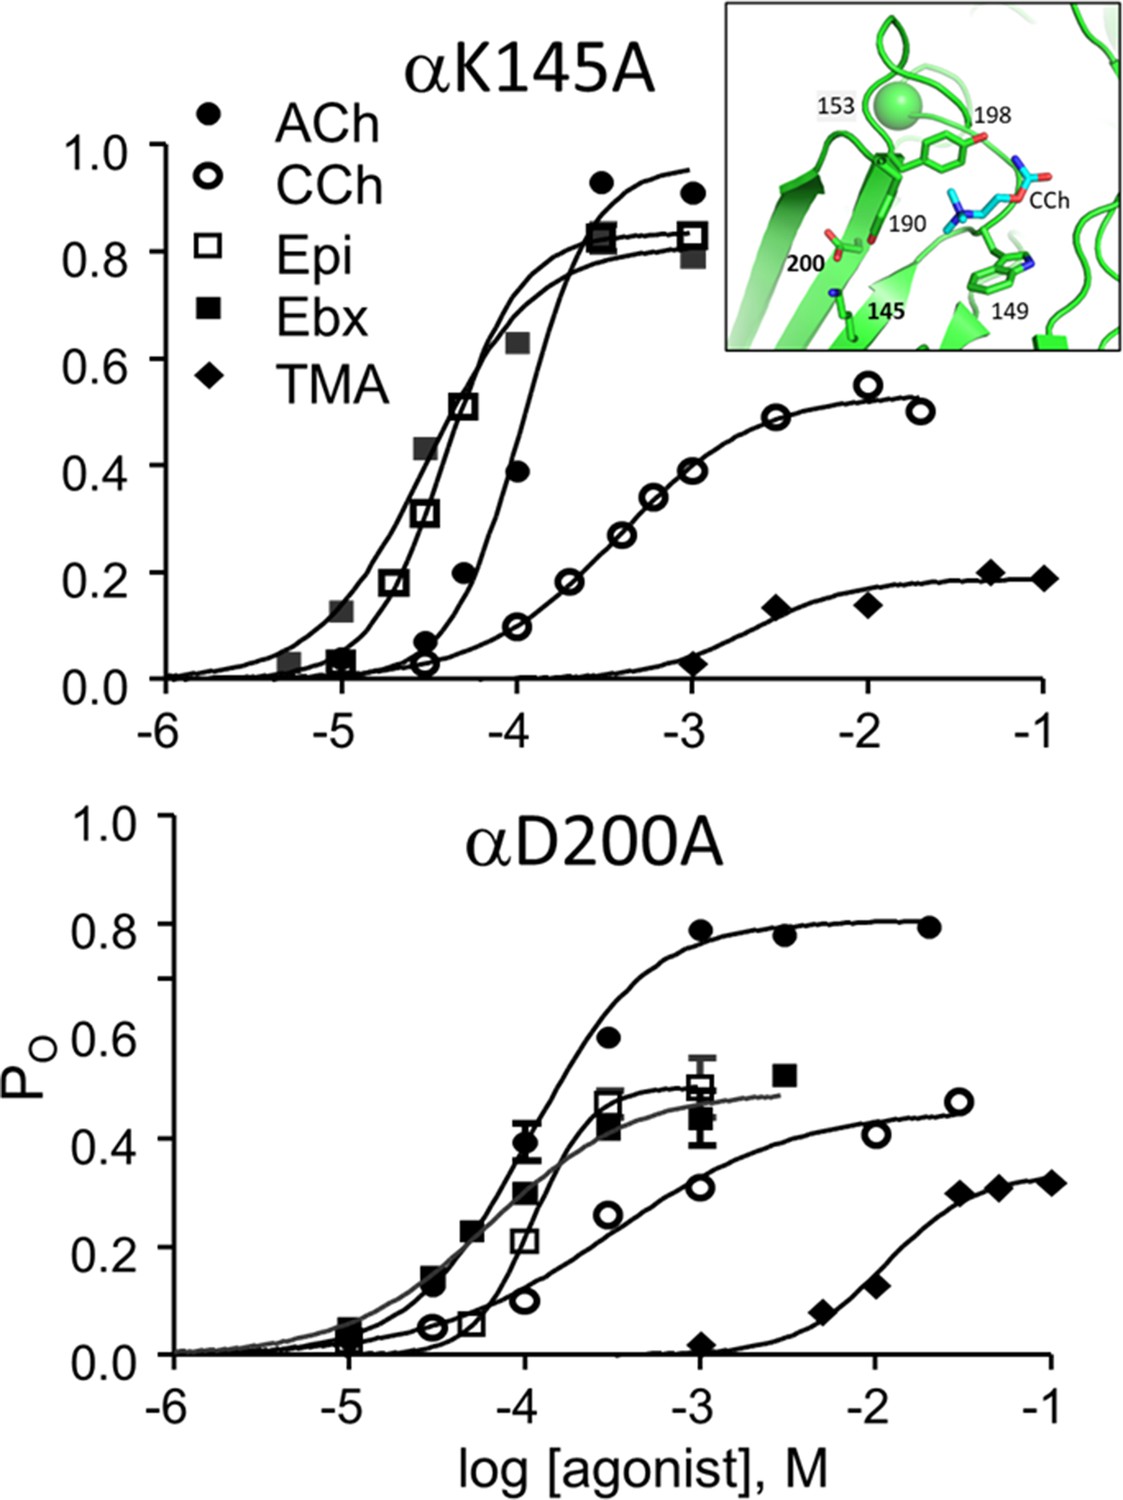
CRCs for αK145A and αD200A.
Agonist efficiencies calculated from the fitted CRC parameters are in Table 2. Intra-cluster interval histograms are in Figure 6—figure supplement 1 and Figure 6—figure supplement 2. Inset, α−δ subunit interface of an AChR neurotransmitter binding site occupied by CCh (cyan) (7QL6.pdb; Zarkadas et al., 2022).
Figure 6—figure supplement 1
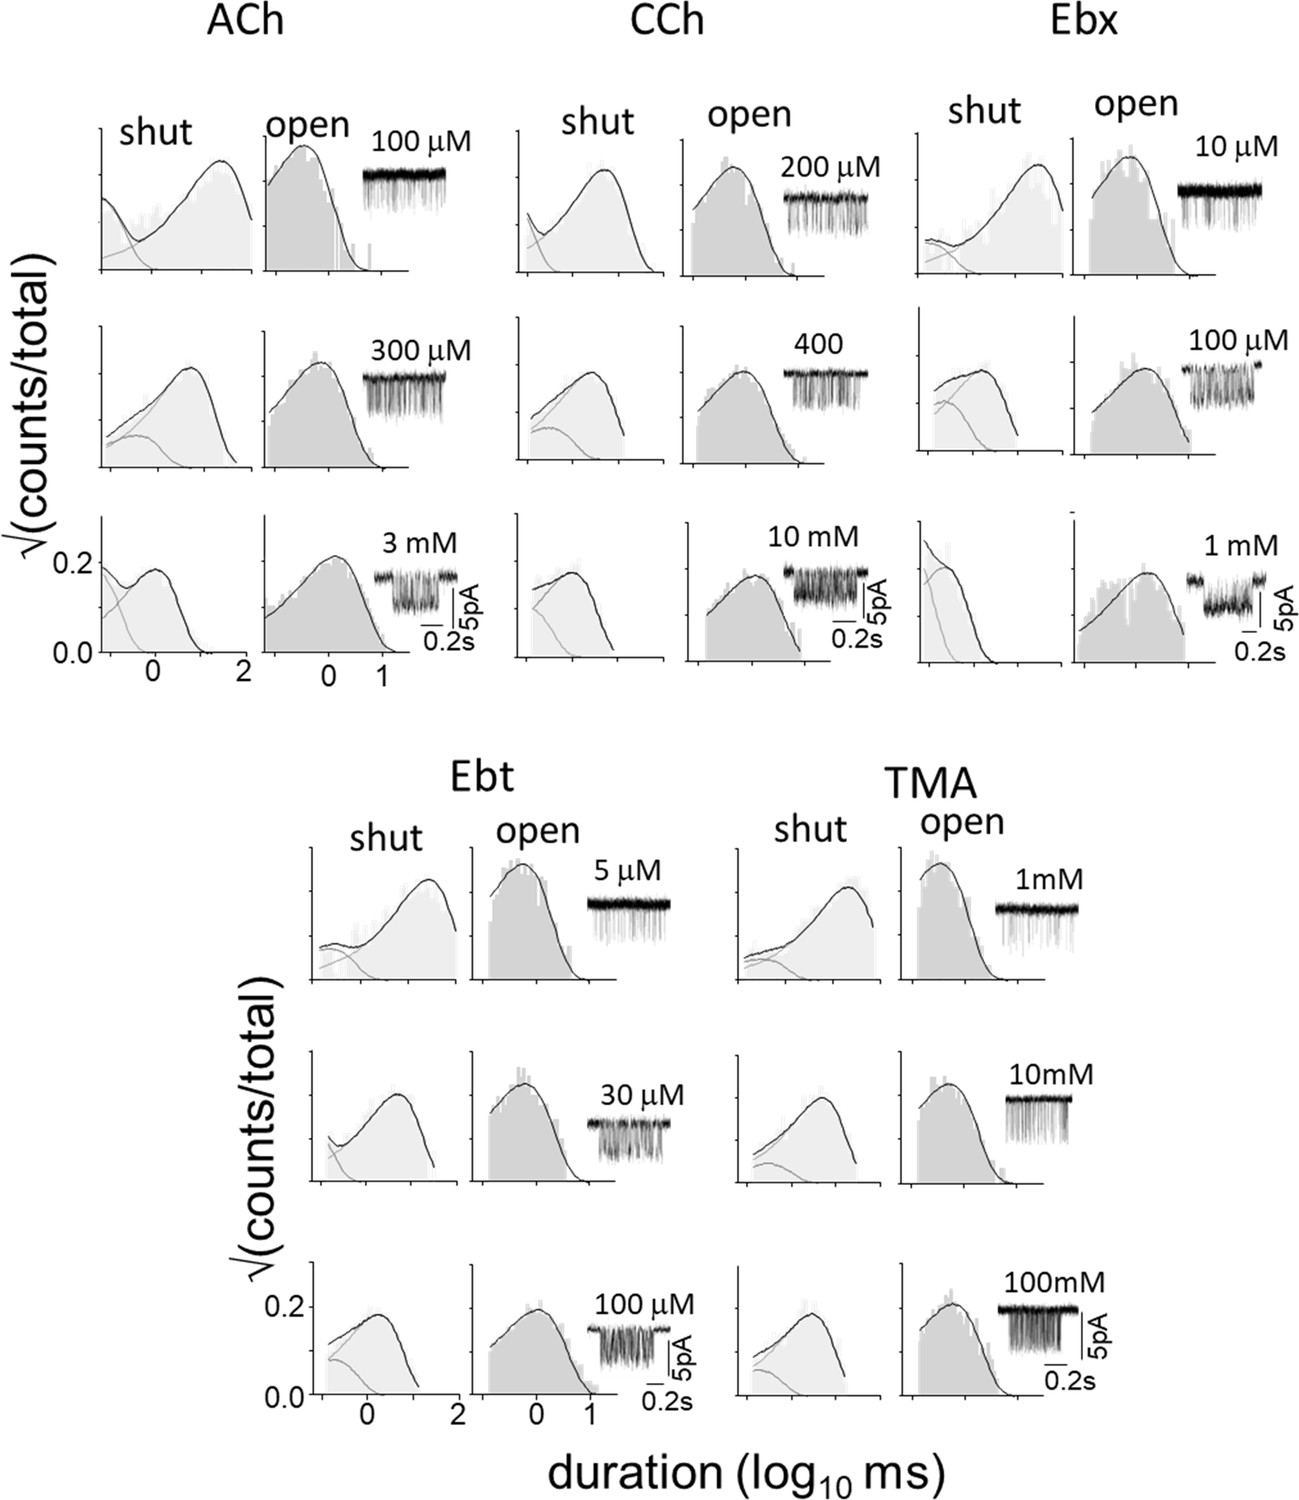
αK145A.
Figure 6—figure supplement 2
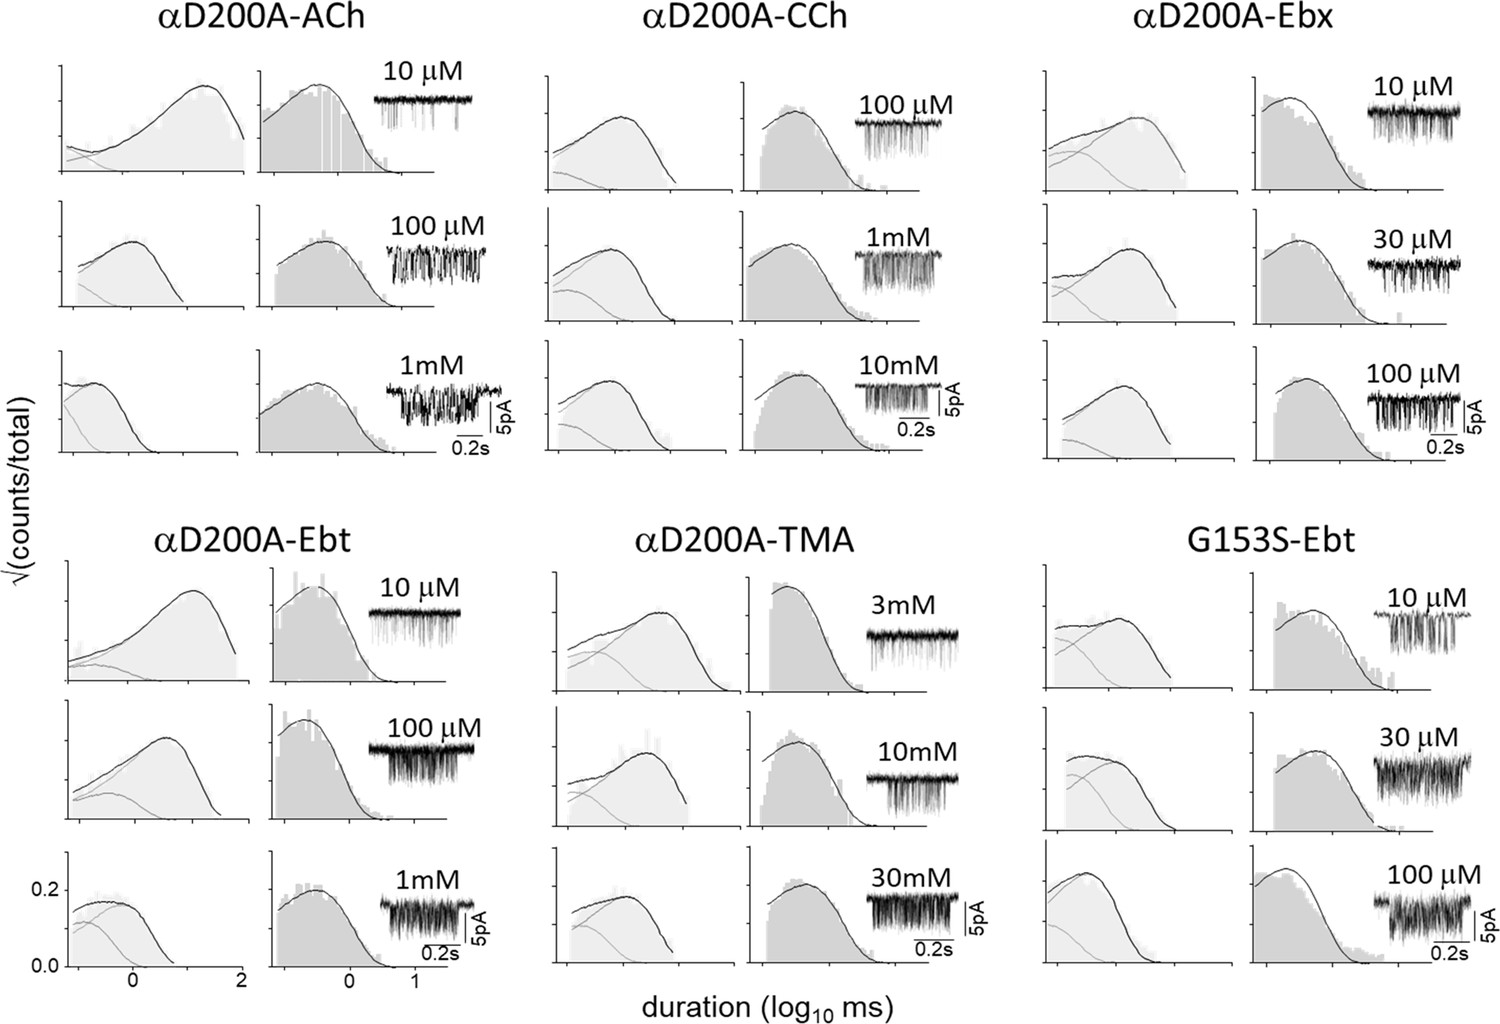
αD200A and αG153S.
Figure 7 with 2 supplements
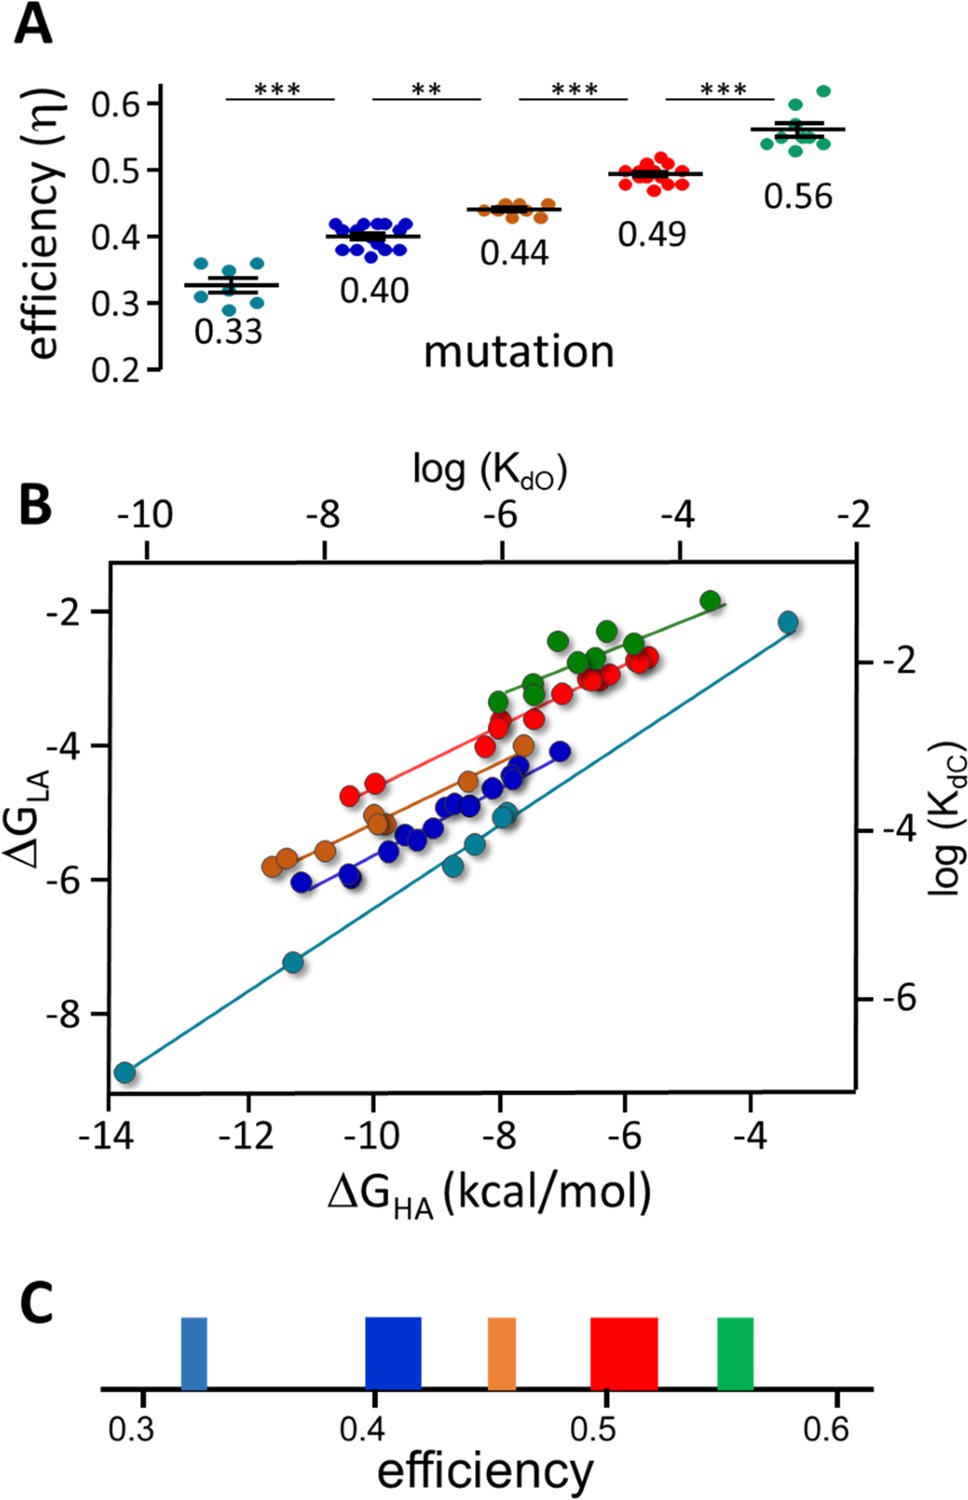
Mutation η values.
Each symbol is η value calculated for an individual mutation (various agonists; Table 2 and Table 2—source data 1). (A) There are 5 efficiency classes (mean ± sd). As with agonists (Figure 4), the ~0.5 and~0.4 classes predominate. (B) Weak (LA) versus strong (HA) binding energies for the mutants (sd of each point is smaller than the symbol). The 5 slopes reflect different correlations between catch and hold free energy changes (Figure 2B). The efficiency distribution for the mutations (η=1-slope; see text for mean ± sd) is the same as for agonists. C. Spectrum of efficiencies, adult AChR neurotransmitter binding sites. The width of each line is proportional to prevalence (agonists and mutations).
Figure 7—figure supplement 1
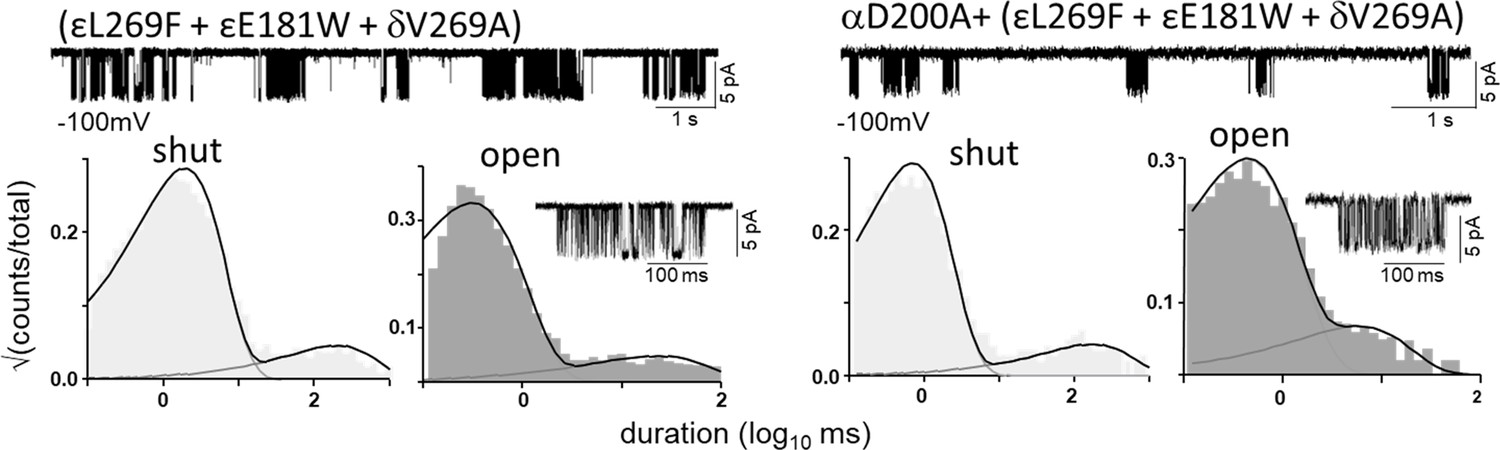
Estimating L0 (αD200).
All currents were recorded in the complete absence of agonists. Top traces, clusters of unliganded single-channel openings are mainly C⇄O (Vm=-100 mV; O is down); silent periods between clusters are desensitized. Bottom, interval duration histograms and an example cluster. Left, the background mutations together increase L0 from 7.4x10⁻⁷ to 0.17 (by a factor of 2.46x10⁵). Right, the background mutations plus αD200A increase L0 from 7.4x10⁻⁷ to 0.64 (by a factor of 3.76x10⁵). Hence, the A substitution at αD200 increases L0 by 3.76-fold. L0 is voltage dependent and is 5.2x10⁻⁷ at –70 mV (Nayak et al., 2012). We calculate that at this membrane potential (Figure 6) L0 with αD200A is 3.76-fold grater, or 1.9x10⁻⁶. L0 was measured individually using the above method for all 53 mutations (Table 2 and Table 2—source data 1).
Figure 7—figure supplement 2
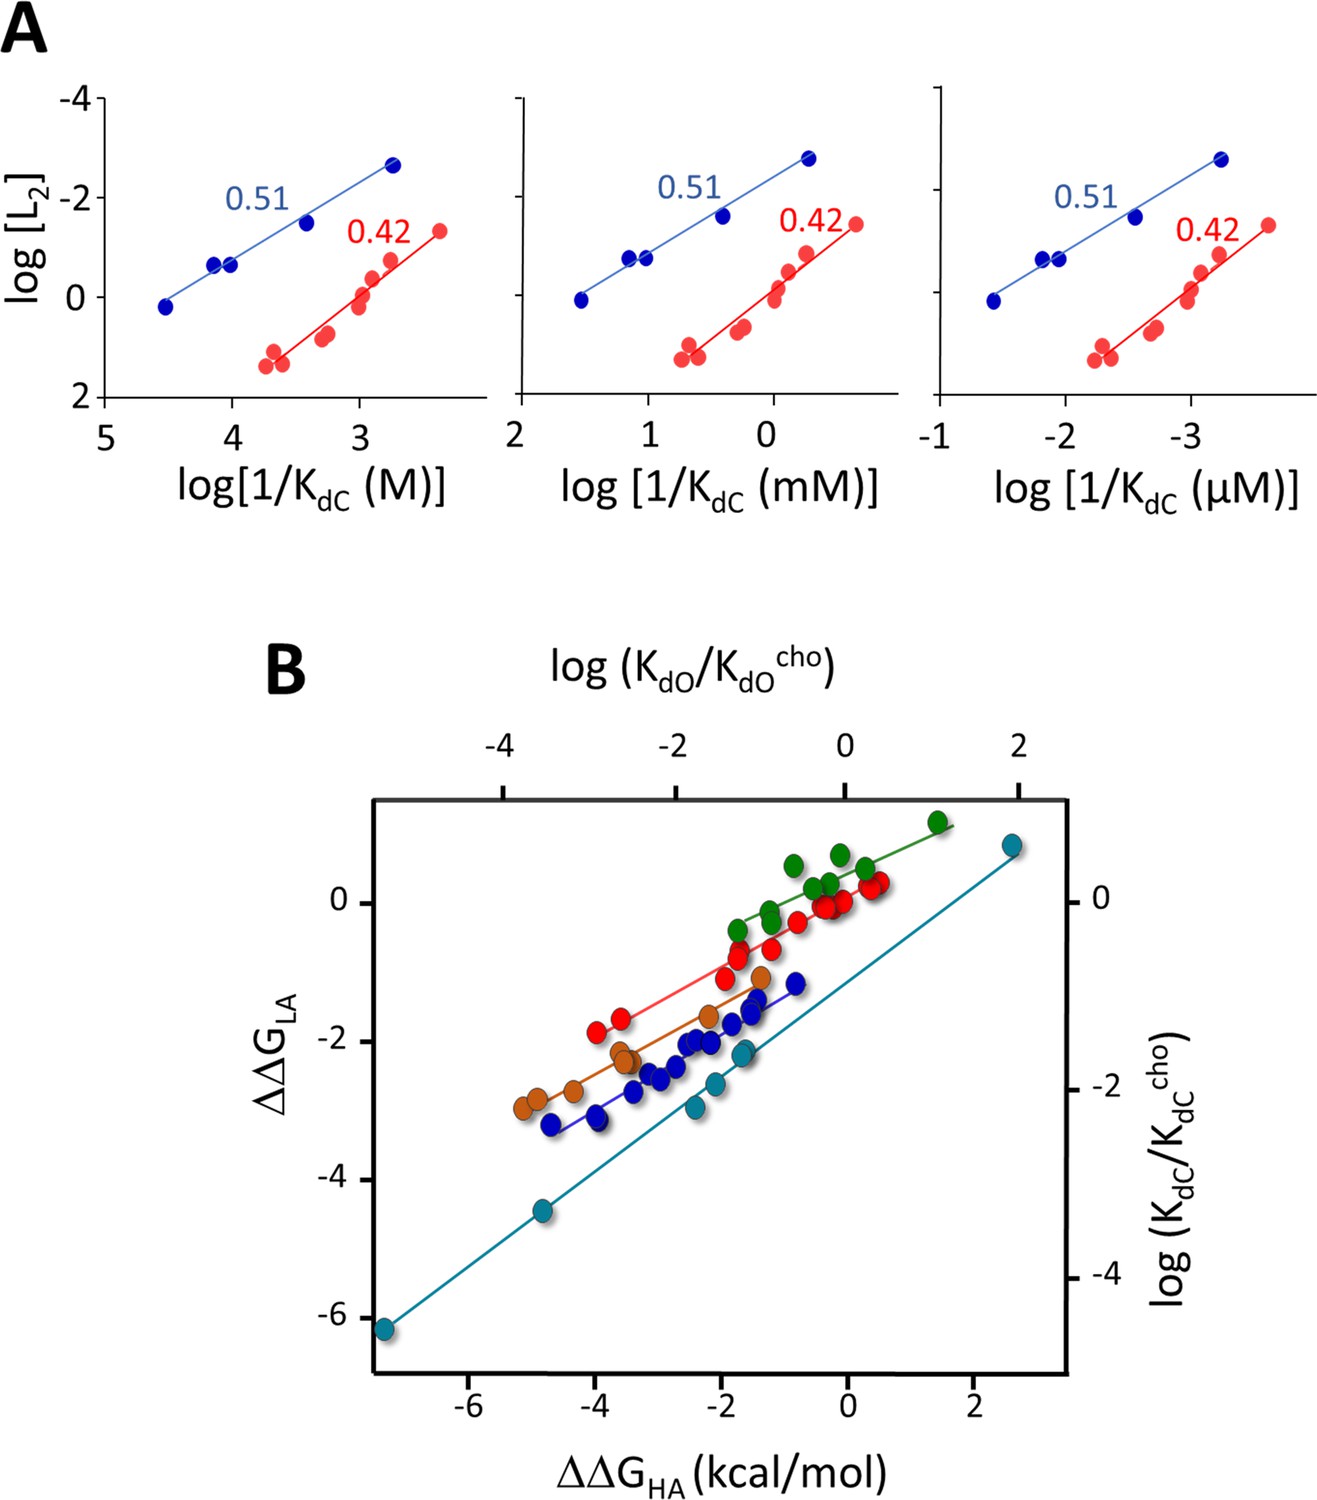
Evidence that in AChRs KdC reflects mainly the free energy change of the catch rearrangement (see Figure 2—figure supplement 1).
In A+C⇄AC ⇄AC (Figure 2A), the first step includes a term for the entropy decrease from the loss of a free ligand, indexed to a reference concentration (Phillips, 2020). This term does not cancel in Equation 2, but in AChRs the second step dominates so η is the same with or without this term. (A) Agonist η-plots (0.51 and 0.42 class ligands; Figures 4B and 5) using different reference concentrations. The slopes of the straight-line fits and η (Equation 3) are independent of the reference concentration. (B) Mutation plots. The entropy term was removed by first normalizing KdC and KdO by those of a standard agonist (here, choline; 2 other agonists give the same result). The slopes of plots, ΔΔGLA/ΔΔGHA, are approximately same as without normalization (Figure 7B).
Tables
Table 1
Agonist efficiencies.
| Agonist | EC50 (μM) (sem) | POmax (sem) | KdC (μM) | KdO (nM) | c | η | n |
|---|---|---|---|---|---|---|---|
| BzTMAa | 1070 (200) | 0.60 (0.05) | 930 (112.0) | 650 (90) | 1424 (18.0) | 0.51 (0.01) | 3 |
| Decb | 190 (20) | 0.79 (0.03) | 90 (7.0) | 140 (10) | 643 (21) | 0.41 (0.01) | 4 |
| SCha | 20 (3) | 0.84 (0.02) | 50 (4.0) | 20 (1) | 3177 (118) | 0.45 (0.01) | 3 |
| BzTEAb+c | 2 (0.1) | 0.85 (0.02) | 0.80 (0.3) | 3 (2) | 316 (14) | 0.29 (0.00) | 3 |
| TriMAab | 16000 (1200) | 0.78 (0.03) | 7720 (316.0) | 12580 (670) | 615 (18) | 0.57 (0.01) | 4 |
-
Mean EC50 and Pomax were measured from each CRC (intra-cluster interval duration histograms in Figure 3 and Figure 3—figure supplement 1), with standard error of mean (sem). KdC and KdO were calculated (Equation 4a) after correcting the background mutations that only changed L0. c, coupling constant (KdC/KdO); η, efficiency (Equation 2); error estimates (calculated by error propagation) for calculated KdC, KdO, c, and η values given by (sem); n, number of CRCs. Membrane potential, +70 mV (to minimize channel block by the agonist). Agonist structures are in Figure 5; superscripts indicate mutation backgrounds: aεS450W, bεL269F, cεE181W that increase Lo (increase responses to weak agonists).
-
Table 1—source data 1
Agonist efficiency.
- https://cdn.elifesciences.org/articles/86496/elife-86496-table1-data1-v1.docx
Table 2
Mutation efficiencies.
| mutation | agonist | EC50 (μM) | POmax | KdC (μM) | KdO (nM) | c | ηmut | n | ηwt |
|---|---|---|---|---|---|---|---|---|---|
| D200A | ACha | 110 (10) | 0.80 (0.02) | 52 (3) | 150 (5) | 338 (12) | 0.37 (0.00) | 3 | 0.50 |
| CCha | 320 (70) | 0.45 (0.02) | 138 (18) | 900 (94) | 153 (3) | 0.36 (0.00) | 4 | 0.52 | |
| TMAa | 13350 (2970) | 0.37 (0.03) | 5683 (740) | 4382 (890) | 130 (5) | 0.48 (0.02) | 5 | 0.54 | |
| Ebta+b | 110 (20) | 0.50 (0.03) | 47 (5) | 680 (47) | 69 (2) | 0.30 (0.00) | 3 | 0.41 | |
| Ebxa+b | 060 (20) | 0.49 (0.03) | 26 (5) | 390 (58) | 67 (3) | 0.29 (0.01) | 3 | 0.46 | |
| K145A | ACha | 110 (10) | 0.95 (0.06) | 83 (5) | 50 (3) | 1672 (82) | 0.44 (0.00) | 3 | - |
| CCha | 380 (30) | 0.53 (0.01) | 165 (8) | 400 (15) | 411 (5) | 0.41 (0.00) | 4 | - | |
| TMAa | 2200 (590) | 0.19 (0.01) | 922 (125) | 5010 (712) | 184 (3) | 0.43 (0.01) | 3 | - | |
| Ebta | 40 (4) | 0.81 (0.04) | 20 (2) | 20 (2) | 792 (52) | 0.38 (0.00) | 3 | - | |
| Ebxa | 40 (3) | 0.83 (0.01) | 20 (1) | 20 (1) | 847 (17) | 0.38 (0.00) | 3 | - | |
| G153S | Ebta | 2 (0.5) | 0.65 (0.01) | 2 (0.3) | 7 (1) | 313 (4) | 0.31 (0.01) | 4 | - |
-
Measured EC50 & Pomax and calculated Kd, c and h, mean (sem). For mutation location see Figure 6, inset. KdC and KdO were calculated from CRC parameters (Figure 6) by using Eq. 4. c, coupling constant (KdC/KdO); n, number of CRCs. L0 was corrected for background mutations (Methods): aεS450W, bεL269F, cεE181W. See Figure 6—figure supplement 1 and Figure 6—figure supplement 2 for intra-cluster interval duration histograms.
-
Table 2—source data 1
Mutation efficiency.
- https://cdn.elifesciences.org/articles/86496/elife-86496-table2-data1-v1.docx
Additional files
Download links
A two-part list of links to download the article, or parts of the article, in various formats.
Downloads (link to download the article as PDF)
Open citations (links to open the citations from this article in various online reference manager services)
Cite this article (links to download the citations from this article in formats compatible with various reference manager tools)
Agonist efficiency links binding and gating in a nicotinic receptor
eLife 12:e86496.
https://doi.org/10.7554/eLife.86496


