A single-cell transcriptome atlas of pig skin characterizes anatomical positional heterogeneity
- Department of Zoology, College of Life Science, Sichuan Agricultural University, China
- Chengdu Livestock and Poultry Genetic Resources Protection Center, China
- BGI Beijing Genome Institute, China
- College of Animal Science and Technology, Sichuan Agricultural University, China
Figures
Figure 1 with 3 supplements
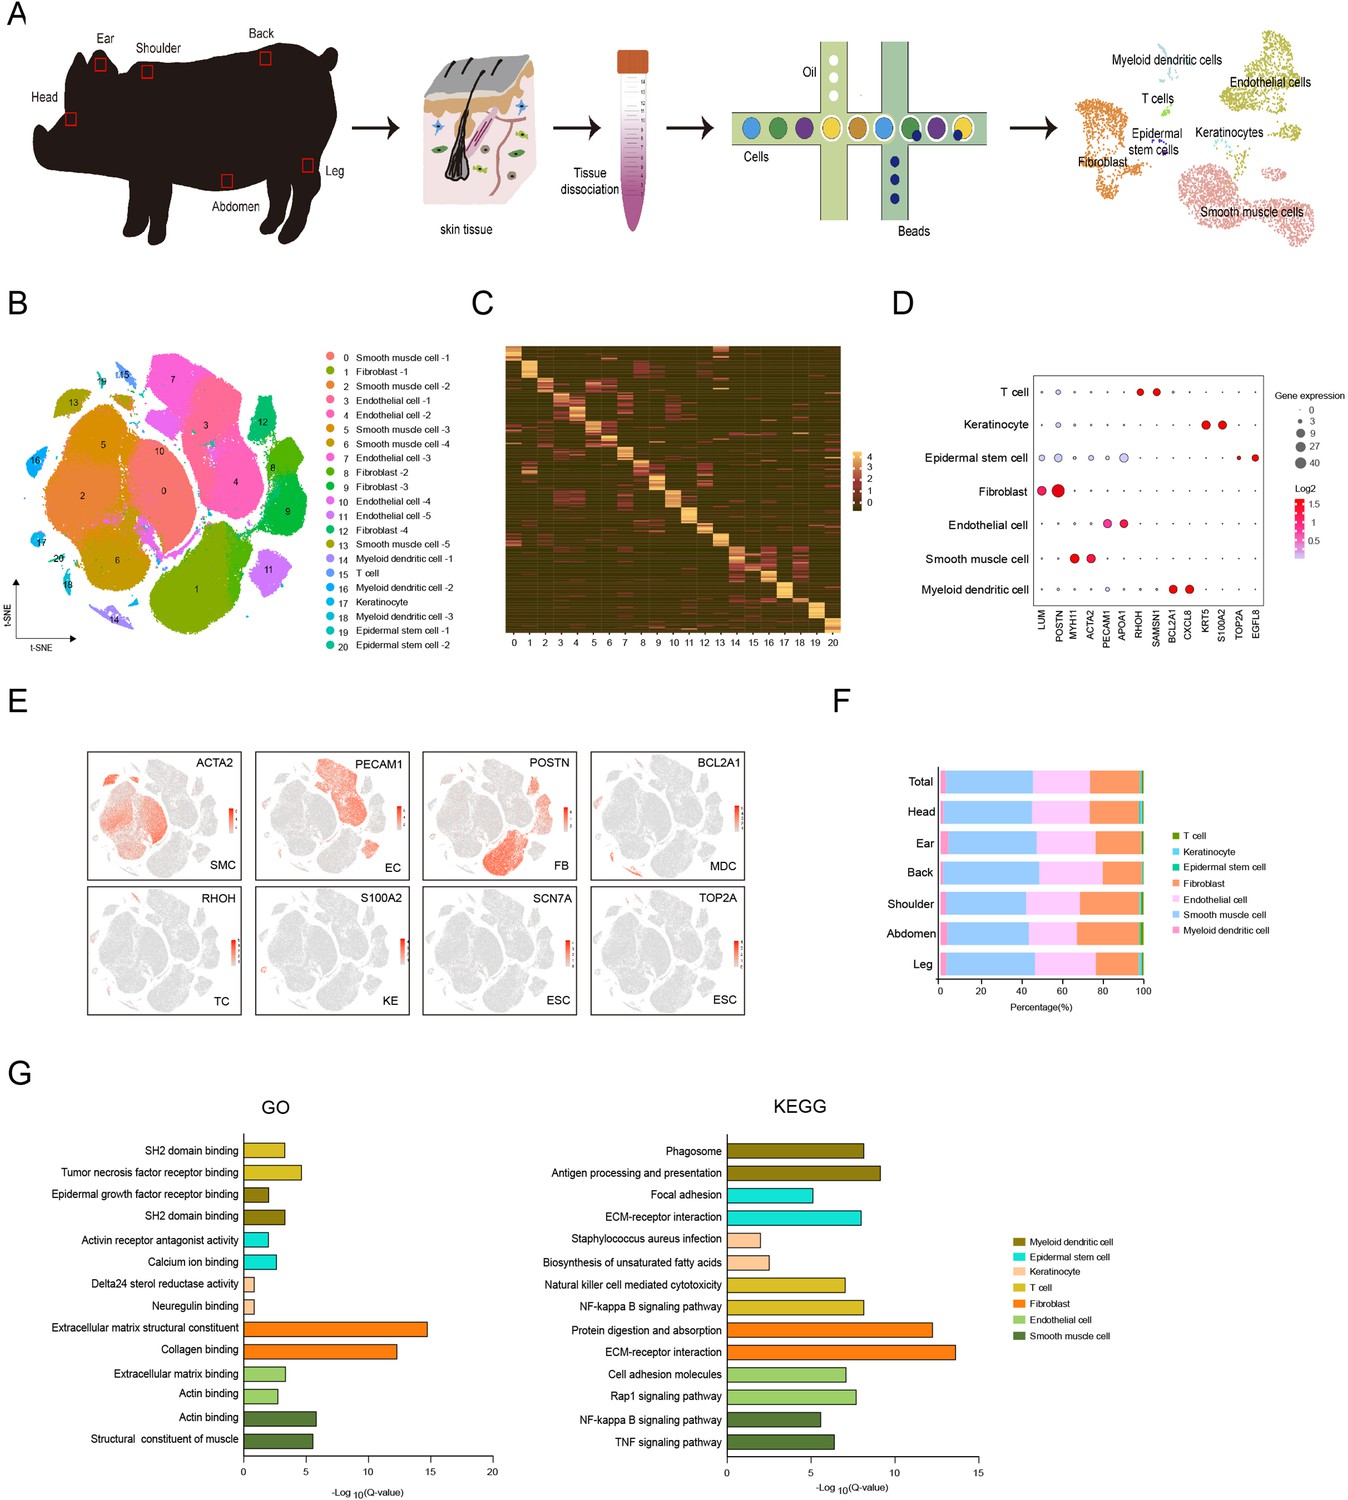
Single-cell transcriptome profiling of different skin anatomical sites in CH pig.
(A) Flowchart overview of skin single-cell RNA sequencing from different anatomical skin regions of CH pigs. (B) The t-SNE plot visualization showing 21 clusters of annotated cell types from CH pig skin. (C) Heatmap showing the top 12 highly expressed genes from each cluster. Each column represents a cluster, each row represents a gene. Light yellow shows the maximum expression level of genes, and deep green shows no expression. (D) Dot plot showing the two representative genes for each cell type. Color indicates the log2 value, and circle size indicates gene expression level. (E) The marker genes for each cell type are distributed on the t-SNE plot. Color indicates gene expression. (F) The distribution ratio of cell types for total cells and six different anatomical skin areas. (G) The most enriched Gene Ontology (GO) terms and Kyoto Encyclopedia of Genes and Genomes (KEGG) pathways for each cell type. CH, Chenghua; SMC, smooth muscle cell; EC, endothelial cell; FB, fibroblast; MDC, myeloid dendritic cell; TC, T cell; KE, keratinocyte; and ESC, epidermal stem cell.
-
Figure 1—source data 1
Source data of marker genes for each cluster in Figure 1C.
- https://cdn.elifesciences.org/articles/86504/elife-86504-fig1-data1-v1.xlsx
Figure 1—figure supplement 1
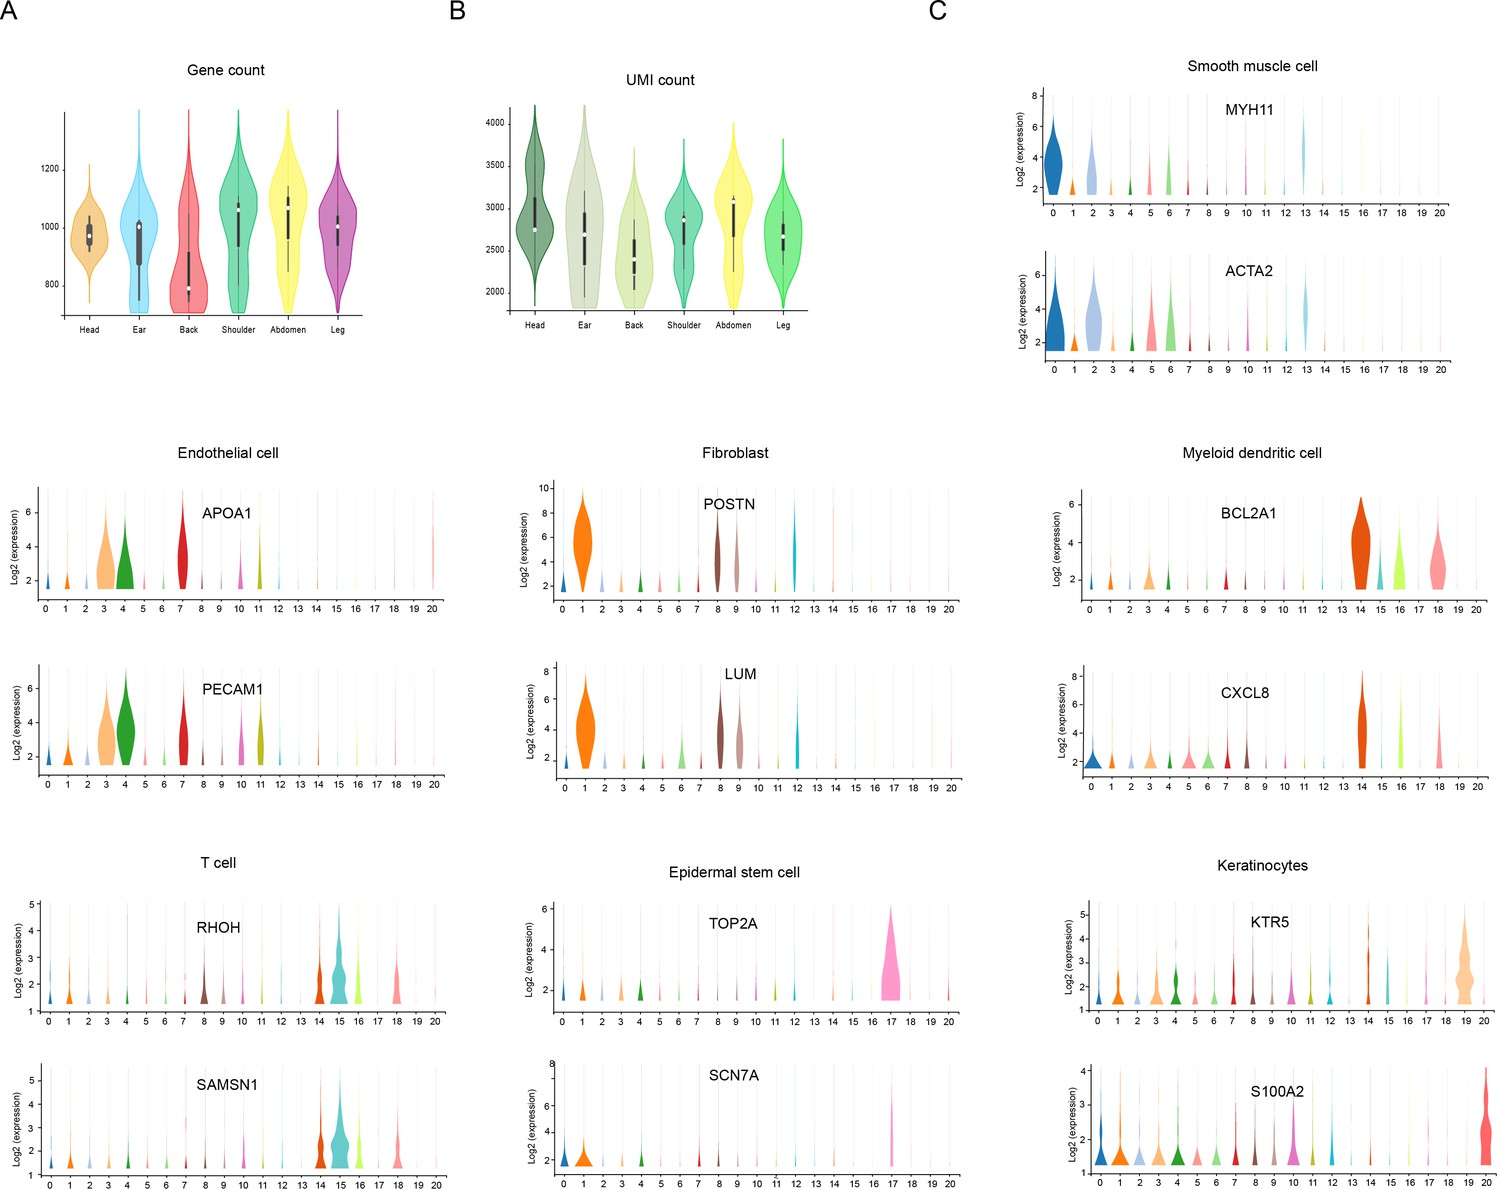
The count of genes/unique molecular identifier (UMI) and the expression of marker genes.
(A) Violin plot showing the number of genes detected from different skin sites. (B) Violin plot showing the UMI count detected from different skin sites. (C) Violin plot showing the genes expression levels of MYH11, ACTA2, APOA1, PECAM1, POSTN, LUM, BCL2A1, CXCL8, RHOH, SAMSN1, TOP2A, SCN7A, KTR5, and S100A2 in each cell cluster of skin cells in Chenghua (CH) pigs.
-
Figure 1—figure supplement 1—source data 1
Source data of the gene/unique molecular identifier (UMI) counts in Figure 1—figure supplement 1A and B.
- https://cdn.elifesciences.org/articles/86504/elife-86504-fig1-figsupp1-data1-v1.xlsx
Figure 1—figure supplement 2
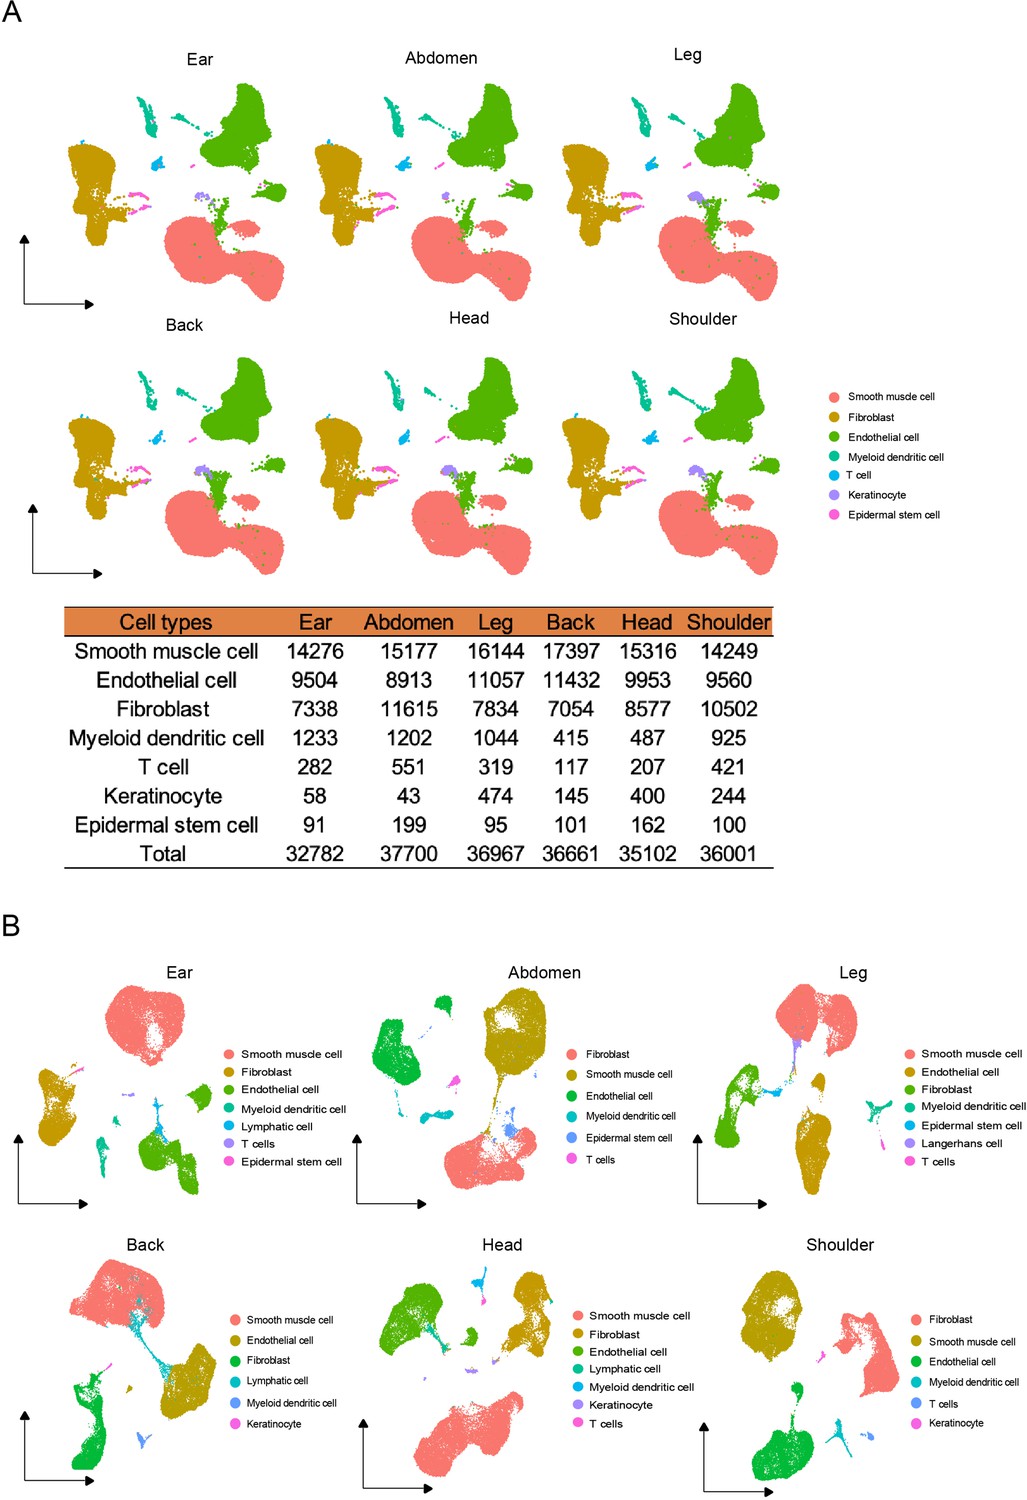
The cell types of different skin regions.
(A) UMAP visualization of cell types from different skin regions in global Chenghua (CH) skin cells. The number of cell types in different skin regions. (B) The cell types of individual skin sites by UMAP visualization.
Figure 1—figure supplement 3
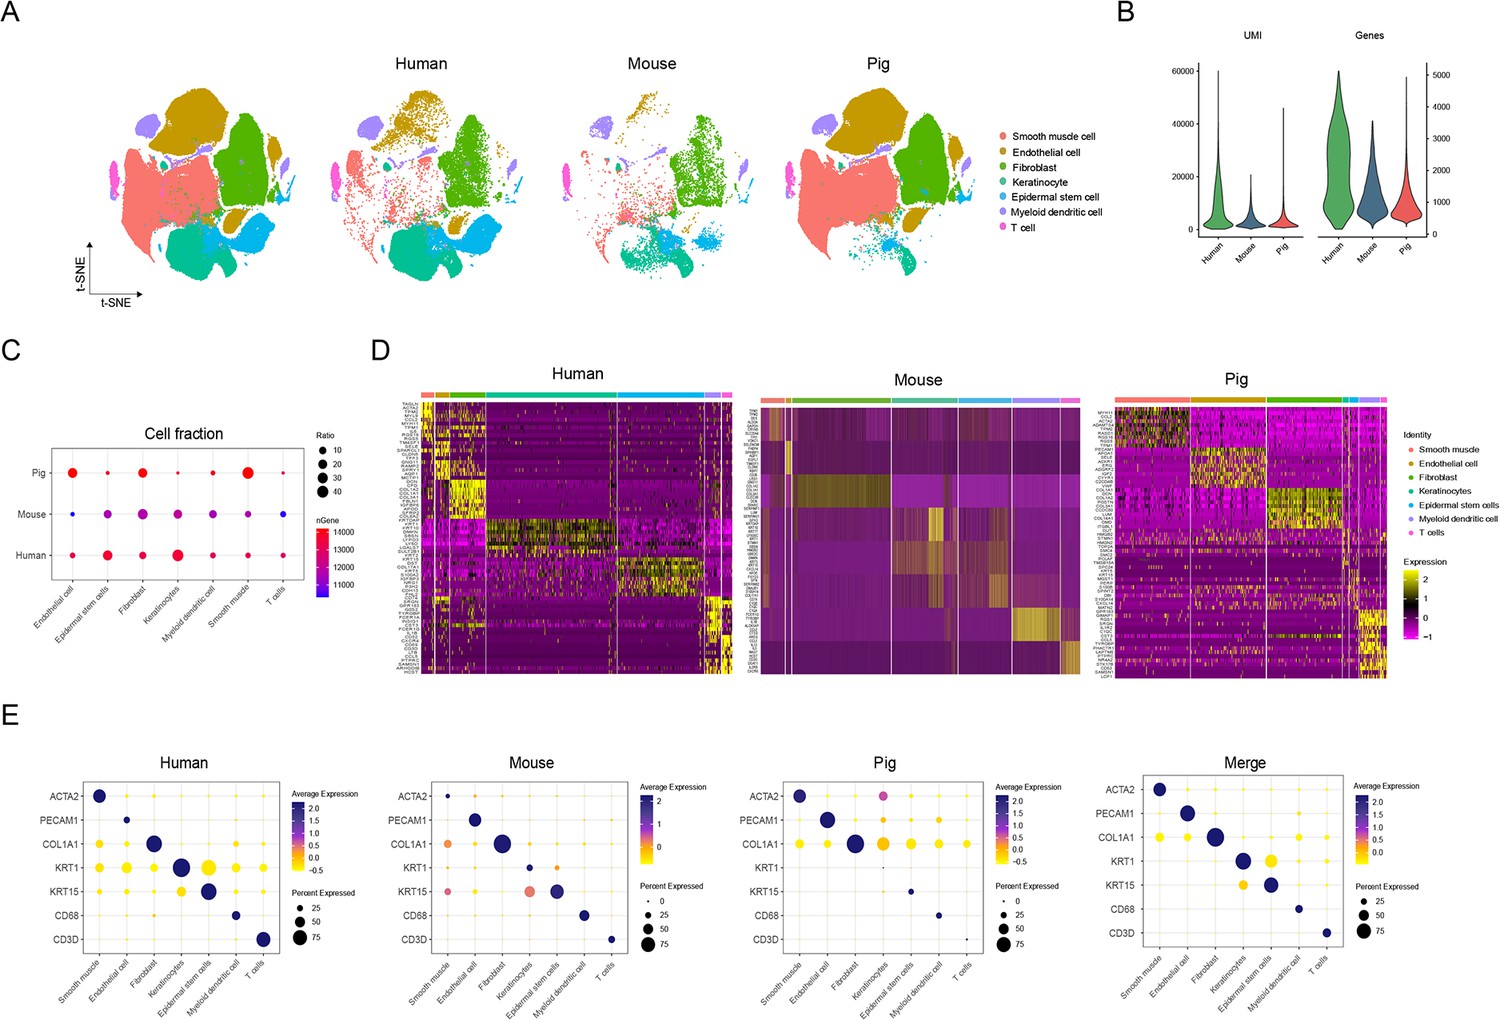
Comparison of skin cells among human, pig, and mouse species.
(A) The t-SNE plot visualization of all cell types for skin cells among human, pig, and mouse. (B) Violin plots showing the number of unique molecular identifier (UMI) and gene counts of skin cells among human, pig, and mouse. (C) Bubble plot representing the ratio of cell types for skin cells and the gene number among human, pig, and mouse. Color shows gene number and circle size indicates cell abundance. (D) Heatmap showing high expression levels of genes in each cell type of skin cells among human, pig, and mouse. Light yellow shows the genes with high expression. (E) Bubble plot showing the ratio and expression of marker genes in skin cells among human, pig, and mouse. Color represents gene expression, and circle size indicates the percent of expressing cells.
Figure 2
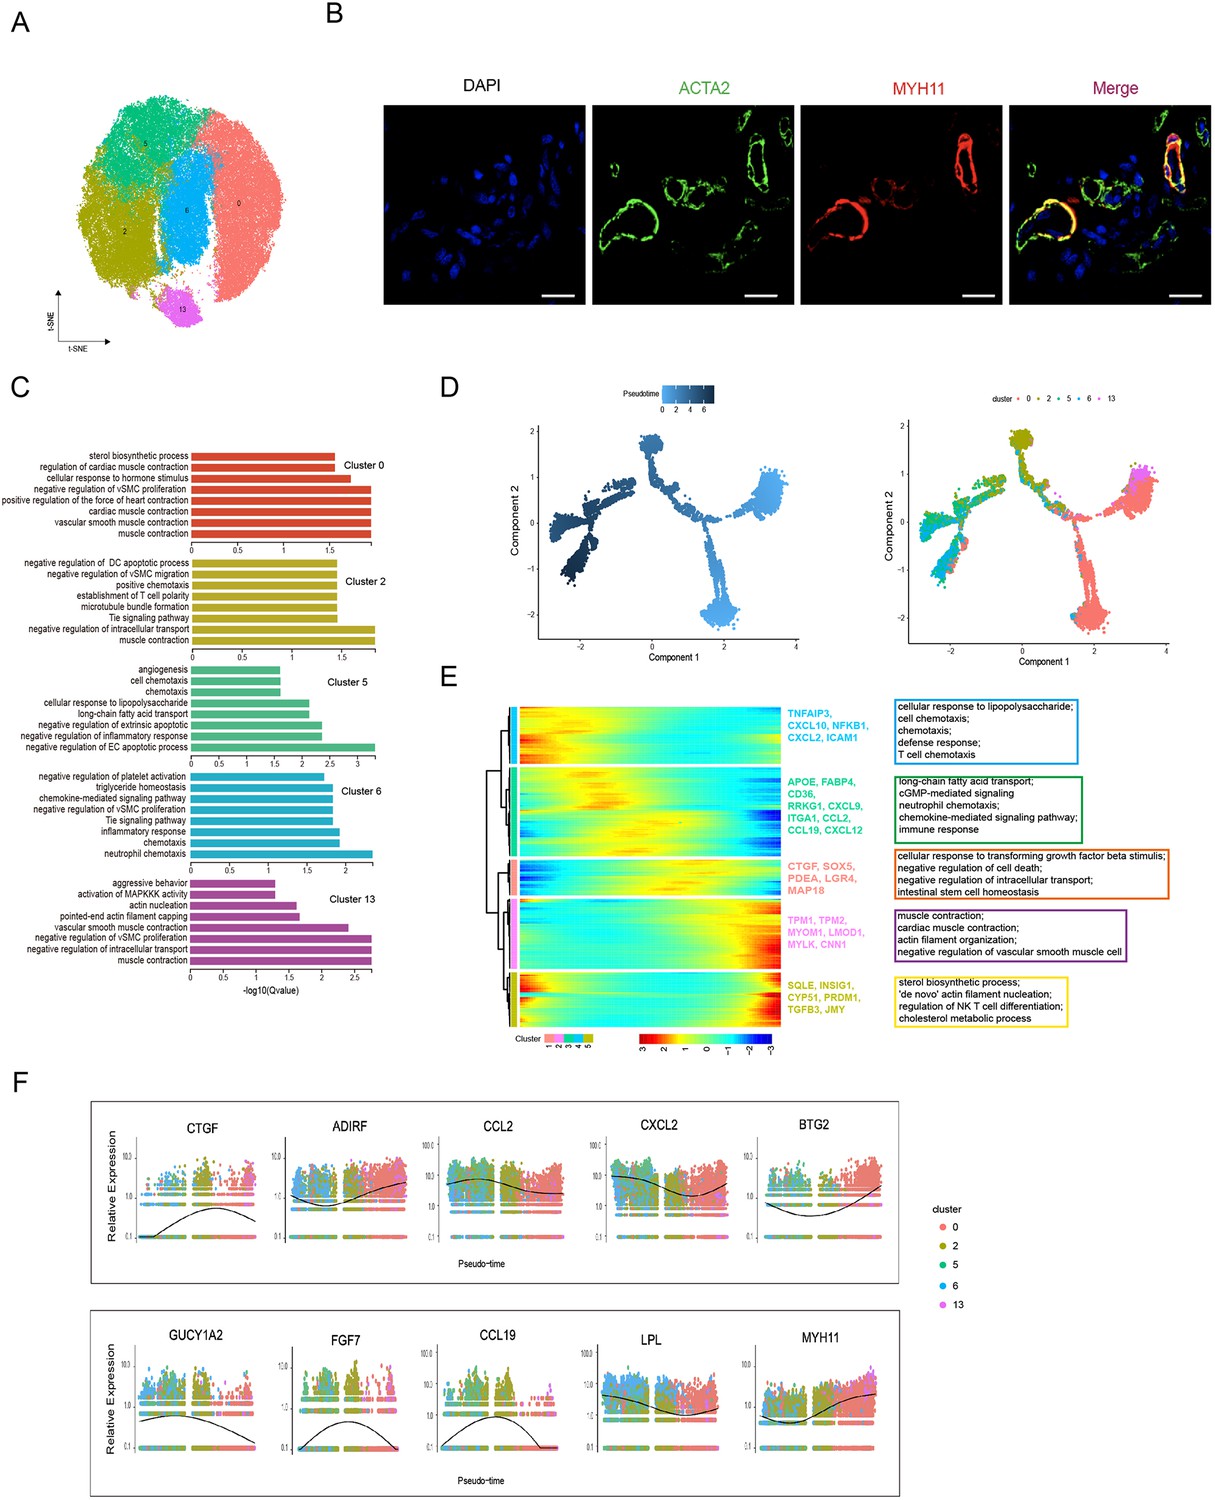
Heterogeneity of skin smooth muscle cells (SMCs) in different anatomical sites.
(A) The t-SNE plot visualization of SMCs including clusters 0, 2, 5, 6, and 13. (B) Confocal images showing immunofluorescence staining of ACTA2 (green) and MYH11 (red) in back skin sections, representative markers of SMCs. Scale bar = 50 μm. n = 3. (C) The enriched Gene Ontology (GO) terms of biological process for each SMC subpopulation were sorted by q-value. (D) Pseudotime ordering of SMC subpopulations using Monocle 2. (E) Heatmap illustrating the dynamics of representative differentially expressed genes among SMCs phenotypes, in which the important GO terms relating to biological processes were described. (F) These genes’ expression along pseudotime in SMC subpopulations.
Figure 3
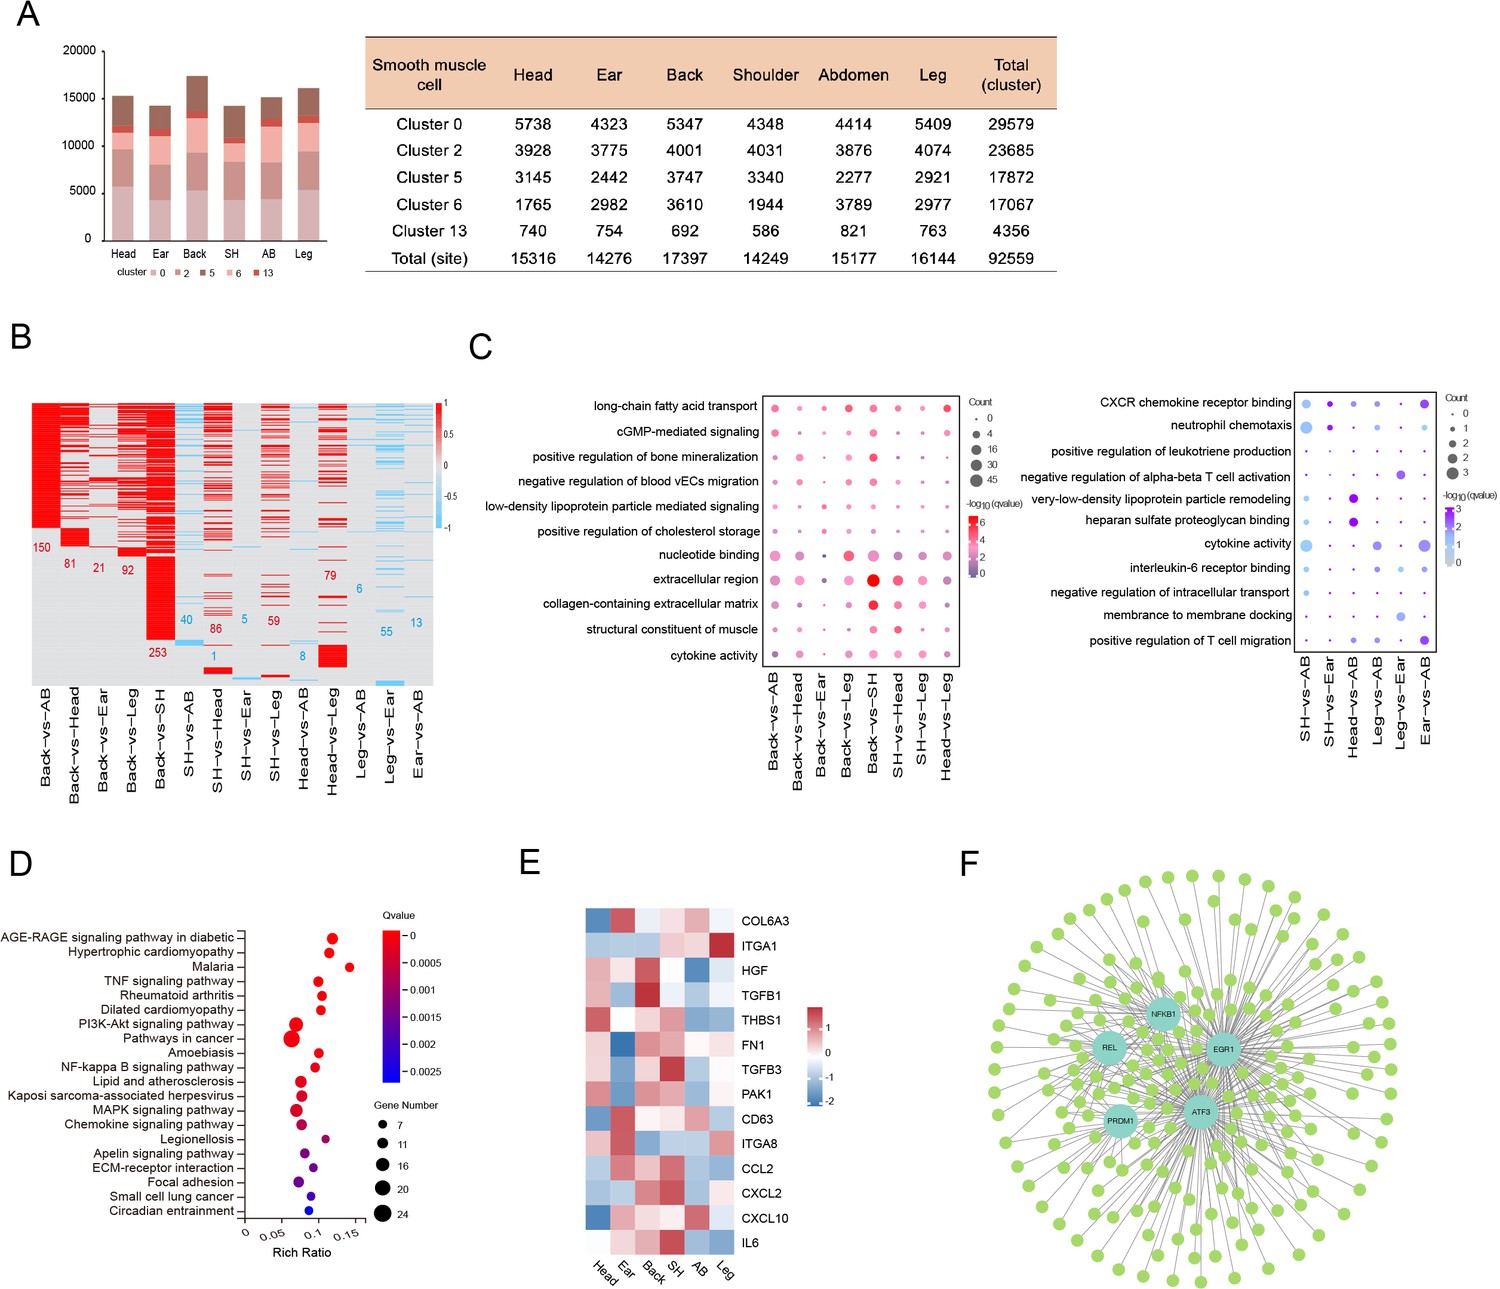
Heterogeneity of skin smooth muscle cells (SMCs) in different anatomical sites.
(A) The cell number of SMC subpopulations in different skin regions. (B) Heatmap showing the differentially expressed genes of SMCs in multiple compared groups. Red represents upregulated genes, blue represents downregulated genes, and the number of differentially expressed genes is indicated. (C) The enriched Gene Ontology (GO) terms of multiple compared groups. Color indicates q-value, and circle indicates gene counts. (D) Kyoto Encyclopedia of Genes and Genomes (KEGG) analysis for upregulated genes of back skin compared to other locations. (E) The expression level of genes involved in extracellular matrix (ECM)-integrins and immune response pathways in different skin regions. Red represents high expression of genes. (F) Transcriptional regulatory network of differentially expressed genes for SMCs in multiple compared groups. Blue nodes represent regulators and green nodes represent the target genes of regulators.
-
Figure 3—source data 1
Source data of the differentially expressed genes of smooth muscle cells (SMCs) in multiple compared groups in Figure 3B.
- https://cdn.elifesciences.org/articles/86504/elife-86504-fig3-data1-v1.xlsx
Figure 4 with 2 supplements
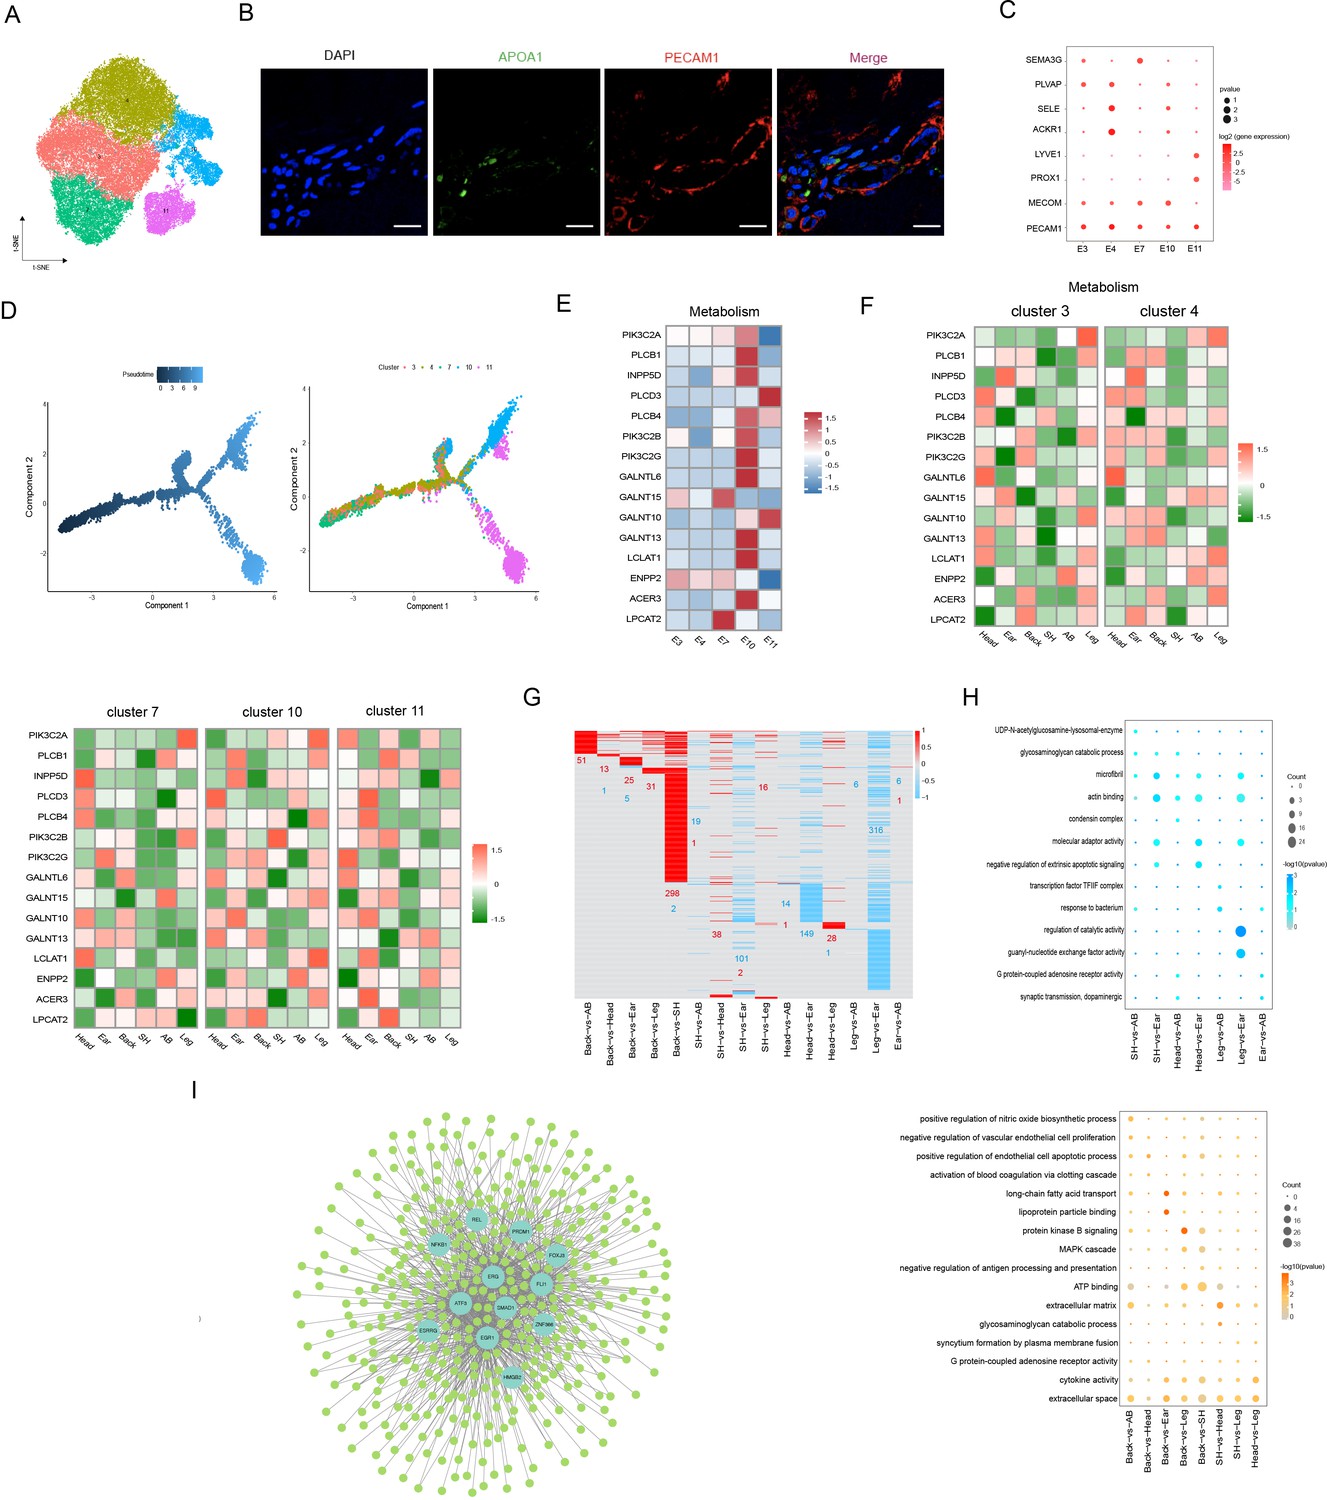
Heterogeneity of skin endothelial cells (ECs) in different anatomical sites.
(A) The t-SNE plot visualization of ECs. (B) Immunofluorescence staining of APOA1 (green) and PECAM1 (red) in back skin sections, representative markers of ECs. Scale bar = 50 μm. n = 3. (C) Dot plot representing marker genes of ECs phenotypes. Color indicates gene expression, and circle indicates the log2FC value. (D) Pseudotime ordering of ECs subpopulations using monocle 2. (E) Heatmap showing the gene expression of metabolic pathways in ECs subpopulations. (F) Heatmap of gene expression of metabolic pathways in ECs subpopulations of different skin regions. (G) Heatmap of differentially expressed genes (DEGs) for ECs in multiple compared groups. Red represents upregulated genes, and blue represents downregulated genes. (H) The significantly enriched Gene Ontology (GO) terms of ECs in multiple compared groups. (I) Regulatory network of DEGs for ECs of different skin regions. Blue nodes represent regulators, and green nodes represent the target genes of regulators.
-
Figure 4—source data 1
Source data of the differentially expressed genes of endothelial cells (ECs) in multiple compared groups in Figure 4G.
- https://cdn.elifesciences.org/articles/86504/elife-86504-fig4-data1-v1.xlsx
Figure 4—figure supplement 1
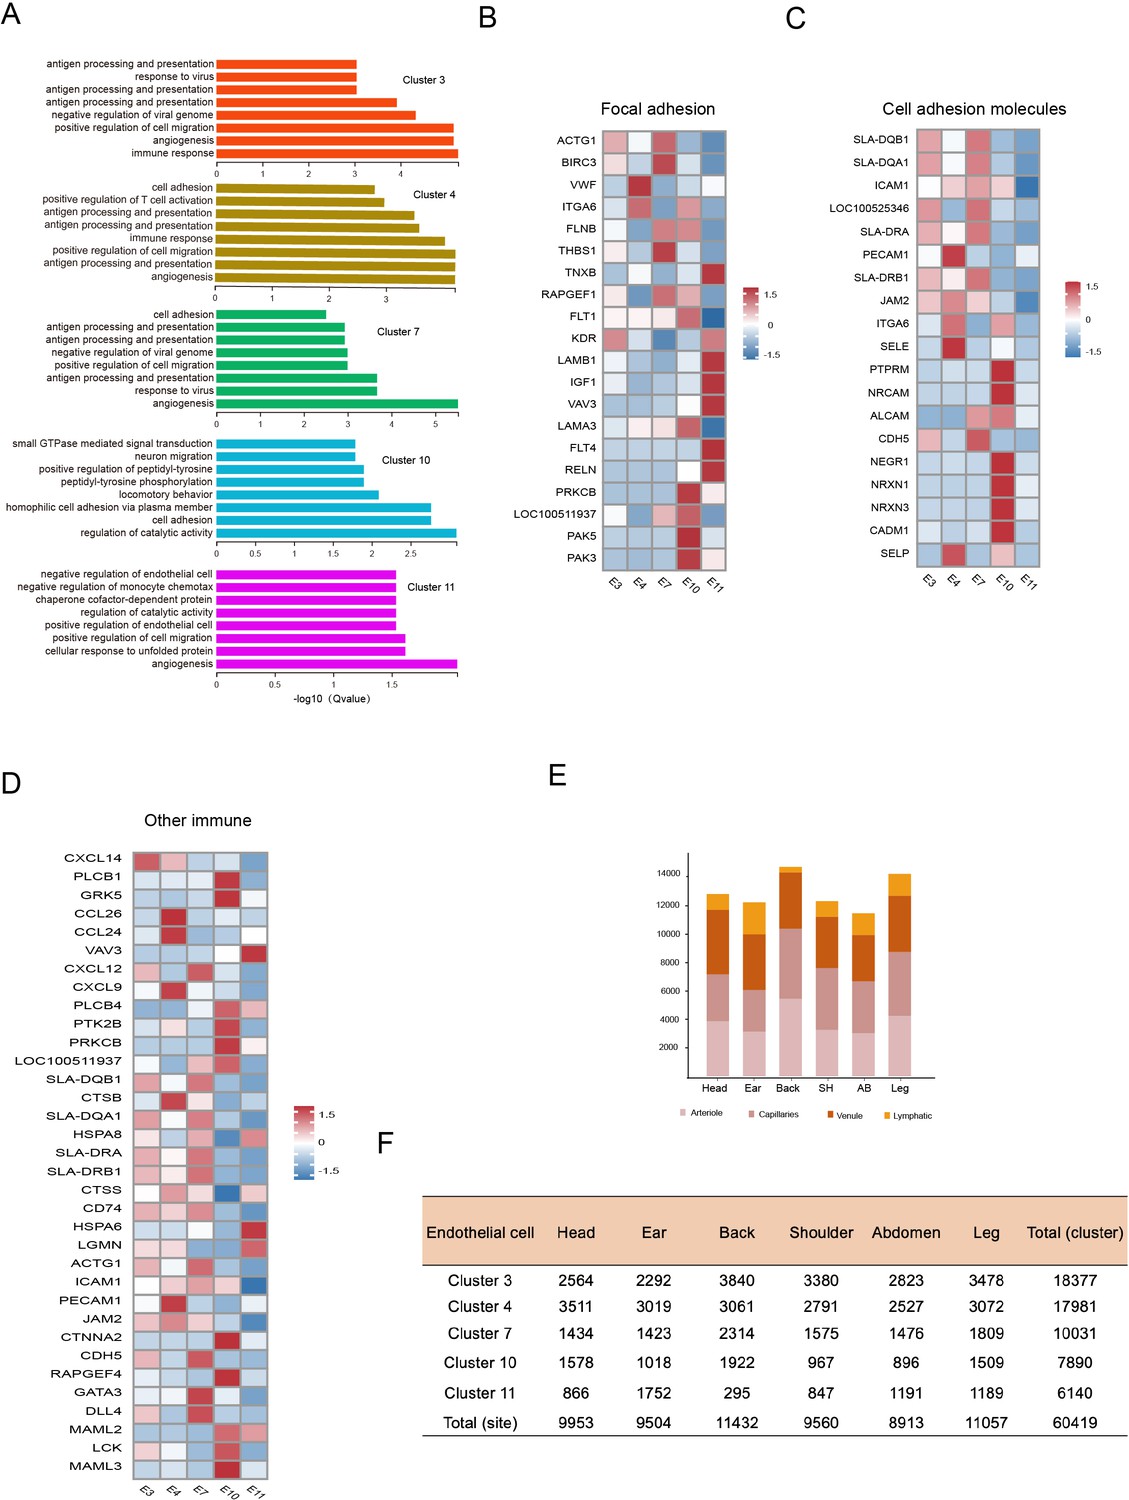
Heterogeneity of skin endothelial cells (ECs) in different anatomical sites.
(A) The enriched Gene Ontology (GO) terms pertaining to biological process for each ECs subpopulation were sorted by q-value. (B) Heatmap of gene expression for focal adhesion pathway among ECs subpopulations. (C) Heatmap of gene expression for cell adhesion molecule pathway among ECs subpopulations. (D) Heatmap of gene expression for other immune pathways among ECs subpopulations. (E) The cell number of ECs subpopulations in different skin regions. (F) The cell number of ECs clusters in different skin regions.
Figure 4—figure supplement 2
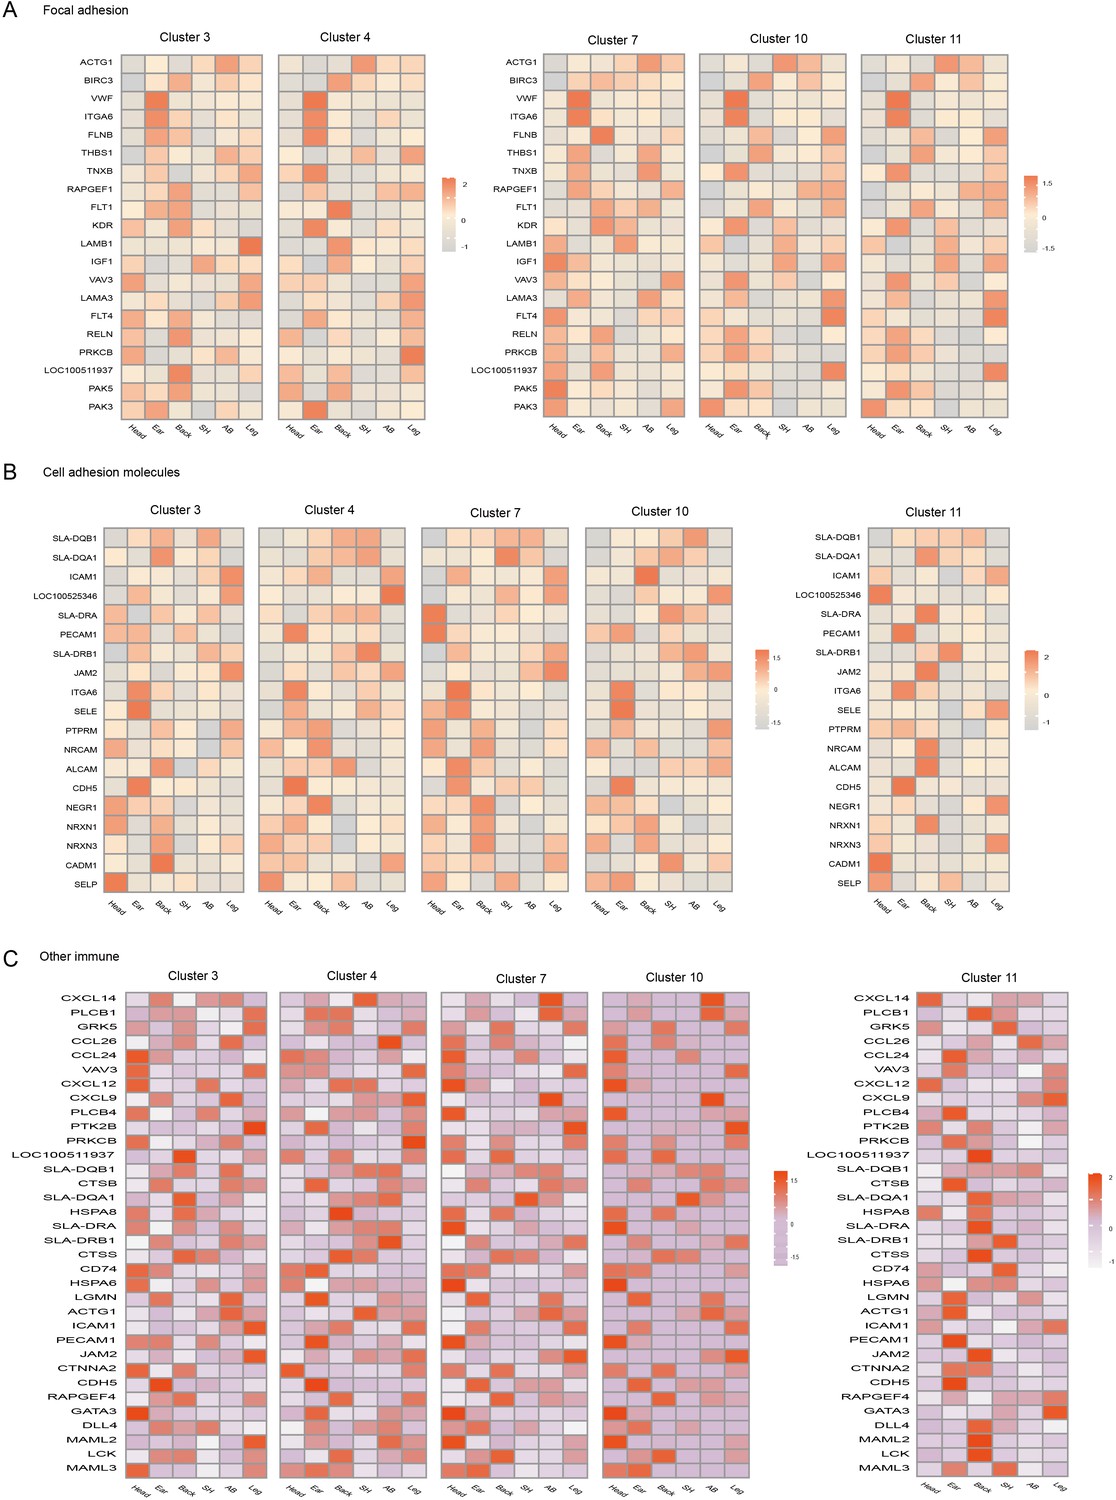
Heterogeneity of skin endothelial cells (ECs) in different anatomical sites.
Heatmap of gene expression in focal adhesion pathway (A), cell adhesion molecule (B) pathway, and other immune pathways (C) among ECs subpopulations of different skin regions.
Figure 5 with 2 supplements
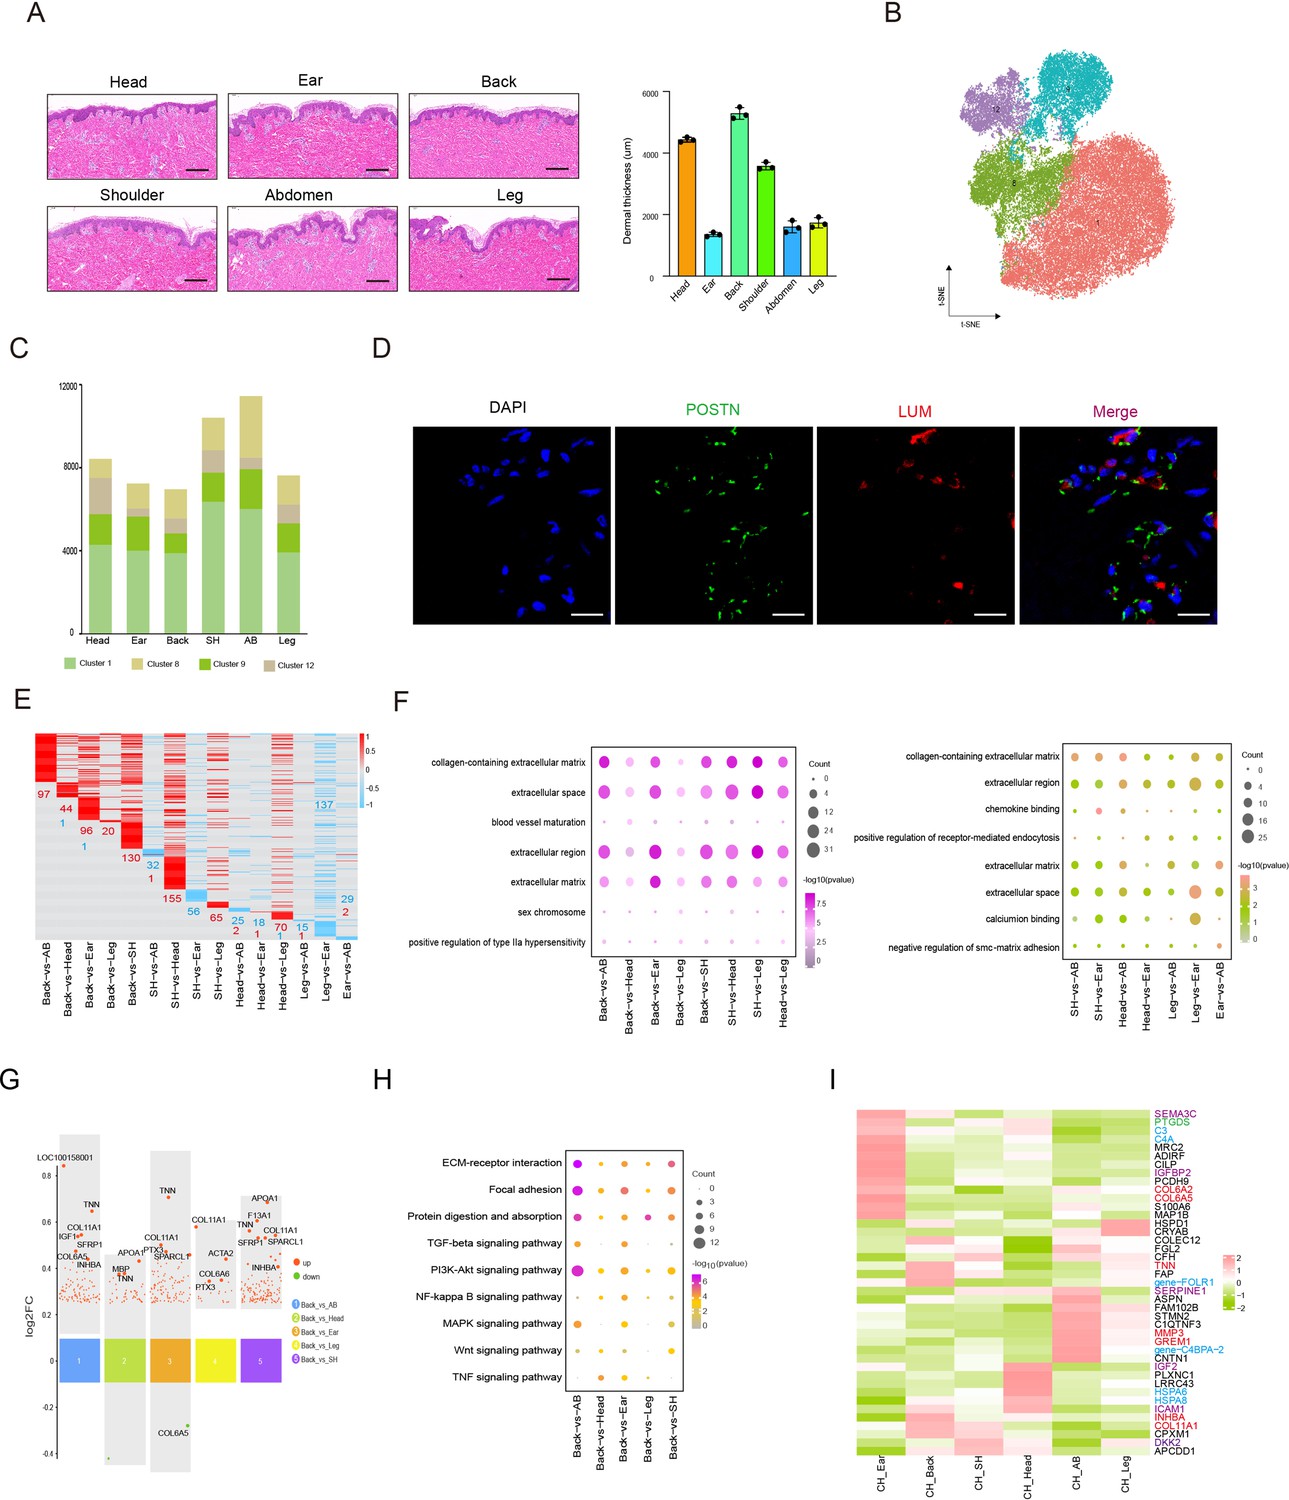
Heterogeneity of skin fibroblasts (FBs) in different anatomical sites.
(A) Skin section with HE staining (left) and dermal thickness of six different sites (right) including head, ear, back, shoulder, abdomen, and leg. Scale bar = 100 μm. n = 3. (B) The t-SNE plot showing FBs populations. (C) The cell number of FBs populations in different skin regions. (D) Images showing immunofluorescence staining of POSTN (green) and LUM (red) in back skin sections, representative markers of FBs. Scale bar = 50 μm. n = 3. (E) Heatmap of differentially expressed genes (DEGs) for FBs in multiple compared groups. Red represents upregulated genes, and blue represents downregulated genes. (F) The enriched Gene Ontology (GO) term of FBs in multiple compared groups. (G) Multiple volcanic maps showing the DEGs of compared groups in back skin compared to other locations. Representative genes are indicated. (H) Kyoto Encyclopedia of Genes and Genomes (KEGG) analysis of representative genes in image (G). (I) Gene expression signature divides FBs from six different skin regions by unsupervised hierarchical clustering. These genes involved in extracellular matrix (ECM) synthesis (red), cell signaling guidance (purple), metabolism (green), and human diseases (blue) are labeled by the related colors.
-
Figure 5—source data 1
Source data of the differentially expressed genes of fibroblasts (FBs) in multiple compared groups in Figure 5E.
- https://cdn.elifesciences.org/articles/86504/elife-86504-fig5-data1-v1.xlsx
Figure 5—figure supplement 1
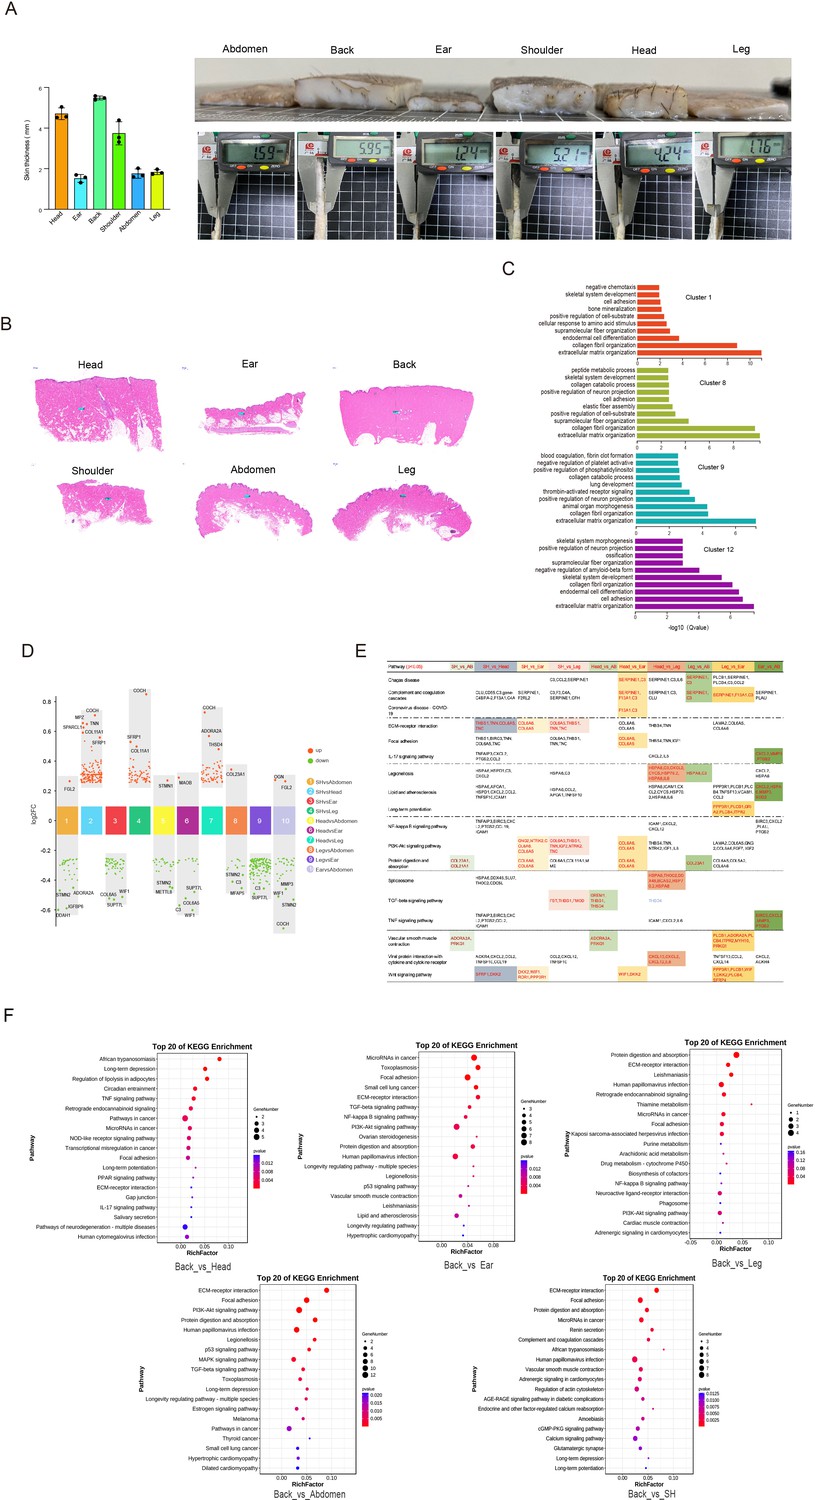
Heterogeneity of skin fibroblasts (FBs) in different anatomical sites.
(A) The skin specimens and thickness of different sites. Left is skin thickness, and right is skin specimens. (B) Skin sections of different regions. Scar bar = 1000 μm. n = 3. (C) The enriched Gene Ontology (GO) terms for biological process of each FBs subpopulation were sorted by q-value. (D) Multiple volcano maps showing differentially expressed genes (DEGs) of multiple compared groups. Representative genes are indicated. (E) Significant pathways of multiple compared groups. (F) Kyoto Encyclopedia of Genes and Genomes (KEGG) analysis of back skin compared with other regions.
Figure 5—figure supplement 2
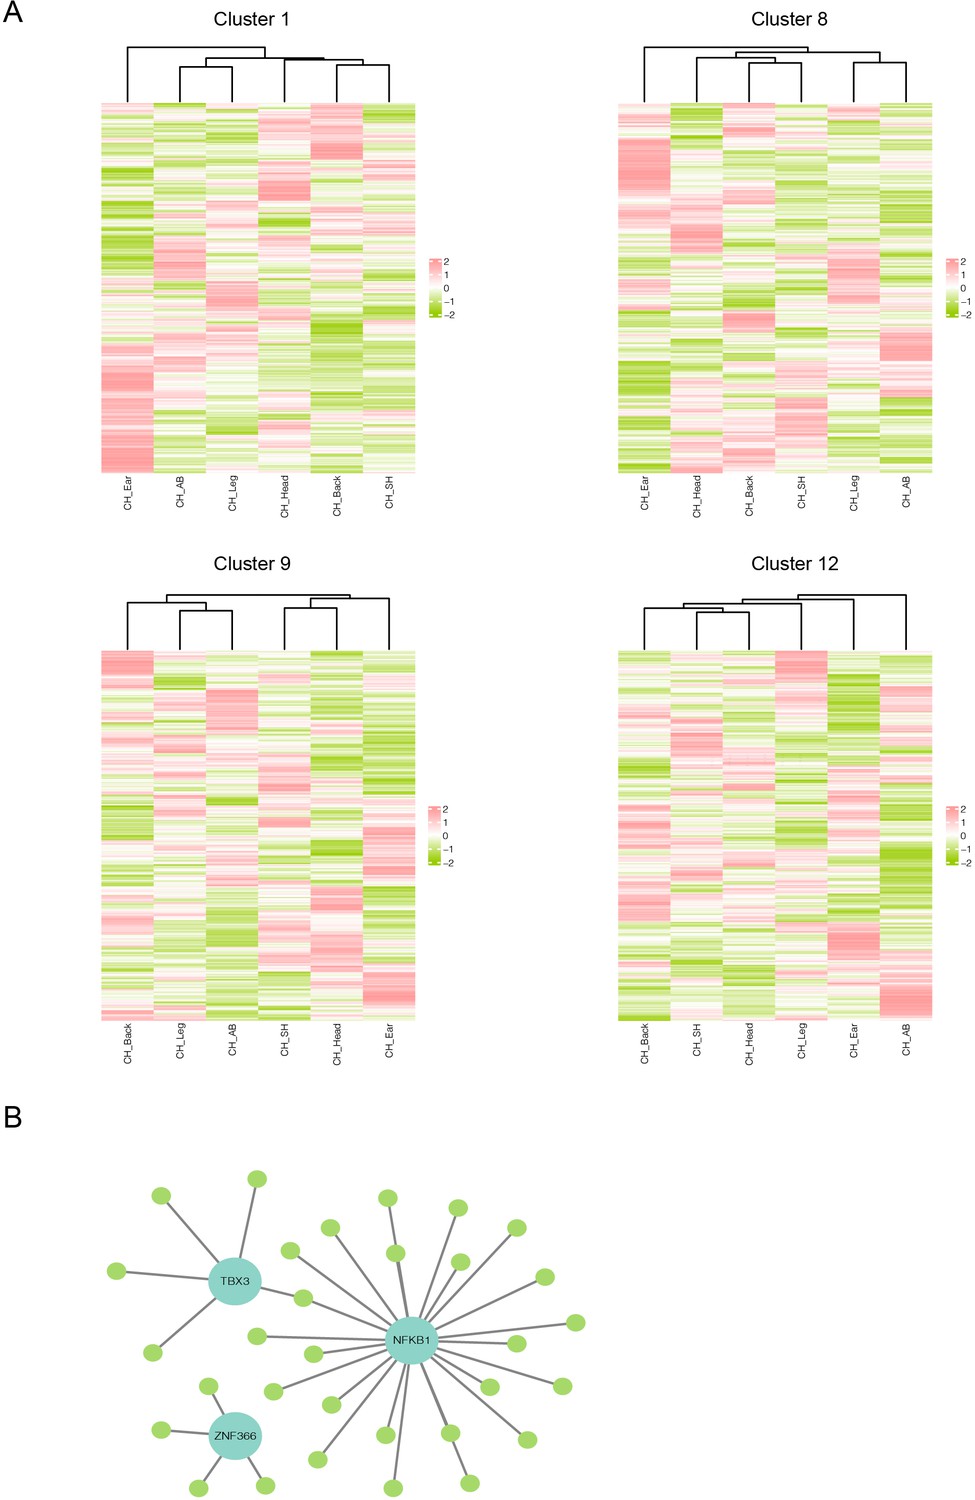
Heterogeneity of skin fibroblasts (FBs) in different anatomical sites.
(A) Unsupervised hierarchical clustering showing the transcriptional profile of 417 differentially expressed genes (DEGs) in clusters 1, 8, 9, and 12 of FBs. (B) Regulatory network of DEGs of FBs of different skin regions. Blue nodes represent regulators, and green nodes represent the target genes of regulators.
Figure 6 with 1 supplement
Heterogeneity of skin cells in different pig populations.
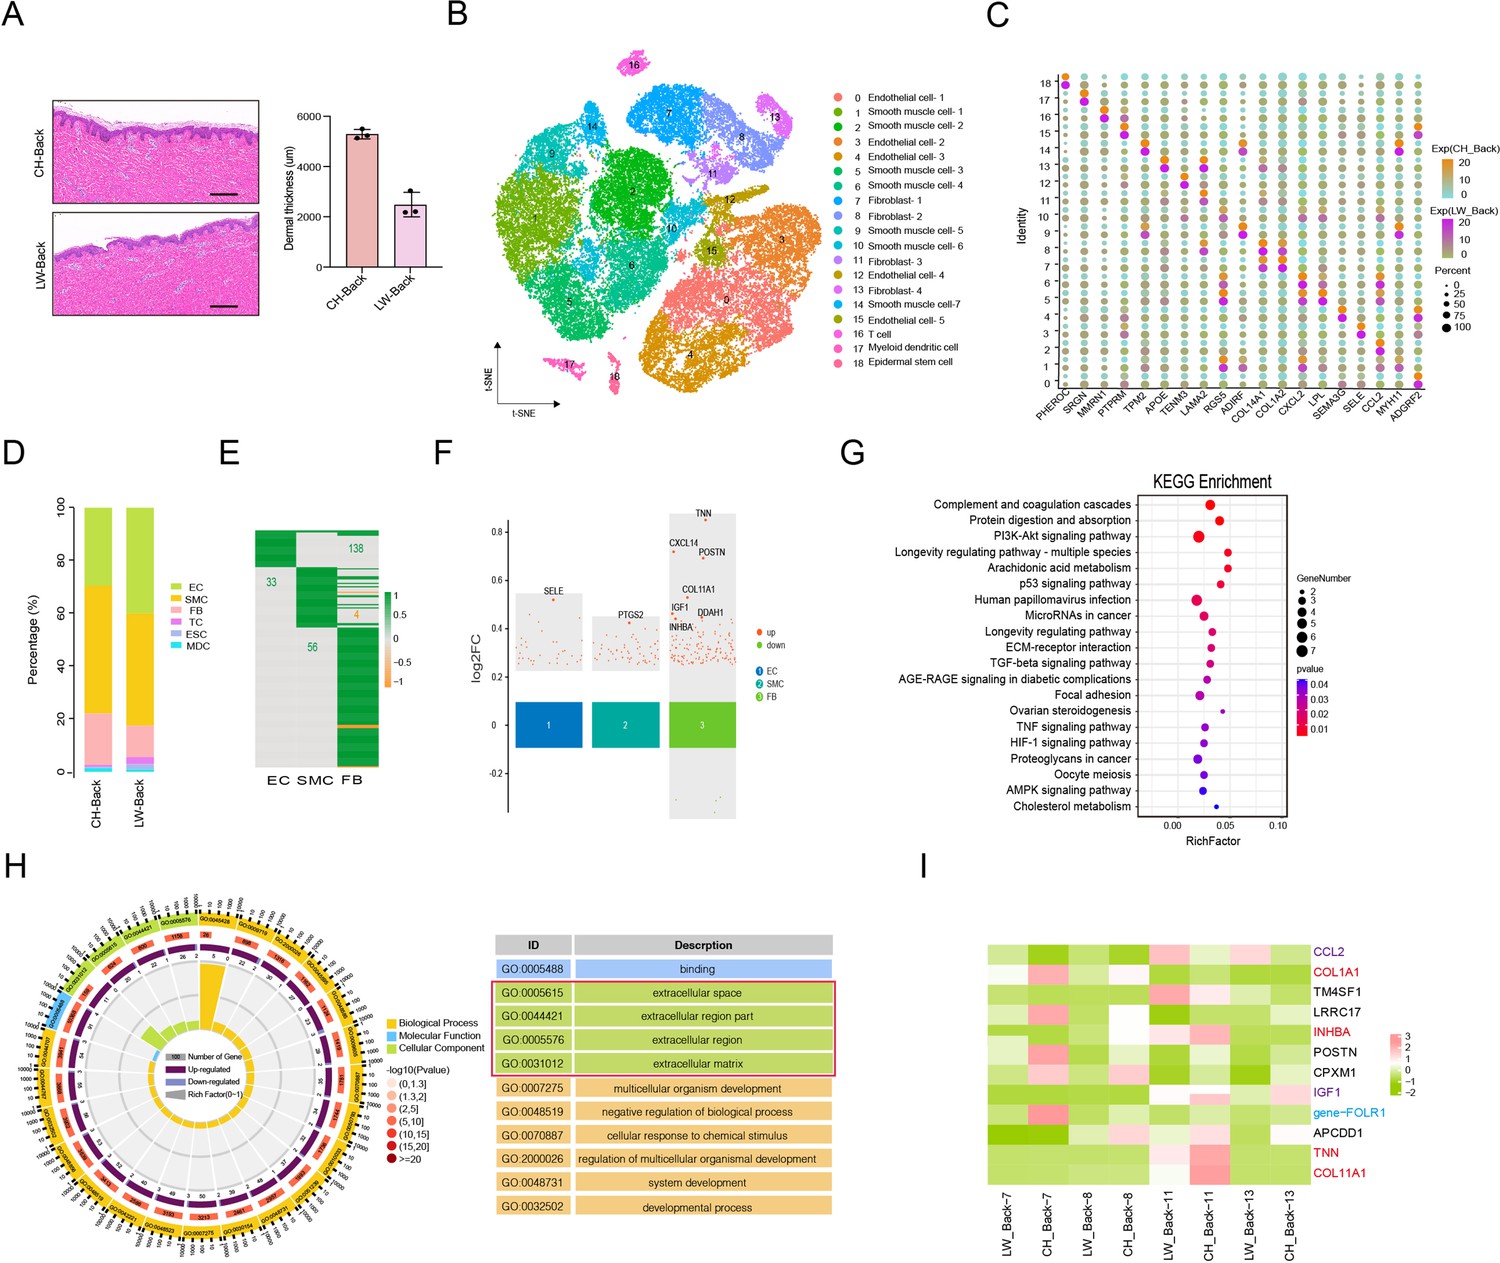
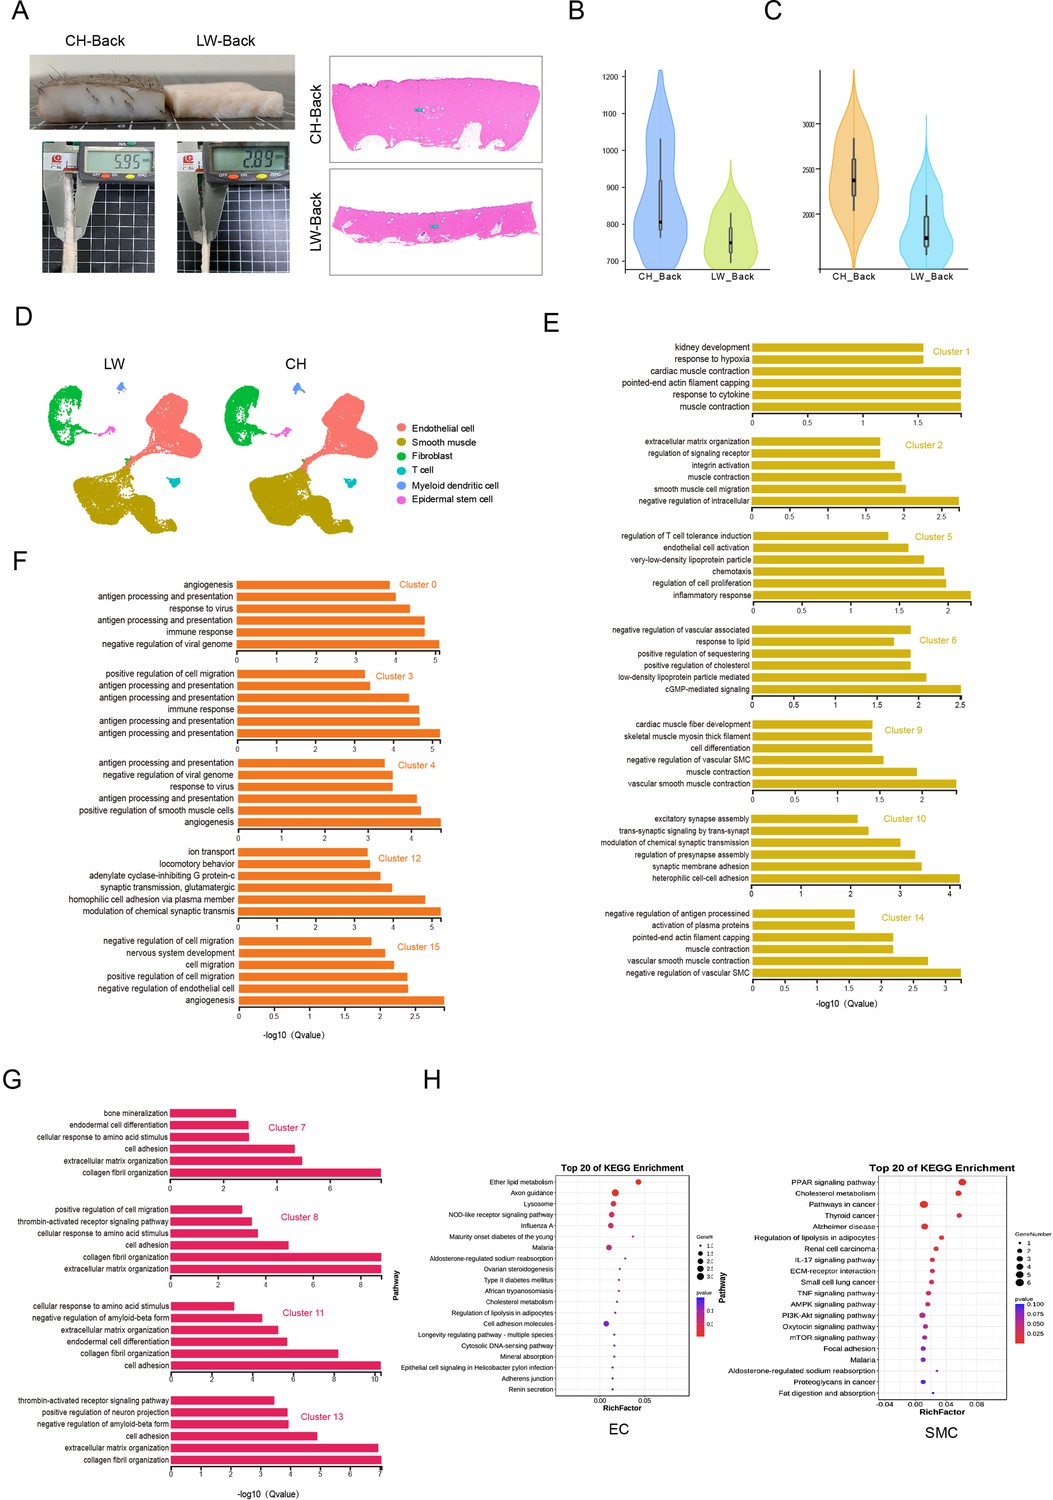
(A) Skin section with HE staining (left) and dermal thickness of back skin between Chenghua (CH) and large white (LW) pig (right). Scale bar = 100 μm. n = 3. (B) The t-SNE plot visualization of all clusters of annotated cell types between CH and LW pigs. (C) Representative genes of each cluster of skin cells between CH and LW pigs. Color represents the gene expression, and circle represents the percentage of cells. (D) The distribution of cell types between CH and LW pig skin tissues. (E) Heatmap of differentially expressed genes (DEGs) for smooth muscle cells (SMCs), endothelial cells (ECs), and fibroblasts (FBs). Green represents upregulated genes, and orange represents downregulated genes. (F) Multiple volcano maps of DEGs for SMCs, ECs, and FBs. Representative genes are indicated. (G) Kyoto Encyclopedia of Genes and Genomes (KEGG) analysis of DEGs for FBs. (H) Gene Ontology (GO) term of DEGs for FBs. Red region is the most enriched GO terms. (I) Gene expression signature divides FBs from back skin of CH and LW pigs by unsupervised hierarchical clustering. These genes involved in ECM synthesis (red), cell signaling guidance (purple), and human diseases (blue) are labeled by the related colors.
-
Figure 6—source data 1
Source data of marker genes for each cluster in Figure 6C.
- https://cdn.elifesciences.org/articles/86504/elife-86504-fig6-data1-v1.xlsx
-
Figure 6—source data 2
Source data of the differentially expressed genes of smooth muscle cells (SMCs), endothelial cells (ECs), and fibroblasts (FBs) in the compared group in Figure 6E.
- https://cdn.elifesciences.org/articles/86504/elife-86504-fig6-data2-v1.xlsx
Figure 6—figure supplement 1
Heterogeneity of skin cells in different pig populations.
(A) Skin specimens and sections of Chenghua (CH) and large white (LW) pig. Left is skin specimens, and right is skin sections. Scar bar = 1000 μm. n = 3. (B) Violin plot showing the number of genes detected from CH and LW pig skin. (C) Violin plot showing the unique molecular identifier (UMI) count detected from CH and LW pig skin. (D) UMAP visualization of cell types in CH and LW pig skin. (E–G) The enriched Gene Ontology (GO) terms pertaining to biological processes for each subpopulation of smooth muscle cells (SMCs), endothelial cells (ECs), and fibroblasts (FBs) were sorted by q-value. (H) Kyoto Encyclopedia of Genes and Genomes (KEGG) analysis of differentially expressed genes (DEGs) from ECs and SMCs between CH and LW pigs.
Figure 7 with 1 supplement
Signaling crosstalk among various cell types in skin.
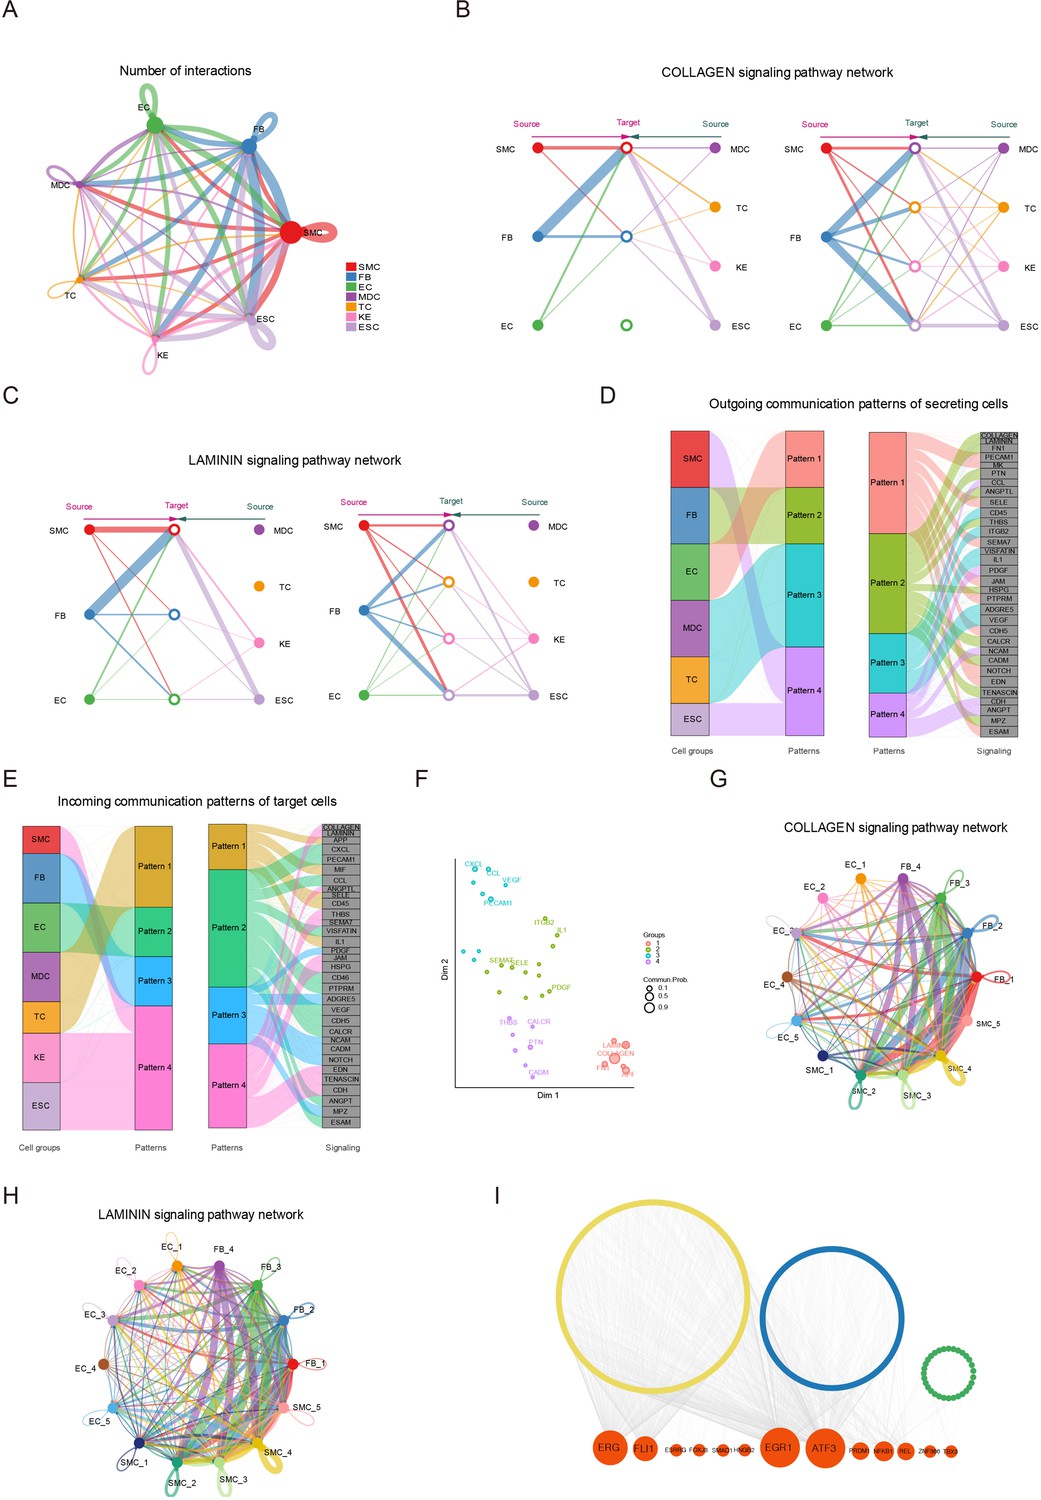
(A) Circle plot representing the cell communication among cell types. Circle sizes represent the number of cells, and edge width represents the communication probability. Hierarchical plot showing the intercellular communication network for the COLLAGEN (B)/LAMININ (C) signaling pathways. Circle sizes represent the number of cells, and edge width represents communication probability. The inferred outgoing communication patterns (D) and incoming communication patterns (E) of secreting cells of Chenghua (CH) pig skin. (F) The distribution of signaling pathways with their functional similarity. The COLLAGEN (G)/LAMININ (H) signaling network among cell subpopulations of smooth muscle cells (SMCs), fibroblasts (FBs), and endothelial cells (ECs). Circle sizes represent the number of cells, and edge width represents communication probability. (I) Regulatory network of differentially expressed genes (DEGs) for SMCs, ECs, and FBs of different skin regions. Orange nodes represent regulators, and yellow/blue/green nodes represent the target genes of regulators.
-
Figure 7—source data 1
Cell communication of skin cells in Figure 7A.
- https://cdn.elifesciences.org/articles/86504/elife-86504-fig7-data1-v1.xlsx
Figure 7—figure supplement 1
Signaling crosstalk among various cell types in skin.
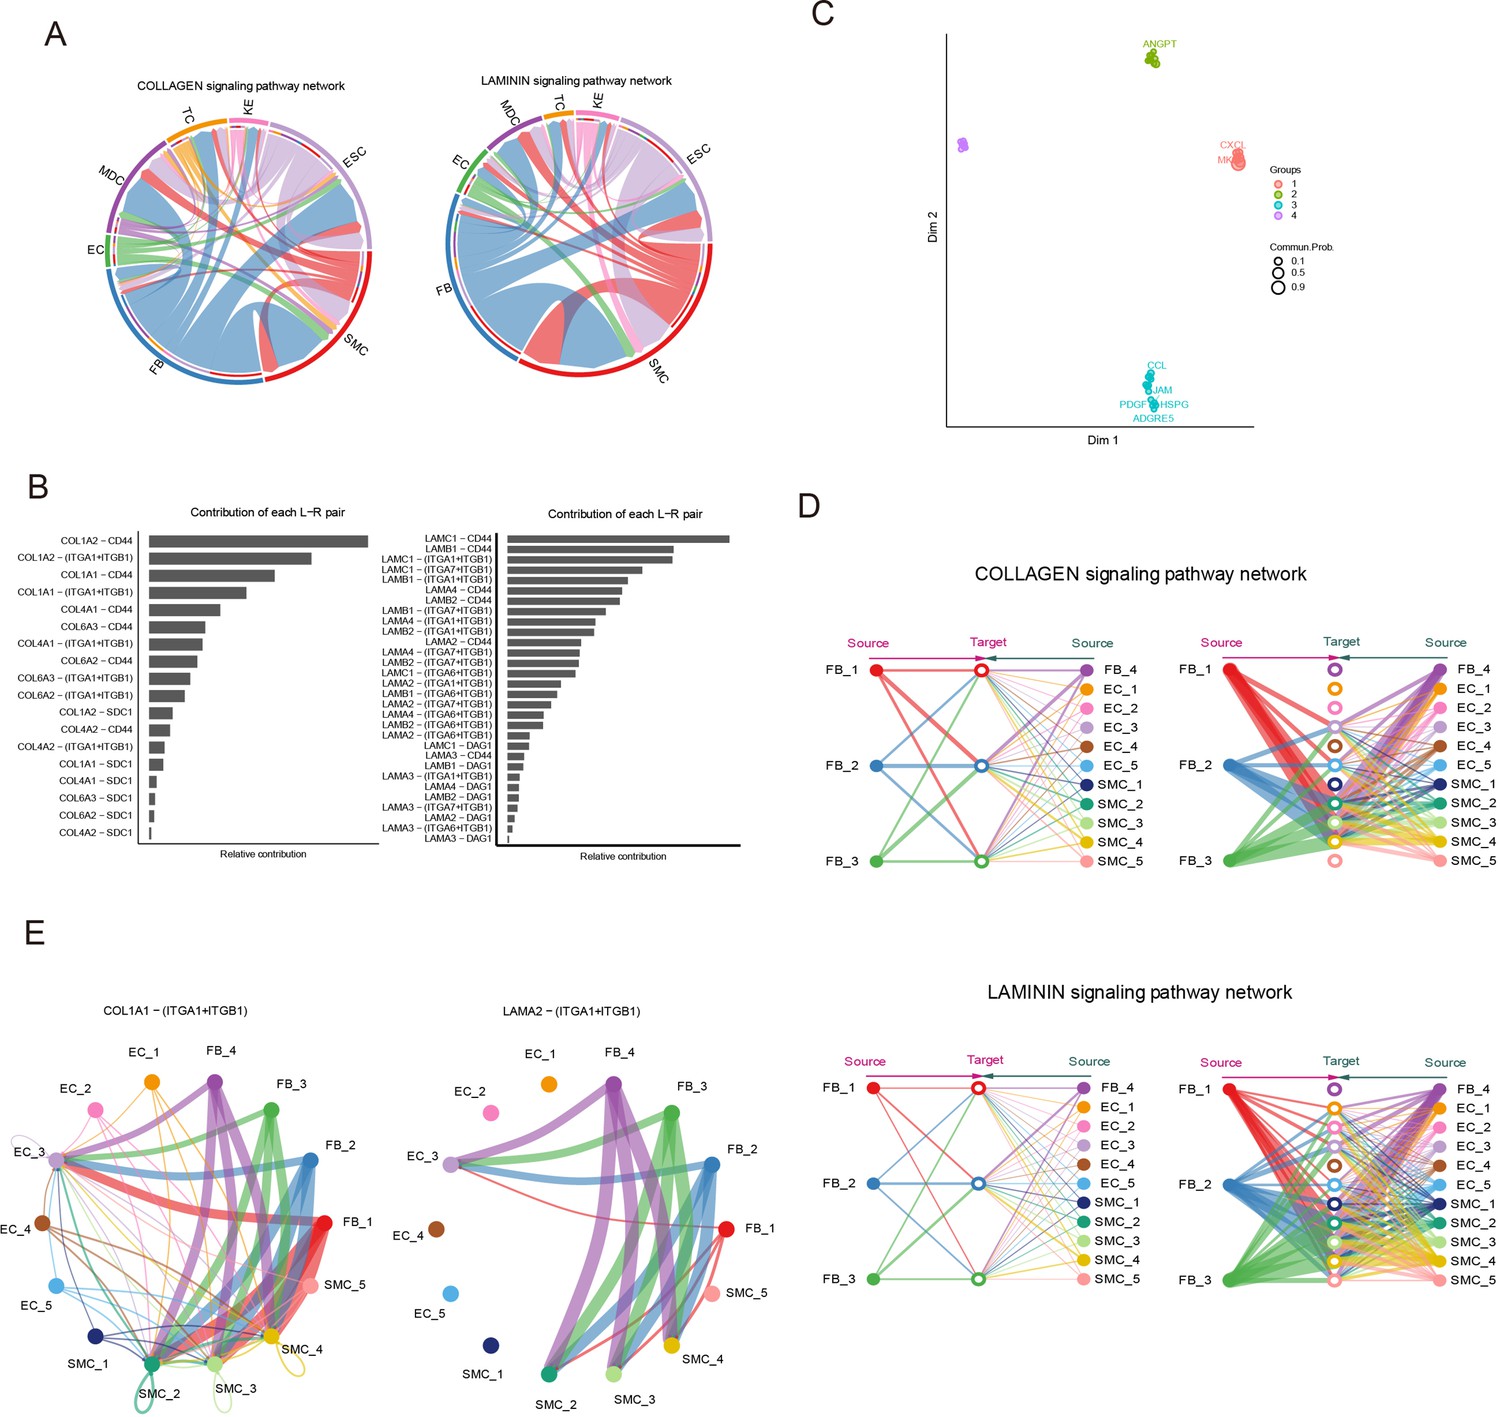
(A) Circle plot representing the cell communication among cell types in the COLLAGEN/LAMININ signaling pathways. Edge width represents communication probability. (B) Relative contribution of each ligand–receptor pair of the COLLAGEN/LAMININ signaling pathway. (C) Projecting signaling pathways in a two-dimensional manifold based on their structural similarity. (D) Hierarchical plot showing the intercellular communication network of subpopulations of smooth muscle cells (SMCs), endothelial cells (ECs), and fibroblasts (FBs) for COLLAGEN/LAMININ signaling pathways. Circle sizes represent the number of cells, and edge width represents communication probability. (E) Circle plot representing the cell communication of the central ligand–receptor pair of the COLLAGEN/LAMININ signaling pathway in subpopulations of SMCs, ECs, and FBs.
Additional files
Download links
A two-part list of links to download the article, or parts of the article, in various formats.
Downloads (link to download the article as PDF)
Open citations (links to open the citations from this article in various online reference manager services)
Cite this article (links to download the citations from this article in formats compatible with various reference manager tools)
A single-cell transcriptome atlas of pig skin characterizes anatomical positional heterogeneity
eLife 12:e86504.
https://doi.org/10.7554/eLife.86504


