Single-cell RNA sequencing unravels the transcriptional network underlying zebrafish retina regeneration
- Technische Universität Dresden, CRTD - Center for Regenerative Therapies Dresden, Center for Molecular and Cellular Bioengineering (CMCB), Fetscherstraße, Germany
- Technische Universität Dresden, DRESDEN-Concept Genome Center, Center for Molecular and Cellular Bioengineering (CMCB), Fetscherstraße, Germany
Figures
Figure 1 with 3 supplements
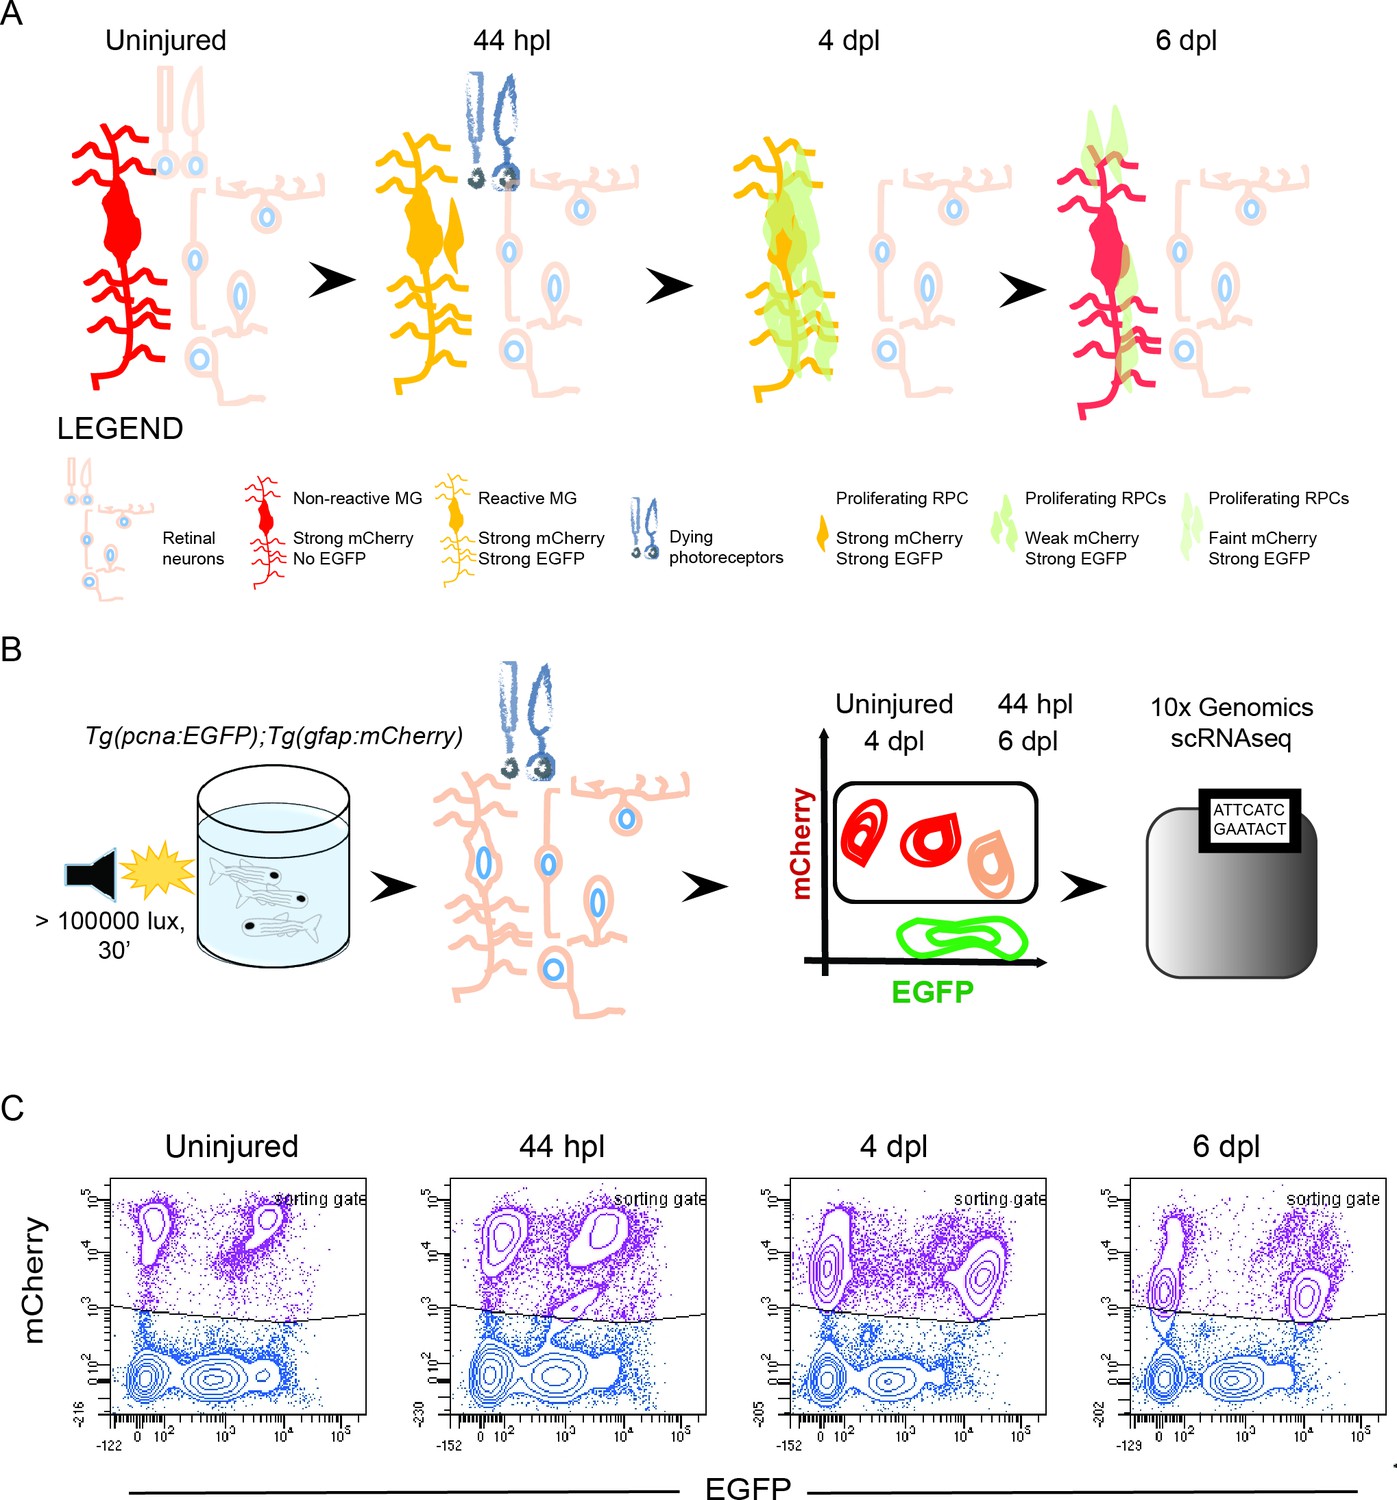
Isolation of individual MG, RPCs and regenerated progeny using fluorescent reporters.
(A) Schematic illustration of the rationale to isolate individual cells from regenerating retinae of double transgenic Tg(pcna:EGFP);Tg(gfap:mCherry) animals. In the uninjured retina, MG express strong levels of mCherry but no EGFP. Upon light lesion, which results in dying photoreceptors, MG turn on EGFP resulting in the presence of both fluorophores at 44 hours post lesion (hpl). At 4 days post lesion (dpl), MG remain to contain strong mCherry and EGFP levels. In contrast, further proliferating RPCs display weak mCherry but strong EGFP fluorescence. Finally, MG have lost the EGFP signal at 6 dpl, expressing mCherry only. RPCs, which start to migrate and differentiate, are still detectable but show diluted levels of mCherry and EGFP. (B) Schematic illustration of the workflow for the scRNAseq experiment. Uninjured control and light lesioned retinae (44 hpl, 4 dpl, 6 dpl) of double transgenic Tg(pcna:EGFP);Tg(gfap:mCherry) animals were dissociated to obtain a single cell suspension. Following fluorescent activated cell sorting of mCherry-positive only and EGFP/mCherry-double positive cells, individual cells were eventually subjected to droplet-based, 10 x Genomics scRNAseq. (C) Flow cytometry plots depicting EGFP and mCherry fluorescence of dissociated retinal cells at the indicated time points. Cells in the sorting gate include mCherry-positive only as well as mCherry/EGFP-double positive cells. Number of cells sorted from the sorting gate per time point: 15,000. Associated: Figure 1—figure supplements 1–3.
Figure 1—figure supplement 1
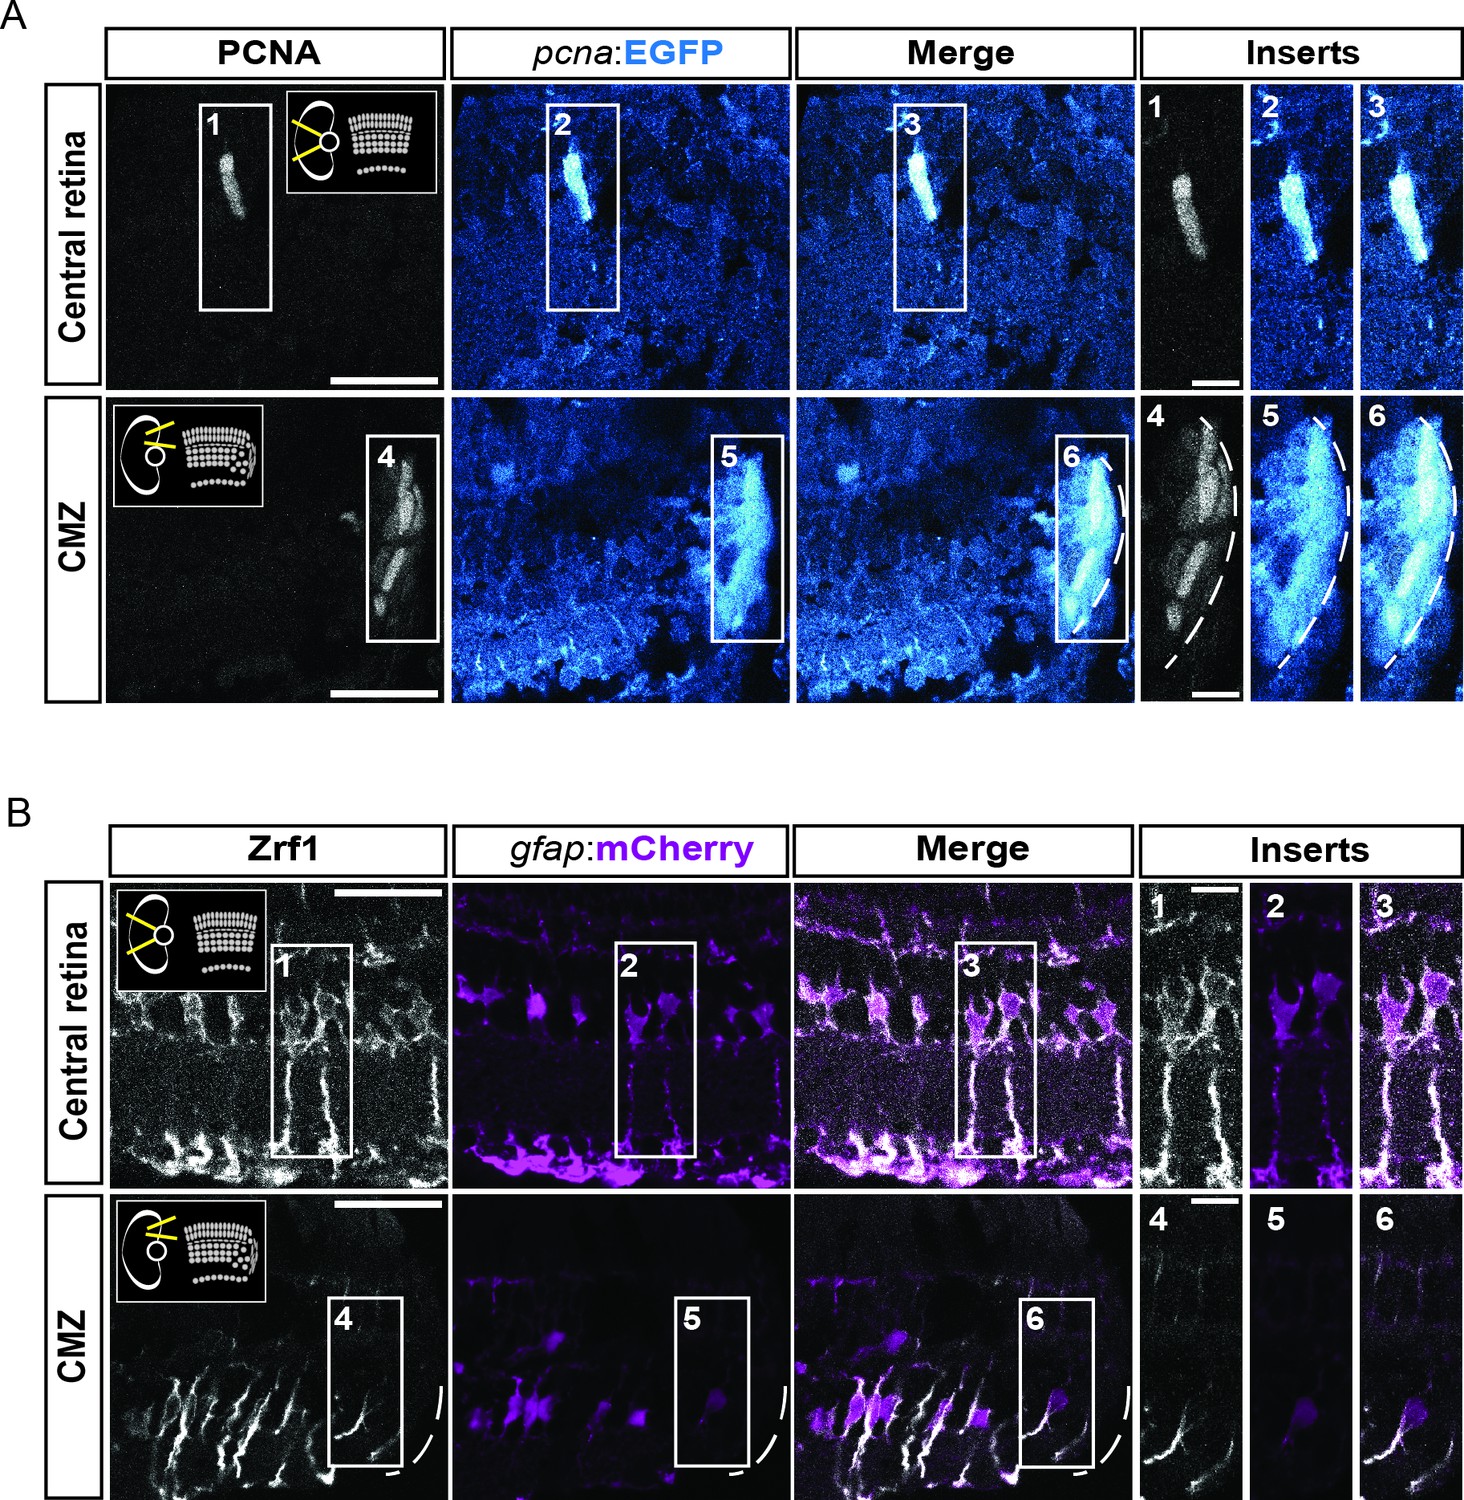
characterization of the fluorescent reporter lines Tg(pcna:EGFP) and Tg(gfap:mCherry) in double transgenic animals.
(A) Confocal images of immunohistochemistry against the proliferation marker PCNA (grey) and EGFP (blue) on retinal sections of Tg(pcna:EGFP);Tg(gfap:mCherry) animals. Schemes in the thumbnails on the top-right and top-left of the PCNA panels indicate the region of interest, either the central retina or the ciliary marginal zone (CMZ). N=3 fish. (B) Confocal images of immunohistochemistry detecting Zrf1-positive MG fibers (magenta) and mCherry on retinal sections of Tg(pcna:EGFP);Tg(gfap:mCherry) animals. N=3 fish. Scale bar: 30 µm for main panels, 10 µm for inserts.
Figure 1—figure supplement 2
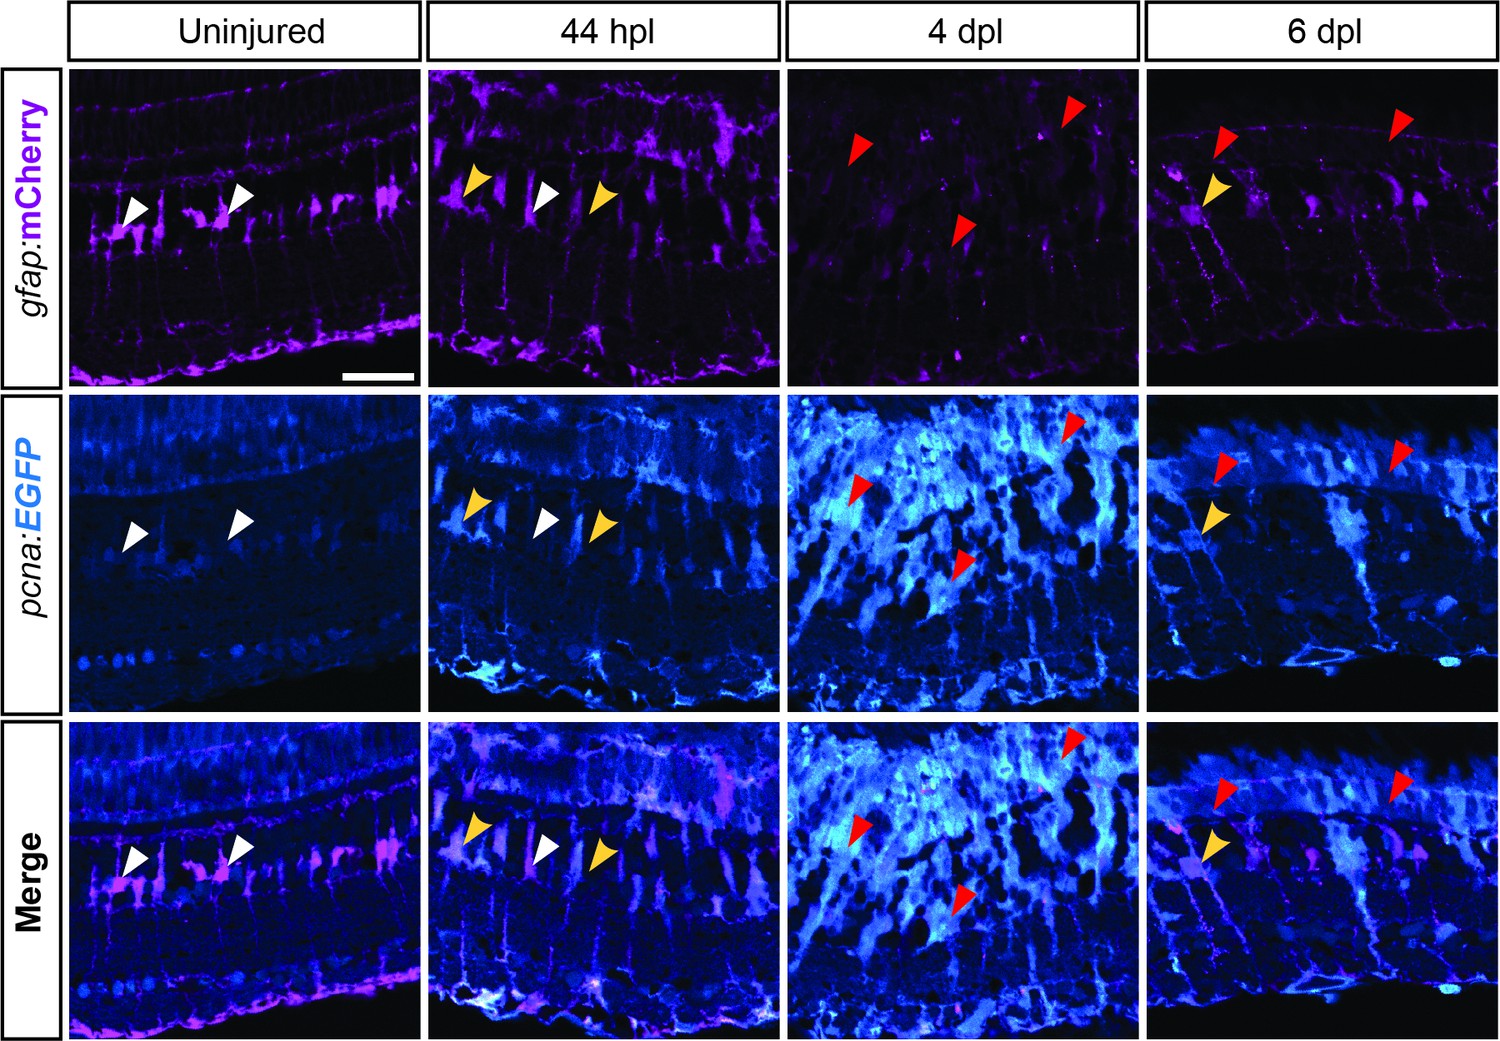
expression profile of Tg(pcna:EGFP);Tg(gfap:mCherry) during retina regeneration.
Apotome images showing endogenous immunofluorescence of EGFP and mCherry driven by Tg(pcna:EGFP) and Tg(gfap:mCherry) on retinal sections in uninjured as well as lesioned conditions at different time points. White arrowheads indicate mCherry-positive, EGFP-negative MG. Yellow arrowheads indicate mCherry-/EGFP-double positive MG. Red arrowheads indicate low-mCherry-/EGFP-double positive, putative RPCs. N=3 fish per time point and uninjured controls. Scale bar: 30 µm.
Figure 1—figure supplement 3

fluorescence activated cell sorting (FACS) and gating strategies.
(A) Flow cytometry plots of dissociated, uninjured retinae from Tg(pcna:EGFP);Tg(gfap:mCherry) fish and gating strategy for sorting calcein-positive cells. Plot 1 displays all the events in a single cell suspension according to the forward (x axis) and side scatter (y axis) areas. Among cells gated in 1, singlets (P2) were chosen by considering the area (x axis) and the height (y axis) of the forward scatter in 2. Height (x axis) and width (y axis) of the side scatter were plotted in 3 to further gate singlets among P2. Finally, only calcein-positive (i.e. living) cells were gated among singlets in 4. The gating strategy was the same for the uninjured as well as all lesioned samples. Samples consisted of single cell suspensions derived from 8 retinae of 4 fish (2 males and 2 females) each. (B) Flow cytometry plots showing EGFP and mCherry fluorescence of cells from WT, Tg(gfap:mCherry) and Tg(pcna:EGFP) dissociated retinae.
Figure 2 with 2 supplements
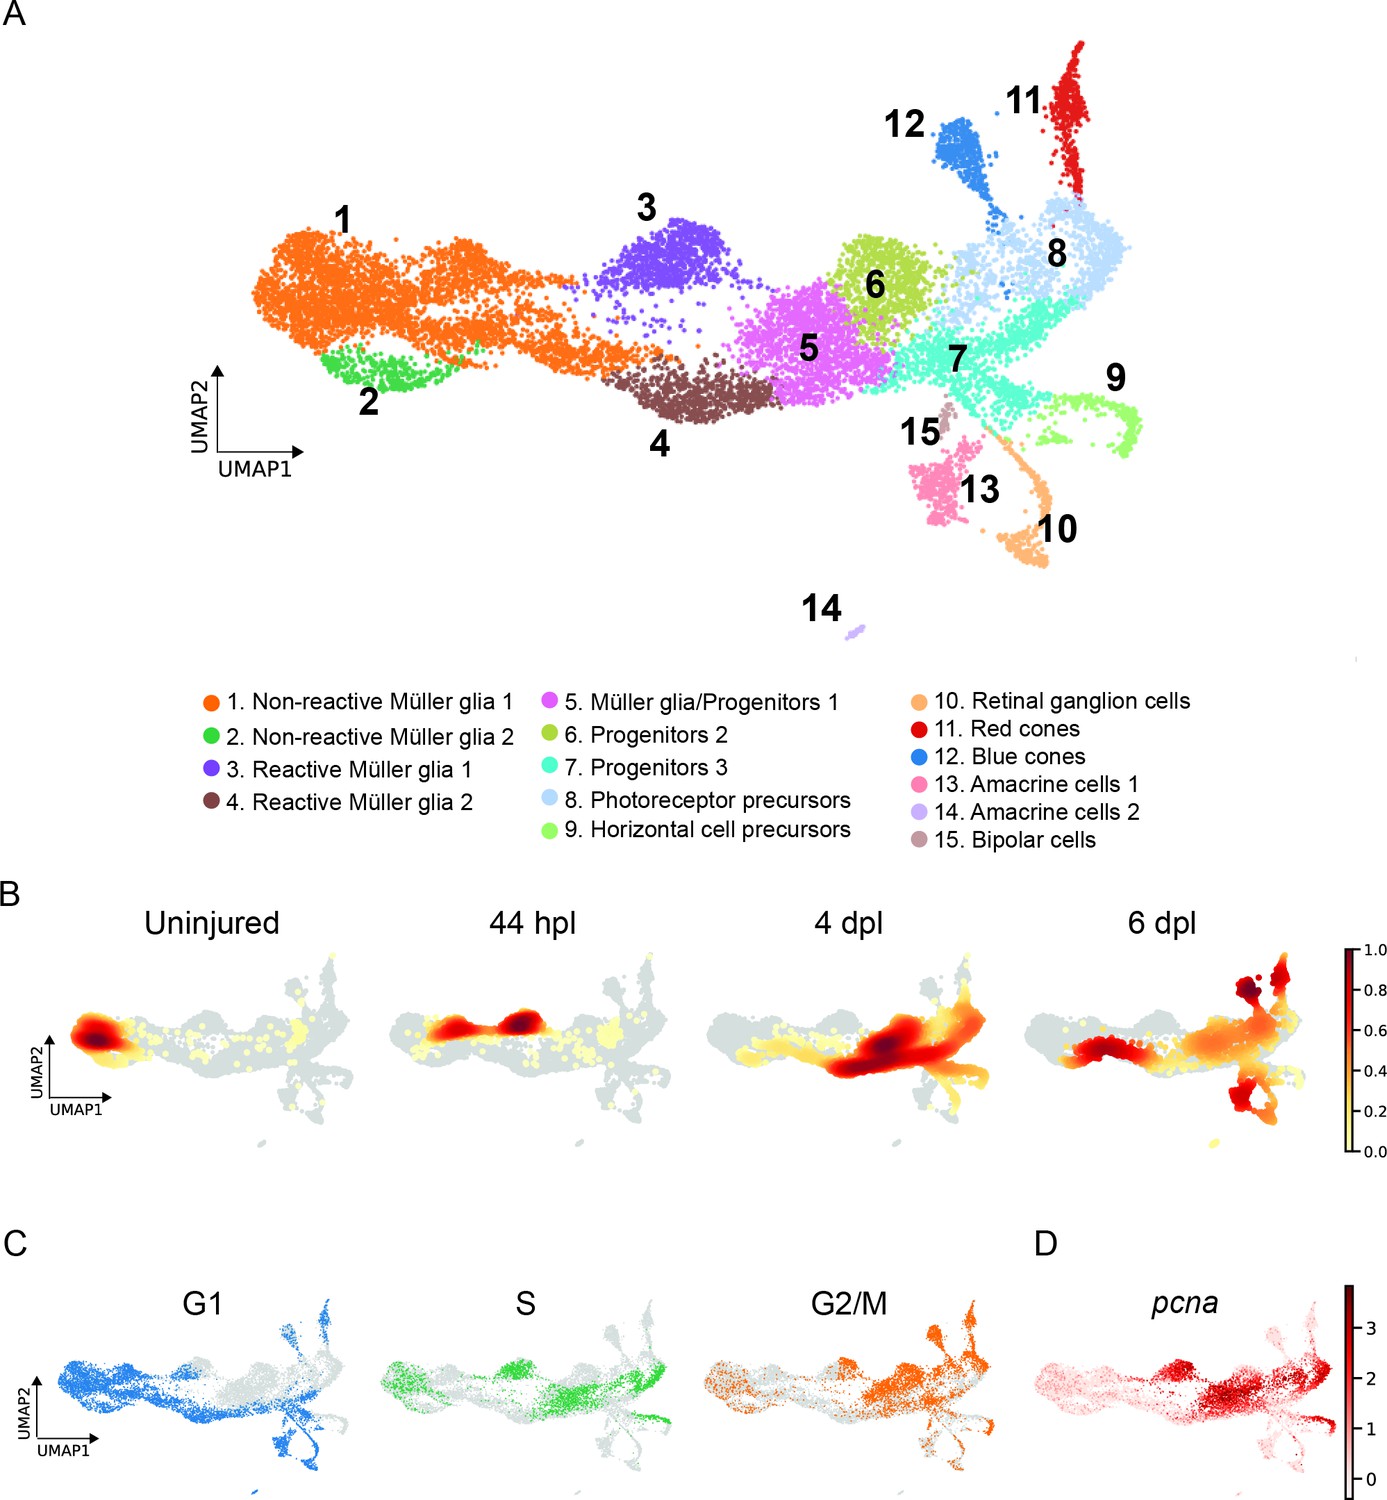
scRNAseq identifies 15 different cell populations in the light-lesioned retina.
(A) A total of 11,690 cells depicted on the uniform manifold approximation and projection (UMAP) map. From left to right, the map shows a progressive emergence of MG, RPCs and progeny clusters. See figure legend for the detailed information about cluster identity. (B) Normalized cell density on the UMAP for the four different samples (uninjured, 44 hpl, 4 and 6 dpl). Dark red shows strong cell enrichment and no color absence of cells. (C) Cells colored by cell cycle phases (G1, S, and G2/M phase in blue, green and orange, respectively). (D) Expression of pcna. Legend: logarithm of normalized counts per million. Associated: Figure 2—figure supplements 1 and 2.
Figure 2—figure supplement 1
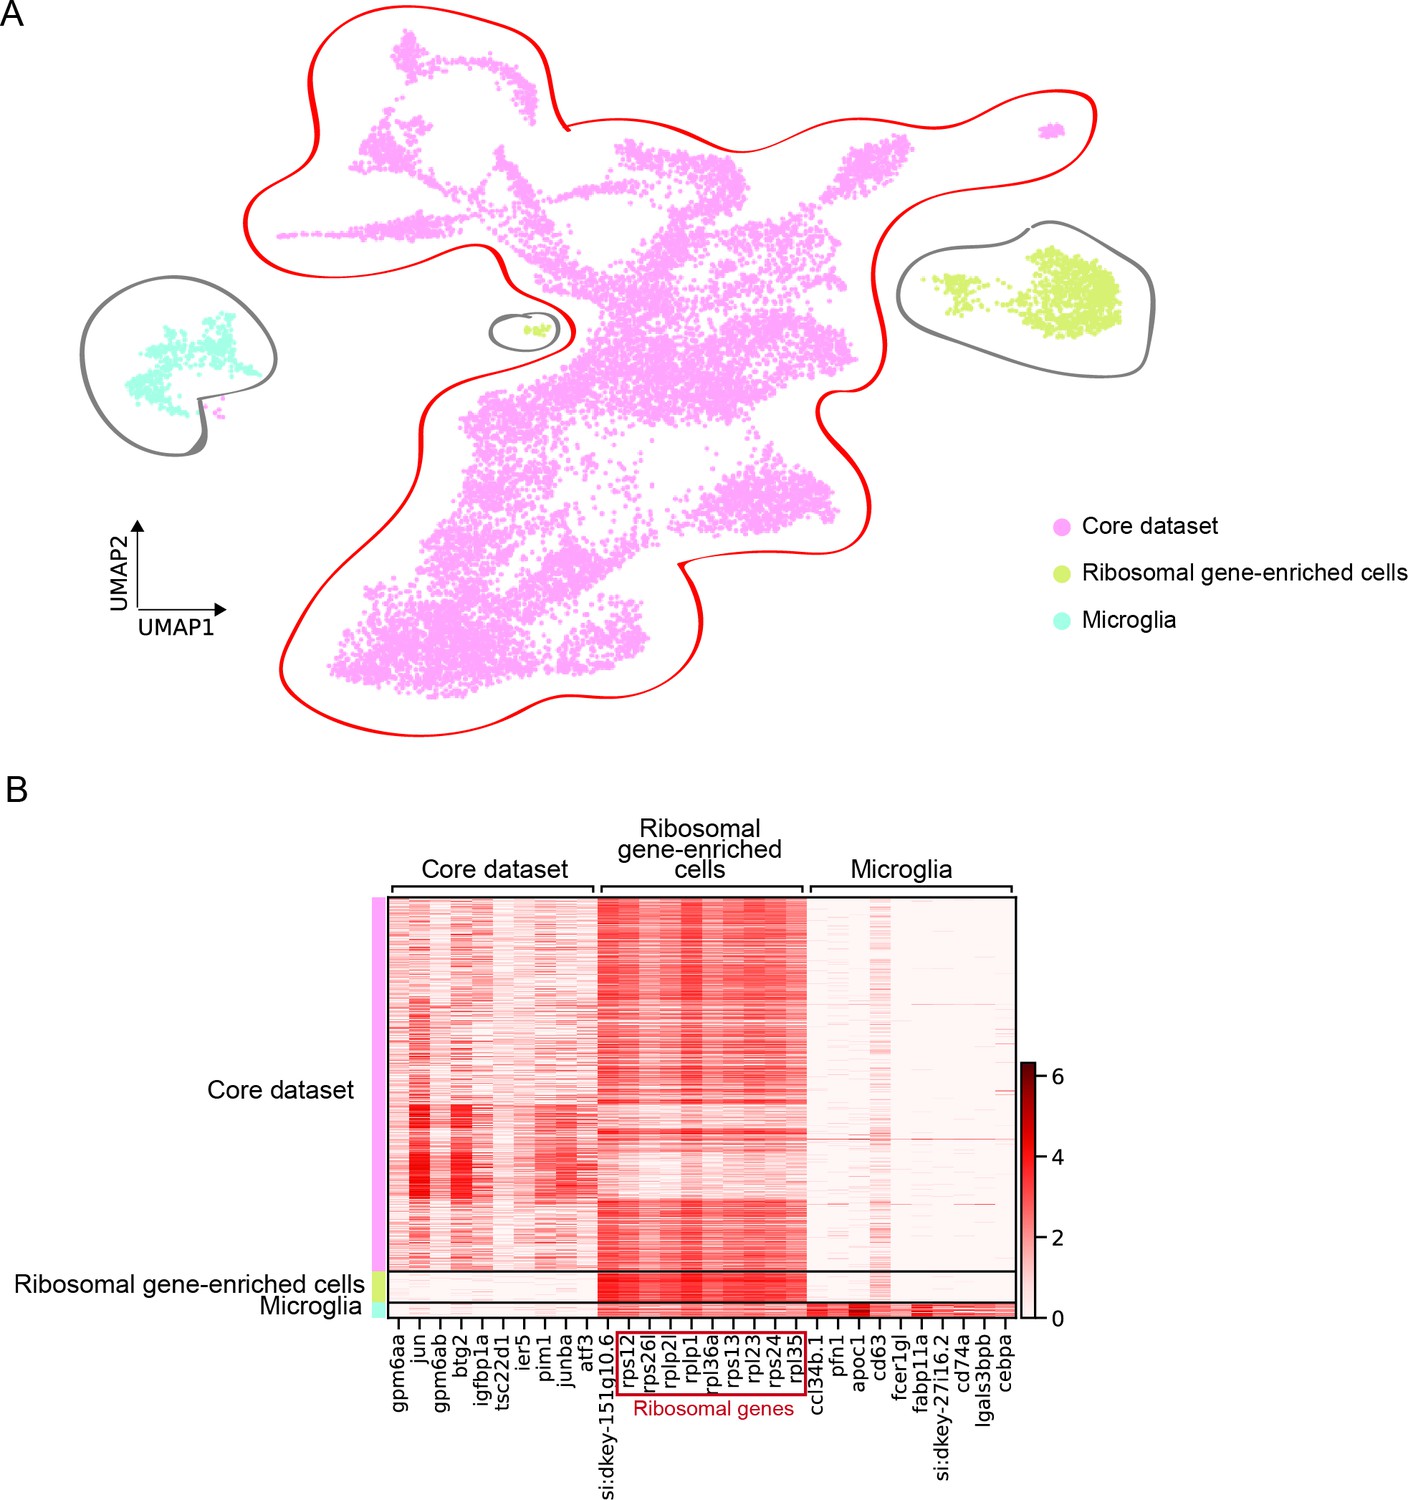
Original scRNAseq dataset.
(A) UMAP of the original scRNAseq dataset containing 13,139 cells and consisting of a core cluster (circled in red) and two clusters of microglia and ribosomal gene-enriched cells (circled in grey). (B) Heat map depicting the expression of the top 10 marker genes per cluster of the original dataset.
Figure 2—figure supplement 2
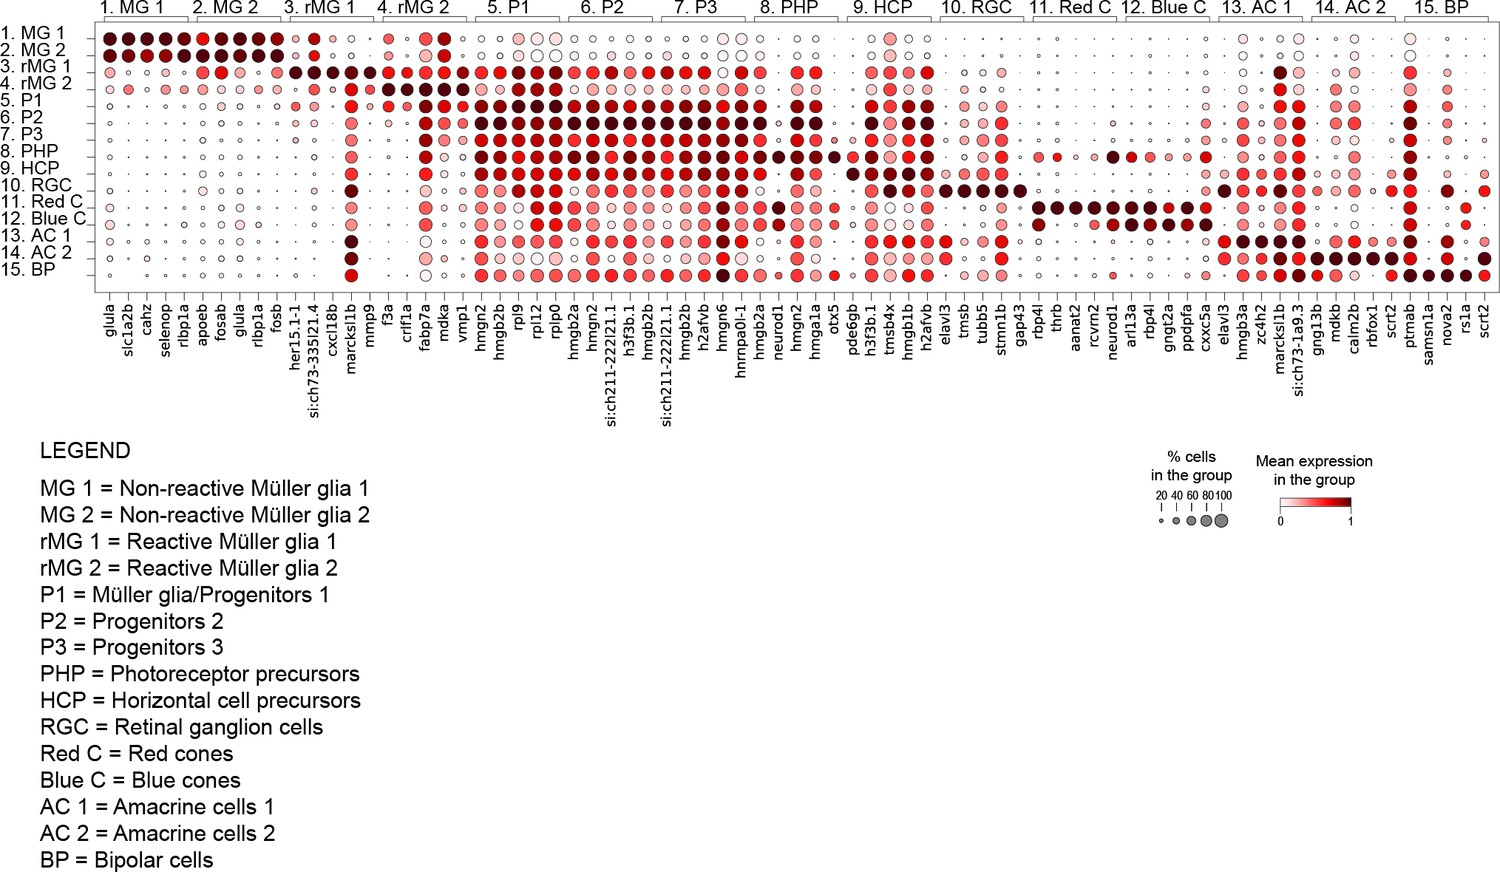
Dot plot of top 5 marker genes per cluster.
Dot plot depicting the expression of top 5 marker genes per cluster (see Figure 2A). Dot size scales with a fraction of cells expressing the gene, and the dot colour indicates the scaled mean gene expression in the cluster.
Figure 3 with 2 supplements
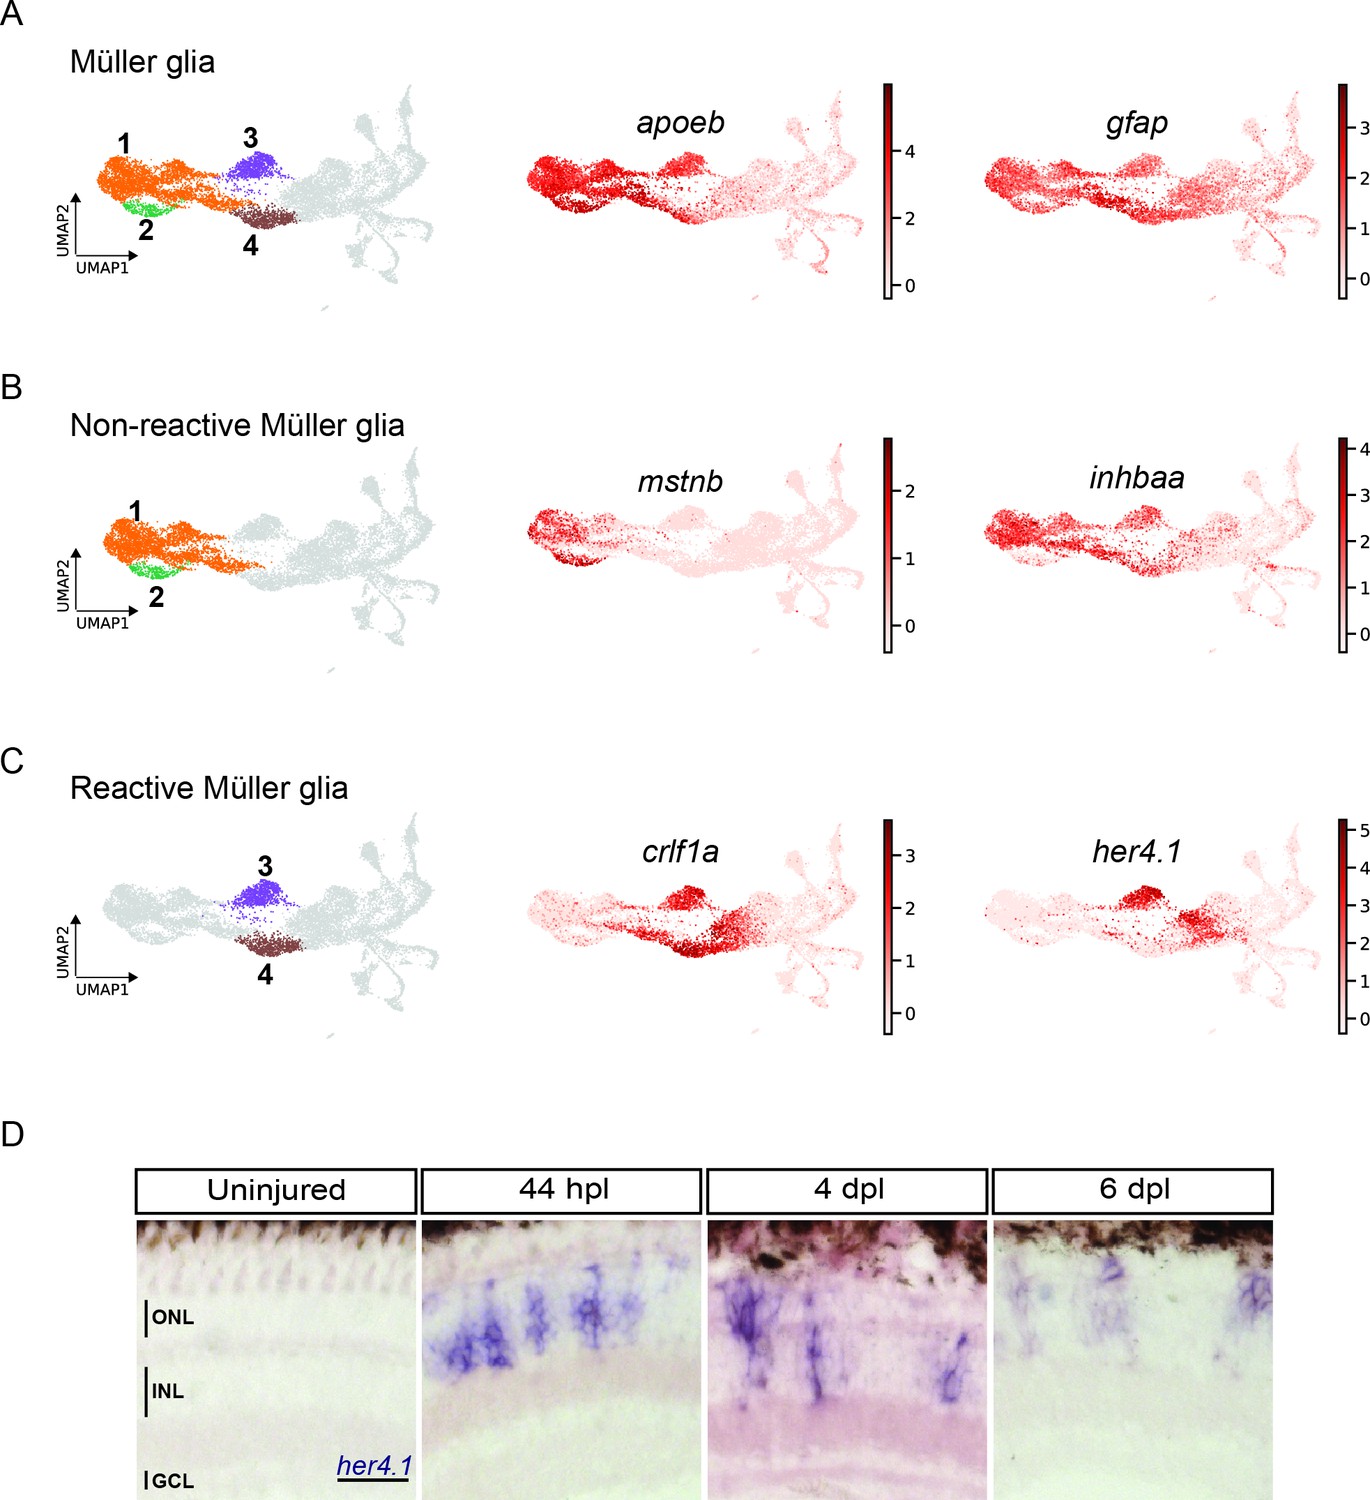
scRNAseq reveals heterogeneity in Müller glia and identifies two populations of non-reactive and two of reactive Müller glia in the light-lesioned retina.
(A) Four Müller glia clusters (cluster 1–4) and the expression levels of apoeb and gfap. (B) The two non-reactive Müller glia clusters (cluster 1 and 2) and the expression levels of mstnb and inhbaa. Cells of both clusters express mstnb, but only cells in cluster 1 expresses inhbaa. (C) Visualization of the two reactive Müller glia clusters (cluster 3 and 4) and the relative expression levels of crlf1a and her4.1 projected onto the main transcriptional UMAP. Cells of both clusters express crlf1a, but only cells in cluster 3 expresses her4.1. (D) Bright field microscopy images of chromogenic in situ hybridization detecting her4.1 on retinal sections of uninjured control animals and at 44 hr post lesion (hpl), 4 days post lesion (dpl) and 6 dpl. N=3 fish per time point and uninjured controls. The position of the outer nuclear layer (ONL), inner nuclear layer (INL) and ganglion cell layer (GCL) is indicated in the uninjured sample. Scale bar: 30 µm. Associated: Figure 3—figure supplements 1 and 2.
Figure 3—figure supplement 1
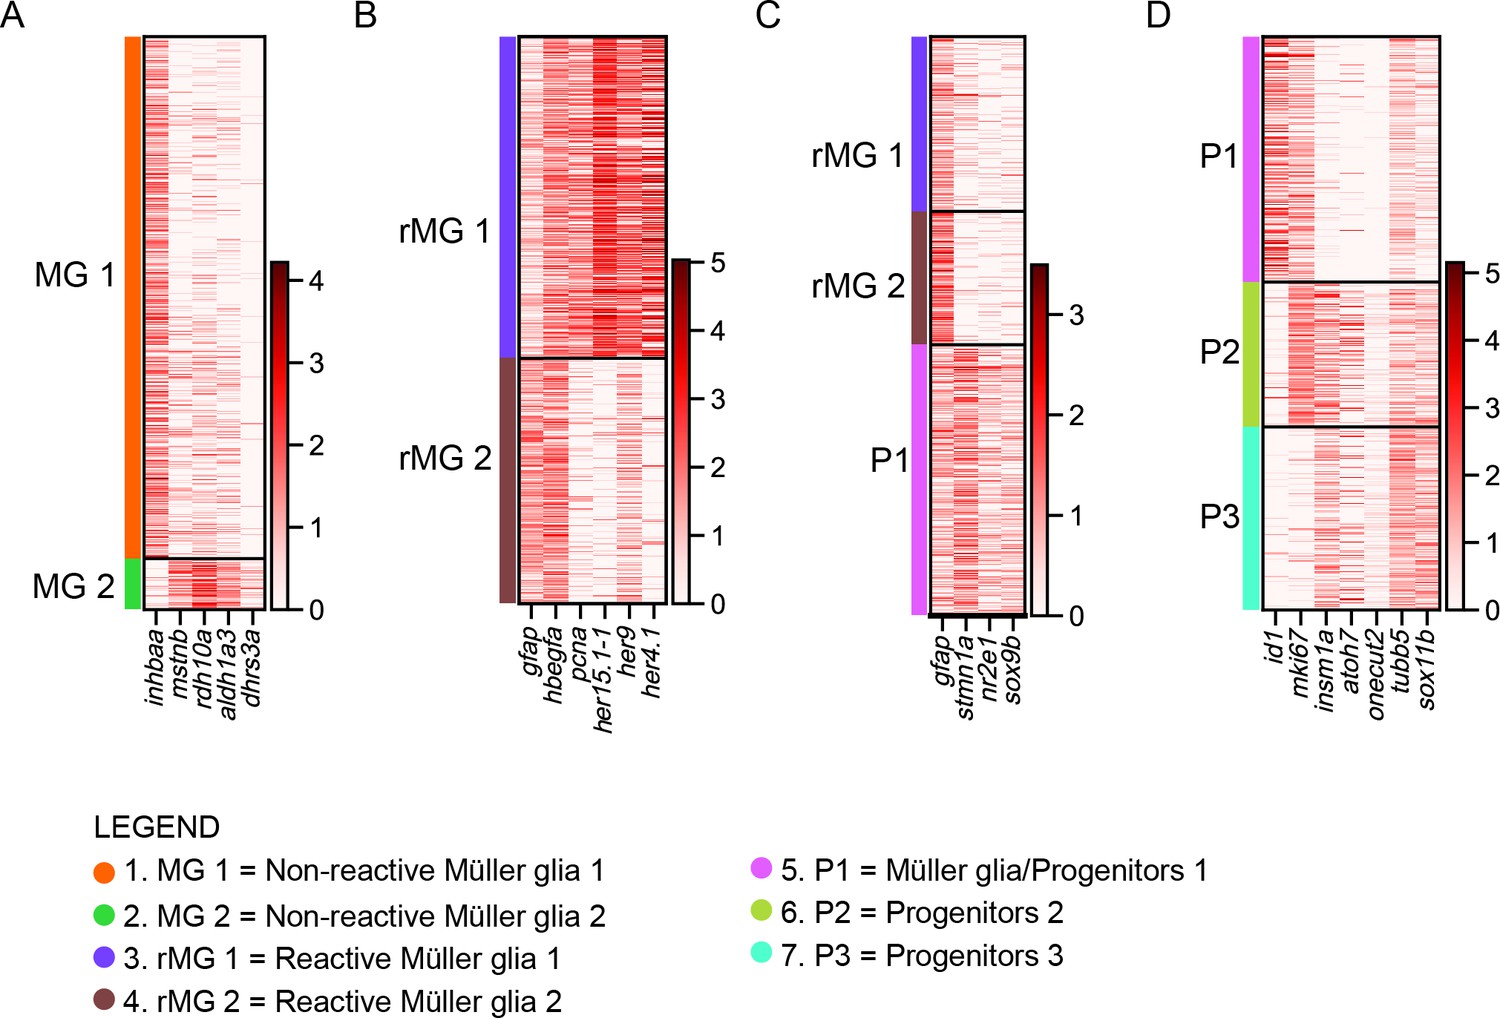
expression of selected genes per cluster.
(A) Heat map showing differentially expressed genes between non-reactive MG 1 and non-reactive MG 2. (B) Heat map showing differentially expressed genes (gfap, pcna, her15.1–1, her9, her4.1) as well as shared (hbegfa) genes between reactive MG 1 and reactive MG 2. (C) Heat map showing differentially expressed genes in reactive MG1, reactive MG2 and P1. (D) Heat map showing differentially expressed genes in P1, P2, and P3.
Figure 3—figure supplement 2

expression profile of stm during retina regeneration.
(A) Confocal images of fluorescent in situ hybridization for stm (grey) and immunohistochemistry detecting Zrf1-positive MG fibers (magenta) and the proliferation marker PCNA (green) on retinal sections of uninjured control animals and at 44 hours post lesion (hpl), 4 and 6 days post lesion (dpl). The yellow arrowhead at 44 hpl indicates a stm-, Zrf1- and PCNA-triple positive Müller glia. N=3 fish per time point and uninjured controls. Scale bar: 30 µm.
Figure 4
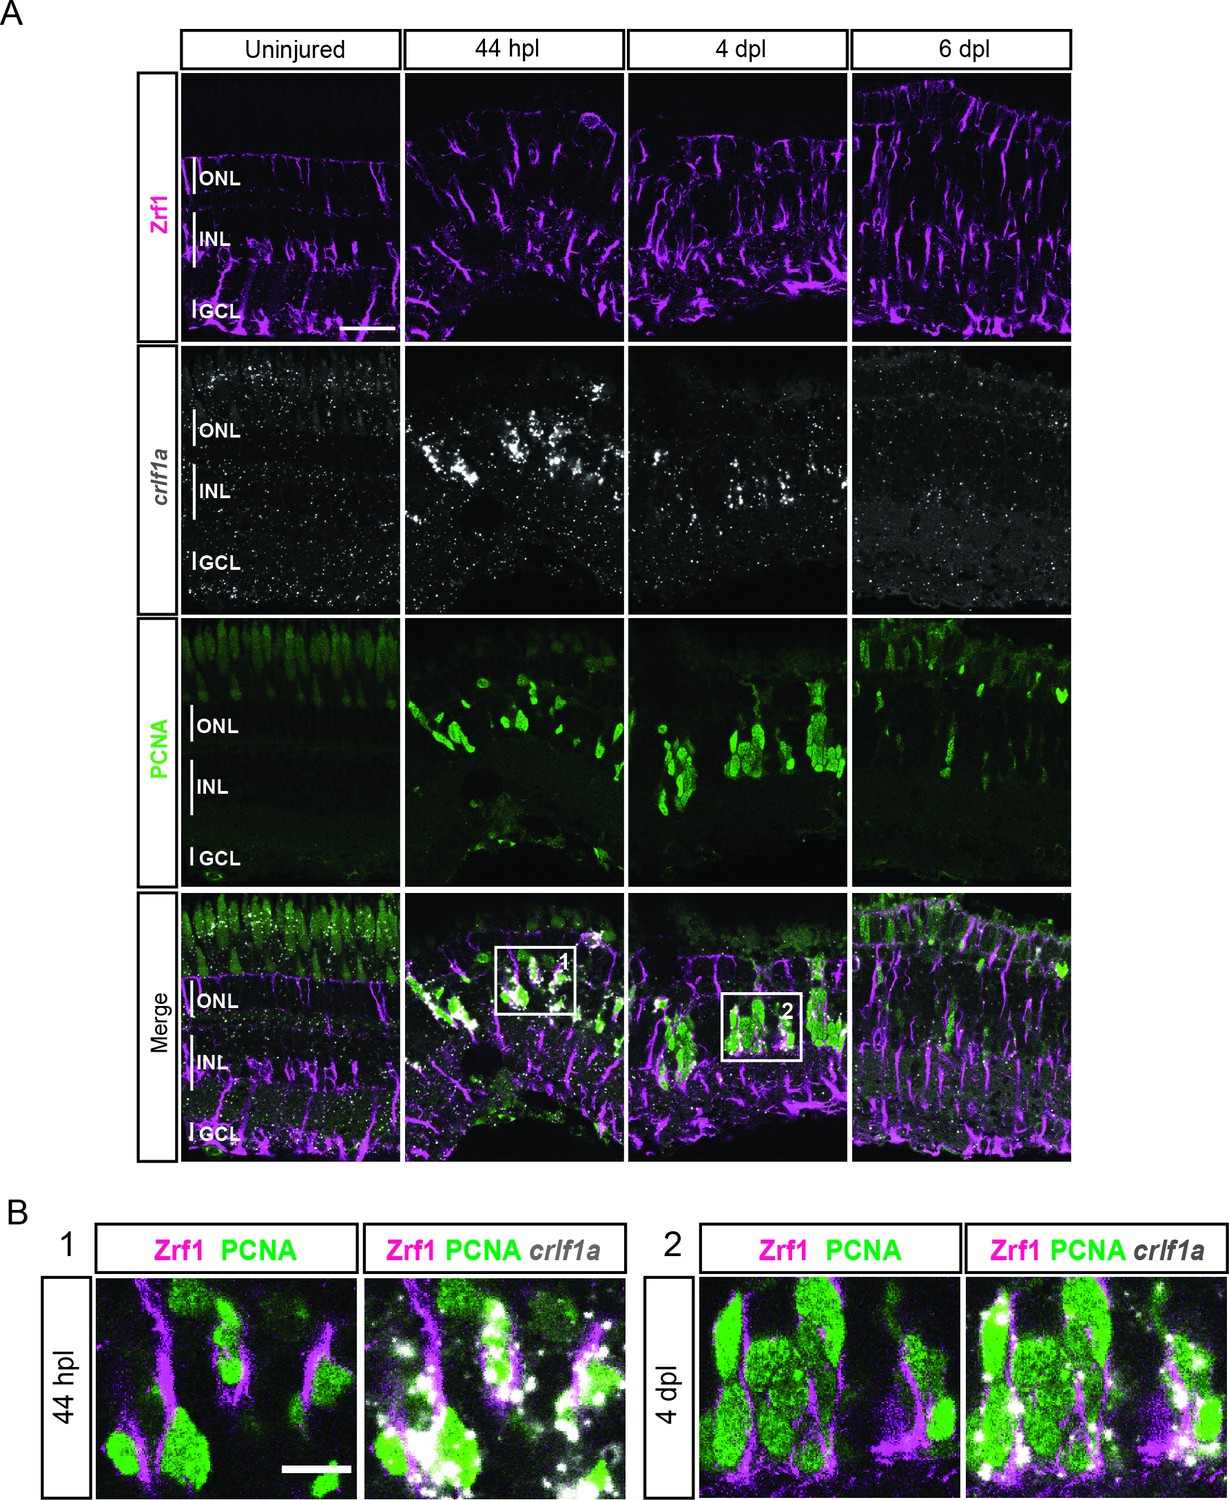
expression profile of crlf1a during retina regeneration.
(A) Confocal images of fluorescent in situ hybridization for crlf1a (grey) and immunohistochemistry detecting Zrf1-positive MG fibers (magenta) and the proliferation marker PCNA (green) on retinal sections of uninjured control animals and at 44 hours post lesion (hpl), 4 days post lesion (dpl) and 6 dpl. The position of the outer nuclear layer (ONL), inner nuclear laser (INL) and ganglion cell layer (GCL) is indicated in the uninjured sample. N=3 fish per time point and uninjured controls. Scale bar: 30 µm. (B) Magnification of the areas indicated by the squares 1 and 2 in panel A. Scale bar: 10 µm.
Figure 5
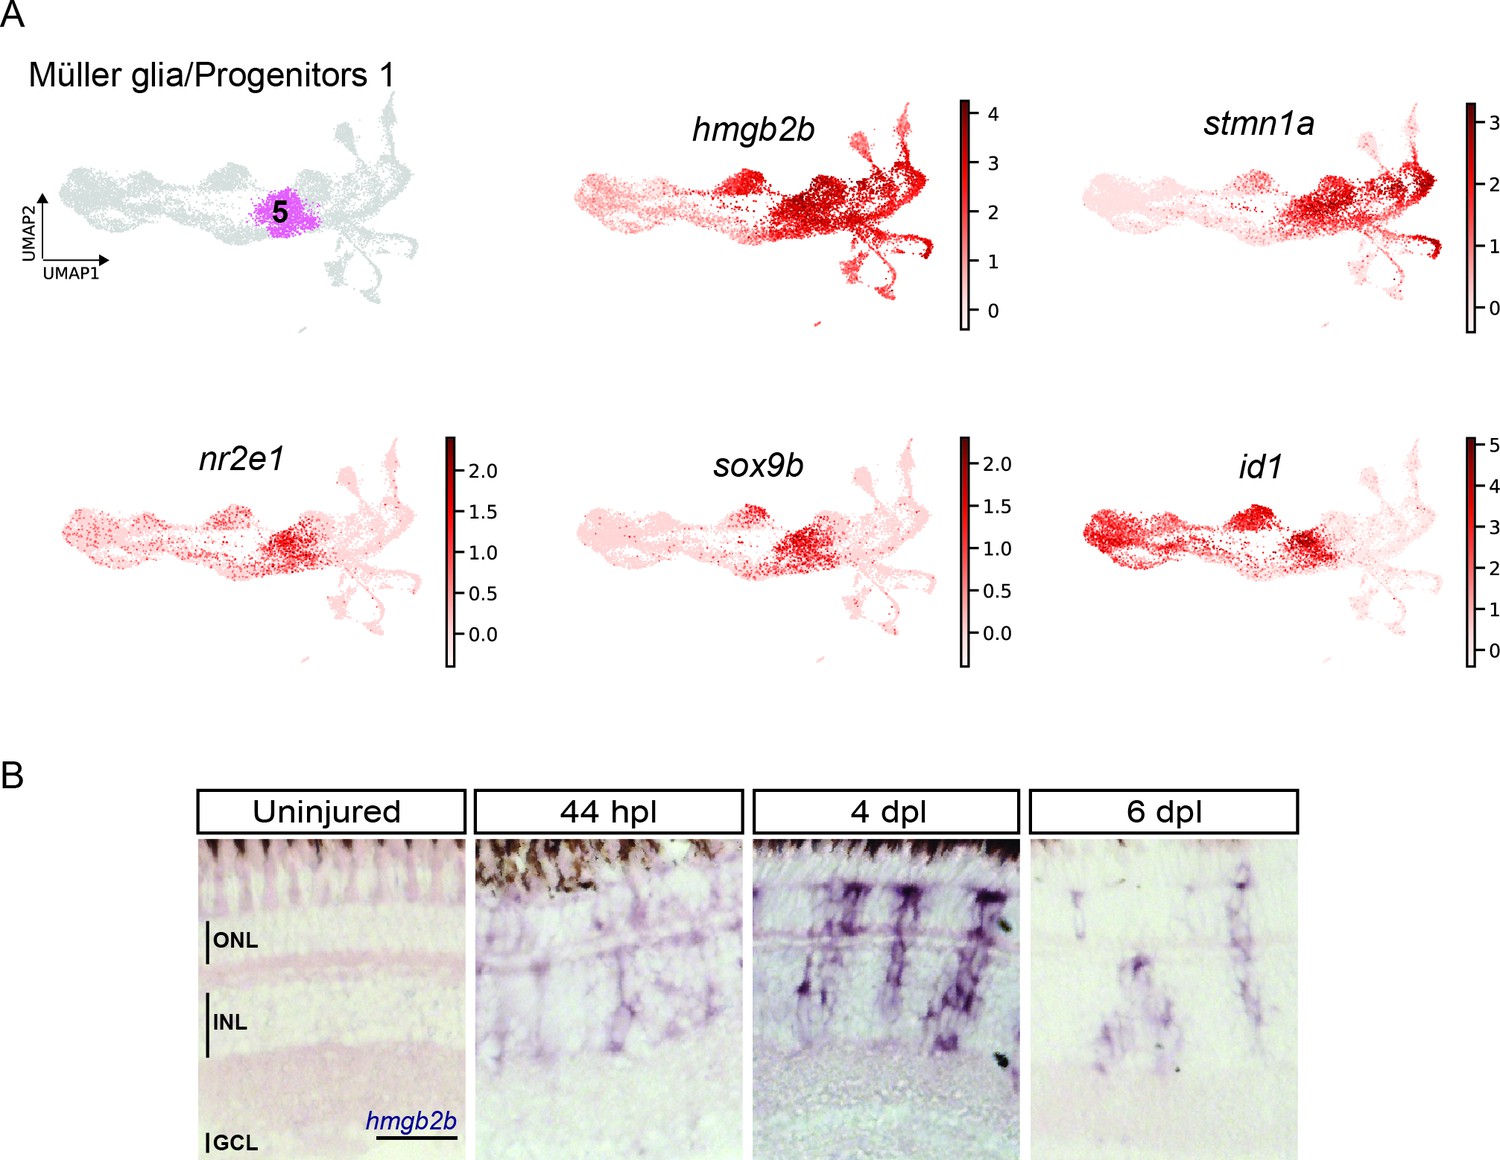
scRNAseq identifies a transient cell population with hybrid characteristics of reactive Müller glia and early progenitors in the light-lesioned retina.
(A) The progenitor 1 cluster (cluster 5) and the expression levels of hmgb2b, stmn1a, nr2e1 sox9b and id1. (B) Bright field microscopy images of chromogenic in situ hybridization detecting hmgb2b on retinal sections of uninjured control animals and at 44 hours post lesion (hpl), 4 days post lesion (dpl) and 6 dpl. N=3 fish per time point and uninjured controls. The position of the outer nuclear layer (ONL), inner nuclear layer (INL) and ganglion cell layer (GCL) is indicated in the uninjured sample. Scale bar: 30 µm.
Figure 6
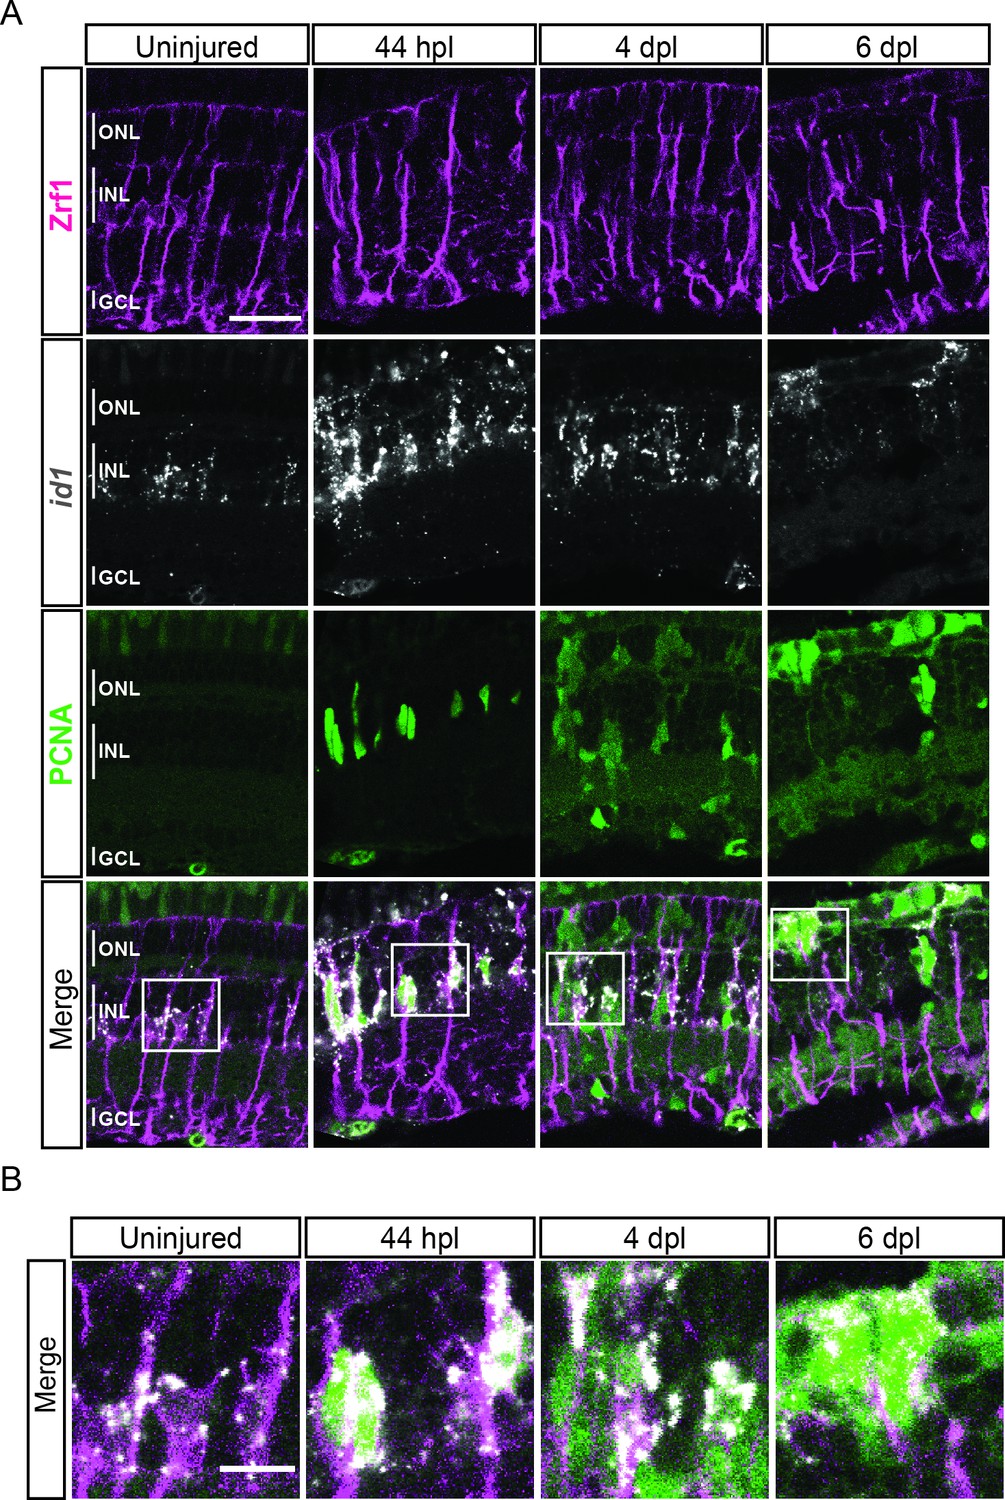
expression profile of id1 during retina regeneration.
(A) Confocal images of fluorescent in situ hybridization for id1 (grey) and immunohistochemistry detecting Zrf1-positive MG fibers (magenta) and the proliferation marker PCNA (green) on retinal sections of uninjured control animals and at 44 hours post lesion (hpl), 4 and 6 days post lesion (dpl). The position of the outer nuclear layer (ONL), inner nuclear layer (INL) and ganglion cell layer (GCL) is indicated in the uninjured sample. N=3 fish per time point and uninjured controls. Scale bar: 30 µm. (B) Magnification of the areas indicated by the squares 1 and 2 in panel A. Scale bar: 10 µm.
Figure 7
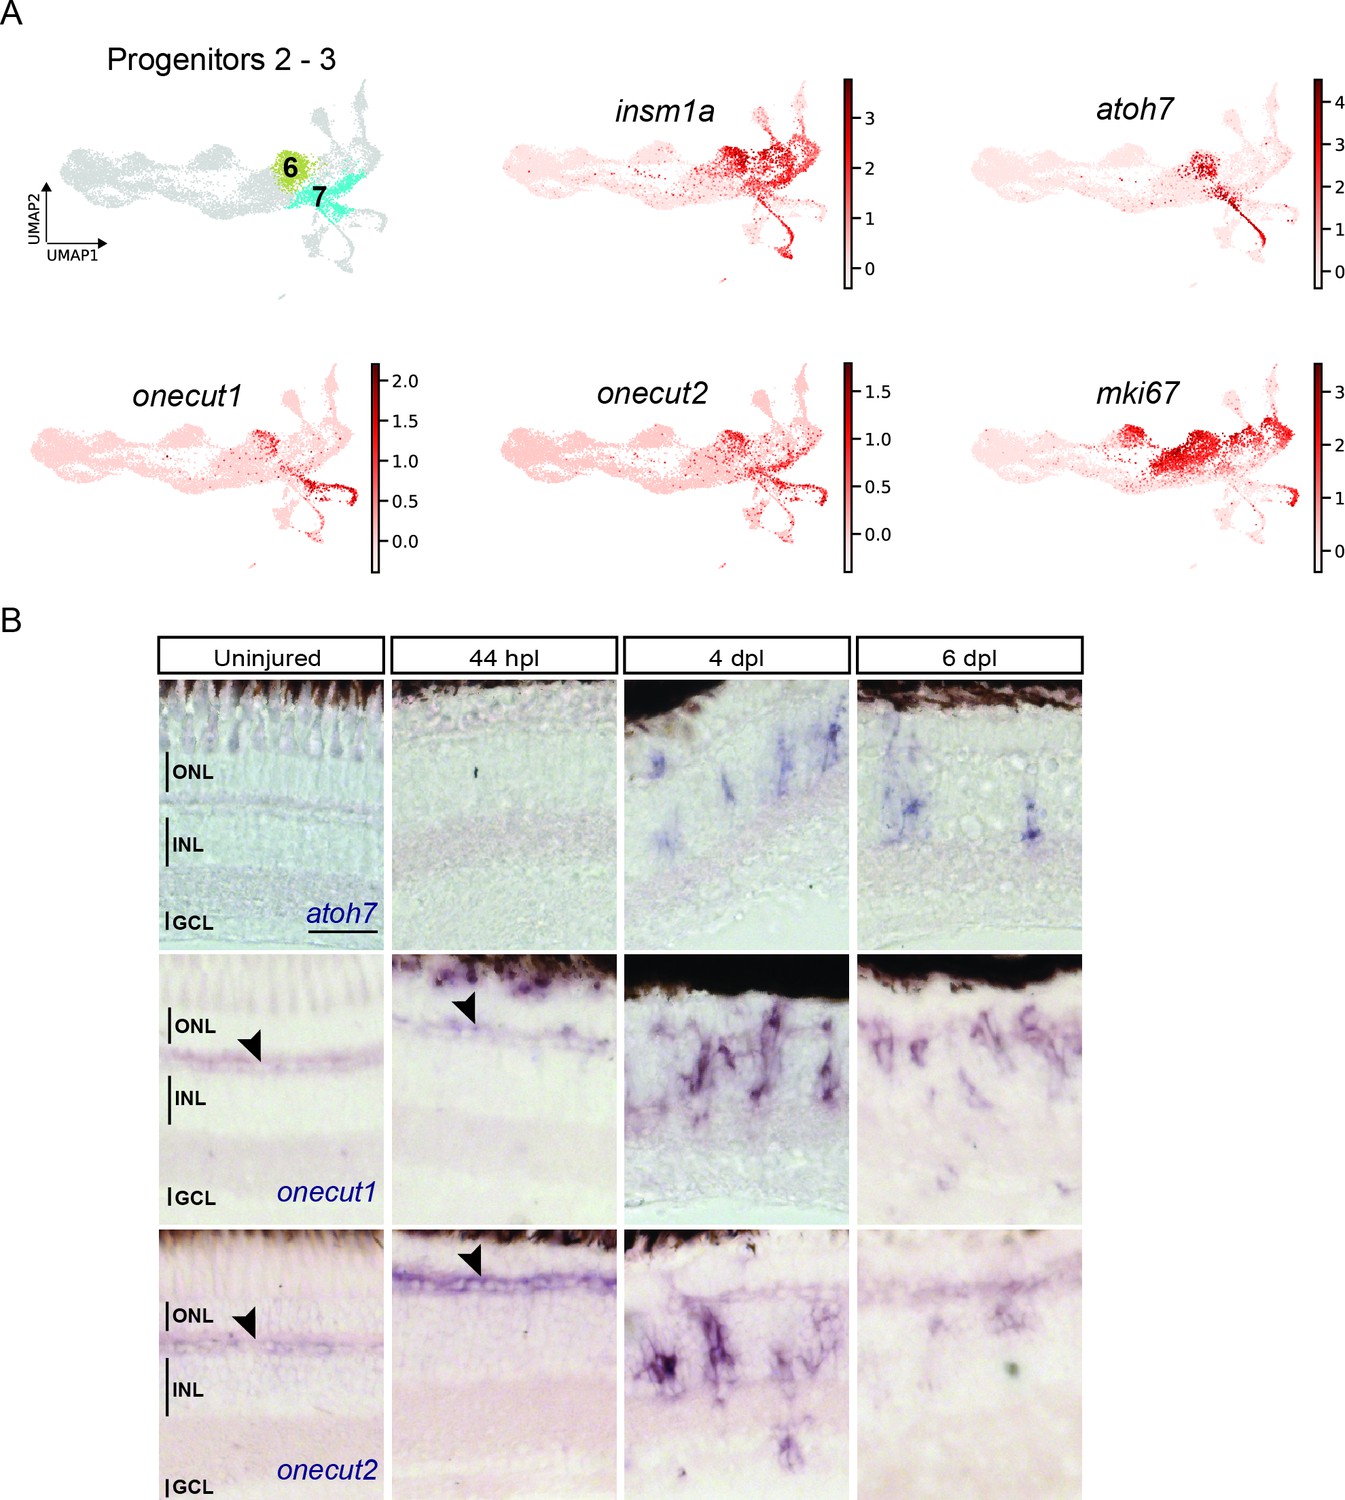
scRNAseq identifies two neurogenic progenitor populations in the light-lesioned retina.
(A) The two progenitor clusters (clusters 6 and 7) and the relative expression levels of insm1a, atoh7, onecut1, onecut2 and mki67. (B) Bright field microscopy images of chromogenic in situ hybridization detecting atoh7, onecut1 or onecut2 on retinal sections of uninjured control animals and at 44 hours post lesion (hpl), 4 days post lesion (dpl) and 6 dpl. Each ISH was carried on N=3 fish per time point and uninjured controls.The position of the outer nuclear layer (ONL), inner nuclear layer (INL), and ganglion cell layer (GCL) is indicated in the uninjured sample. Scale bar: 30 µm.
Figure 8 with 2 supplements
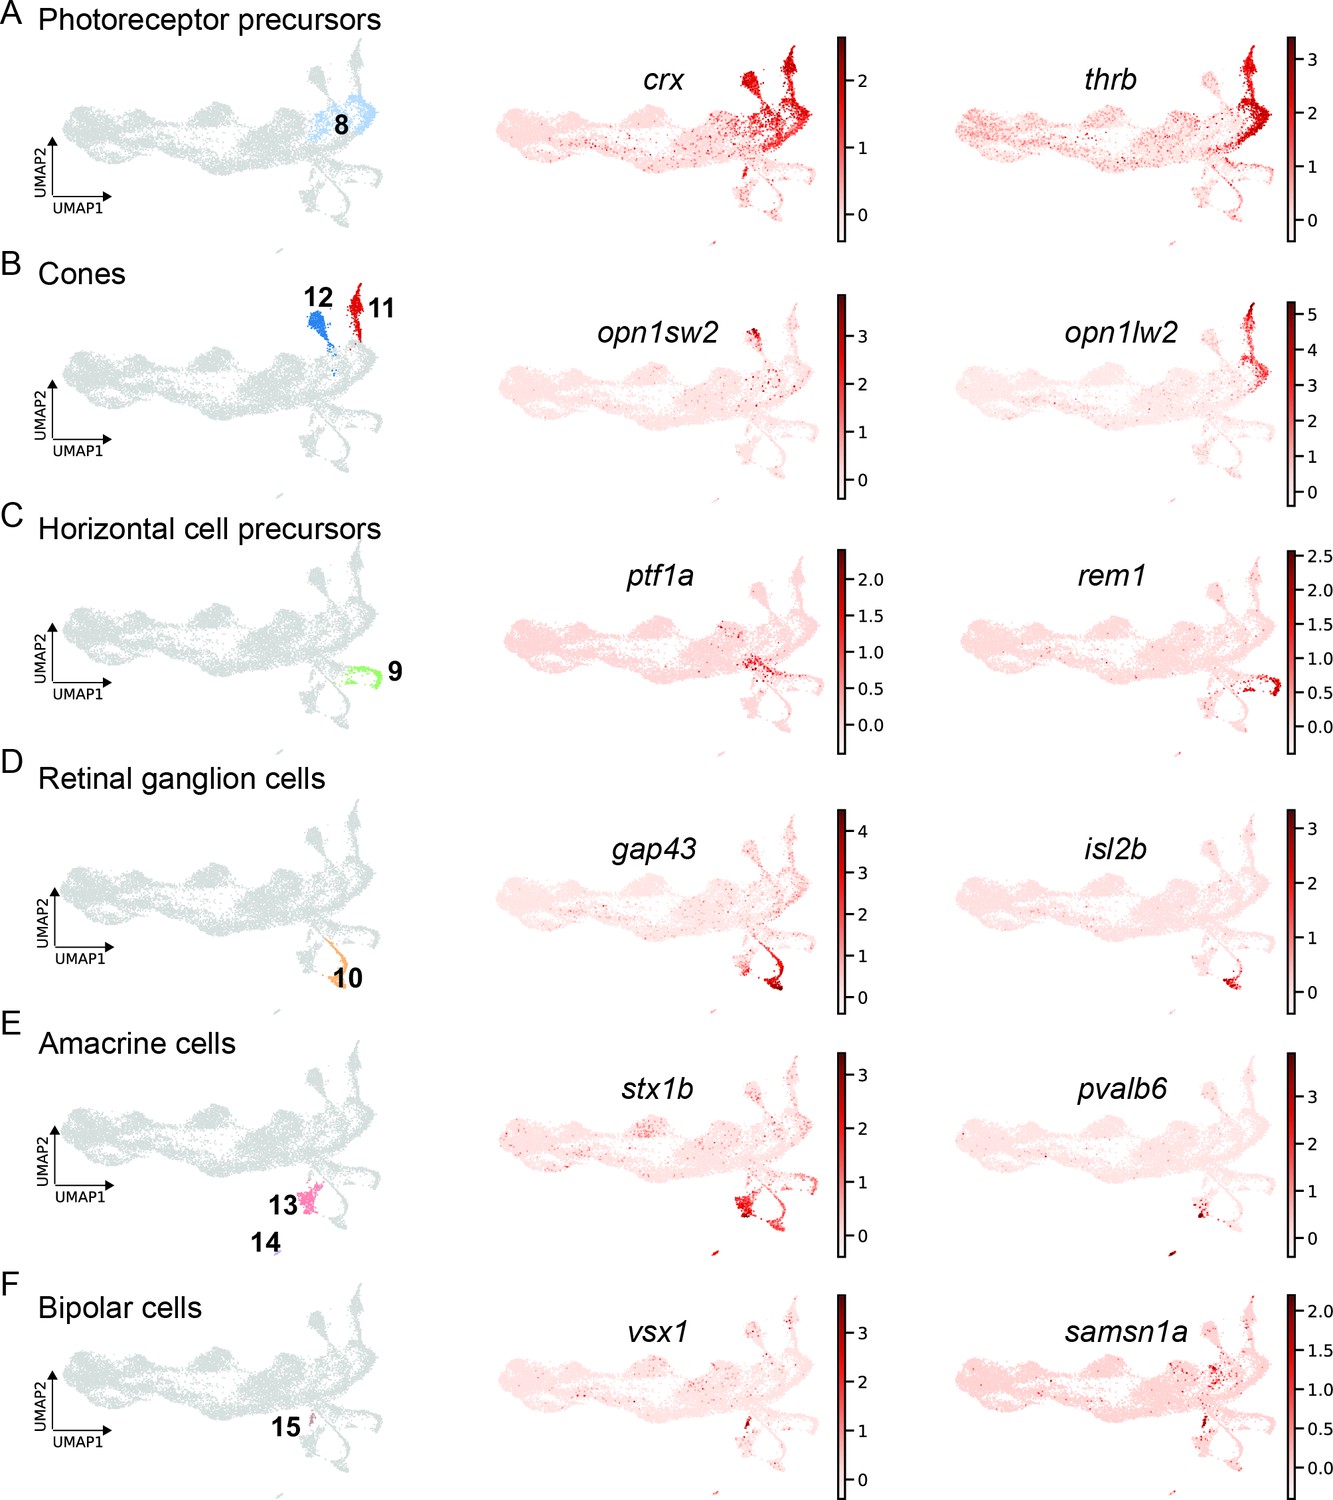
scRNAseq identifies fate-restricted progenitors and differentiating progeny in the light-lesioned retina.
(A) The photoreceptor precursor cluster (cluster 8) and the expression levels of crx and thrb. (B) The red and blue cone cluster (clusters 11 and 12) and the expression levels of the blue cone marker opn1sw2 and red cone marker opn1lw2. (C) The horizontal cell precursor cluster (cluster 9) and the expression levels of ptf1a and rem1. (D) The ganglion cell cluster (cluster 10) and the expression levels of gap43 and isl2b. (E) The two amacrine cell clusters (clusters 14 and 15) and the expression levels of stx1b and pvalb6. (D) The bipolar cell cluster (cluster 15) and the expression levels of the known bipolar cell marker vsx1 and the novel marker samsn1a. Associated: Figure 8—figure supplements 1 and 2.
Figure 8—figure supplement 1
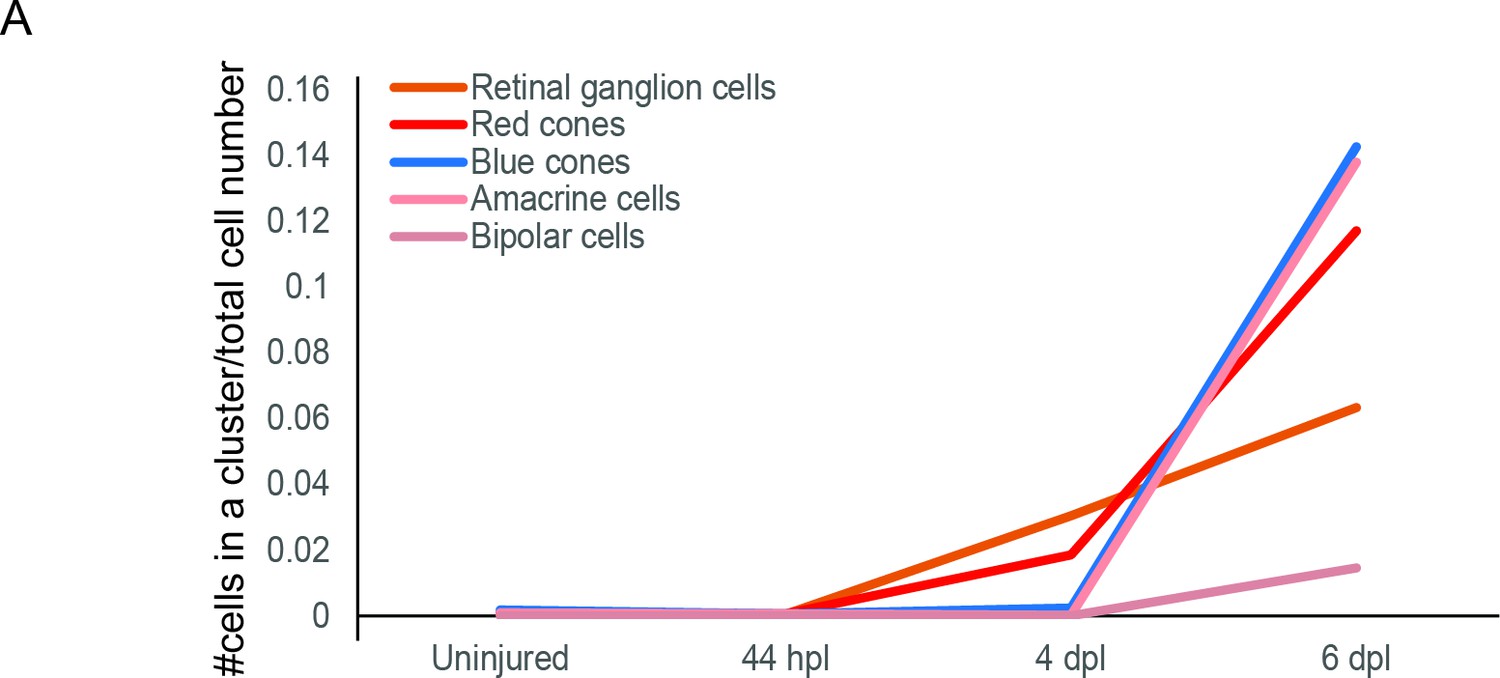
birthdate order of regenerated progeny.
Graph plotting the fraction of cells (y-axis) embarking on a specific retinal cell fate (coloured curves) in relation to a given time point (x-axis). Total number of cells per condition: uninjured = 2243, 44 hpl = 1723, 4 dpl = 4899, 6 dpl = 2,825.
Figure 8—figure supplement 2
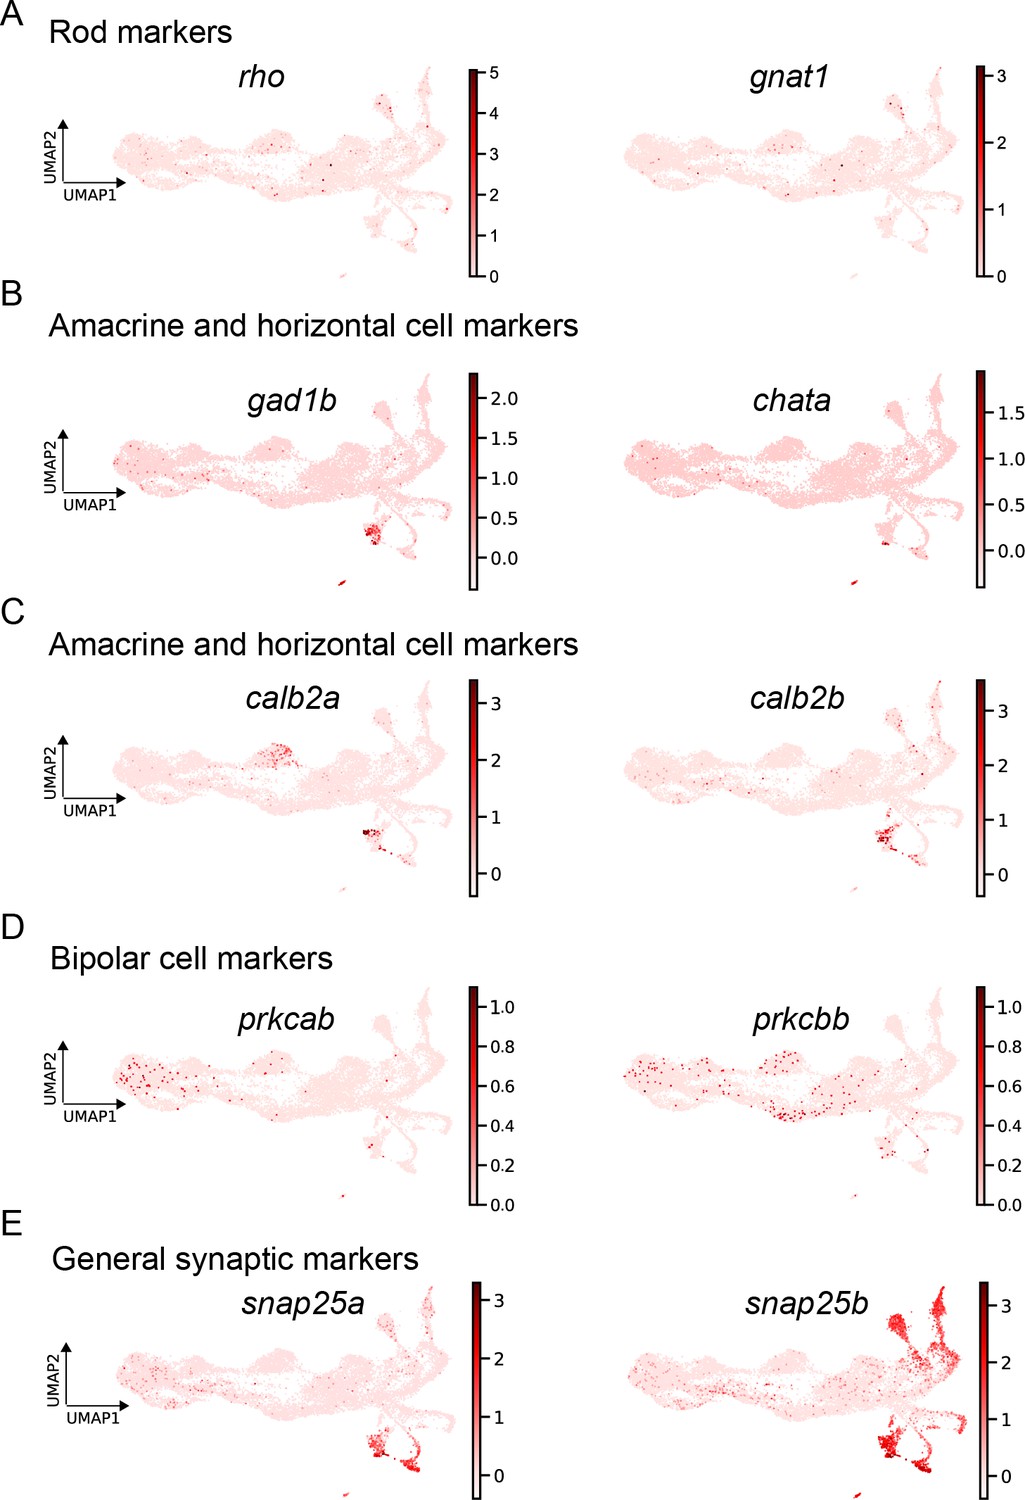
expression of mature markers.
(A) Expression levels of the known rod markers rho and gnat1. (B) Expression levels of the known mature amacrine and horizontal cell markers gad1b and chata. (C) Expression levels of the known mature amacrine cell and horizontal cell markers calb2a and calb2b. (D) Expression levels of the known mature bipolar cell markers prkcab and prkcbb. (E) Expression levels of the general synaptic markers snap25a and snap25b.
Figure 9 with 1 supplement
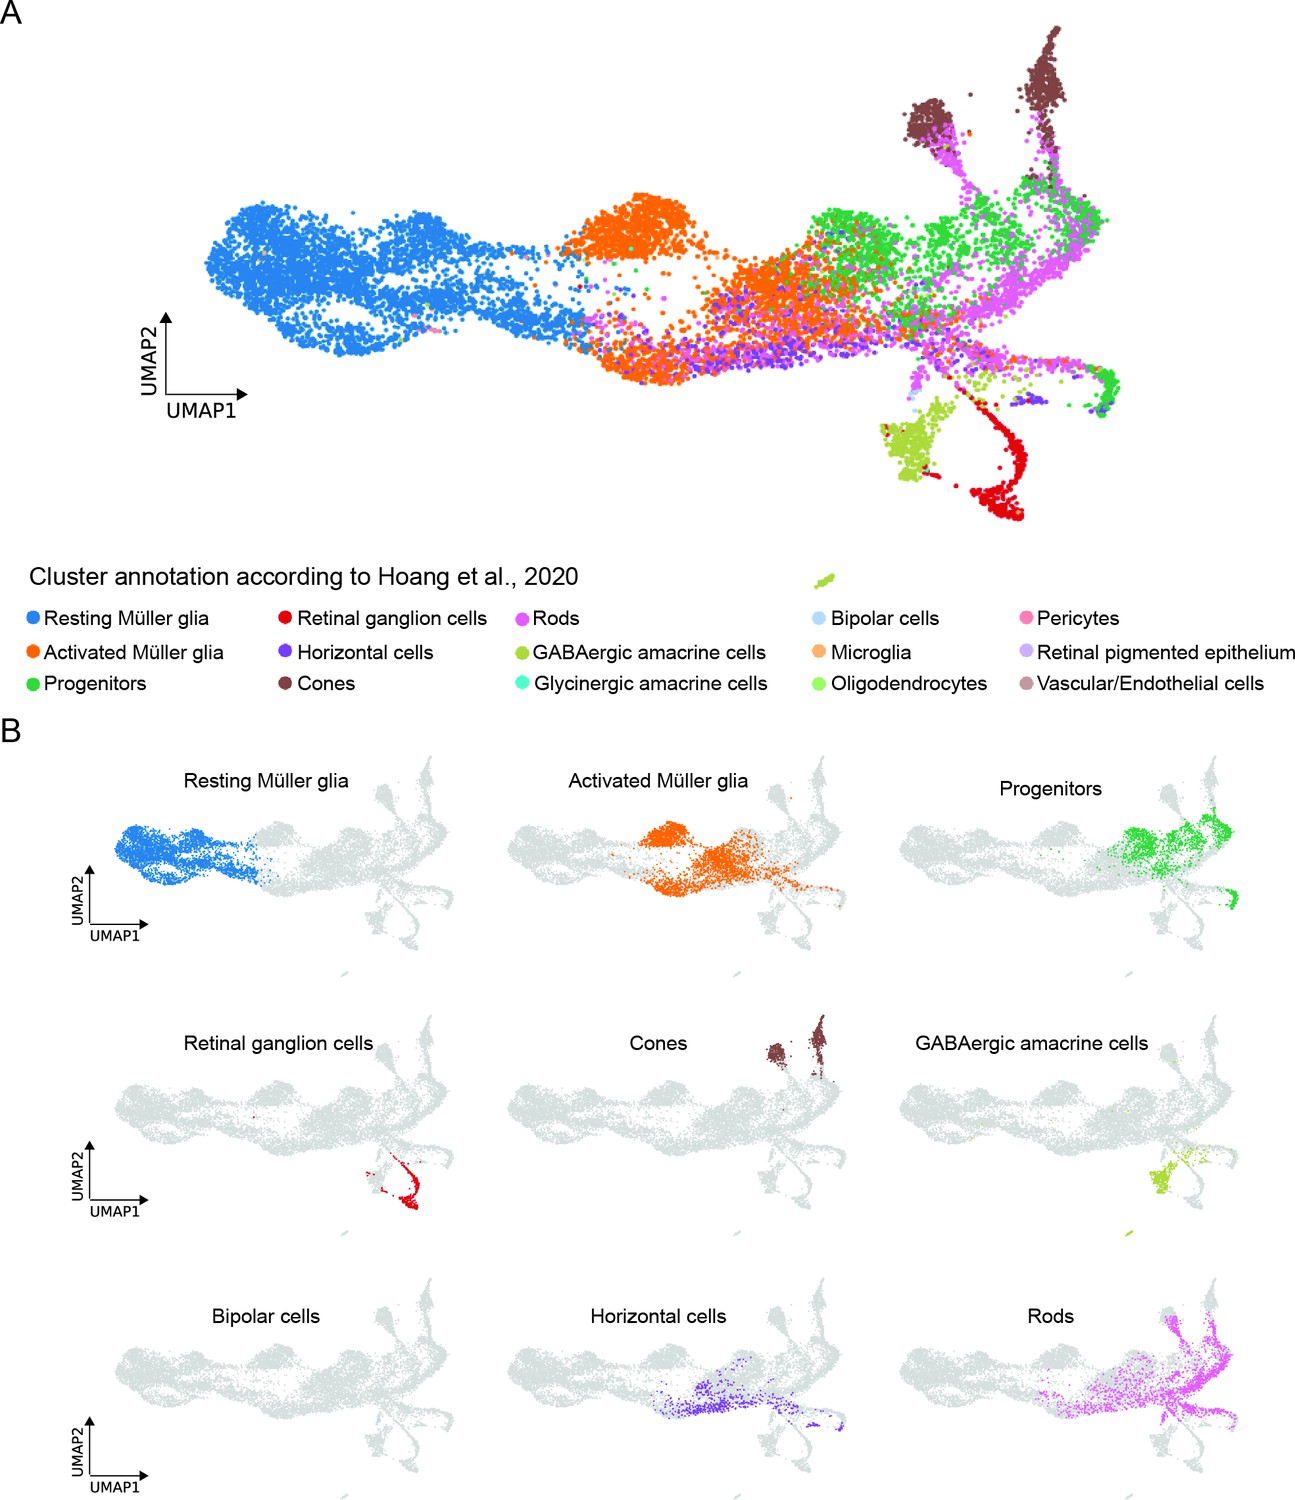
Comparison between the present scRNAseq dataset and the scRNAseq dataset by Hoang et al., 2020.
(A) UMAP showing all cell clusters annotated in Hoang et al., 2020 and mapped to the scRNAseq dataset described in the present study. (B) UMAP showing the individual cell clusters annotated in Hoang et al., 2020 and mapped to the scRNAseq dataset described in the present study.
Figure 9—figure supplement 1
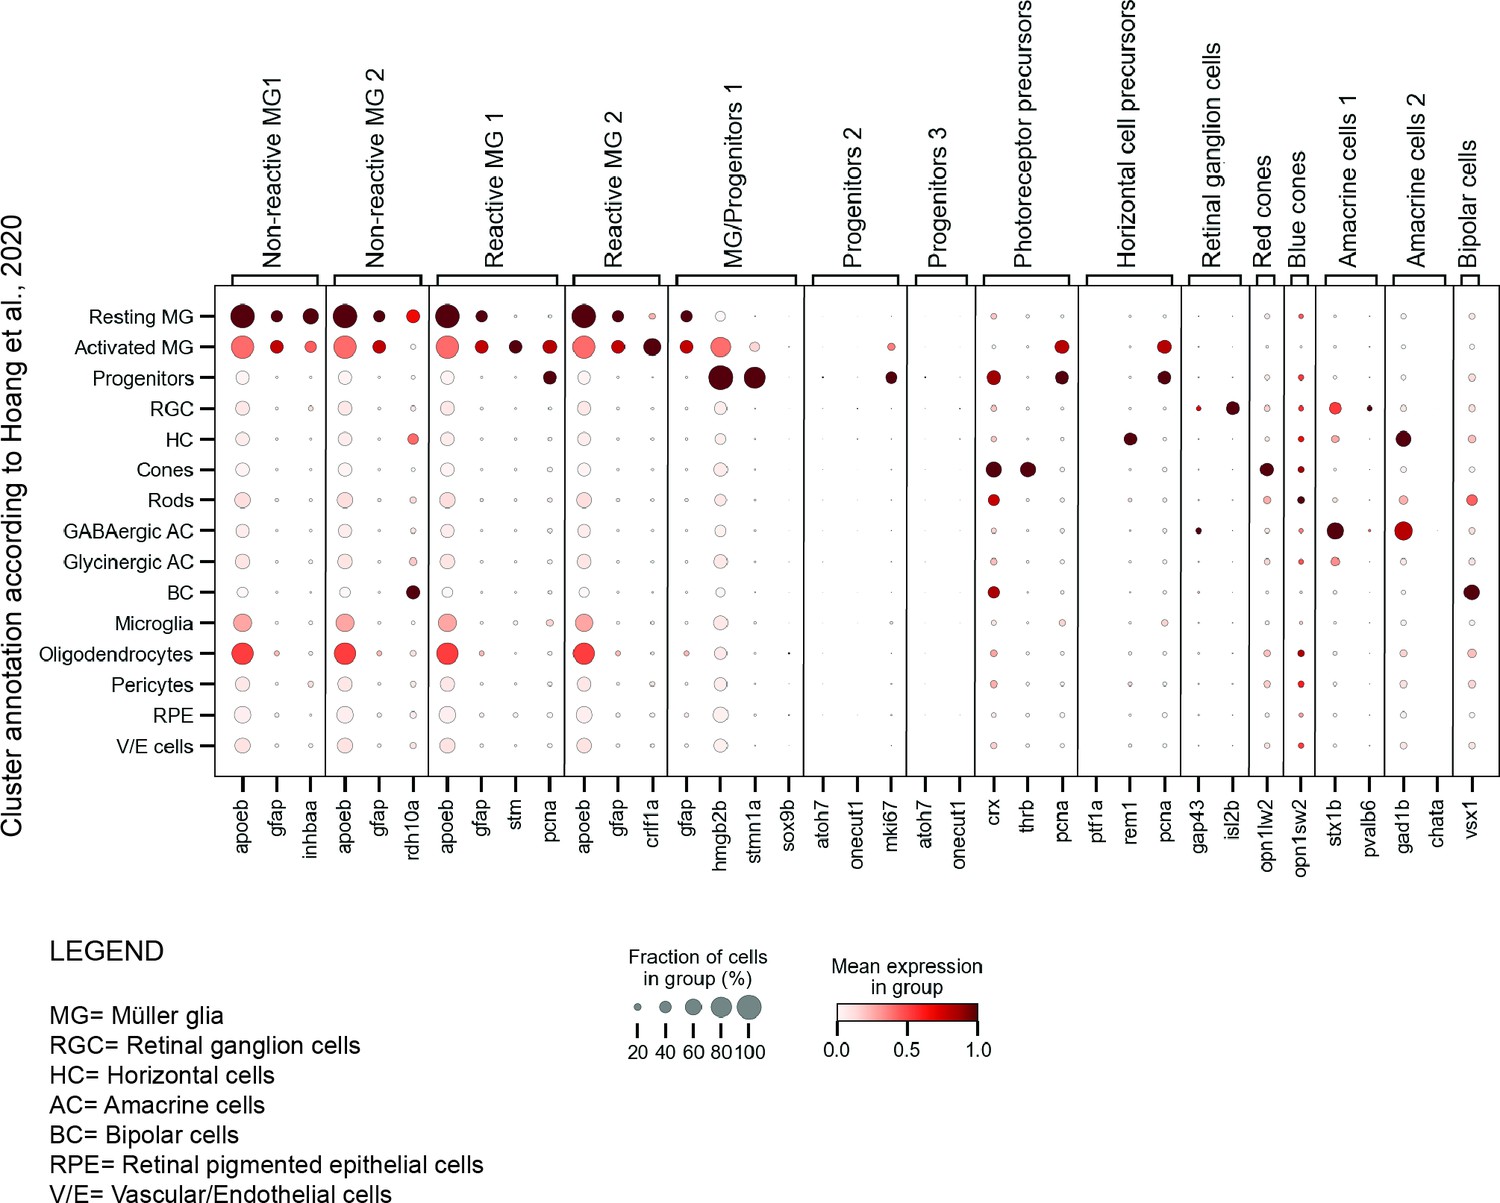
dot plot of selected marker genes per cluster in the present scRNAseq dataset and the scRNAseq dataset by Hoang et al., 2020.
Dot plot depicting the expression of our selected marker genes (x-axis) in the clusters annotated by Hoang et al., 2020 (y-axis). Marker genes were chosen from the scRNAseq dataset described in the present study.
Figure 10
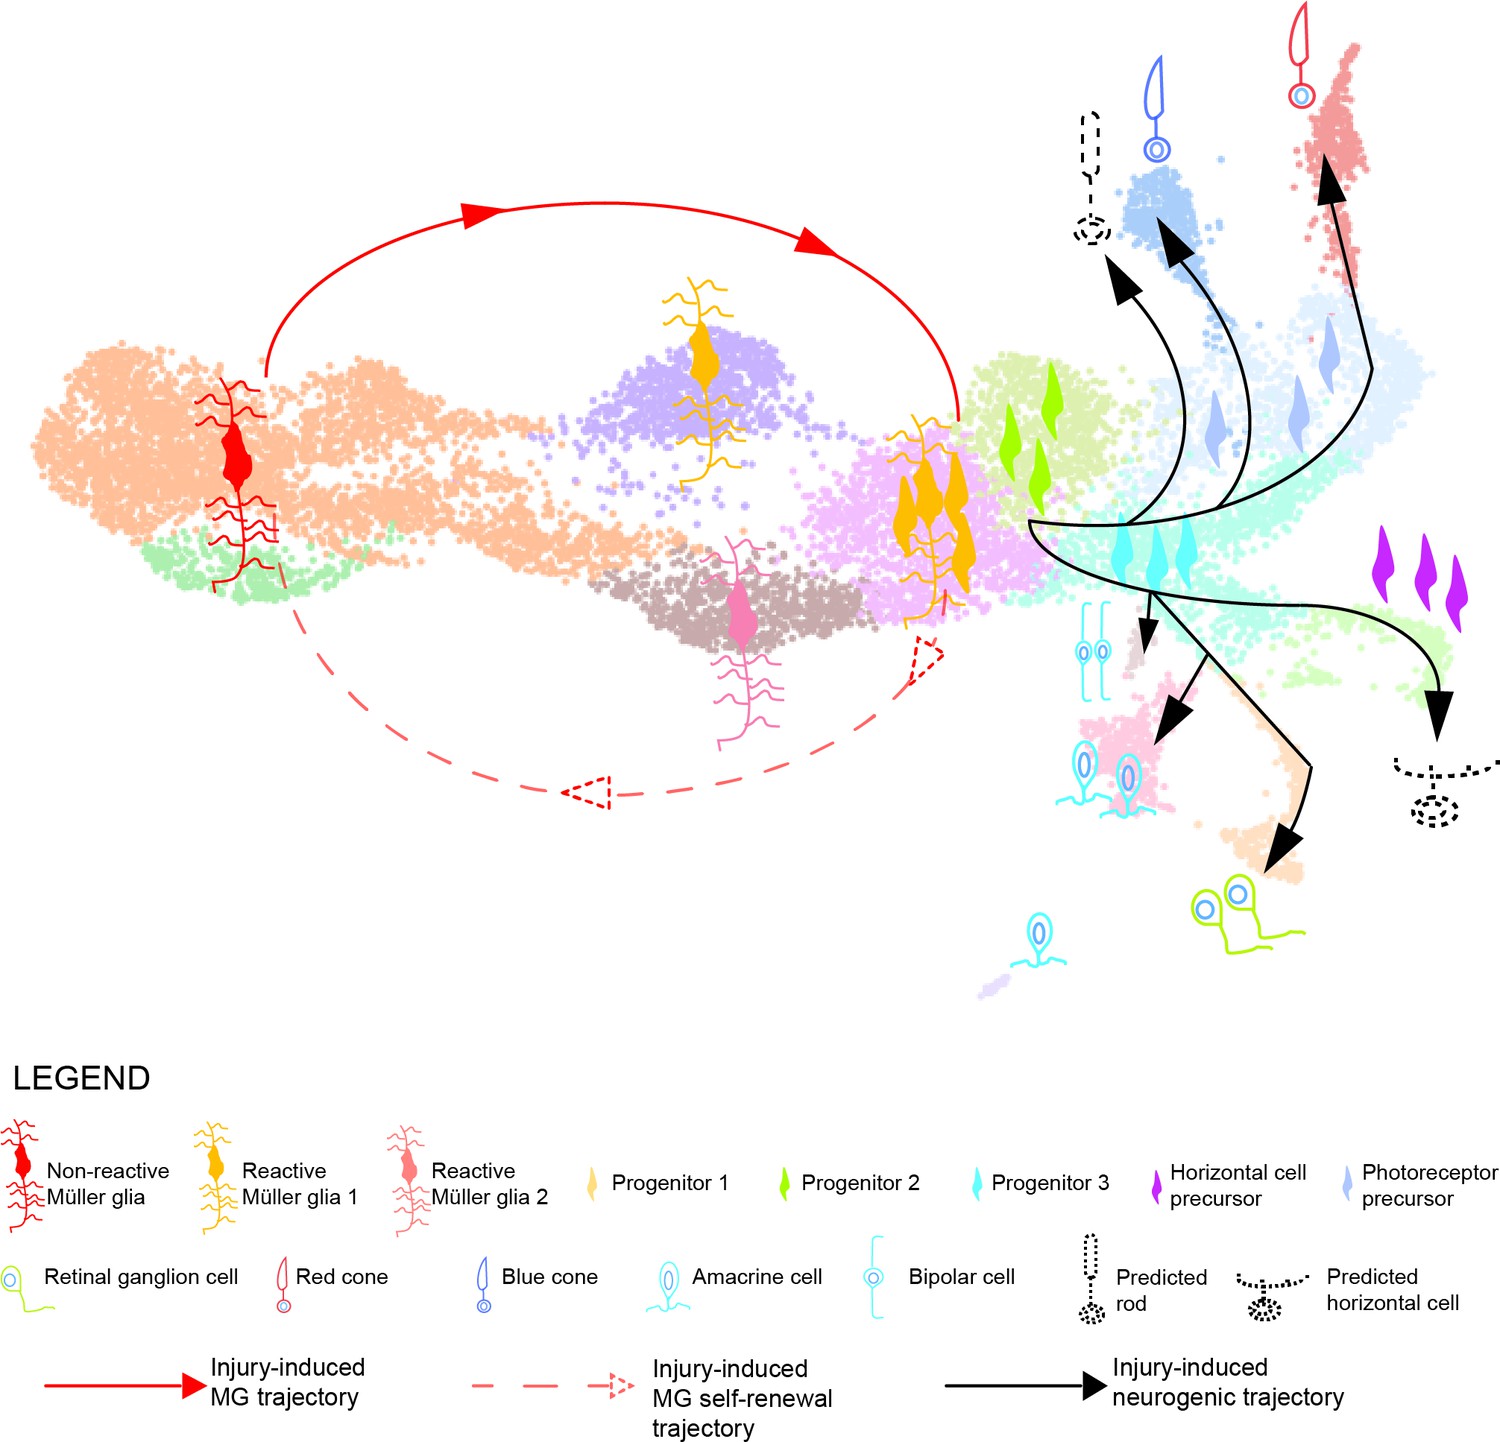
Model summarizing the cellular events underlying retina regeneration in zebrafish.
Upon lesion, non-reactive MG on the left side of the main transcriptional UMAP feed into a hybrid Müller glia/progenitor population via reactive Müller glia (solid red line). Based from this hybrid cell population, we find a Müller glia trajectory reverting to the initial starting point indicating Müller glia self-renewal (dashed red line). Moreover, the hybrid cell population represents the tip of the neurogenic trajectory, resulting in the formation of neuronal precursors and differentiating neurons (solid black lines). Differentiating rods and horizontal cells, which have not been found in the scRNAseq, are indicated with dashed lines and positioned in the predicted location on the main UMAP.
Tables
Key resources table
| Reagent type (species) or resource | Designation | Source or reference | Identifiers | Additional information |
|---|---|---|---|---|
| Antibody | Zrf1 (Mouse, monoclonal, IgG1) | ZIRC | RRID:AB_10013806 | IHC, 1:250 |
| Antibody | Anti-mCherry (Rabbit, polyclonal) | Takara Bio | Catalog #632475; RRID:AB_2737298 | IHC, 1:500 |
| Antibody | Anti-PCNA (Mouse, monoclonal, IgG2a) | Dako | RRID:AB_2160651 | IHC, 1:500 |
| Antibody | Anti-GFP (Chicken, polyclonal) | Abcam | RRID:AB_300798 | IHC, 1:2000 |
| Antibody | Sheep anti-Digoxigenin-AP Fab fragments | Roche | Catalog #11093274910; RRID: AB_514497 | ISH, 1:2000 |
| Antibody | Sheep anti- Digoxigenin-POD Fab fragments | Roche | Catalog #11207733910; RRID:AB_514500 | ISH, 1:2000 |
| Antibody | Alexa Fluor 633 Goat anti-Mouse IgG1 | Thermo Fisher Scientific | Catalog #A21126; RRID: AB_2535768 | IHC, 1:500 |
| Antibody | Alexa Fluor 555 Goat anti-Rabbit | Thermo Fisher Scientific | Catalog #A21429; RRID: AB_2535850 | IHC, 1:500 |
| Antibody | Alexa Fluor 488 Goat anti-mouse IgG2a | Thermo Fisher Scientific | Catalog #A21131; RRID: AB_2535771 | IHC, 1:500 |
| Chemical compound, drug | NBT/BCIP stock solution | Roche | Catalog #11681451001 | ISH, 20 µl/ml |
| Chemical compound, drug | Blocking reagent | Roche | Catalog # 11096176001 | ISH |
| Chemical compound, drug | Calcein blue, AM | Invitrogen | Catalog #C1429 | Living cell dye, 1 µM |
| Chemical compound, drug | Neutral protease (Dispase) | Worthington Biochemical Corporation | Catalog #LS02100 | 0.2 U/ml |
| Commercial assay or kit | Papain dissociation System | Worthington Biochemical Corporation | Catalog #LK003150 | |
| Commercial assay or kit | 10 x Chromium single - cell kit | 10 x Genomics | V3 Chemistry | |
| Commercial assay or kit | Total RNA purification kit | Norgen Biotek Coporation | Catalog #17200 | |
| Commercial assay or kit | cDNA synthesis | Roche | Catalog #4379012001 | |
| Commercial assay or kit | TOPO TA cloning dual promoter | Thermo Fisher Scientific | Catalog #450640 | |
| Commercial assay or kit | Zymoclean Gel DNA Recovery Kit | Zymo Research | Catalog #D4002 | |
| Commercial assay or kit | Gene Jet Plasmid Miniprep kit | Thermo Fisher Scientific | Catalog #k0503 | |
| Commercial assay or kit | Nucleo Bond Xtra Midi | Macherey-Nagel | Catalog #740410.5 | |
| Commercial assay or kit | TSA Plus Cyanine 3 System, | AKOYA Biosciences | Catalog #NEL744A001KT | |
| Other | 20 x SSC buffer | 175.3 g NaCl, 88.2 g HOC(COONa)(CH2COONa)2 · 2H2O, adjust pH to 6 with acetic acid in DEPC water | ||
| Other | Washing buffer | 50% deionized formamide, 1 x SSC in DEPC water | ||
| Other | MABT buffer | 100 mM maleic acid, 150 mM NaCl, adjust pH to 7.5 with NaOH, 0.1% Tween 20, in DEPC water sterile filter | ||
| Other | Staining buffer for Alkaline Phosphatase | 100 mM NaCl, 50 mM MgCl2, 100 mM Tris base, pH = 9.5, 0.1% Tween 20 in DEPC water | ||
| Other | TNT buffer | 100 mM Tris HCl, pH = 7.5, 150 mM NaCl, 0.1% Tween 20 in DEPC water |
Additional files
-
Supplementary file 1
Top 100 marker genes per cluster.
- https://cdn.elifesciences.org/articles/86507/elife-86507-supp1-v1.xlsx
-
Supplementary file 2
Top 100 differentially expressed genes between Non-reactive Müller glia (1) and Non-reactive Müller glia (2).
- https://cdn.elifesciences.org/articles/86507/elife-86507-supp2-v1.xlsx
-
Supplementary file 3
Top 100 differentially expressed genes between Reactive Müller glia (1) and Reactive Müller glia (2).
- https://cdn.elifesciences.org/articles/86507/elife-86507-supp3-v1.xlsx
-
Supplementary file 4
Top 100 differentially expressed genes between Reactive Müller glia (1) and Müller glia/Progenitors 1.
- https://cdn.elifesciences.org/articles/86507/elife-86507-supp4-v1.xlsx
-
Supplementary file 5
Top 100 differentially expressed genes between Reactive Müller glia (2) and Müller glia/Progenitors 1.
- https://cdn.elifesciences.org/articles/86507/elife-86507-supp5-v1.xlsx
-
Supplementary file 6
Top 100 differentially expressed genes between Müller glia/Progenitors 1 and Progenitors 2.
- https://cdn.elifesciences.org/articles/86507/elife-86507-supp6-v1.xlsx
-
Supplementary file 7
Sequence based reagents.
- https://cdn.elifesciences.org/articles/86507/elife-86507-supp7-v1.xlsx
-
MDAR checklist
- https://cdn.elifesciences.org/articles/86507/elife-86507-mdarchecklist1-v1.docx
Download links
A two-part list of links to download the article, or parts of the article, in various formats.
Downloads (link to download the article as PDF)
Open citations (links to open the citations from this article in various online reference manager services)
Cite this article (links to download the citations from this article in formats compatible with various reference manager tools)
Single-cell RNA sequencing unravels the transcriptional network underlying zebrafish retina regeneration
eLife 12:RP86507.
https://doi.org/10.7554/eLife.86507.3


