Quantification of impact of COVID-19 pandemic on cancer screening programmes – a case study from Argentina, Bangladesh, Colombia, Morocco, Sri Lanka, and Thailand
- International Agency for Research on Cancer, France
- Hospital Universitario San Ignacio, Colombia
- Investigadora CEDES/CONICET, Argentina
- Instituto Provincial del Cáncer, Argentina
- Foundation Lalla Salma Cancer prevention and treatment, Morocco
- Bangabandhu Sheikh Mujib Medical University, Bangladesh
- Ministry of Health, Sri Lanka
- National Cancer Institute of Thailand, Thailand
Figures
Figure 1
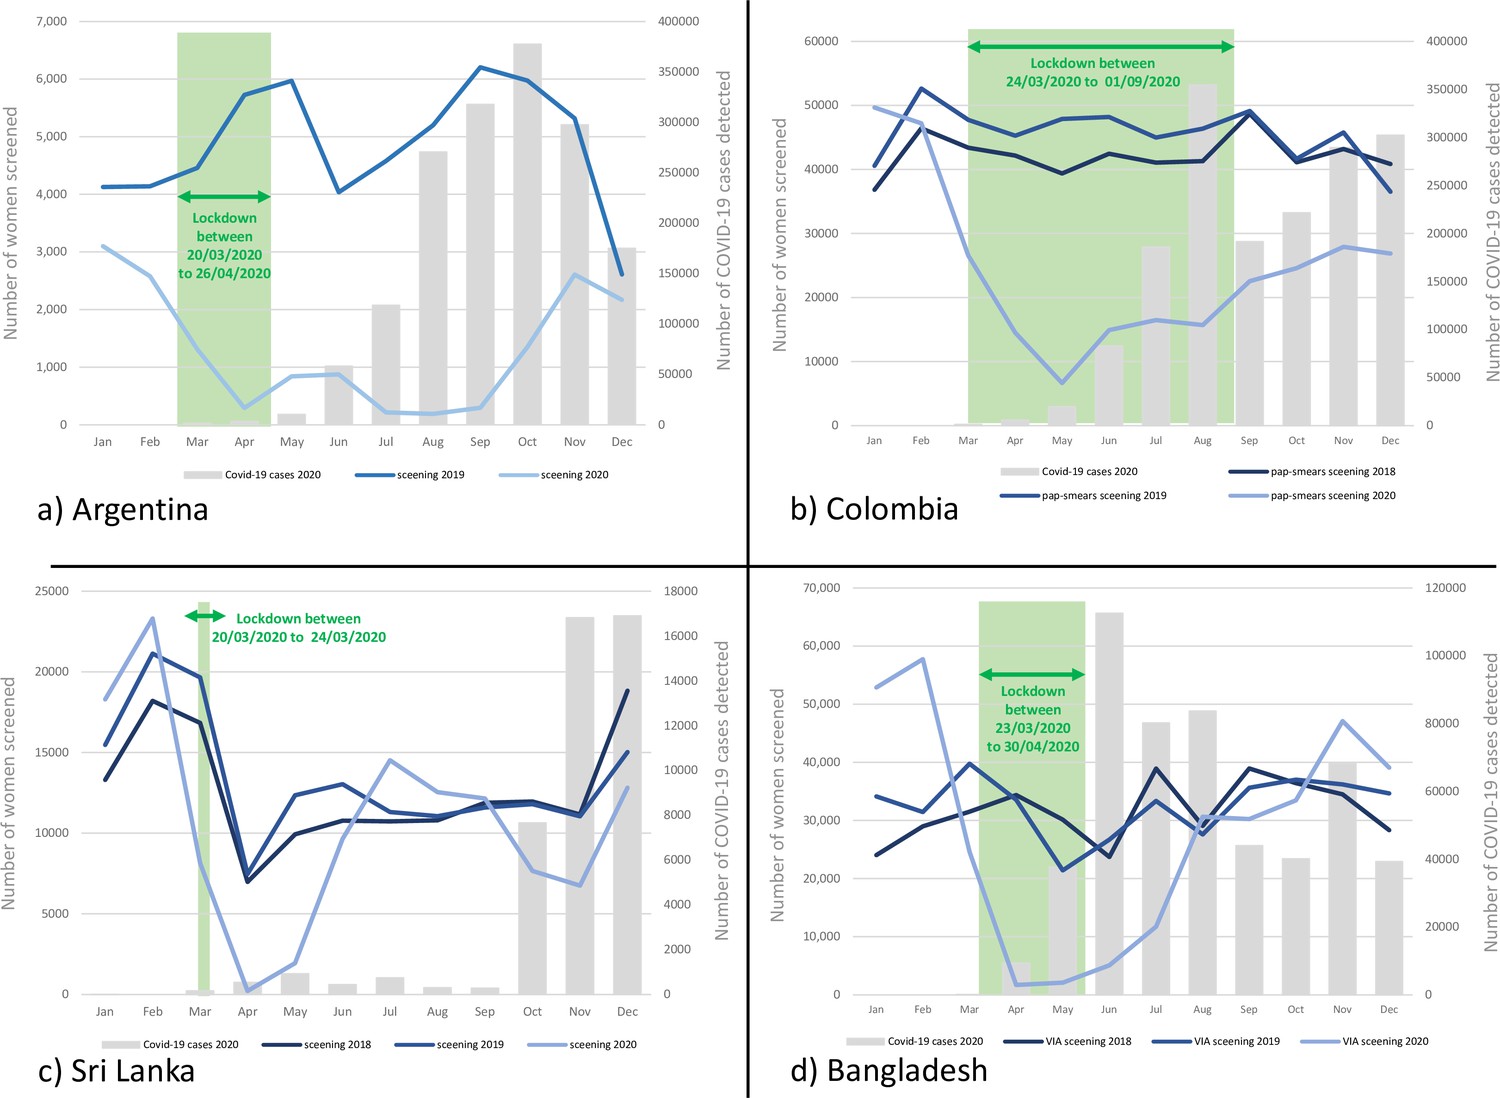
Number of women screened for cervical cancer in Argentina (Jujuy province only) (a), Colombia (b), Sri Lanka (c), and Bangladesh (d) by months in selected years; the bars show the number of COVID-19 cases detected by months in 2020; the green bar shows the lockdown period.
Tables
Table 1
Monthly change in number of women undergoing screening, colposcopy, and/or treatment, and high-grade CIN detected in the cervical cancer screening programme in Jujuy province, Argentina during 2019 and 2020.
| Year of | Month of screening | Total | |||||||||||
|---|---|---|---|---|---|---|---|---|---|---|---|---|---|
| screening | Jan | Feb | Mar | Apr | May | Jun | Jul | Aug | Sep | Oct | Nov | Dec | |
| Number of women screened (with cytology or HPV test) | |||||||||||||
| 2019 – n | 4128 | 4140 | 4457 | 5726 | 5969 | 4036 | 4579 | 5200 | 6205 | 5973 | 5319 | 2611 | 58,343 |
| 2020 – n | 3102 | 2577 | 1312 | 291 | 840 | 875 | 214 | 189 | 295 | 1351 | 2608 | 2169 | 15,823 |
| Change – %* | −24.9 | −37.8 | −70.6 | −94.9 | −85.9 | −78.3 | −95.3 | −96.4 | −95.2 | −77.4 | −51.0 | −16.9 | −72.9 |
| Number of women undergoing colposcopy | |||||||||||||
| 2019 – n | 234 | 272 | 322 | 374 | 314 | 240 | 208 | 378 | 433 | 356 | 318 | 305 | 3,754 |
| 2020 – n | 62 | 49 | 37 | 37 | 60 | 43 | 13 | 11 | 18 | 20 | 20 | 45 | 415 |
| Change – %* | −73.5 | −82.0 | −88.5 | −90.1 | −80.9 | −82.1 | −93.8 | −97.1 | −95.8 | −94.4 | −93.7 | −85.2 | −88.9 |
| Number of women detected with CIN 2 or worse lesions | |||||||||||||
| 2019 – n | 23 | 34 | 28 | 41 | 27 | 29 | 18 | 42 | 45 | 30 | 51 | 31 | 399 |
| 2020 – n | 35 | 26 | 15 | 19 | 24 | 21 | 8 | 8 | 10 | 15 | 13 | 24 | 218 |
| Change – %* | +52.2 | −23.5 | −46.4 | −53.7 | −11.1 | −27.6 | −55.6 | −81.0 | −77.8 | −50.0 | −74.5 | −22.6 | −45.4 |
| Number of LLETZ or conization performed | |||||||||||||
| 2019 – n | 9 | 12 | 13 | 30 | 25 | 16 | 16 | 18 | 18 | 18 | 24 | 20 | 219 |
| 2020 – n | 18 | 10 | 8 | 4 | 19 | 14 | 5 | 4 | 8 | 9 | 18 | 9 | 126 |
| Change – %* | +100.0 | −16.7 | −38.5 | −86.7 | −24.0 | −12.5 | −68.8 | −77.8 | −55.6 | −50.0 | −25.0 | −55.0 | −42.5 |
-
*
Change is calculated as (numbers in 2020 − numbers in 2019)/(numbers in 2019) × 100; HPV: human papilloma virus; CIN: cervical intraepithelial neoplasia; LLETZ: large loop excision of the transformation zone.
Table 2
Monthly change in number of women undergoing cytology screening and colposcopy in the national cervical cancer screening programme in Colombia during 2019 and 2020 (A), and monthly change in number of women undergoing mammography screening and biopsies taken in the national breast cancer screening programme in Colombia during 2019 and 2020 (B).
| A | Monthly change in number of women undergoing cytology screening and colposcopy in the national cervical cancer screening programme in Colombia during 2019 and 2020 | ||||||||||||
|---|---|---|---|---|---|---|---|---|---|---|---|---|---|
| Year of | Month of screening | Total | |||||||||||
| screening | Jan | Feb | Mar | Apr | May | Jun | Jul | Aug | Sep | Oct | Nov | Dec | |
| Number of women screened (with cytology) | |||||||||||||
| 2019 – n | 40,561 | 52,636 | 47,734 | 45,274 | 47,878 | 48,200 | 44,987 | 46,379 | 49,125 | 41,662 | 45,783 | 36,537 | 546,756 |
| 2020 – n | 49,680 | 47,205 | 26,564 | 14,510 | 6652 | 14,911 | 16,482 | 15,712 | 22,567 | 24,593 | 27,911 | 26,878 | 293,665 |
| Change – %* | +22.5 | −10.3 | −44.3 | −68.0 | −86.1 | −69.1 | −63.4 | −66.1 | −54.1 | −41.0 | −39.0 | −26.4 | −46.3 |
| Number of women undergoing colposcopy | |||||||||||||
| 2019 – n | 1614 | 1450 | 1222 | 1237 | 1249 | 998 | 1120 | 1182 | 1086 | 1114 | 1030 | 495 | 13,797 |
| 2020 – n | 1235 | 1165 | 897 | 350 | 485 | 579 | 623 | 684 | 631 | 656 | 697 | 528 | 8530 |
| Change – %* | −23.4 | −19.7 | −26.6 | −71.7 | −61.2 | −42.0 | −44.4 | −42.1 | −41.9 | −41.1 | −32.3 | +6.7 | −38.2 |
| B | Monthly change in number of women undergoing mammography screening and biopsies taken in the national breast cancer screening programme in Colombia during 2019 and 2020 | ||||||||||||
| Year of | Month of screening | Total | |||||||||||
| screening | Jan | Feb | Mar | Apr | May | Jun | Jul | Aug | Sep | Oct | Nov | Dec | |
| Number of women screened (with mammography) | |||||||||||||
| 2019 – n | 9406 | 9050 | 7955 | 8880 | 8908 | 7966 | 8174 | 8880 | 8647 | 7779 | 6849 | 4446 | 96,940 |
| 2020 – n | 7837 | 9818 | 6855 | 1259 | 2269 | 3196 | 3483 | 3739 | 5125 | 6341 | 7189 | 5731 | 62,842 |
| Change – %† | −16.7 | 8.5 | −13.8 | −85.8 | −74.5 | −59.9 | −57.4 | −57.9 | −40.7 | −18.5 | +5.0 | +28.9 | −35.2 |
| Number of women from whom biopsies were taken | |||||||||||||
| 2019 – n | 184 | 311 | 255 | 203 | 287 | 228 | 213 | 223 | 226 | 253 | 257 | 194 | 2834 |
| 2020 – n | 211 | 302 | 273 | 98 | 136 | 148 | 201 | 207 | 208 | 264 | 270 | 256 | 2574 |
| Change – %† | +14.7 | −2.9 | −7.1 | −51.7 | −52.6 | −35.1 | −5.6 | −7.2 | −8.0 | +4.3 | +5.0 | +32.0 | −9.2 |
-
*
Change is calculated as (numbers in 2020 − numbers in 2019)/(numbers in 2019) × 100.
-
†
Change is calculated as (numbers in 2020 − numbers in 2019)/(numbers in 2019) × 100.
Table 3
Monthly change in number of women undergoing cytology screening and high-grade CIN detected in the national cervical cancer screening programme in Sri Lanka during 2019 and 2020 (A), and monthly change in number of women undergoing CBE screening in the national cervical cancer screening programme in Sri Lanka during 2019 and 2020 (B).
| A | Monthly change in number of women undergoing cytology screening and high-grade CIN detected in the national cervical cancer screening programme in Sri Lanka during 2019 and 2020 | ||||||||||||
|---|---|---|---|---|---|---|---|---|---|---|---|---|---|
| Year of | Month of screening | Total | |||||||||||
| screening | Jan | Feb | Mar | Apr | May | Jun | Jul | Aug | Sep | Oct | Nov | Dec | |
| Number of women screened (with cytology) | |||||||||||||
| 2019 – n | 15,470 | 21,135 | 19,656 | 7467 | 12,352 | 13,038 | 11,309 | 11,055 | 11,590 | 11,797 | 11,044 | 15,025 | 160,938 |
| 2020 – n | 18,293 | 23,313 | 8149 | 222 | 1947 | 9650 | 14,519 | 12,543 | 12,153 | 7658 | 6748 | 12,812 | 128,007 |
| Change – %* | +18.2 | +10.3 | −58.5 | −97.0 | −84.2 | −26.0 | 28.4 | +13.5 | +4.9 | −35.1 | −38.9 | −14.7 | −20.5 |
| Number of women detected with CIN 2 or worse lesions | |||||||||||||
| 2019 – n | 28 | 10 | 9 | 2 | 6 | 10 | 11 | 16 | 13 | 13 | 7 | 24 | 149 |
| 2020 – n | 8 | 10 | 6 | 0 | 2 | 11 | 13 | 6 | 9 | 11 | 12 | 8 | 96 |
| Change – %* | −71.4 | 0.0 | −33.3 | −100.0 | −66.7 | +10.0 | 18.2 | −62.5 | −30.8 | −15.4 | +71.4 | −66.7 | −35.6 |
| B | Monthly change in number of women undergoing CBE screening in the national cervical cancer screening programme in Sri Lanka during 2019 and 2020 | ||||||||||||
| Year of | Month of screening | Total | |||||||||||
| screening | Jan | Feb | Mar | Apr | May | Jun | Jul | Aug | Sep | Oct | Nov | Dec | |
| Number of women screened (with CBE) | |||||||||||||
| 2019 – n | 19,972 | 27,150 | 26,329 | 10,288 | 16,643 | 17,778 | 17,947 | 15,890 | 16,884 | 17,667 | 16,207 | 20,253 | 223,008 |
| 2020 – n | 22,637 | 28,509 | 13,254 | 356 | 2303 | 12,271 | 17,982 | 15,563 | 15,966 | 10,057 | 8558 | 16,431 | 163,887 |
| Change – %† | +13.3 | +5.0 | −49.7 | −96.5 | −86.2 | −31.0 | +0.2 | −2.1 | −5.4 | −43.1 | −47.2 | −18.9 | −26.5 |
-
*
Change is calculated as (numbers in 2020 − numbers in 2019)/(numbers in 2019) × 100; CIN: cervical intraepithelial neoplasia.
-
†
Change is calculated as (numbers in 2020 − numbers in 2019)/(numbers in 2019) × 100; CBE: clinical breast examination.
Table 4
Monthly change in number of women undergoing screening with FIT in the national colorectal cancer screening programme in Thailand during 2019 and 2020.
| Year of | Month of screening | Total | ||||||||||||
|---|---|---|---|---|---|---|---|---|---|---|---|---|---|---|
| screening | Jan | Feb | Mar | Apr | May | Jun | Jul | Aug | Sep | Oct | Nov | Dec | ||
| Number of women screened (with FIT) | ||||||||||||||
| 2019 – n | 33,860 | 47,449 | 65,192 | 80,255 | 144,943 | 185,289 | 120,682 | 88,974 | 15,365 | 10,108 | 17,909 | 22,368 | 832,394 | |
| 2020 – n | 27,076 | 33,731 | 62,283 | 23,556 | 38,778 | 88,622 | 93,219 | 70,560 | 61,219 | 24,049 | 22,549 | 31,608 | 577,250 | |
| Change – %* | −20.0 | −28.9 | −4.5 | −70.6 | −73.2 | −52.2 | −22.8 | −20.7 | +298.4 | +137.9 | +25.9 | +41.3 | −30.7 | |
-
*
Change is calculated as (numbers in 2020 -− numbers in 2019) / (numbers in 2019) ×x 100; FIT: faecal immunochemical test.
Table 5
Change in number of women undergoing VIA screening and colposcopy, and high-grade CIN detected in the national cervical cancer screening programme in Bangladesh during 2019 and 2020 (A), and change in number of women undergoing CBE and CBE positivity in the national breast cancer screening programme in Bangladesh during 2019 and 2020 (B).
| A | Change in number of women undergoing VIA screening and colposcopy, and high-grade CIN detected in the national cervical cancer screening programme in Bangladesh during 2019 and 2020 | ||||||||||||
|---|---|---|---|---|---|---|---|---|---|---|---|---|---|
| Year of | Month of screening | Total | |||||||||||
| screening | Jan | Feb | Mar | Apr | May | Jun | Jul | Aug | Sep | Oct | Nov | Dec | |
| Number of women screened (with VIA) | |||||||||||||
| 2019 – n | 34,132 | 31,448 | 39,775 | 33,559 | 21,434 | 26,694 | 33,366 | 27,597 | 35,636 | 37,019 | 36,208 | 34,663 | 391,531 |
| 2020 – n | 52,873 | 57,759 | 24,600 | 1719 | 2097 | 5078 | 11,740 | 30,644 | 30,250 | 33,466 | 47,093 | 39,088 | 336,407 |
| Change – %* | +54.9 | +83.7 | −38.2 | −94.9 | −90.2 | −81.0 | −64.8 | +11.0 | −15.1% | −9.6 | +30.1 | +12.8 | −14.1 |
| Number of women undergoing Colposcopy (data given for each quarter)** | |||||||||||||
| 2019 – n | 429 | 342 | 494 | 1265 | |||||||||
| 2020 – n | 440 | 86 | 393 | 919 | |||||||||
| Change – %* | +2.6 | −74.8 | −20.4 | −27.4 | |||||||||
| Number of women detected with CIN 2 or worse lesions (data given for each quarter)** | |||||||||||||
| 2019 – n | 106 | 62 | 75 | 243 | |||||||||
| 2020 – n | 56 | 38 | 68 | 162 | |||||||||
| Change – %* | −47.2 | −38.7 | −9.3 | −33.3 | |||||||||
| B | Change in number of women undergoing CBE and CBE positivity in the national breast cancer screening programme in Bangladesh during 2019 and 2020 | ||||||||||||
| Year of | Month of screening | Total | |||||||||||
| screening | Jan | Feb | Mar | Apr | May | Jun | Jul | Aug | Sep | Oct | Nov | Dec | |
| Number of women screened (with CBE) | |||||||||||||
| 2019 – n | 33,358 | 30,164 | 37,190 | 33,657 | 22,077 | 26,389 | 33,354 | 27,678 | 36,059 | 37,227 | 35,866 | 34,789 | 387,808 |
| 2020 – n | 51,313 | 57,271 | 24,508 | 1716 | 2046 | 5022 | 11,712 | 30,540 | 29,991 | 33,336 | 46,609 | 38,717 | 332,781 |
| Change – %† | +53.8 | +89.9 | −34.1 | −94.9 | −90.7 | −81.0 | −64.9 | +10.3 | −16.8 | −10.5 | +30.0 | +11.3 | −14.2 |
| Number and percentage of women who tested positive on CBE | |||||||||||||
| 2019 – n | 997 | 506 | 465 | 666 | 1048 | 1333 | 1202 | 875 | 856 | 1012 | 879 | 770 | 10,609 |
| (%) | (3.0) | (1.7) | (1.3) | (2.0) | (4.7) | (5.1) | (3.6) | (3.2) | (2.4) | (2.7) | (2.5) | (2.2) | (2.7) |
| 2020 – n | 594 | 778 | 234 | 37 | 63 | 99 | 114 | 158 | 382 | 272 | 950 | 367 | 4048 |
| (%) | (1.2) | (1.4) | (1.0) | (2.2) | (3.1) | (2.0) | (1.0) | (0.5) | (1.3) | (0.8) | (2.0) | (0.9) | (1.2) |
-
*
Change is calculated as (numbers in 2020 − numbers in 2019)/(numbers in 2019) × 100; **Data presented are from the colposcopy clinic of the main hospital in Dhaka, Bangladesh; VIA: visual inspection with acetic acid; CIN: cervical intraepithelial neoplasia.
-
†
Change is calculated as (numbers in 2020 − numbers in 2019)/(numbers in 2019) × 100; CBE: clinical breast examination.
Table 6
Site-specific change in number of women undergoing VIA screening and/or colposcopy, and high-grade CIN detected in the national cervical cancer screening programme in Morocco during 2019 and 2020 (A), and site-specific change in number of women undergoing CBE screening and/or mammography investigations, and breast cancers detected in the national breast cancer screening programme in Morocco during 2019 and 2020 (B).
| A | Site-specific change in number of women undergoing VIA screening and/or colposcopy, and high-grade CIN detected in the national cervical cancer screening programme in Morocco during 2019 and 2020 | |||||||||||||
|---|---|---|---|---|---|---|---|---|---|---|---|---|---|---|
| Year of screening | Screening site | Total | ||||||||||||
| Tanger Tetouan Al Hoceima | Fès Meknès | Rabat Salé Kénitra | Béni Mellal Khénifra | Grand Casablanca Settat | Marrakech Safi | Drâa Tafilalet | Souss Massa | Guelmim Oued Noun | Laayoune Sakia El Hamra | Eddakhla Oued Eddahab | ||||
| Number of women screened (with VIA) | ||||||||||||||
| 2019 – n | 10,965 | 115,348 | 45,904 | 15,777 | 72,186 | 46,113 | 8457 | 22,723 | 2521 | 1180 | 30 | 341,204 | ||
| 2020 – n | 4988 | 44,301 | 14,596 | 17,838 | 29,952 | 20,324 | 4387 | 13,350 | 2437 | 824 | 0 | 152,997 | ||
| Change – %* | −54.5 | −61.6 | −68.2 | 13.1 | −58.5 | −55.9 | −48.1 | −41.2 | −3.3 | −30.2 | −100.0 | –55.2 | ||
| Number of women undergoing colposcopy | ||||||||||||||
| 2019 – n | 899 | 2954 | 1520 | 832 | 1479 | 340 | 244 | 726 | 8994 | |||||
| 2020 – n | 303 | 1375 | 865 | 913 | 409 | 105 | 80 | 251 | 4301 | |||||
| Change – %* | −66.3 | −53.5 | −43.1 | 9.7 | −72.3 | −69.1 | −67.2 | −65.4 | –52.2 | |||||
| Number of women detected with CIN 2 or worse lesions | ||||||||||||||
| 2019 – n | 39 | 43 | 26 | 20 | 35 | 2 | 4 | 15 | 184 | |||||
| 2020 – n | 19 | 34 | 18 | 43 | 14 | 0 | 4 | 14 | 146 | |||||
| Change – %* | −51.3 | −20.9 | −30.8 | 115.0 | −60.0 | −100.0 | 0.0 | −6.7 | –20.7 | |||||
| B | Site-specific change in number of women undergoing CBE screening and/or mammography investigations, and breast cancers detected in the national breast cancer screening programme in Morocco during 2019 and 2020 | |||||||||||||
| Year of screening | Screening site | Total | ||||||||||||
| Tanger Tetouan Al Hoceima | Oriental | Fès Meknès | Rabat Salé Kénitra | Béni Mellal Khénifra | Grand Casablanca Settat | Marrakech Safi | Drâa Tafilalet | Souss Massa | Guelmim Oued Noun | Laayoune Sakia El Hamra | Eddakhla Oued Eddahab | |||
| Number of women screened (with CBE) | ||||||||||||||
| 2019 – n | 113,755 | 99,230 | 269,517 | 210,892 | 158,305 | 249,501 | 190,757 | 45,150 | 150,947 | 18,569 | 8826 | 155 | 1,515,604 | |
| 2020 – n | 60,170 | 76,848 | 99,917 | 81,357 | 101,285 | 117,061 | 99,441 | 23,521 | 85,295 | 13,648 | 8047 | 112 | 766,702 | |
| Change – %† | −47.1 | −22.6 | −62.9 | −61.4 | −36.0 | −53.1 | −47.9 | −47.9 | −43.5 | −26.5 | −8.8 | −27.7 | −49.4 | |
| Number and percentage of women who tested positive on CBE | ||||||||||||||
| 2019 – n | 3908 | 805 | 4956 | 2888 | 2102 | 2572 | 1543 | 632 | 2324 | 21,730 | ||||
| (%) | (3.4) | (0.8) | (1.8) | (1.4) | (1.3) | (1.0) | (0.8) | (1.4) | (1.5) | (1.4) | ||||
| 2020 – n | 2807 | 418 | 3265 | 1563 | 1674 | 1354 | 976 | 316 | 1244 | 13,617 | ||||
| (%) | (4.7) | (0.5) | (3.3) | (1.9) | (1.7) | (1.2) | (1.0) | (1.3) | (1.5) | (1.8) | ||||
| Number undergoing mammography investigations among CBE-positive women | ||||||||||||||
| 2019 – n | 1772 | 403 | 3506 | 2037 | 1378 | 2489 | 845 | 470 | 1311 | 14,211 | ||||
| 2020 – n | 1381 | 269 | 2267 | 982 | 709 | 1334 | 652 | 294 | 936 | 8824 | ||||
| Change – %† | –22.1 | –33.3 | –35.3 | –51.8 | –48.5 | –46.4 | –22.8 | –37.4 | –28.6 | –37.9 | ||||
| Number of women detected with breast cancers | ||||||||||||||
| 2019 – n | 249 | 82 | 346 | 186 | 65 | 204 | 79 | 49 | 115 | 1375 | ||||
| 2020 – n | 213 | 16 | 271 | 174 | 65 | 125 | 91 | 30 | 127 | 1112 | ||||
| Change – %† | –14.5 | –80.5 | –21.7 | –6.5 | 0.0 | –38.7 | 15.2 | –38.8 | 10.4 | –19.1 | ||||
-
*
Change is calculated as (numbers in 2020 -–− numbers in 2019) / (numbers in 2019) x× 100; VIA: visual inspection with acetic acid; CIN: cervical intraepithelial neoplasia.
-
†
Change is calculated as (numbers in 2020 − numbers in 2019)/(numbers in 2019) × 100; CBE: clinical breast examination.
Additional files
Download links
A two-part list of links to download the article, or parts of the article, in various formats.
Downloads (link to download the article as PDF)
Open citations (links to open the citations from this article in various online reference manager services)
Cite this article (links to download the citations from this article in formats compatible with various reference manager tools)
Quantification of impact of COVID-19 pandemic on cancer screening programmes – a case study from Argentina, Bangladesh, Colombia, Morocco, Sri Lanka, and Thailand
eLife 12:e86527.
https://doi.org/10.7554/eLife.86527


