100 years of anthropogenic impact causes changes in freshwater functional biodiversity
- Environmental Genomics Group, School of Biosciences, University of Birmingham, United Kingdom
- School of Geography, Earth & Environmental Sciences, University of Birmingham, United Kingdom
- Department Evolutionary Ecology & Environmental Toxicology, Faculty of Biological Sciences, Goethe University Frankfurt, Germany
- Lake Group, Department of Ecoscience, Aarhus University, Denmark
- School of Natural Sciences, Environment Centre Wales, Deiniol Road, Bangor University, United Kingdom
- Department Marine Sciences and Institute of Bioinformatics, University of Georgia, United States
- LOEWE Centre for Translational Biodiversity Genomics (LOEWE‐TBG), Germany
- Department Media-related Toxicology, Institute for Molecular Biology and Applied Ecology (IME), Germany
- The Alan Turing Institute, British Library, United Kingdom
Figures
Figure 1
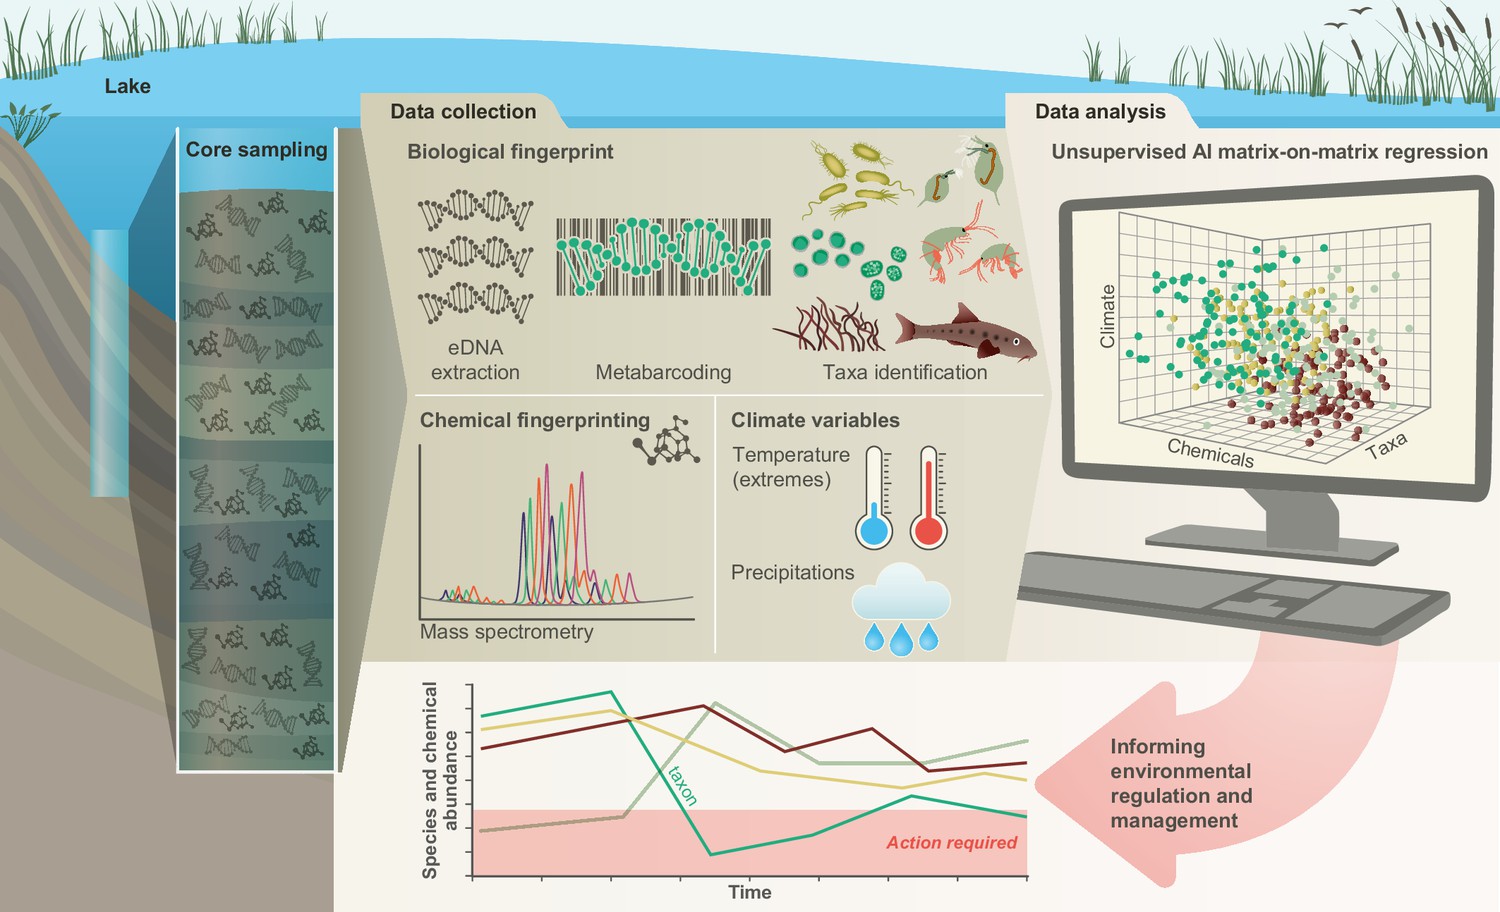
Conceptual framework.
A sedimentary archive spanning 100 years was sampled from Lake Ring, Denmark and dated using radioisotopes. Both biotic and abiotic changes were empirically quantified through time: (1) community-level biodiversity was reconstructed by applying multilocus metabarcoding to environmental DNA isolated from layers of sediment (biological fingerprinting); (2) chemical signatures were quantified from the same sediment layers using mass spectrometry analysis (chemical fingerprinting); (3) climate data were collected from publicly available databases. Explainable network models with multimodal learning were applied to identify significant correlations between system-level biodiversity, chemical fingerprinting, and climate variables. Taxonomic units (families) impacted by environmental factors were identified and environmental factors ranked based on their effects on community biodiversity. This approach enables the prioritisation of conservation and mitigation interventions.
Figure 2
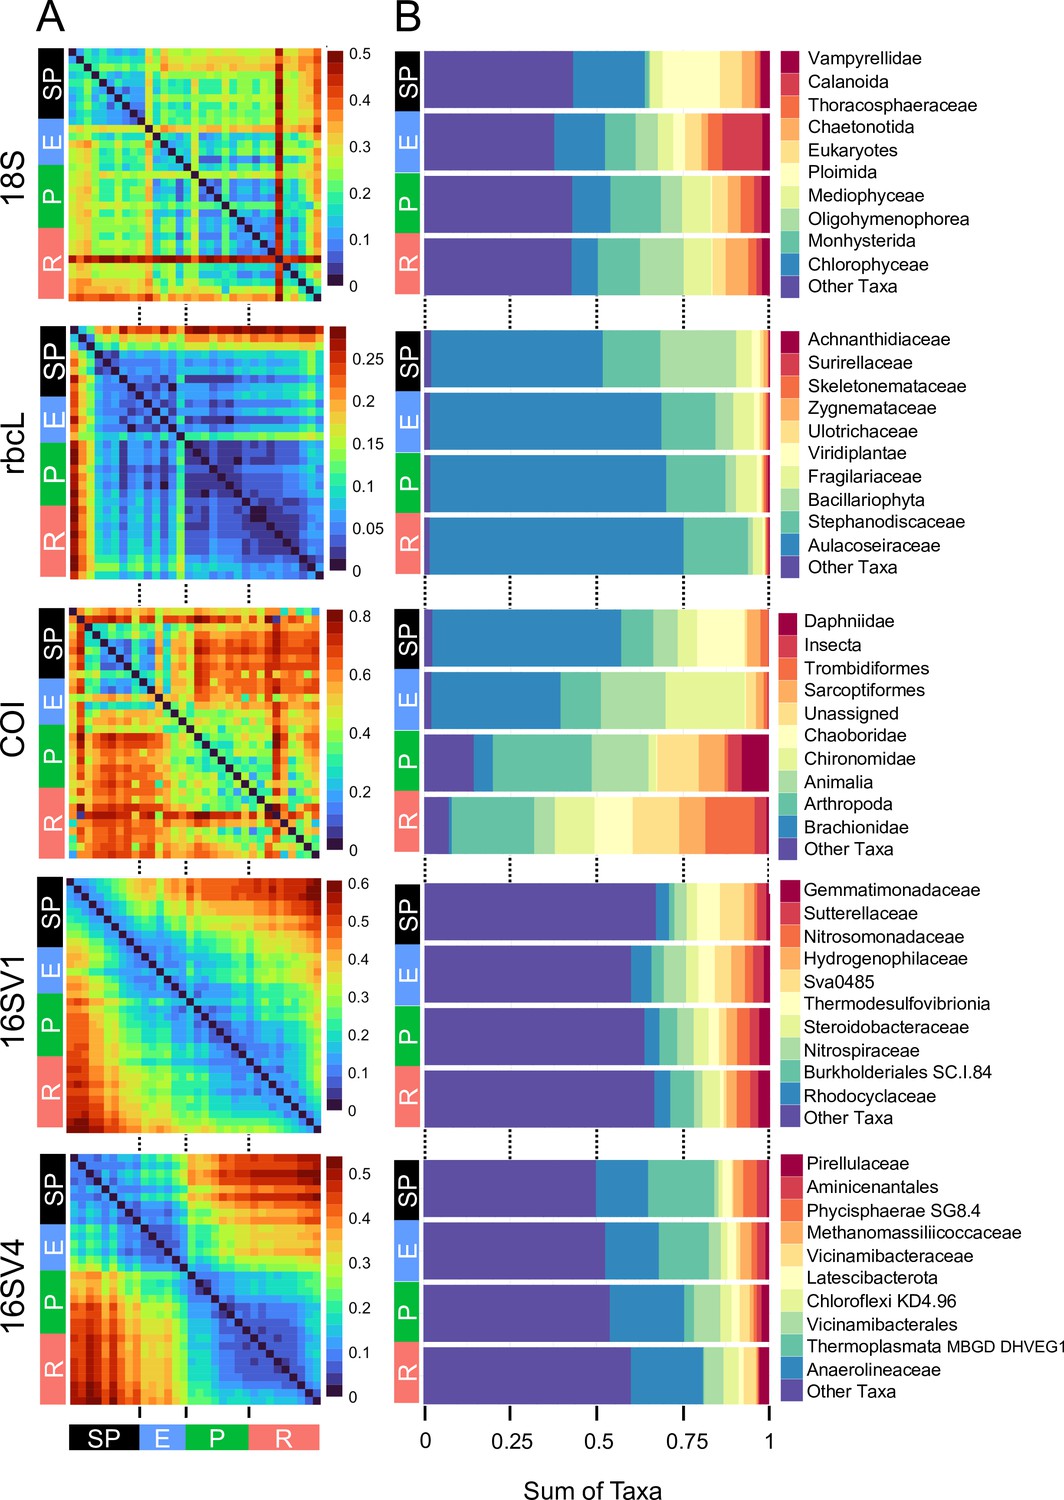
Biodiversity compositional changes.
(A) Weighted unifrac beta diversity heatmaps between each pair of sediment layers spanning a century (1916–2016) for the five barcodes used in this study (18S, rbcL, COI, 16SV1 and 16SV4). The PERMANOVA statistics in Table 1 support these plots. The scale used may be different among the heatmaps. (B) Taxonomic bar plots including the top 10 most abundant families identified across five barcodes (18S, rbcL, COI, 16SV1 and 16SV4). shown per lake phase: SP - semi-pristine; E - eutrophic; P - pesticides; R - recovery.
Figure 3
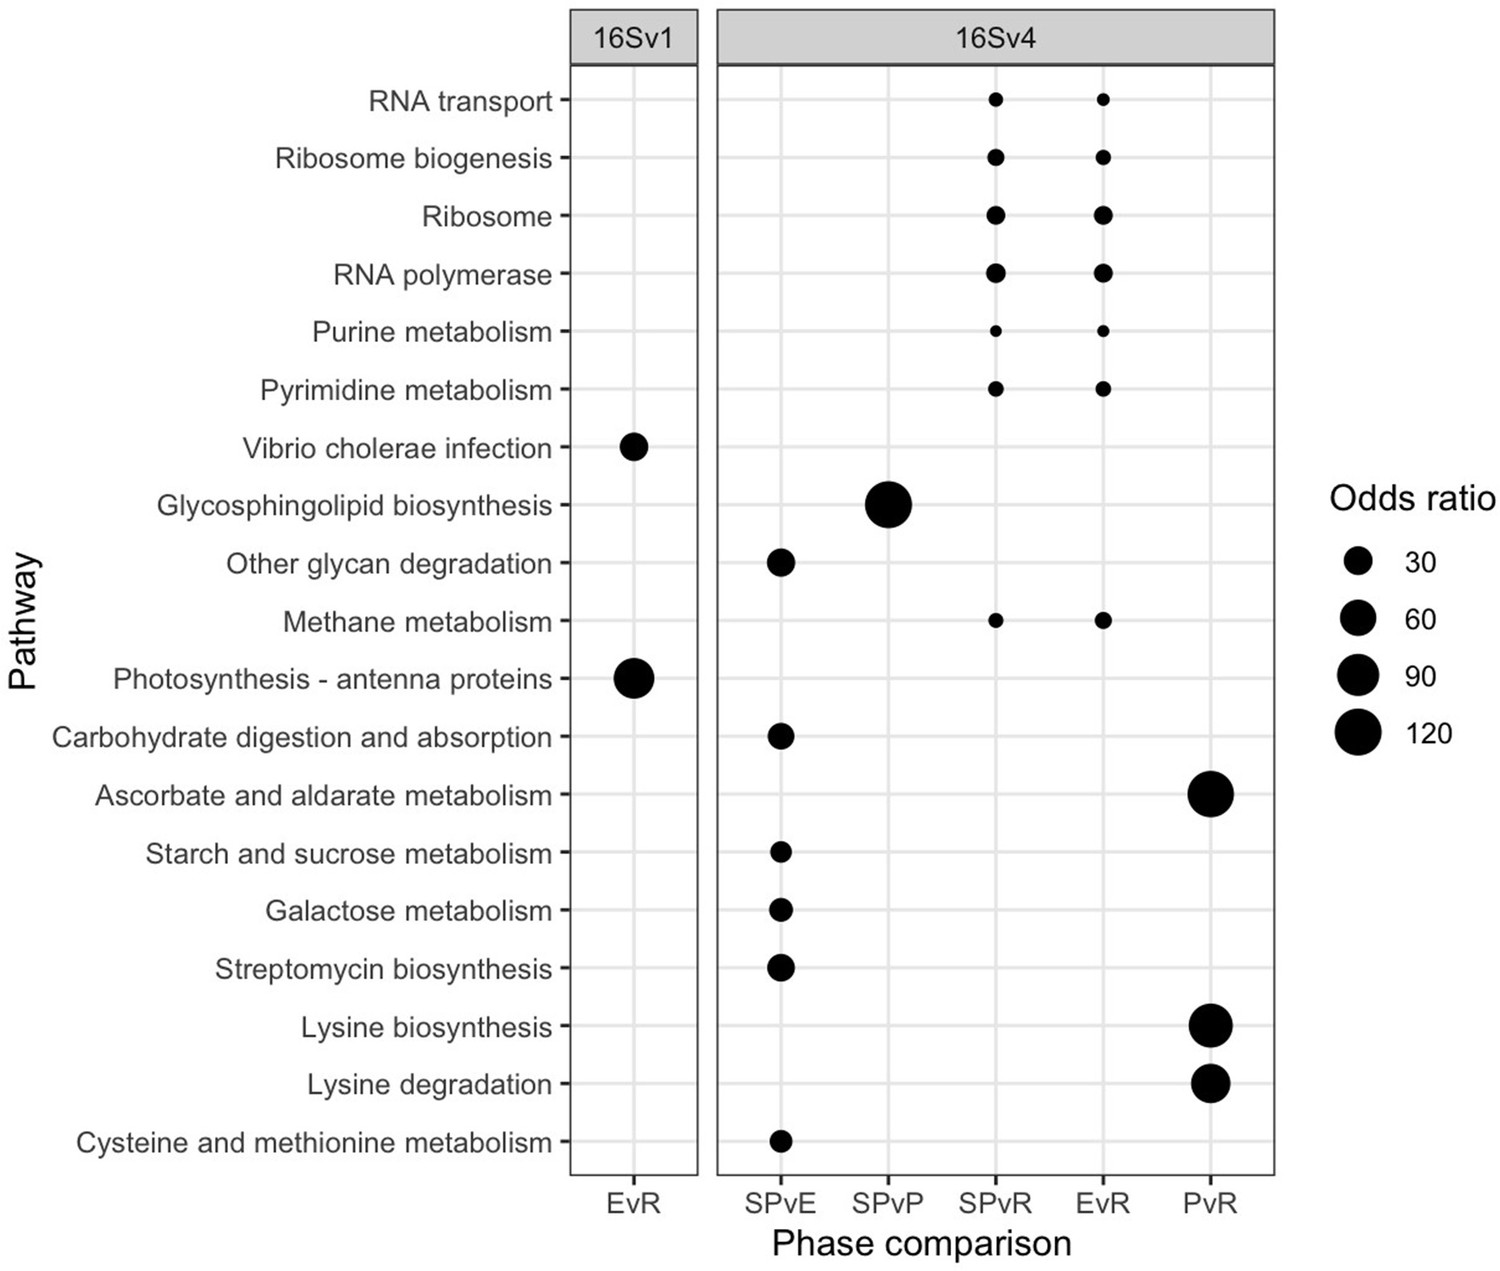
Functional analysis.
Functional pathways that are significantly differentially enriched between lake phases are shown for the 16SV1 and the 16SV4 barcodes (Fisher’s exact test, p <0.05). The lake phases are as in Figure 2: SP - semi-pristine; E - eutrophic; P - pesticides; R - recovery. Odds ratios indicate the representation of each pathway in the pairwise comparisons.
Figure 4
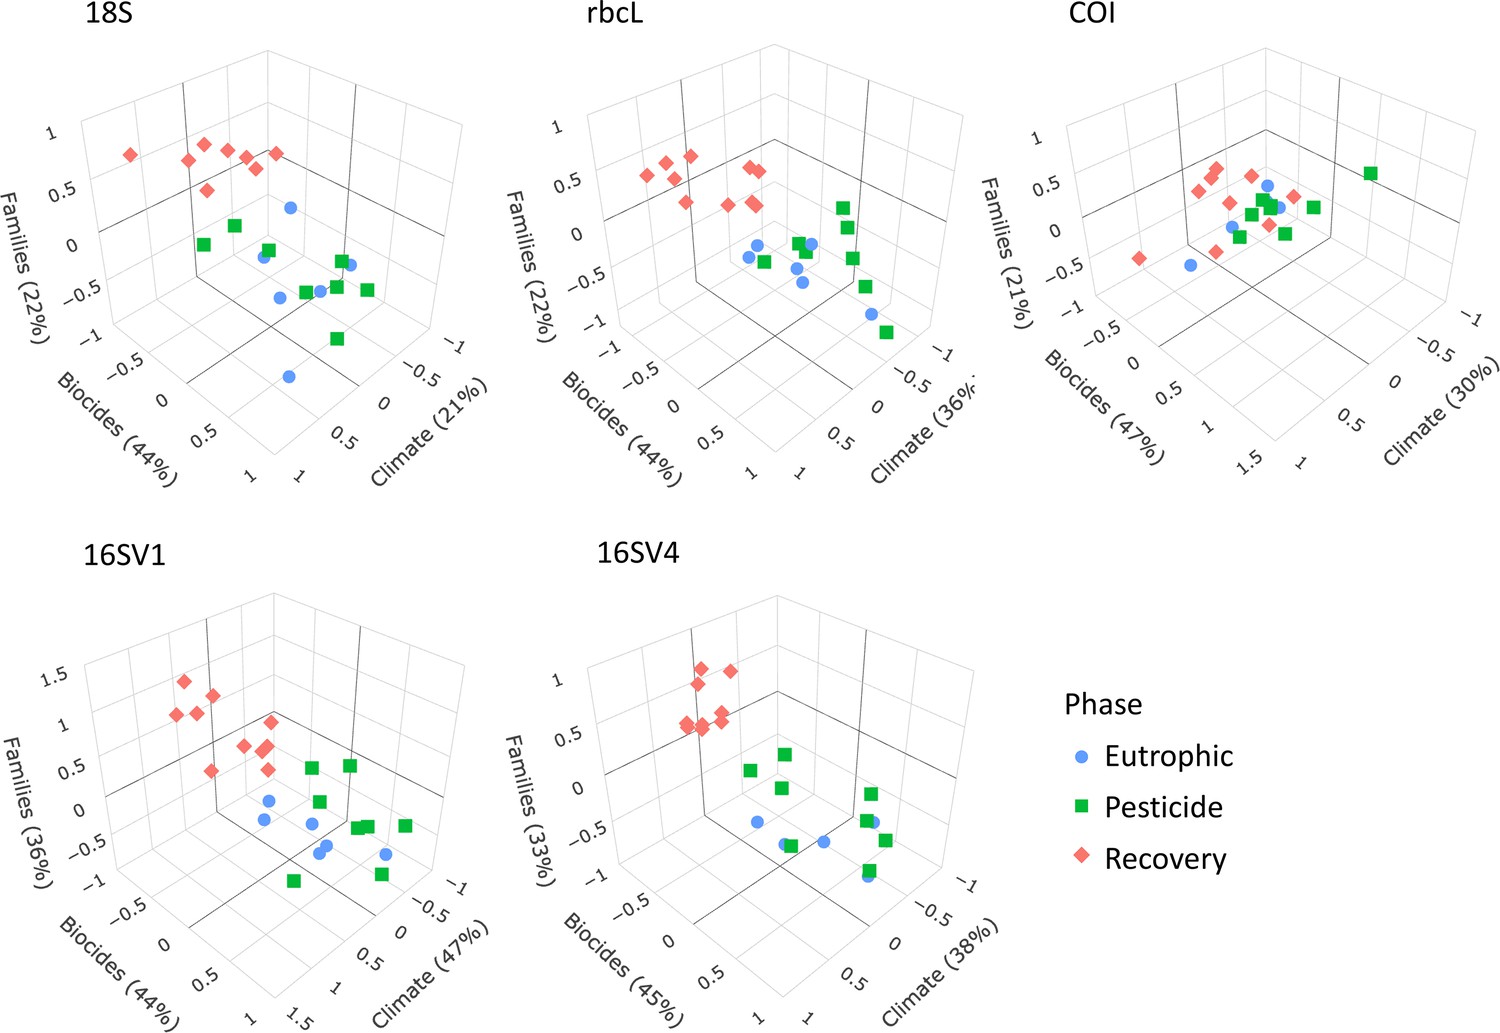
sCCA 3D plots.
Sparse canonical correlation analysis 3D plots for the five barcodes used (18S, rbcL, COI, 16SV1 and 16SV4), showing the proportion of biodiversity variance explained by the biocides and climate variables. As biocides were introduced around the 1960s, this analysis spans the most recent three lake phases (Eutrophic, Pesticide and Recovery). Interactive version available: https://environmental-omics-group.github.io/Biodiversity_Monitoring/.
Figure 5
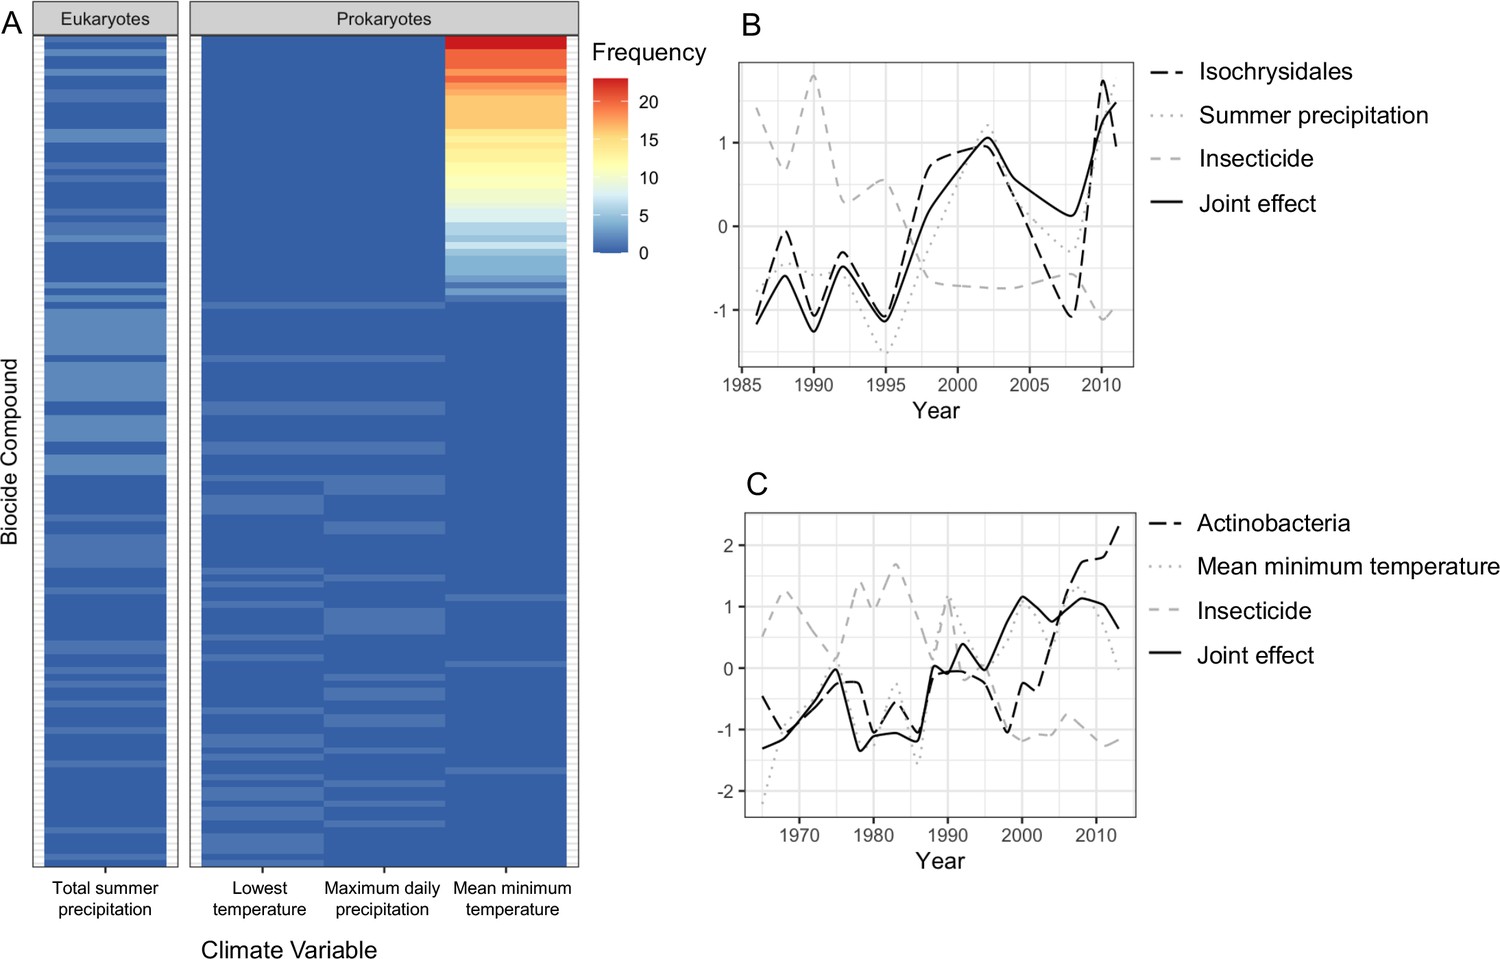
Joint effects of environmental variables on biodiversity.
(A) heatmap showing the frequency of joint effects of biocides and climate variables in eukaryotes (data from the 18S barcode) and prokaryotes (combined data from 16SV1 and 16SV4 barcodes). The biocides are ranked based on their correlation coefficient with taxonomic units and climate variables. Ranking of biocide types is provided in Supplementary file 3; (B) temporal correlation between the family Isochrysidales, summer precipitation and insecticides. The joint effect of summer precipitation and insecticides is also shown; (C) temporal correlation between Pleosporales, insecticides and mean minimum temperature. The joint effect of insecticides and mean minimum temperature is also shown. The families’ relative abundance over time in plots B and C are standardized values.
Appendix 1—figure 1
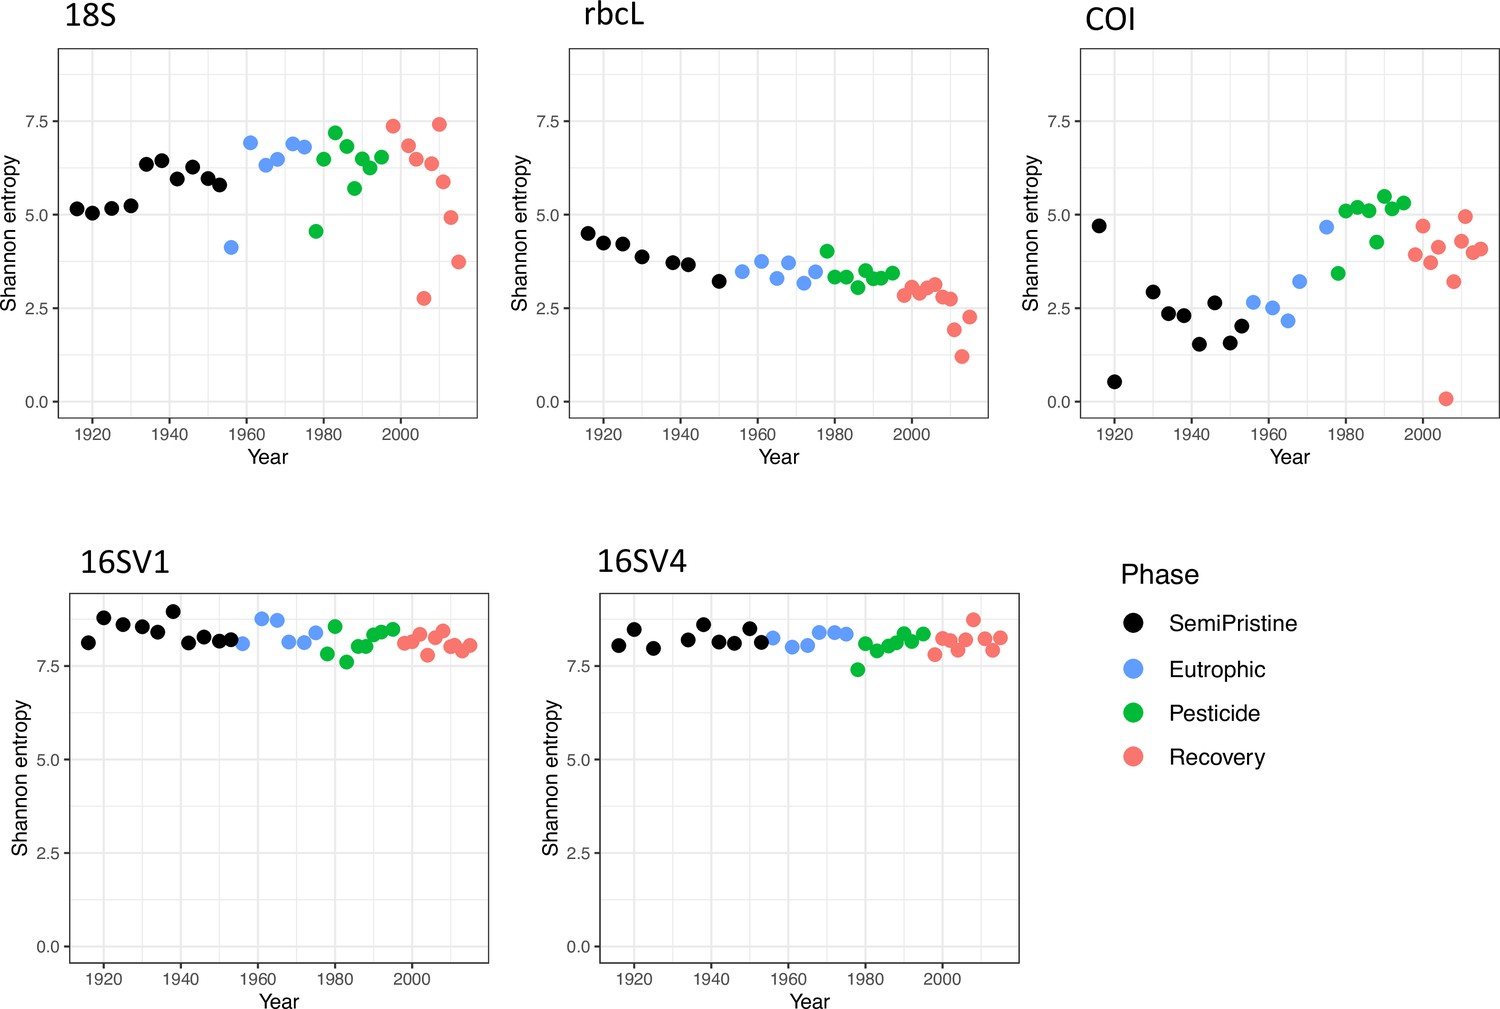
Alpha diversity.
Alpha diversity, measured as Shannon entropy, is shown for the five barcodes used in this study (16SV1, 16SV4, 18S, COI and rbcl) between 1916-2016. The four lake phases are colour-coded as follows: Black - Semi-pristine; blue - Eutrophic; green - Pesticides; red - Recovery. Kruskal-Wallis test across all phases: 18S: h 4.199, Pval = 0.241; rbcL: h 21.677, Pval<0.000; COI: h 16.958, Pval = 0.001; 16SV1: h 7.001, Pval = 0.072; 16SV4: h 2.220, Pval = 0.528.
Appendix 1—figure 2
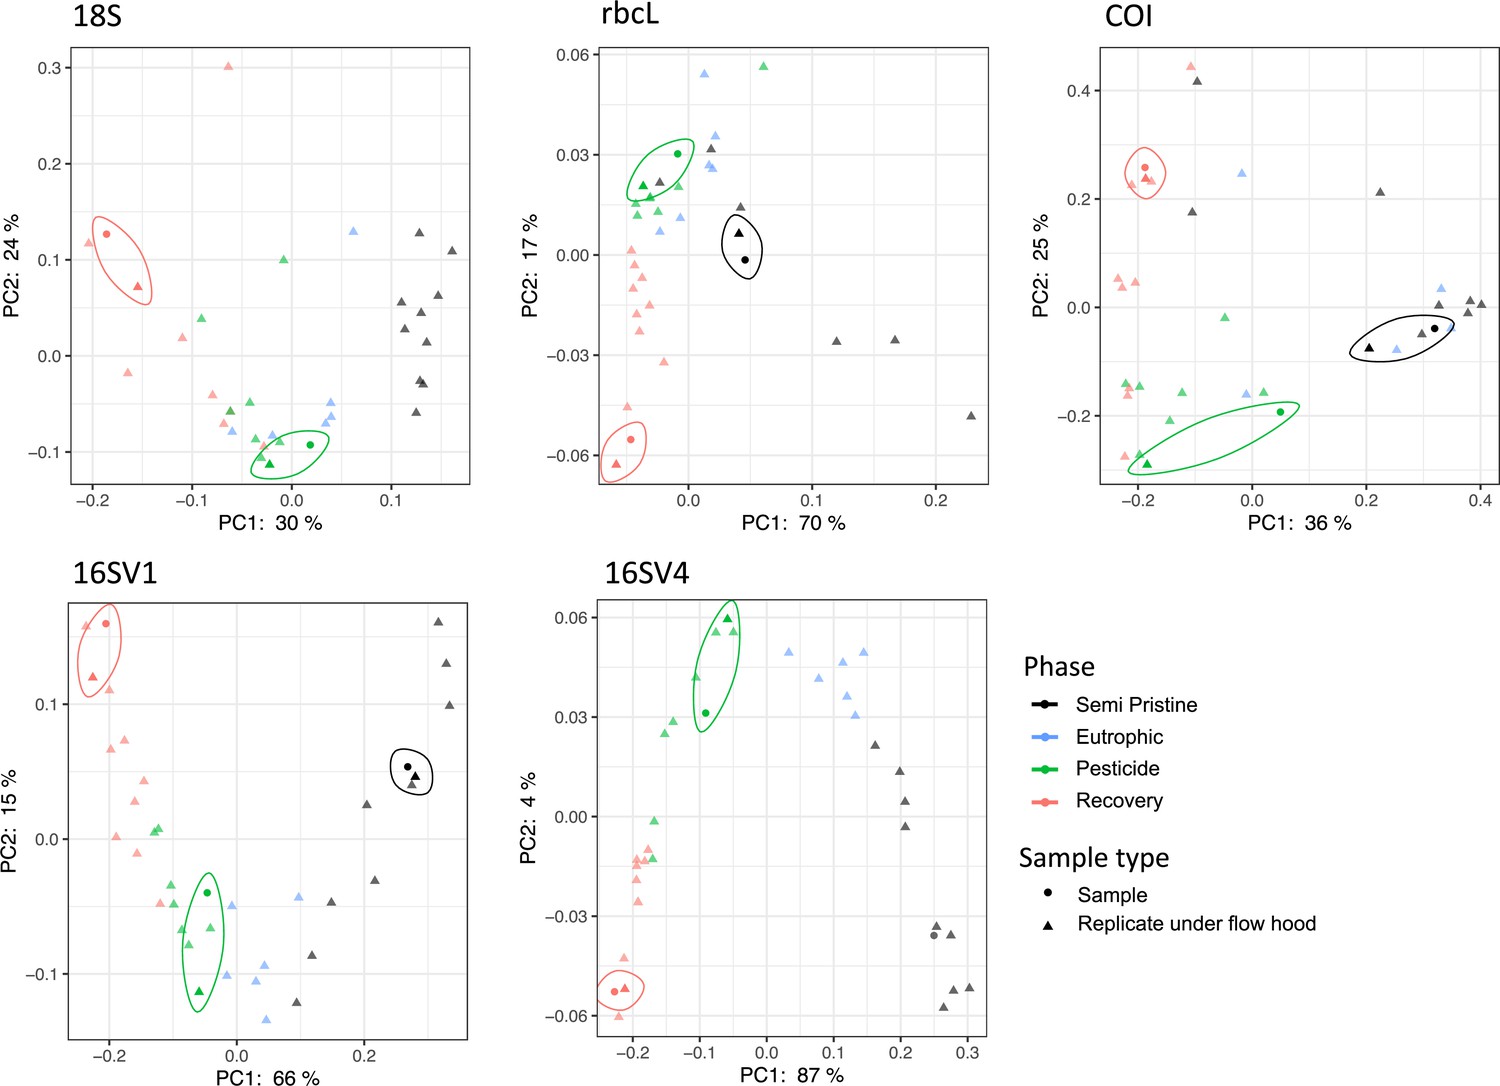
Principal Coordinate Analysis.
PCoA visualization of weighted unifrac distance between samples. Positive controls for PCR consist of duplicates of up to three samples from the sedimentary archive for each of the five barcodes used in the study (16SV1, 16SV4, 18S, rbcL, and COI). Replicated samples are circled. The four lake phases are colour-coded as follows: Black - Semi-pristine; blue - Eutrophic; green - Pesticides; red - Recovery.
Appendix 1—figure 3
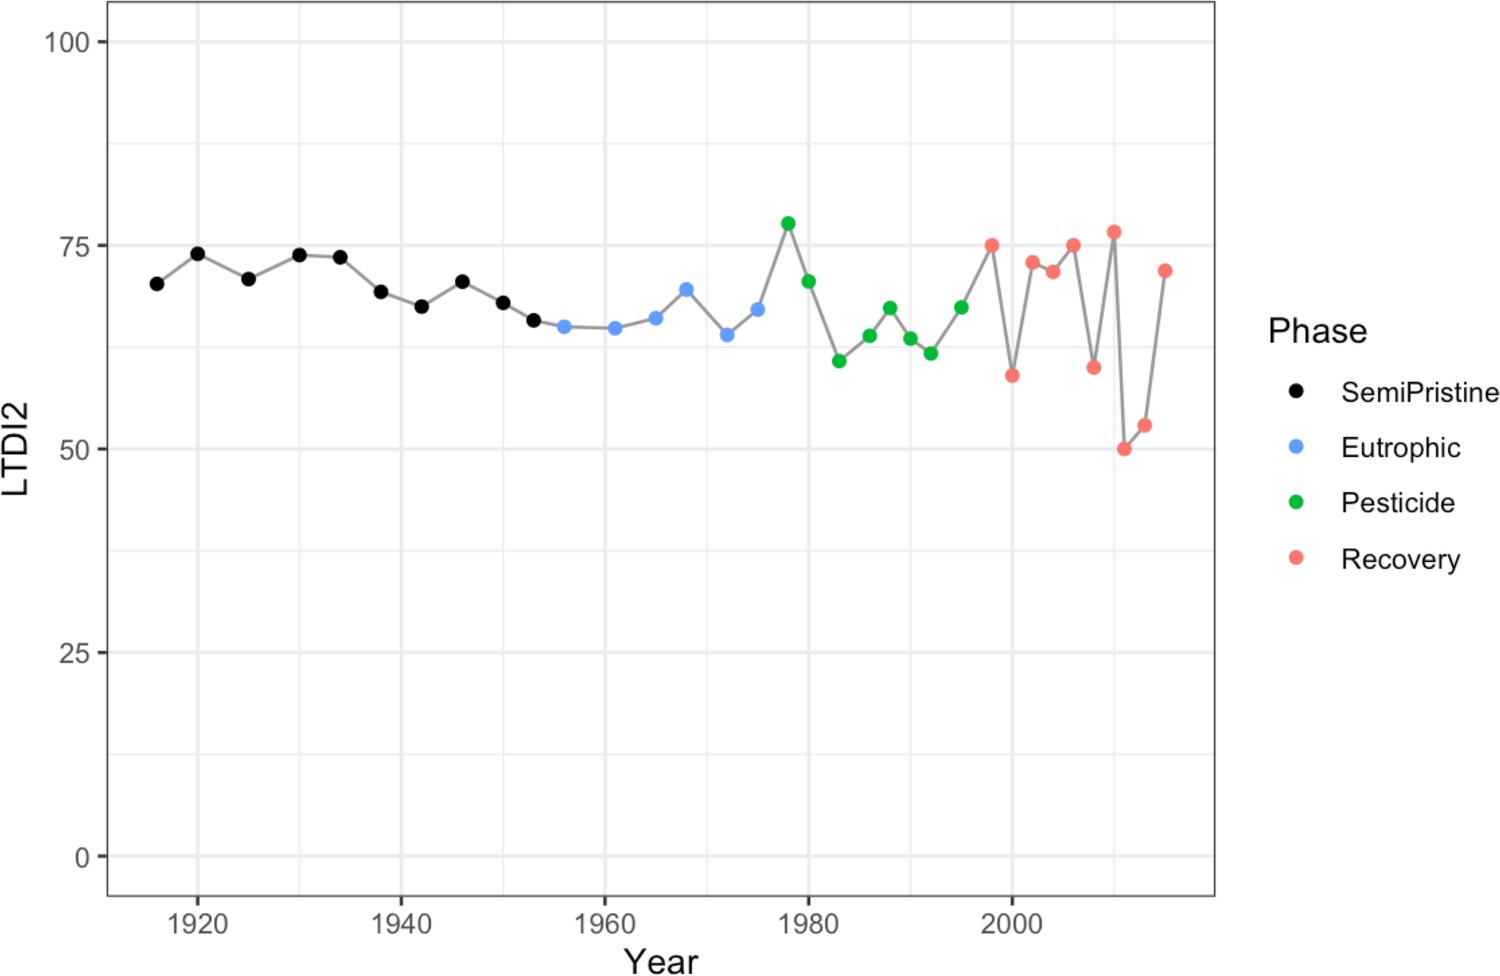
Trophic Diatom Index.
LTDI2 calculated using the diatom species identified in our study between 1915 and 2015 with the rbcL barcode and the ‘DARLEQ3’ (Diatoms for Assessing River and Lake Ecological Quality) tool. Mean value of 67.59, standard deviation 6.3. The four lake phases are colour-coded as follows: Black - Semi-pristine; blue - Eutrophic; green - Pesticides; red - Recovery.
Appendix 1—figure 4
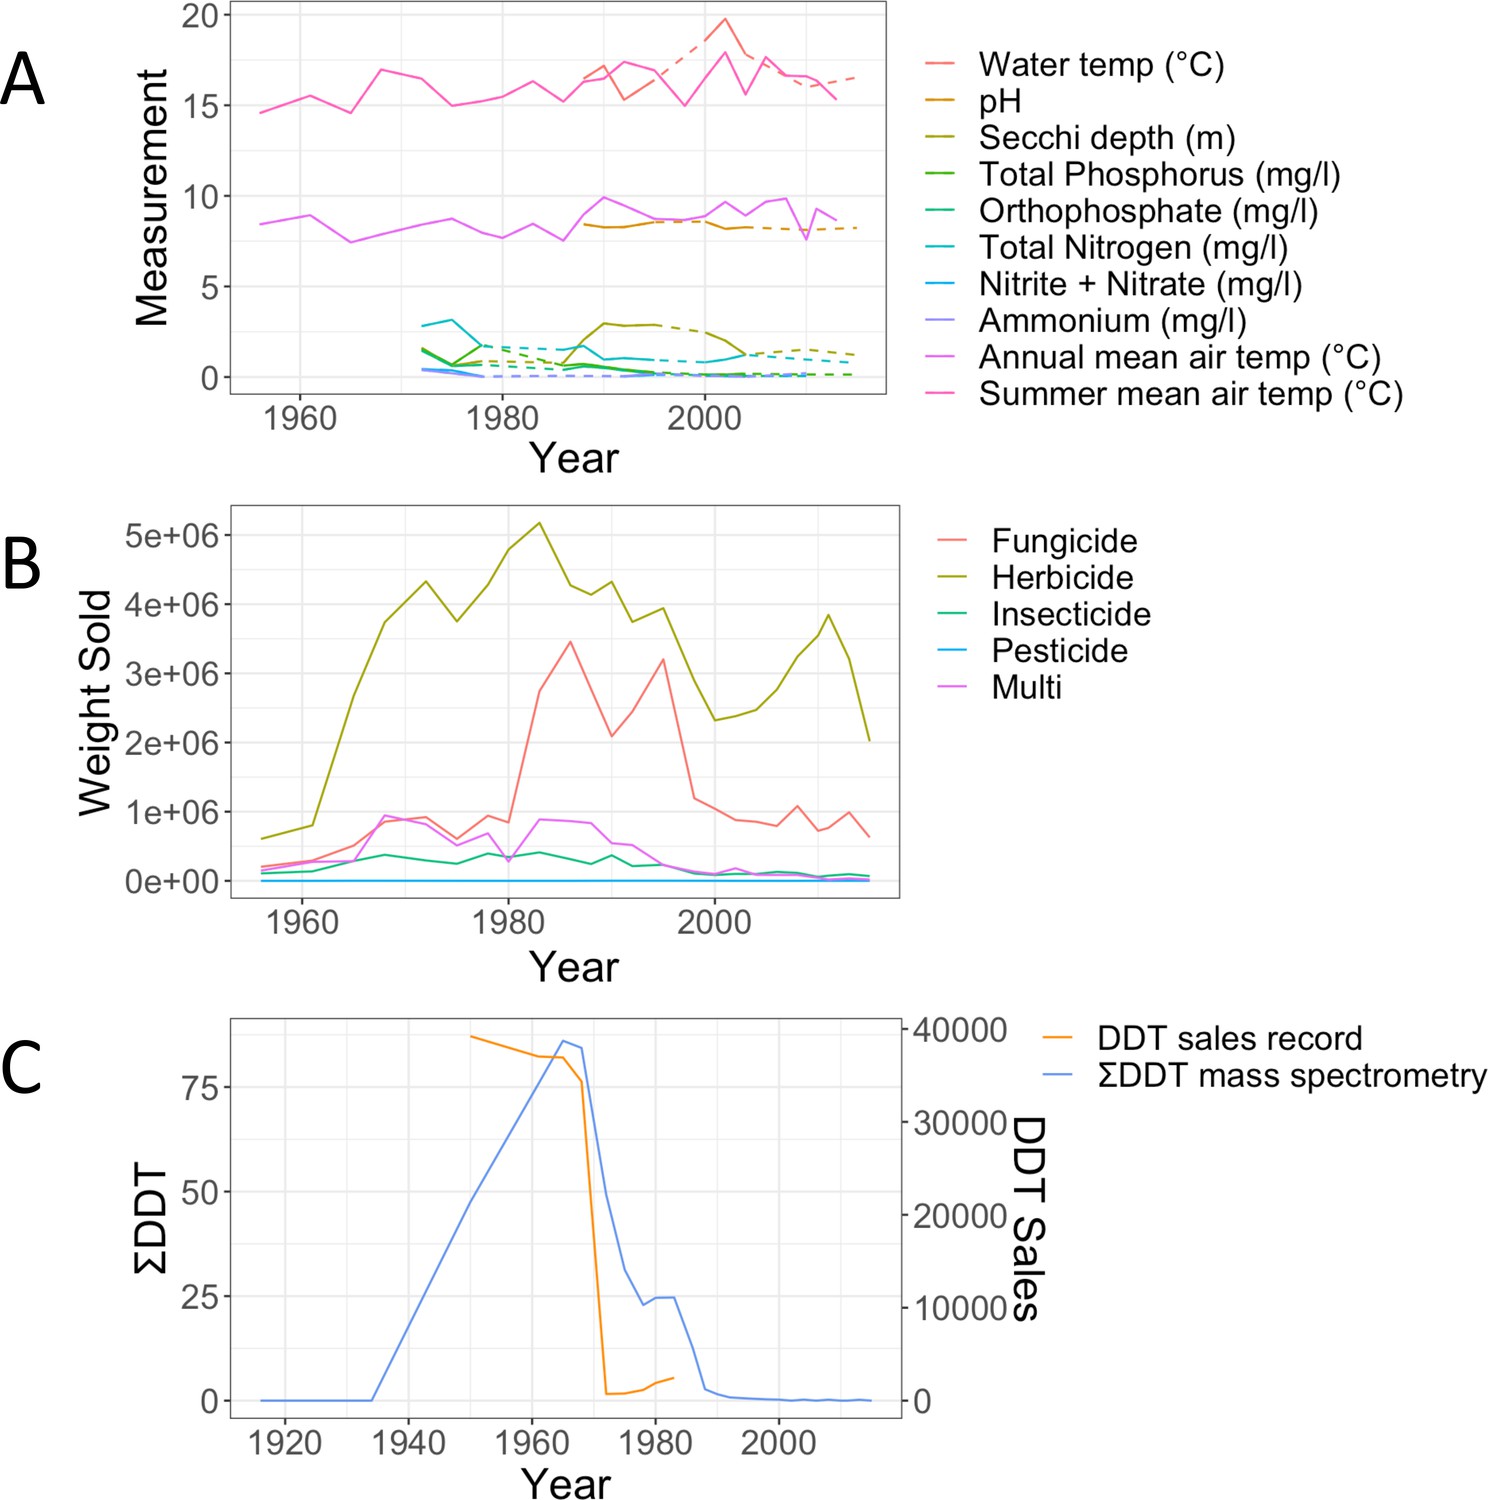
Biocides records.
(A) Records of physico-chemical parameters measured in Lake Ring. Dotted lines indicate missing data points. Summer and annual mean temperature were recorded at a weather station 80km from Lake Ring. (B) Record of biocides sales in Denmark (Million Tons/Year) between 1950 and 2016, downloaded from the Danish national archives; (C) empirical record of DDT measured from the sediment layers of Lake Ring using mass spectrometry analysis (ng/g; blue) and plotted against the sales record in Denmark (Million Tons/year; orange). DDT was banned in Denmark in 1986.
Appendix 1—figure 5
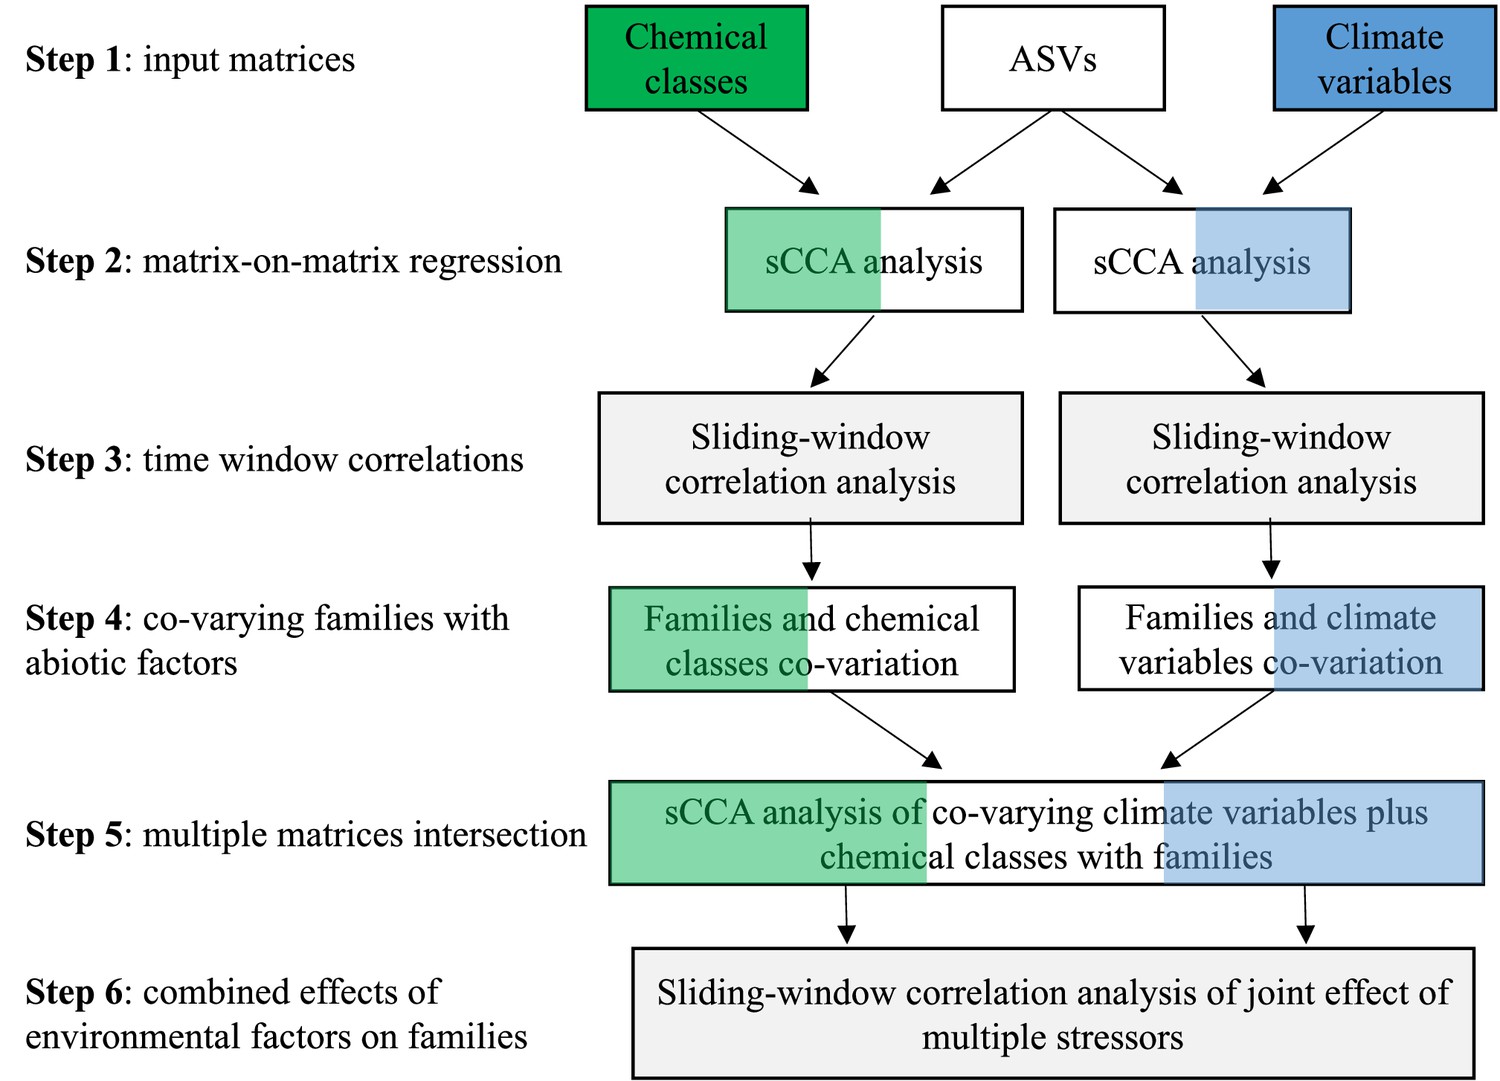
AI pipeline.
The analytical pipeline consists of six main steps: Step 1 is the preparation of input data matrices (ASVs, biocides and climate variables) to be used in the sCCA analysis. The type of environmental data may vary with the study; Step 2 is the matrix-on-matrix regression between the ASVs and another environmental data matrix, biocides or climate in this study. Following the sCCA analysis, the ASVs are assigned to family level (or other relevant taxonomic group); Step 3 consists of a Sliding Window (Pearson) Correlation (SWC) analysis, used to identify significant temporal correlations between families and environmental variables from the sCCA analysis; Step 4 identifies the families that co-vary with either biocides or climate variables independently; Step 5 is used to perform an intersection analysis among multiple matrices (families, biodices and climate variables); Step 6 applies a Sliding Window (Pearson) Correlation (SWC) analysis to identify families, whose relative abundance changes both with biocides and climate variables over time. The pipeline enables the ranking of environmental variables or their combination thereof that is inversely correlated to the relative abundance of families over time.
Tables
Table 1
PERMANOVA on beta diversity.
Permutational Multivariate Analysis of Variance using weighted Unifrac distances ASV matrices testing for pairwise differences between lake phases across the five barcodes used in the study (16SV1, 16SV4, 18S, COI, rbcL) with 999 permutations. Significant terms (P-values <0.05 after applying Benjamini & Hochberg correction for multiple testing) are in bold. The lake phases are as follows: SP - semi-pristine; E - Eutrophic; P - pesticides; R - recovery.
| Phase | 16SV1 | 16SV4 | 18S | COI | rbcL | ||||||
|---|---|---|---|---|---|---|---|---|---|---|---|
| 1 | 2 | R2 | p adj | R2 | p adj | R2 | p adj | R2 | p adj | R2 | p adj |
| SP | E | 0.4349 | 0.0067 | 0.5533 | 0.0017 | 0.2968 | 0.0033 | 0.0432 | 0.705 | 0.2879 | 0.0914 |
| SP | P | 0.6290 | 0.0025 | 0.8515 | 0.0017 | 0.4459 | 0.0033 | 0.3868 | 0.0033 | 0.3920 | 0.0125 |
| SP | R | 0.6956 | 0.0025 | 0.9026 | 0.0017 | 0.3841 | 0.0033 | 0.3178 | 0.0033 | 0.5084 | 0.0033 |
| E | P | 0.3959 | 0.006 | 0.7399 | 0.0017 | 0.1249 | 0.15 | 0.3198 | 0.005 | 0.1555 | 0.1511 |
| E | R | 0.5656 | 0.0025 | 0.8520 | 0.0017 | 0.1816 | 0.0075 | 0.2806 | 0.0033 | 0.6019 | 0.0033 |
| P | R | 0.3026 | 0.0025 | 0.3724 | 0.0017 | 0.1029 | 0.15 | 0.1924 | 0.012 | 0.3605 | 0.0033 |
Additional files
-
Supplementary file 1
sCCA analysis.
CCA loadings calculated with sparse canonical correlation analysis for biocides (A) and climate variables (B). The categories of biocides are insecticides, fungicides, pesticides and herbicides. The environmental variables are mean minimum temperature, maximum daily precipitation, highest recorded temperature, mean summer temperature, summer precipitation, annual total precipitation, summer atmospheric pressure and lowest recorded temperature.
- https://cdn.elifesciences.org/articles/86576/elife-86576-supp1-v1.xlsx
-
Supplementary file 2
Correlations between biodiversity and environmental variables.
Summary of correlations between taxonomic units identified through the five barcodes (18S, 16SV1, 16SV4, rbc, and COI) and environmental variables, including biocides and climate factors. The taxonomic name and the number of significant correlations between a taxonomic unit and environmental variables, is followed by a correlation value, associated p-adjusted value and recall rate for each variable. The taxonomic units are reported at the lowest taxonomic assignment possible (f – family; o – order; c- class; p – phylum; null - unassigned). Results are collated per barcode, each in a separate tab. The last tab lists only taxonomic units that significantly correlated with the environmental variables based on the combined criteria of Pearson correlation value greater than 0.5, adjusted P-value smaller than 0.05 and recall rate greater than 0.5 along with the direction of the correlation.
- https://cdn.elifesciences.org/articles/86576/elife-86576-supp2-v1.xlsx
-
Supplementary file 3
Joint effects between biocides and climate variable.
The biocides showing significant joint effect with climate variables are ranked based on their correlation coefficient. The barcode and identified families that are affected by the joint effect of a climate variable and biocides type are shown. The order in which the biocide types are ranked is the same used to plot Figure 5.
- https://cdn.elifesciences.org/articles/86576/elife-86576-supp3-v1.xlsx
-
Supplementary file 4
Lake Ring metadata.
Dating record for Lake Ring, climate data collected from a weather station adjacent to the lake, and sales records for biocides are shown. The year of sampling (year), the sample ID, the depth of the sediment layer measured in centimetres (Depth), climate variables (annual mean temperature °C, summer mean temperature °C, mean minimum temperature °C, mean maximum temperature °C, highest recorded temperature °C, lowest recorded temperature °C, mean atmospheric pressure hPa, summer mean atmospheric presure hPa, annual total precipitation mm, summer precipitation mm, maximum daily precipitation mm, No. of days with snow cover, annual mean cloud cover, and summer mean cloud cover) and record of biocides sales between the 1950s and 2016 in tonnes/year and separated per class (insecticides, herbicides, fungicides and pesticides).
- https://cdn.elifesciences.org/articles/86576/elife-86576-supp4-v1.xlsx
-
Supplementary file 5
PCR primers.
(1) PCR1 primers with bibliographic references, expected fragment size (bp), annealing temperature (°C) and primer sequences (in black) with overhang to prime the sequencing flow cell; (2) PCR2 primers consisting of Nextera adapters, universal tail and overhang sequence.
- https://cdn.elifesciences.org/articles/86576/elife-86576-supp5-v1.xlsx
-
MDAR checklist
- https://cdn.elifesciences.org/articles/86576/elife-86576-mdarchecklist1-v1.docx
Download links
A two-part list of links to download the article, or parts of the article, in various formats.
Downloads (link to download the article as PDF)
Open citations (links to open the citations from this article in various online reference manager services)
Cite this article (links to download the citations from this article in formats compatible with various reference manager tools)
100 years of anthropogenic impact causes changes in freshwater functional biodiversity
eLife 12:RP86576.
https://doi.org/10.7554/eLife.86576.3


