A dynamic bactofilin cytoskeleton cooperates with an M23 endopeptidase to control bacterial morphogenesis
- Department of Biology, University of Marburg, Marburg, Germany, Germany
- Max Planck Institute for Terrestrial Microbiology, Germany
- Department of Chemistry, University of Marburg, Germany
- Center for Synthetic Microbiology (SYNMIKRO), Germany
- Centre for Bacterial Cell Biology, Biosciences Institute, Newcastle University, United Kingdom
- Institute for Molecular Bioscience, The University of Queensland, Australia
Figures
Figure 1 with 2 supplements
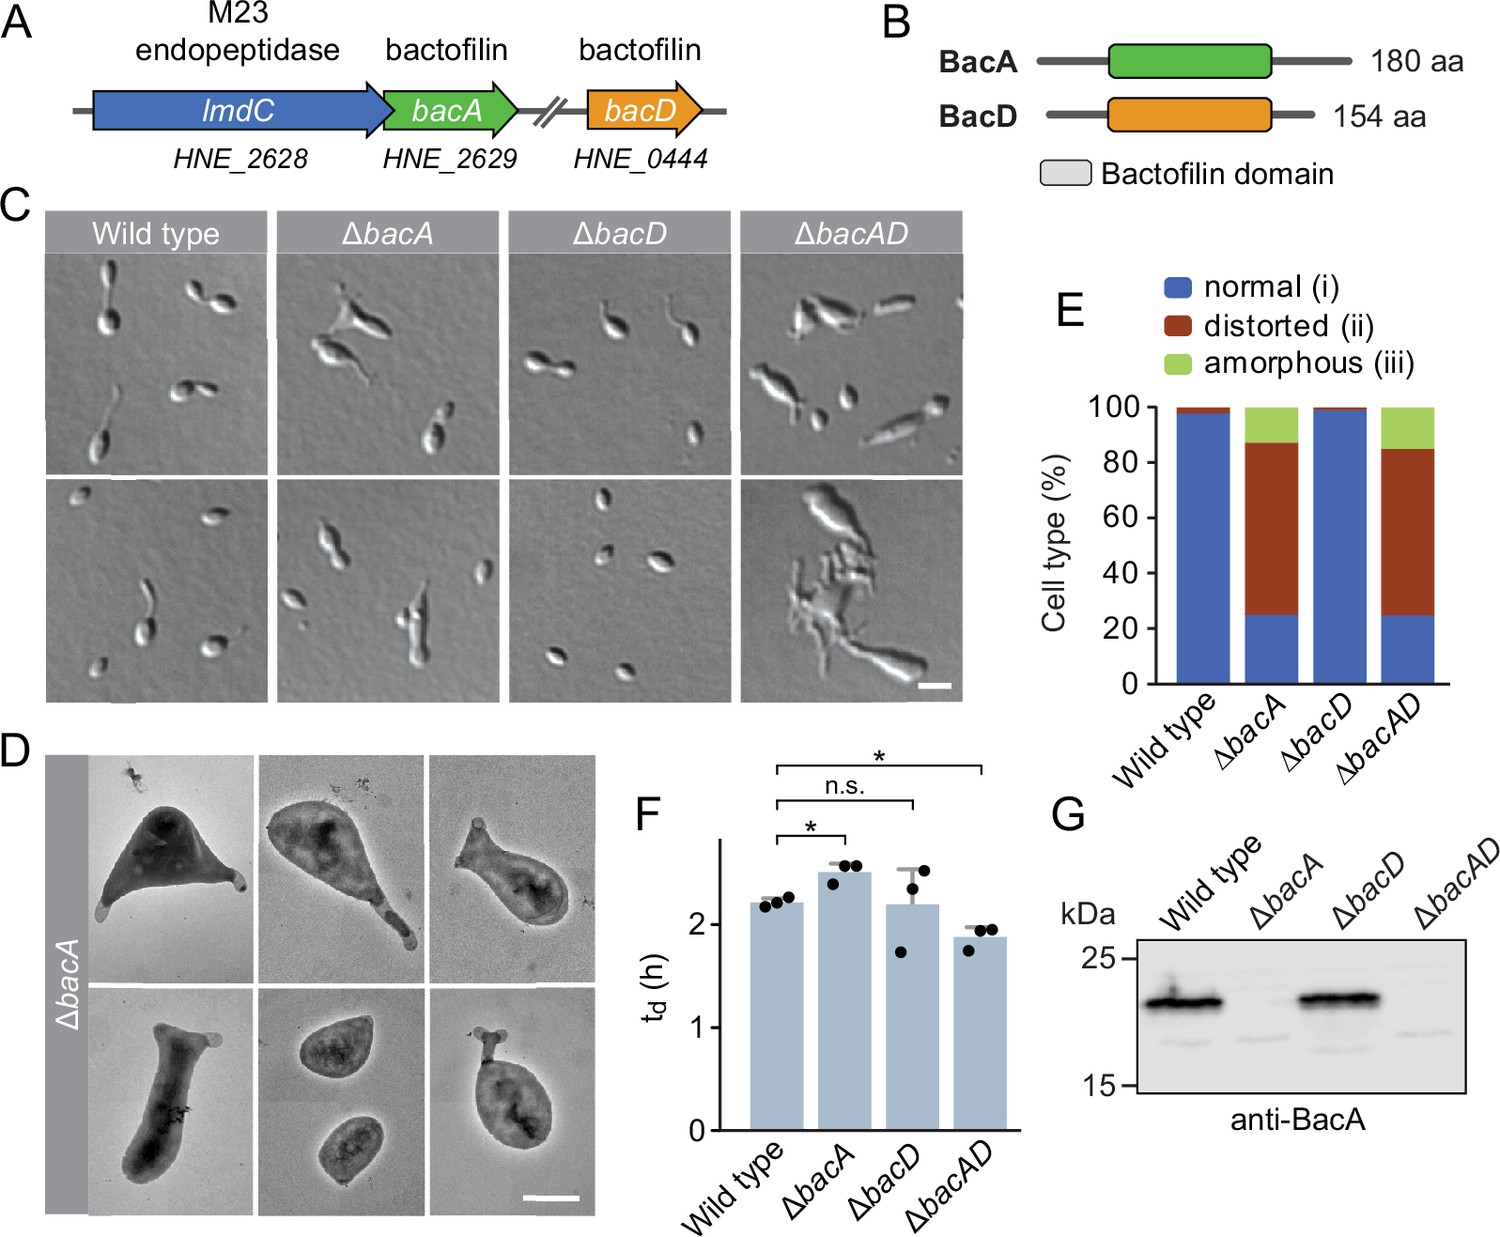
The bactofilin homolog BacA is required for proper cell morphology in H. neptunium.
(A) Schematic representation of the two bactofilin genes present in the H. neptunium genome. bacA lies adjacent to the M23 peptidase gene lmdC. Arrows indicate the direction of transcription. (B) Domain organization of BacA and BacD from H. neptunium. The bactofilin polymerization domain (colored boxes) is flanked by non-structured N- and C-terminal regions. (C) Morphology of H. neptunium bactofilin mutants. Shown are representative cells of strains LE670 (wild type), EC28 (ΔbacA), EC23 (ΔbacD), and EC33 (ΔbacAD), imaged by differential interference contrast (DIC) microscopy. Bar: 4 µm. (D) Transmission electron micrographs of representative ΔbacA cells at the early stalked-cell stage. Bar: 1 µm. (E) Quantification of the proportion of phenotypically abnormal stalked and budding cells in cultures of the strains analyzed in panel C (n=100 cells per strain). (F) Doubling times of the indicated H. neptunium strains. Bars represent the mean (± SD) of three independent experiments (dots). Statistical significance was determined using an unpaired two-sided Welch’s t-test (*p<0.05; n.s., not significant). (G) Immunoblot analysis of the strains shown in panel C, performed using anti-BacA antibodies.
-
Figure 1—source data 1
Raw images for the immunoblot analysis in Figure 1G.
- https://cdn.elifesciences.org/articles/86577/elife-86577-fig1-data1-v2.zip
Figure 1—figure supplement 1

The dimorphic lifecycle of H. neptunium.
A motile, flagellated swimmer cell sheds its flagellum and forms a stalk at the opposite cell pole. At a defined point in the cell cycle, the terminal segment of the stalk dilates and develops into a new swimmer cell. After cell division, the newborn swimmer cell first needs to differentiate into a stalked cell to initiate a new round of cell division, whereas the stalked mother cell immediately enters the next replication cycle. The predominant growth zones (Cserti et al., 2017) are indicated in red.
Figure 1—figure supplement 2
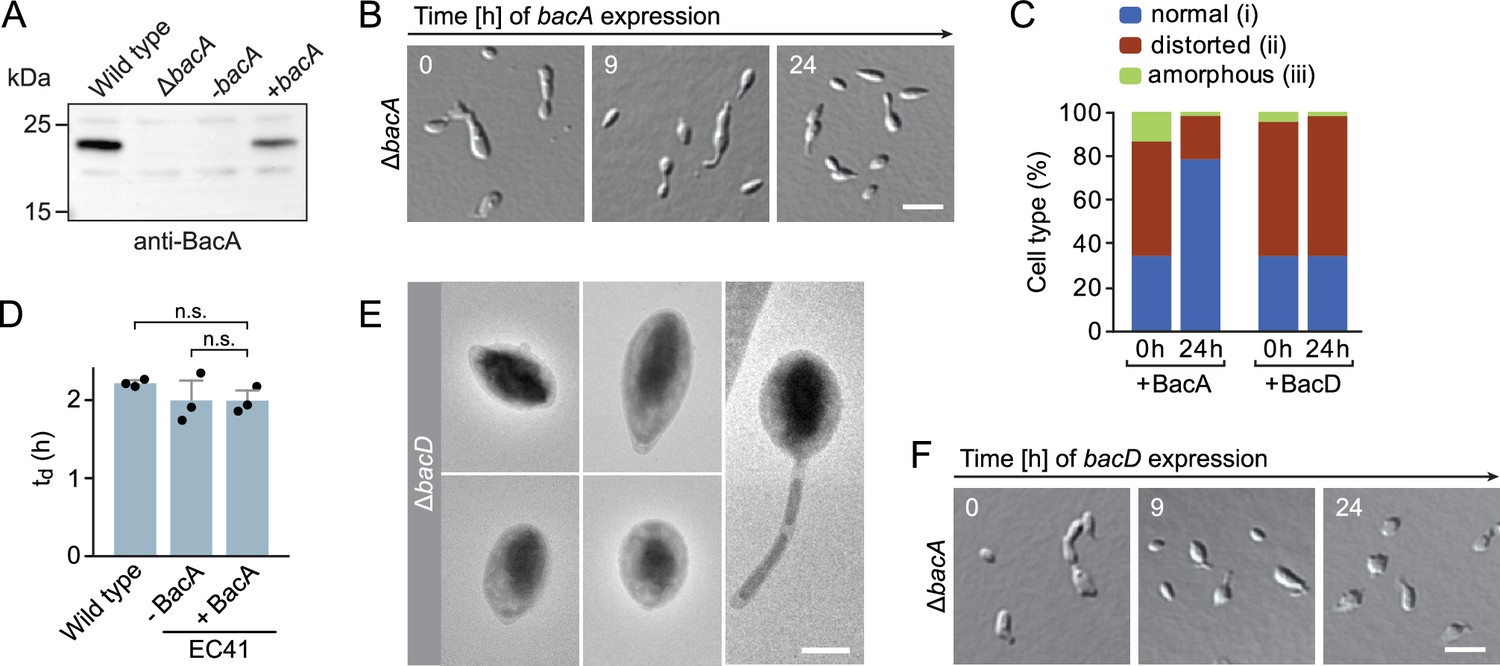
Phenotypic analysis of H.neptunium bactofilin mutants.
(A) Immunoblot analysis of strains LE670 (wild-type), EC28 (ΔbacA), and EC41 (ΔbacA PCu::PCu‐bacA) grown in the absence (-bacA) and presence (+bacA) of 0.5 mM CuSO4, performed with an anti-BacA antibody. (B) Rescue of the phenotype of a ΔbacA mutant by ectopic expression of bacA. Cells of strain EC41 (ΔbacA PCu::PCu‐bacA) were grown in copper-free medium, induced by the addition of copper, and imaged after the indicated time incubation times. The images show representative cells. Bar: 3 µm. (C) Quantification of the proportion of phenotypically abnormal stalked and budding cells in the cultures of strains EC41 (ΔbacA PCu::PCu‐bacA) and EC43 (ΔbacA PZn::PZn‐bacD) analyzed in panels B and F before (t=0 hr) and 24 hr after induction (n=100 cells per time point). (D) Doubling times of the indicated H. neptunium strains. Strain EC41 (ΔbacA PCu::PCu‐bacA) as analyzed in the absence (-) and presence (+) of copper. Strain LE670 (wild-type) grown in copper-free medium is shown as a control. Bars represent the mean (± SD) of three independent experiments (dots). Statistical significance was determined using an unpaired two-sided Welch’s t-test (n.s., not significant). (E) Transmission electron micrographs of representative ΔbacD cells at the swimmer and stalked cell stage. Bar: 1 µm. (F) Representative DIC images of a ΔbacA mutant overproducing BacD from a zinc-inducible promoter. Cells of strain EC43 (ΔbacA PZn::PZn‐bacD) were grown in inducer-free medium, induced by the addition of 0.5 mM ZnSO4, and imaged after the indicated incubation times. Bar: 3 µm.
-
Figure 1—figure supplement 2—source data 1
Raw images for the immunoblot analysis in Figure 1—figure supplement 2A.
- https://cdn.elifesciences.org/articles/86577/elife-86577-fig1-figsupp2-data1-v2.zip
Figure 2 with 4 supplements
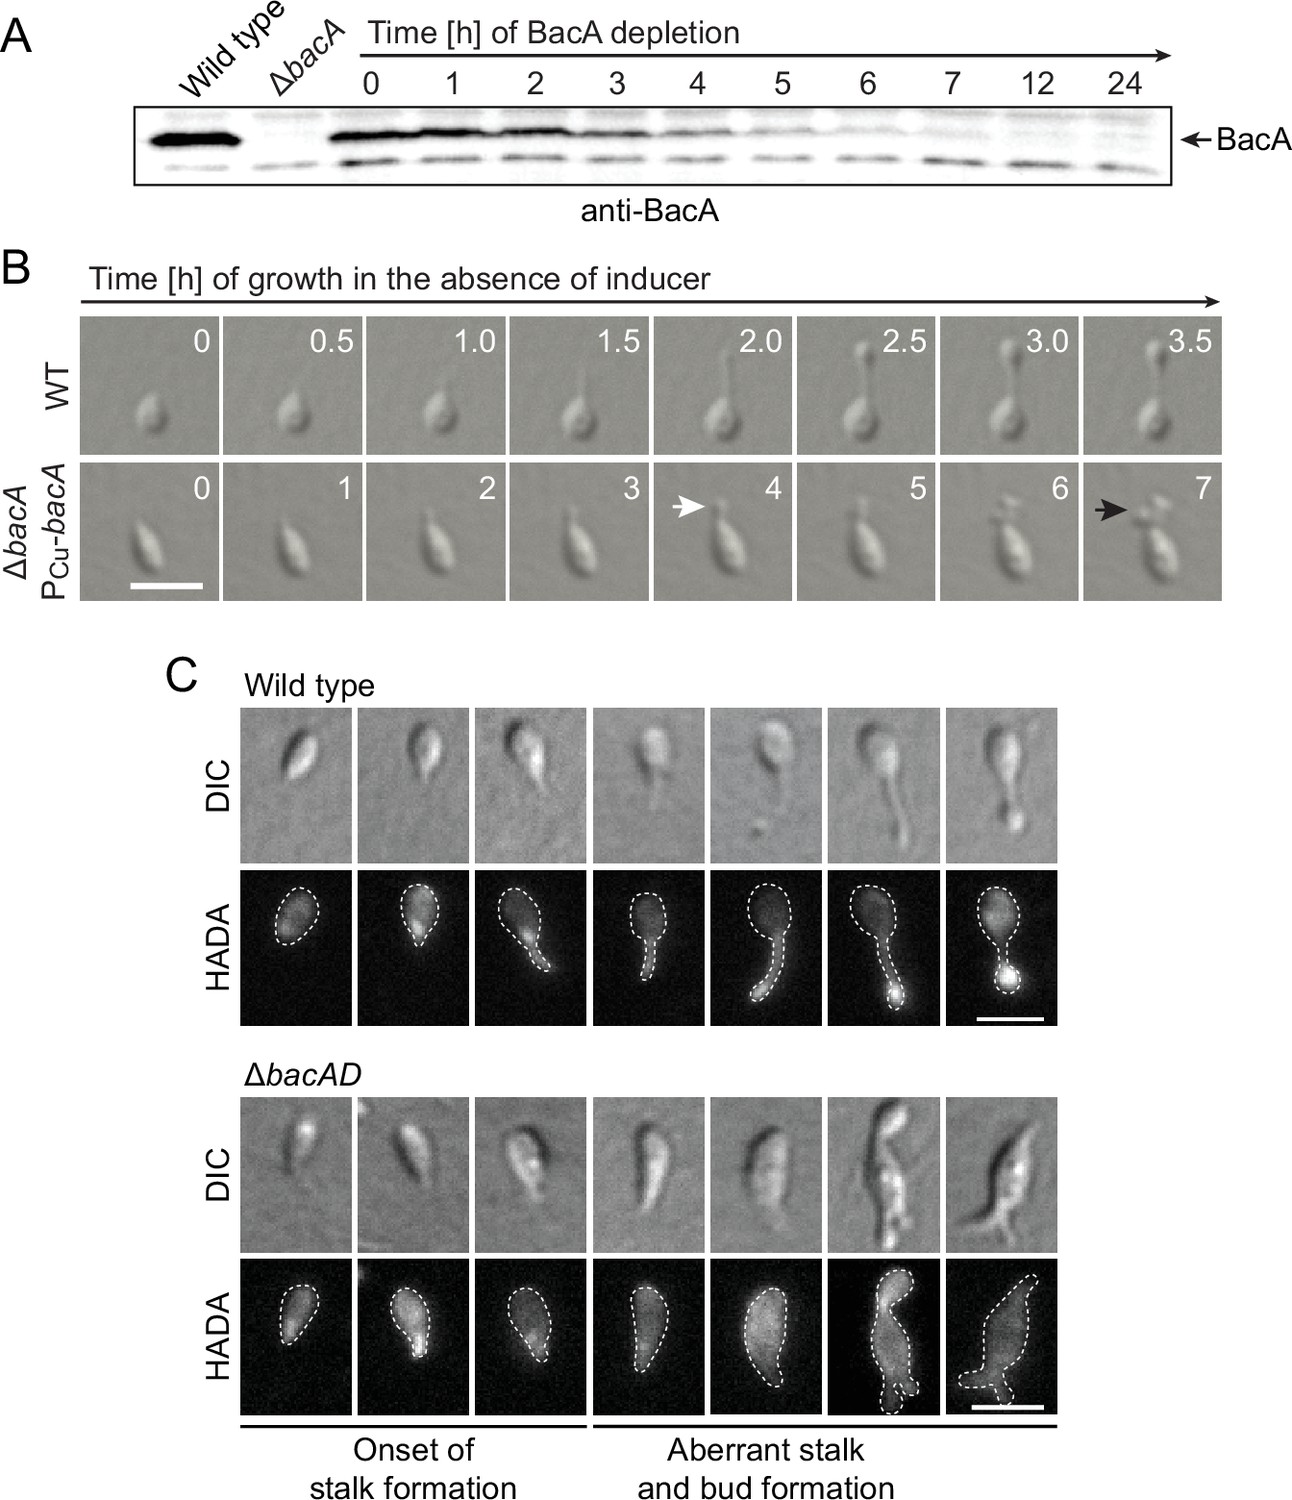
Lack of BacA leads to uncontrolled growth of the stalk and bud compartments.
(A) Immunoblot showing the levels of BacA in strain EC41 (ΔbacA PCu-bacA) over the course of BacA depletion. Cells were grown in copper-containing medium, washed, and transferred to inducer-free medium. At the indicated time points, samples were withdrawn and subjected to immunoblot analysis. Strains LE670 (wild-type) and EC28 (ΔbacA) were included as controls. The position of BacA is indicated. (B) Morphological defects induced by BacA depletion. Cells of strains LE670 (wild-type) and EC41 (ΔbacA PCu-bacA) were grown in medium containing 0.5 mM CuSO4, washed, and incubated for 6 hr in inducer-free medium before they were transferred onto ASS-agarose pads lacking inducer and imaged at the indicated time points. Shown are representative images. Bar: 2 µm. (C) Changes in the growth pattern of H. neptunium in the absence of bactofilins. Cells of strains LE670 (wild-type), and EC33 (ΔbacAD) were stained with the fluorescent D-amino acid HADA prior to analysis by fluorescence microscopy. Shown are representative images of cells at different developmental stages. Bars: 2 µm.
-
Figure 2—source data 1
Raw images for the immunoblot analysis in Figure 2A.
- https://cdn.elifesciences.org/articles/86577/elife-86577-fig2-data1-v2.zip
Figure 2—figure supplement 1
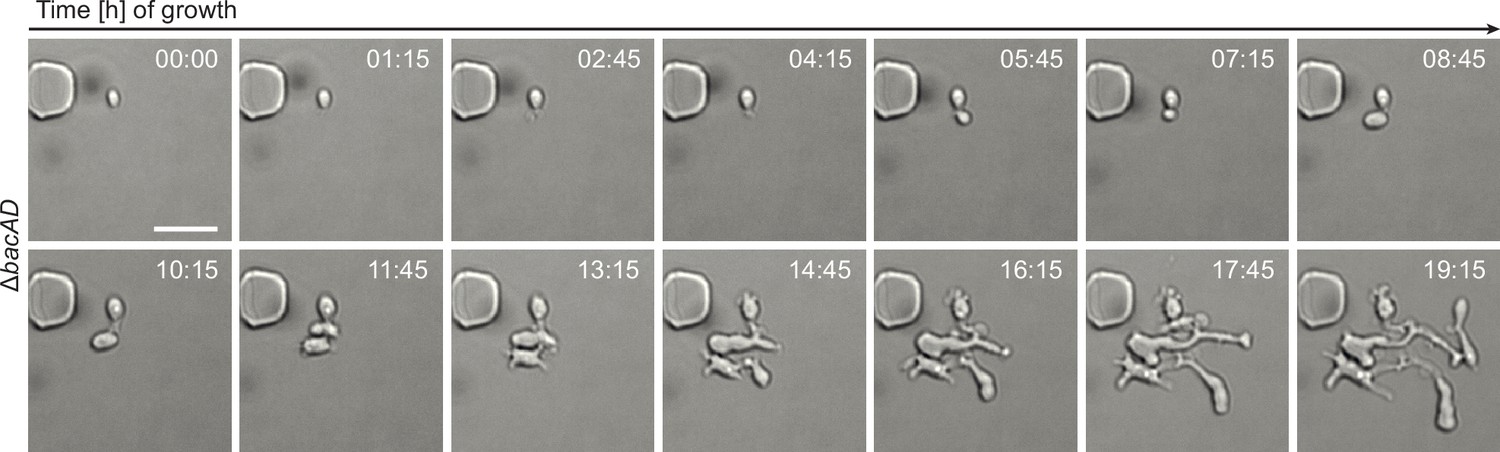
Growth of ΔbacAD cells in a microfluidic flow cell.
Cells of strain EC33 (ΔbacAD) were flushed into a microfluidic flow cell and imaged at the indicated time points (in hours). Bar: 3 µm.
Figure 2—figure supplement 2
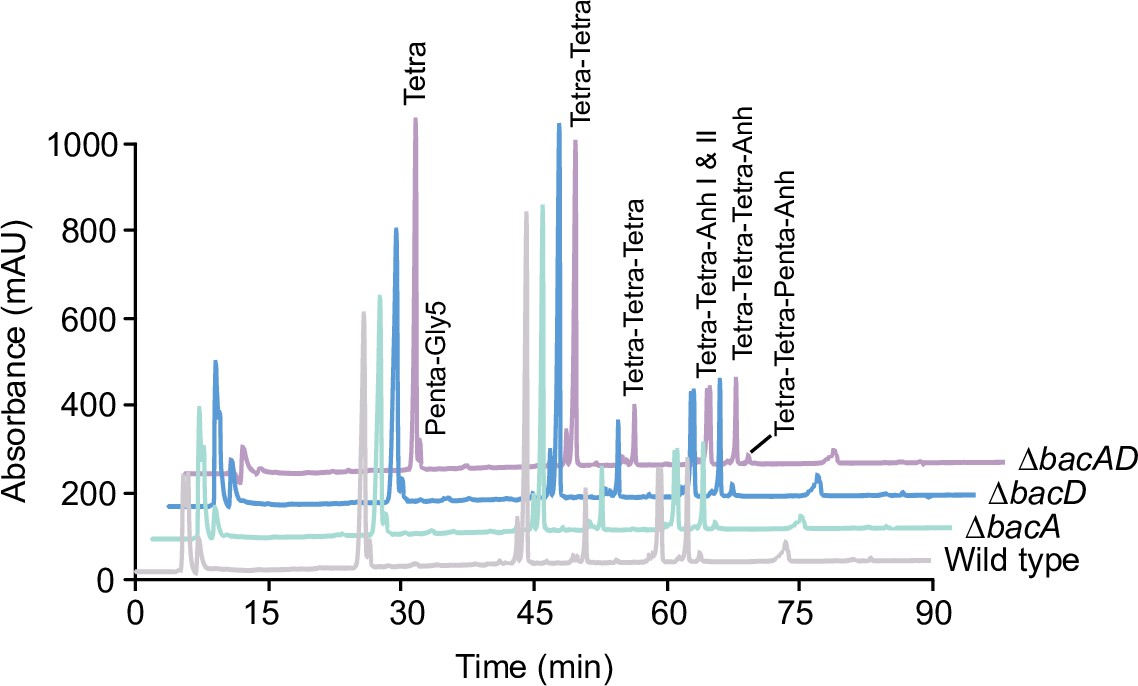
Muropeptide profiles of different H. neptunium strains.
Cell walls of strains LE670 (wild-type), EC28 (ΔbacA), EC23 (ΔbacD), and EC33 (ΔbacAD) were digested with cellosyl to release muropeptides, which were reduced and separated by HPLC. The identities of major muropeptide species, assigned based on the previously reported retention times (Cserti et al., 2017; Glauner, 1988), are given above the corresponding peaks. Tri, Tetra, and Penta stand for N-acetylglucosamine-N-acetylmuramitol tripeptide, tetrapeptide and pentapeptide, respectively. ‘Anh’ indicates muropeptides containing 1,6-anhydromuramic acid. Shown are representative HPLC profiles from two independent experiments. A quantification of the different muropeptide species is given in Supplementary file 1.
Figure 2—video 1
Unconstrained growth of a bactofilin-deficient H. neptunium mutant.
Cells of strain EC33 (ΔbadAD) were grown in a microfluidic flow cell and imaged by DIC microsopy at 15 min intervals. Bar: 2 µm.
Figure 2—video 2
Normal growth of the H. neptunium wild-type strain.
Cells of strain LE670 (wild-type) were grown in a microfluidic flow cell and imaged by DIC microscopy at 5 min intervals. Bar: 2 µm.
Figure 3 with 1 supplement
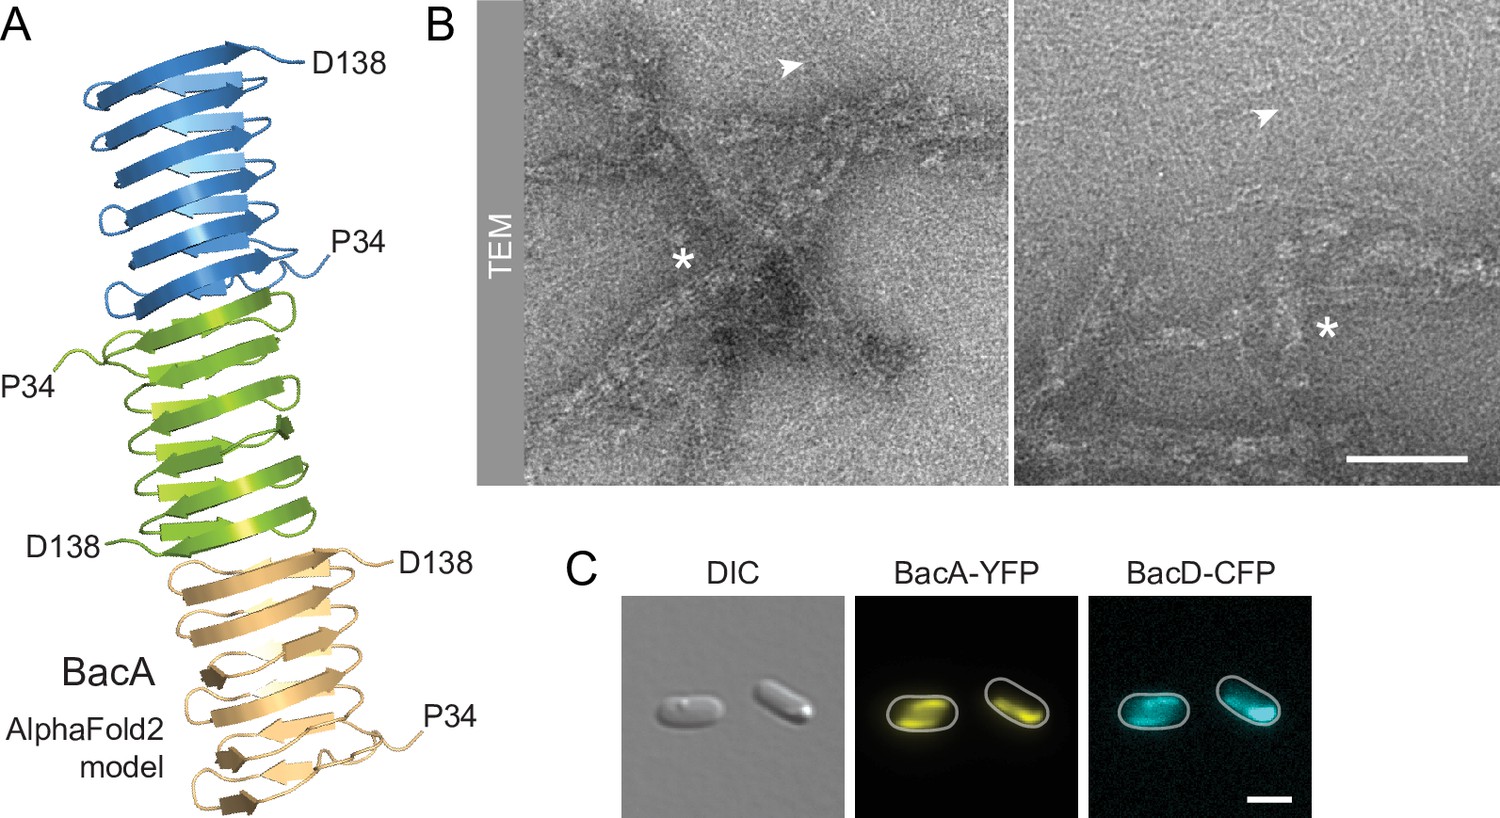
BacA and BacD assemble into filamentous structures.
(A) Model of a BacA trimer generated with AlphaFold-Multimer (Evans et al., 2022). Only residues P34-D138 are shown for each subunit. (B) Visualization of BacA polymers. Purified BacA-His6 was stained with uranyl acetate and imaged by transmission electron microscopy (TEM). Arrowheads point to BacA filaments. Asterisks indicate filament bundles and sheets. Bars: 200 nm. (C) Copolymerization of BacA and BacD after heterologous co-expression in E. coli. Cells of E. coli BL21(DE3) transformed with plasmid pEC121 (PT7-bacA-eyfp PT7-bacD-ecfp) were grown in LB medium containing 5% glucose and induced with 0.5 mM isopropyl-β-D-1-thiogalactopyranoside (IPTG) prior to imaging. Shown are representative cells. Bar: 3 µm.
Figure 3—figure supplement 1
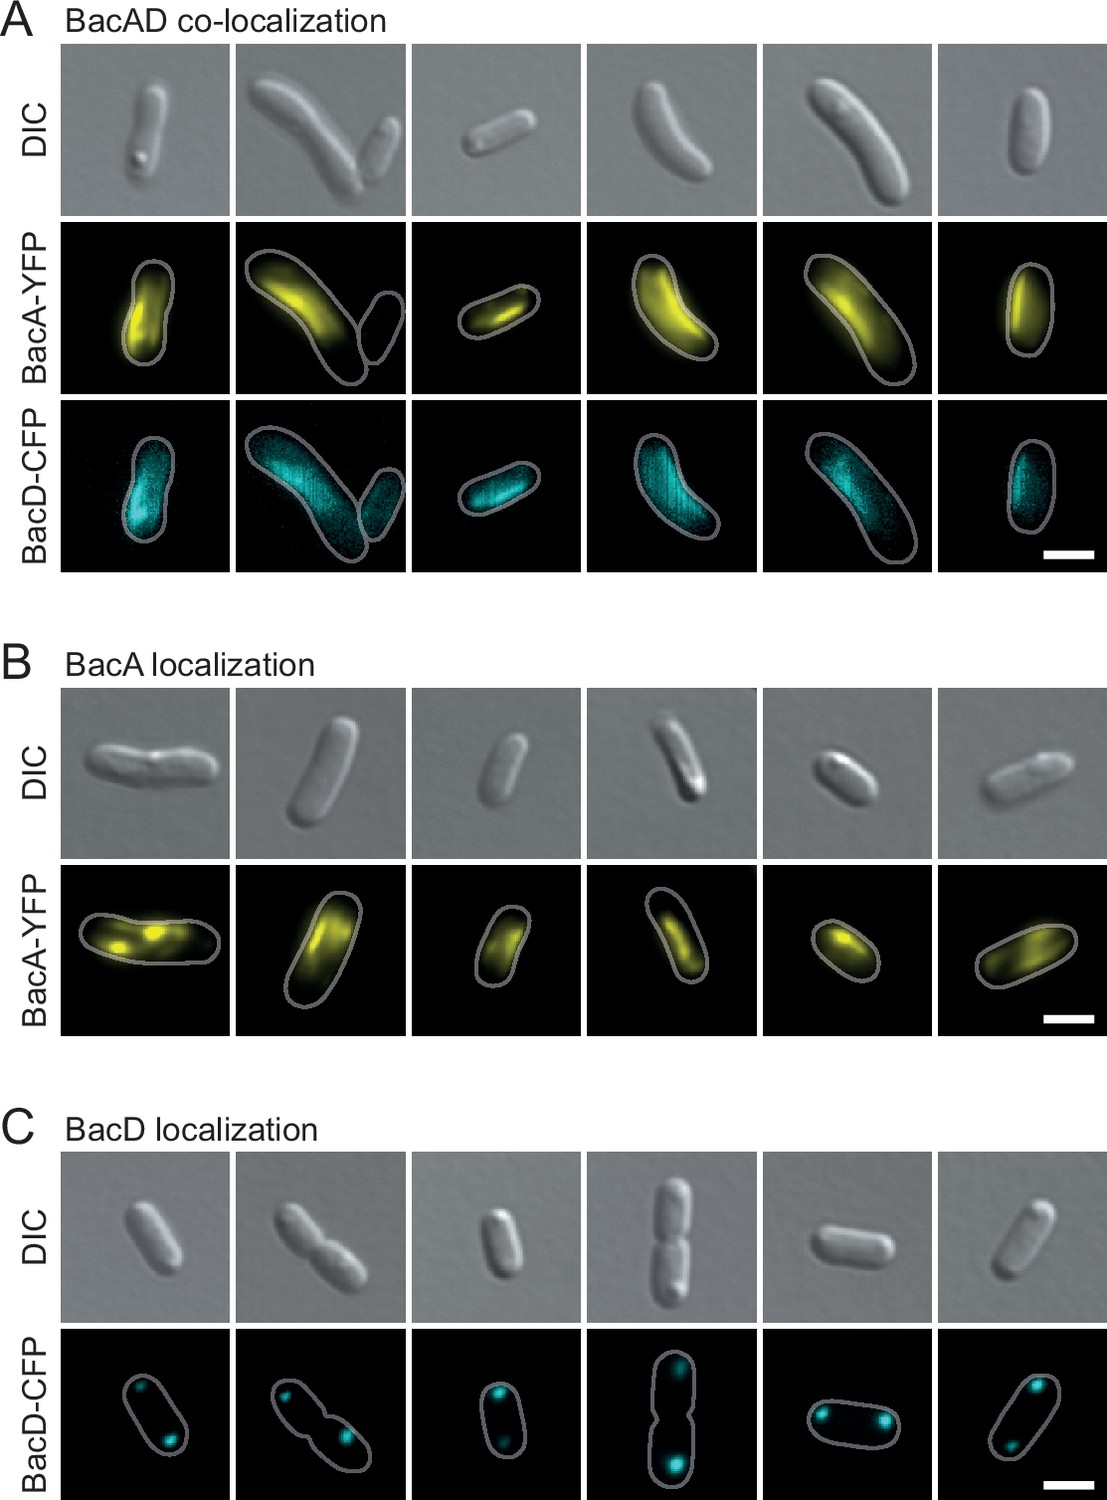
Localization patterns of BacA-YFP and BacD-CFP after heterologous overproduction in E. coli.
(A) Co-localization of BacA-YFP and BacD-CFP in cells of E. coli BL21(DE3) transformed with plasmid pEC121 (PT7-bacA-eyfp PT7-bacD-ecfp). (B) Localization of BacA-YFP in cells of E. coli BL21(DE3) transformed with plasmid pEC119 (PT7-bacA-eyfp) (C) Localization of BacD-CFP in E. coli BL21(DE3) transformed with plasmid pEC120 (PT7-bacD-ecfp). All strains were grown in LB medium containing 5% glucose and induced with 0.5 mM isopropyl-β-D-1-thiogalactopyranoside (IPTG) prior to imaging. The images show representative cells. Bars: 2 µm.
Figure 4 with 9 supplements

BacA and BacD show a dynamic, cell cycle-dependent localization pattern.
(A) Localization pattern of BacA-YFP. Cells of strain EC61 (bacA::bacA-eyfp) were transferred to agarose pads and imaged at 20 min intervals. Shown are overlays of DIC and fluorescence images of a representative cell, with YFP fluorescence shown in red. Scale bar: 3 µm. (B) Demographic analysis of BacA-YFP localization in swimmer (left), stalked (middle), and budding (right) cells of strain EC61 (bacA::bacA-eyfp). The fluorescence intensity profiles measured for cells of each type were sorted according to cell length and stacked on each other, with the shortest cell shown at the top and the longest cell shown at the bottom (n=250 swimmer cells, 215 stalked cells, and 49 budding cells). Dotted red lines indicate the positions to which cells were aligned. (C) Demographic analysis of BacD-Venus localization. Cells of strain EC67 (bacD::bacD-venus) were analyzed as described in panel B (n=416 swimmer cells, 248 stalked cells, and 45 budding cells). (D) Co-localization of BacA and BacD in cells of strain EC68 (bacA::bacA-eyfp bacD::bacD-mCherry). Shown are DIC images and overlays of the YFP and mCherry signals of representative cells, arranged according to their developmental state. The individual signals are shown in Figure 6A. The Pearson’s Correlation Coefficient (PCC) of the two fluorescence signals in a random population of cells (n=454) is 0.506. Bar: 1 µm.
Figure 4—figure supplement 1
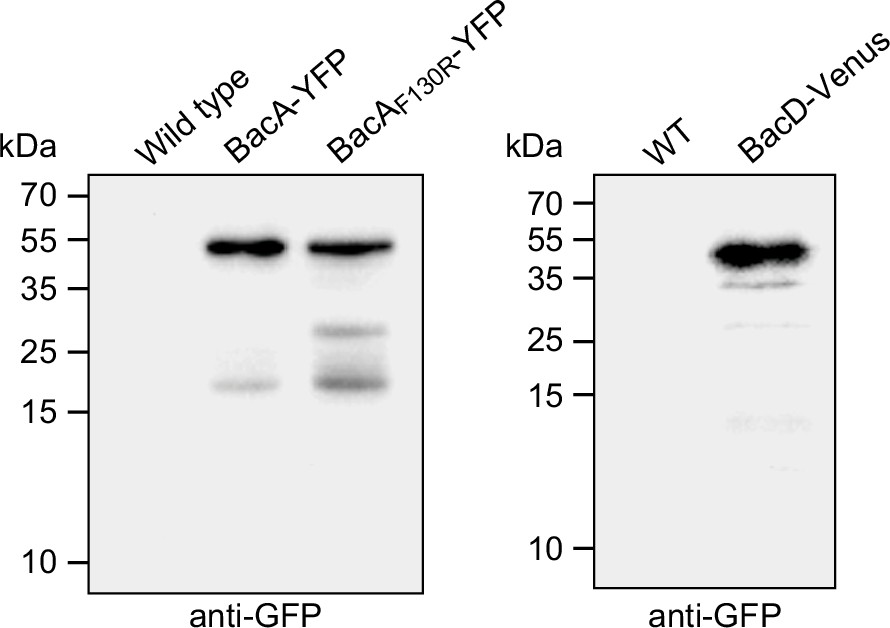
Stability of the fluorescently tagged bactofilin derivatives used in this study.
Cells of strains LE670 (wild-type), EC61 (bacA::bacA-eyfp), MO78 (bacA::bacAF130R-eyfp), and EC67 (bacD::bacD-venus) were subjected to immunoblot analysis using anti-GFP antibodies.
-
Figure 4—figure supplement 1—source data 1
Raw images for the immunoblot analyses in Figure 4—figure supplement 1A and B.
- https://cdn.elifesciences.org/articles/86577/elife-86577-fig4-figsupp1-data1-v2.zip
Figure 4—figure supplement 2

Localization dynamics of BacA-YFP.
Cells of strain EC61 (bacA::bacA-eyfp) were flushed into a microfluidic flow cell and imaged at 15 min intervals over multiple cell cycles. Shown are overlays of DIC and fluorescence images. Bar: 2 µm.
Figure 4—figure supplement 3

Co-localization of BacA and BacD.
Shown are the individual fluorescence images of strain EC68 (bacA::bacA-eyfp bacD::bacD-mCherry) used to generate the overlays in Figure 4D. Bar: 1 µm.
Figure 4—figure supplement 4

Partial independence of BacA and BacD localization at the onset of the budding process.
Shown are exemplary cells of strain EC68 (bacA::bacA-eyfp bacD::bacD-mCherry) in which BacA-YFP and BacD-CHY do not fully co-localize. Bar: 2 µm.
Figure 4—figure supplement 5

Random localization of BacD complexes in the absence of BacA.
Cells of strain EC60 (∆bacA PZn::PZn‐bacD-venus) were grown in inducer-free medium and then induced for 4 hr with 0.5 mM ZnSO4 prior to imaging. Bar: 3 µm.
Figure 4—figure supplement 6
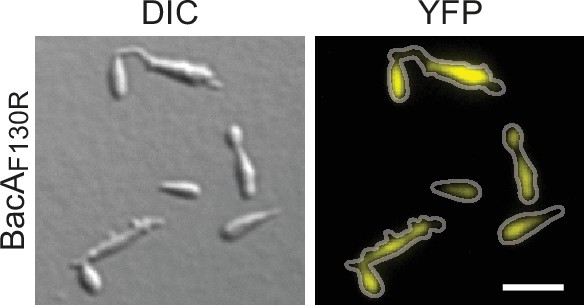
Localization and functionality of BacAF130R-YFP.
Cells of strain MO78 (bacA::bacAF130R-eyfp), producing the polymerization-deficient BacAF130R-YFP variant instead of the native protein, were grown to exponential phase and imaged. Bar: 3 µm.
Figure 4—video 1
Localization dynamics of BacA-YFP (example 1).
Cells of strain EC61 (bacA::bacA-eyfp) were grown in a microfluidic flow cell and imaged at 15 min intervals. Shown are overlays of DIC and fluorescence images. YFP fluorescence is shown in red for better visibility. Bar: 2 µm.
Figure 4—video 2
Localization dynamics of BacA-YFP (example 2).
Cells of strain EC61 (bacA::bacA-eyfp) were grown in a microfluidic flow cell and imaged at 15 min intervals. Shown are overlays of DIC and fluorescence images. YFP fluorescence is shown in red for better visibility. Bar: 2 µm.
Figure 4—video 3
Localization dynamics of BacA-YFP (example 3).
Cells of strain EC61 (bacA::bacA-eyfp) were grown in a microfluidic flow cell and imaged at 15 min intervals. Shown are overlays of DIC and fluorescence images. YFP fluorescence is shown in red for better visibility. Bar: 2 µm.
Figure 5 with 5 supplements

The bactofilin cytoskeleton is required to confine the elongasome to the mother cell and bud compartments.
Localization of YFP-RodZ in the H. neptunium wild-type and ΔbacAD backgrounds. Shown are representative cells of strain EC93 (rodZ::eyfp-rodZ) and SP221 (ΔbacAD rodZ::eyfp-rodZ) imaged by DIC and fluorescence microscopy and arranged according to their developmental state. Arrowheads indicate cellular extensions that show YFP-RodZ foci. Bar: 2 µm.
Figure 5—video 1
Localization of YFP-RodZ during stalk synthesis in the wild-type background.
Cells of strain EC93 (rodZ::eyfp-rodZ) were immobilized on pads made of 1% agarose in ASS medium and imaged at 2 min intervals. Bar: 2 µm.
Figure 5—video 2
Localization of YFP-RodZ during bud formation in the wild-type background.
Cells of strain EC93 (rodZ::eyfp-rodZ) were immobilized on pads made of 1% agarose in ASS medium and imaged at 2 min intervals. Bar: 2 µm.
Figure 5—video 3
Localization of YFP-RodZ during pseudo stalk synthesis in the ΔbacAD background.
Cells of strain SP221 (ΔbacAD rodZ::eyfp-rodZ) were immobilized on pads made of 1% agarose in ASS medium and imaged at 2 min intervals. Bar: 2 µm.
Figure 5—video 4
Localization of YFP-RodZ within early stalks in the ΔbacAD background.
Cells of strain SP221 (ΔbacAD rodZ::eyfp-rodZ) were immobilized on pads made of 1% agarose in ASS medium and imaged at 2 min intervals. Bar: 2 µm.
Figure 5—video 5
Localization of YFP-RodZ in amorphous ΔbacAD cells.
Cells of strain SP221 (ΔbacAD rodZ::eyfp-rodZ) were immobilized on pads made of 1% agarose in ASS medium and imaged at 2 min intervals. Bar: 2 µm.
Figure 6 with 3 supplements
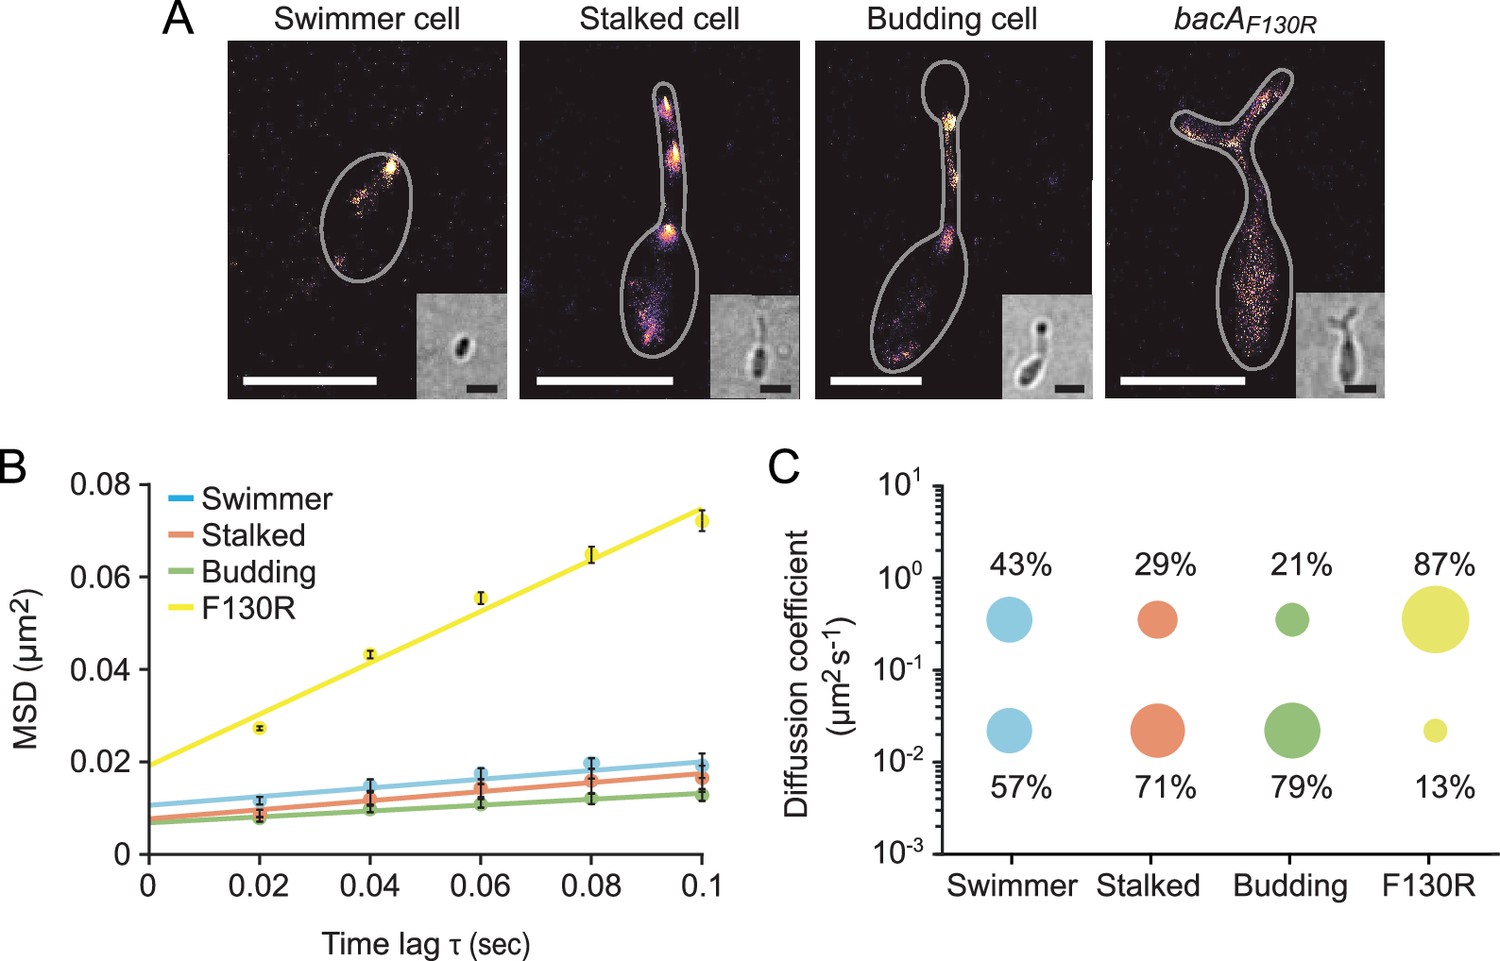
The single-particle dynamics of BacA change over the course of the cell cycle.
(A) Representative heat maps showing the sum of single-particle positions observed in live-cell single-particle localization microscopy studies of a swimmer, stalked, and budding cell producing BacA-YFP (EC61) or a mutant cell producing the polymerization-deficient BacAF130R-YFP variant (MO78). Insets show the corresponding bright-field images. Bars: 1 µm. (B) Mean-squared displacement (MSD) analysis of the mobility of BacA-YFP in wild-type swimmer (n=100), stalked (n=105), and budding (n=101) cells (EC61). Cells (n=110) producing the BacAF130R-YFP were analyzed as a control (MO78). Error bars indicate the standard deviation. (C) Bubble plots showing the proportions of mobile and immobile particles (size of the bubbles) and the corresponding average diffusion constants (y-axis) in the cells analyzed in panel B.
Figure 6—figure supplement 1

Single-particle tracking analysis of BacA-YFP.
The images show the sums of all single-molecule tracks obtained for representative single H. neptunium swimmer, stalked and budding cell producing BacA-YFP (EC61) or for a mutant cell producing the polymerization-deficient BacAF130R-YFP variant (MO78). Cell outlines are indicated by white lines. Insets show the corresponding bright-field images. Bars: 1 µm.
Figure 6—figure supplement 2
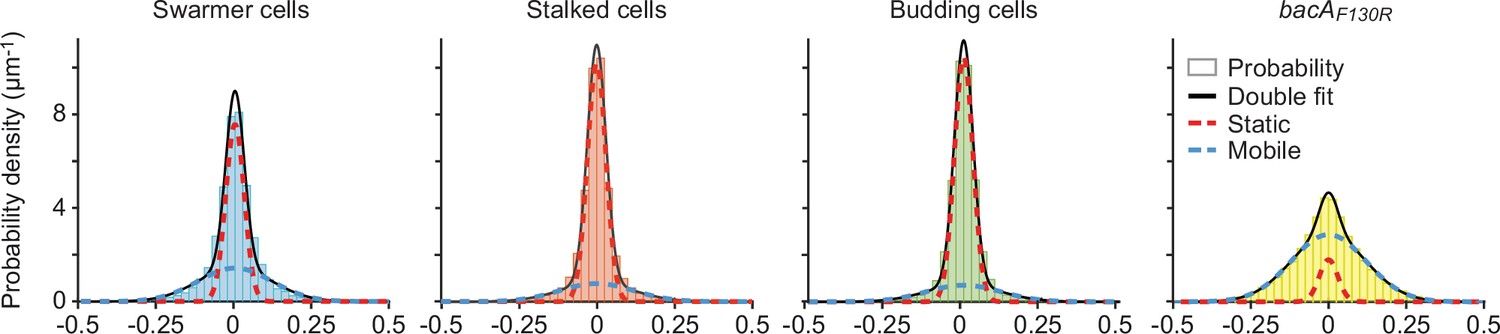
Single-particle tracking analysis of BacA-YFP mobility.
Shown is a Gaussian mixture model (GMM) analysis of the mobility of the BacA‐YFP variants plotted in Figure 5C. The distributions of the frame‐to‐frame displacements in both x and y direction from single‐particle tracking experiments were fitted to a two‐component Gaussian function (sum in black), assuming a fast‐diffusing mobile (dotted blue lines) and a slow‐diffusing (dotted red lines) population.
Figure 6—video 1
Tracking of single BacA-YFP particles in representative cells at different stages of the cell cycle.
Shown are stream acquisitions (20 ms intervals) of H. neptunium cells producing wild-type BacA-YFP (EC61) or the polymerization-deficient BacAF130R-YFP variant (MO78) in place of the native BacA protein at different developmental stages. Bar: 1 µm.
Figure 7
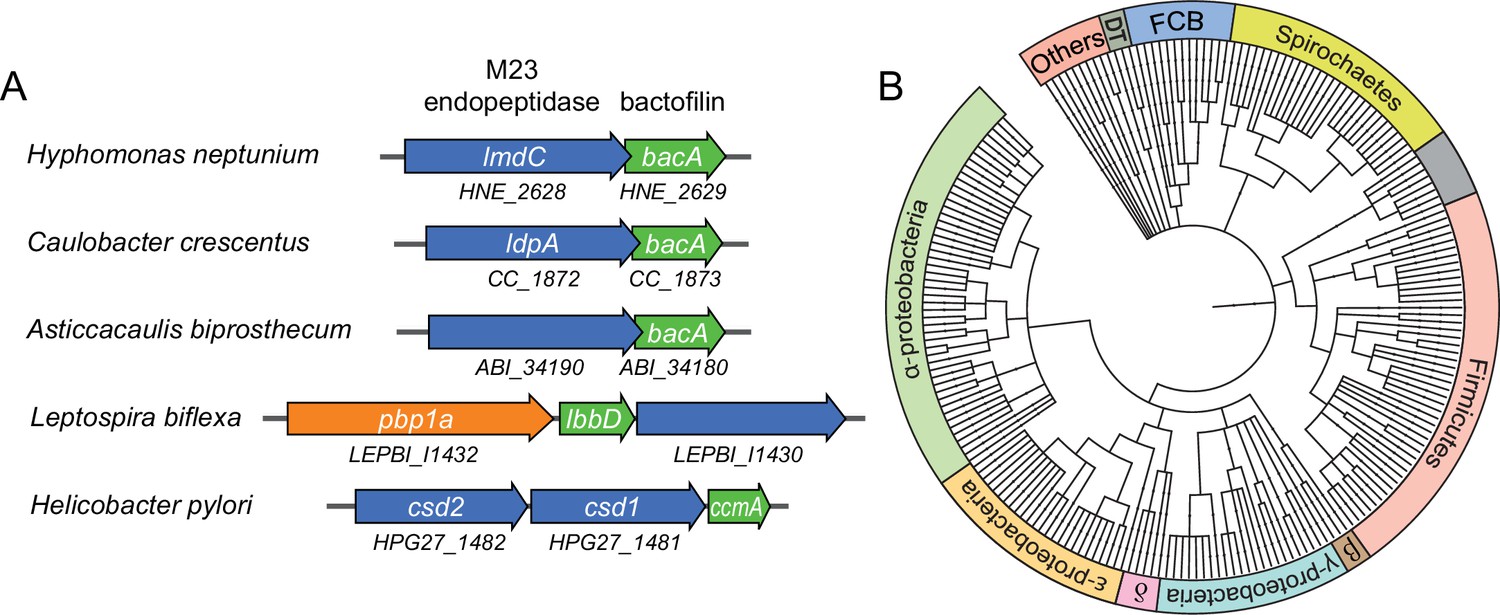
Putative operons of including adjacent BacA and M23 peptidase genes are widely conserved among bacteria.
(A) Arrangement of bacA and lmdC genes in species whose BacA homolog has a proven role in cell morphogenesis. (B) Co-conservation of BacA and M23 peptidase genes across different bacterial phyla. Bioinformatic analysis was used to identify genomes that contained a bactofilin gene located next to an M23 peptidase gene. After retrieval of the taxonomy IDs of the corresponding species from the National Center for Biotechnology Information (NCBI) website, a phylogenetic tree of the species was created using the iTOL server (Letunic and Bork, 2021). Abbreviations: DT (Deinococcus-Thermus group), FCB (Fibrobacteres-Chlorobi-Bacteroidetes group), β (β-proteobacteria), δ (δ-proteobacteria). The full list of species used and details on the genes identified are provided in Figure 7—source data 1.
-
Figure 7—source data 1
List of bactofilin-M23 peptidase gene clusters identified in bacterial genomes.
The dataset includes the genome accession numbers and species, the accession numbers of the predicted bactofilin and M23 peptidase homologs as well as the genomic coordinates and orientations of the respective genes.
- https://cdn.elifesciences.org/articles/86577/elife-86577-fig7-data1-v2.xlsx
Figure 8
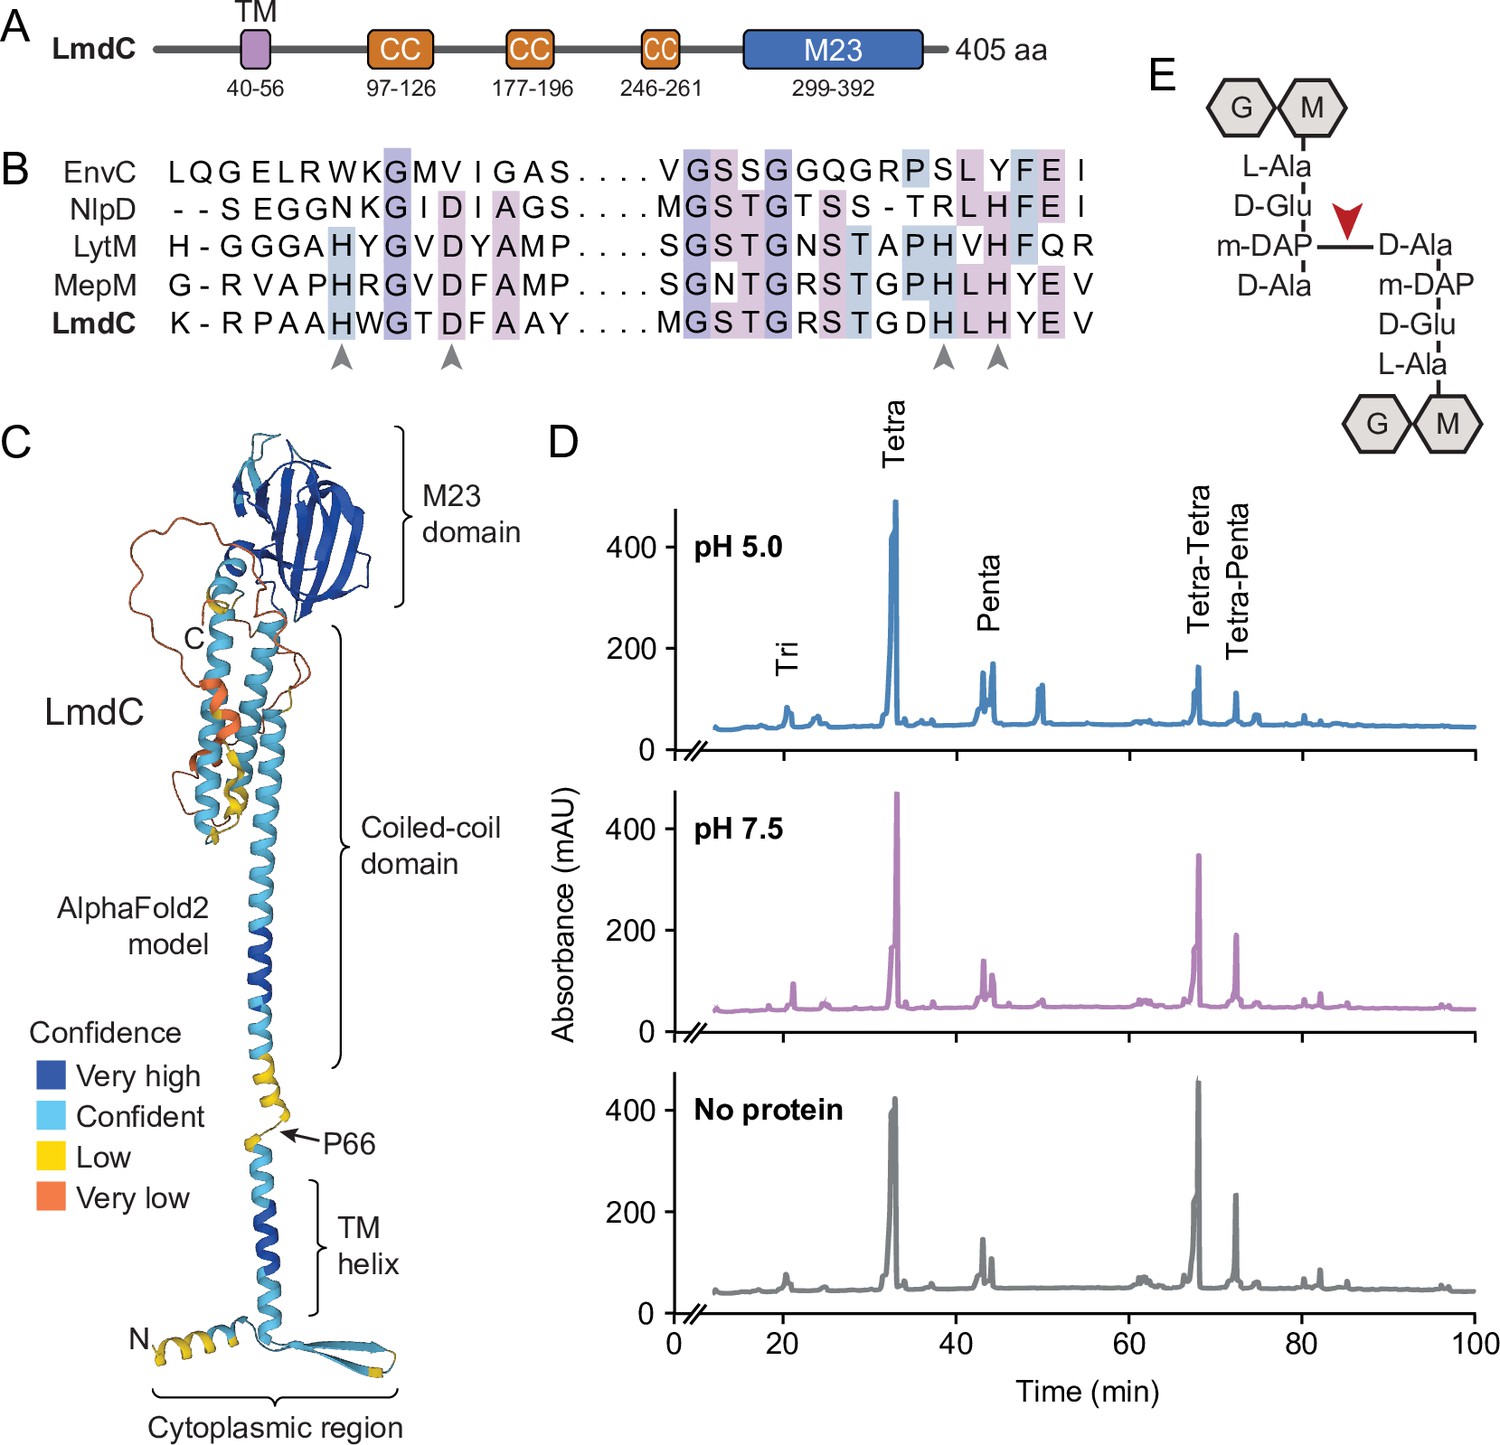
LmdC is a peptidoglycan hydrolase with DD-endopeptidase activity.
(A) Predicted domain architecture of H. neptunium LmdC. The predicted positions of the transmembrane helix (TM), the three coiled-coil regions (CC), and the M23 peptidase domain are indicated. (B) Alignment of the amino acid sequences of multiple M23 peptidases showing the conservation of the catalytic residues in LmdC. Residues required to coordinate the catalytic Zn2+ ion of LytM from S. aureus (Firczuk et al., 2005) are indicated by arrowheads. The proteins shown are EnvC from E. coli (UniProt: P37690), NlpD from E. coli (P0ADA3), LytM from S. aureus (O33599), MepM from E. coli (P0AFS9) and LmdC from H. neptunium (Q0BYX6). (C) Predicted molecular structure of H. neptunium LmdC, generated with Alphafold2 (Jumper et al., 2021). The different domains of the protein and the position of proline 66, which terminates the N-terminal fragment of LmdC used for the in vivo analyses in this study (LmdC1-66), are indicated. (D) Representative HPLC traces showing the muropeptide profile of peptidoglycan treated with LmdC. Cell walls were incubated with the isolated M23 peptidase domain of LmdC at pH 5.0 or pH 7.5. Subsequently, muropeptides were released with cellosyl, reduced, and separated by HPLC. A sample lacking LmdC (No protein) was analyzed as a reference. The nature of the major products is indicated above the peaks. Tri, Tetra, and Penta stand for N-acetylglucosamine-N-acetylmuramitol tripeptide, tetrapeptide, and pentapeptide, respectively. (E) Structure of a Tetra-Tetra muropeptide. Abbreviations: G (N-acetylglucosamine), M (N-acetylmuramic acid). The cleavage site of LmdC is indicated by a red arrowhead.
Figure 9 with 1 supplement
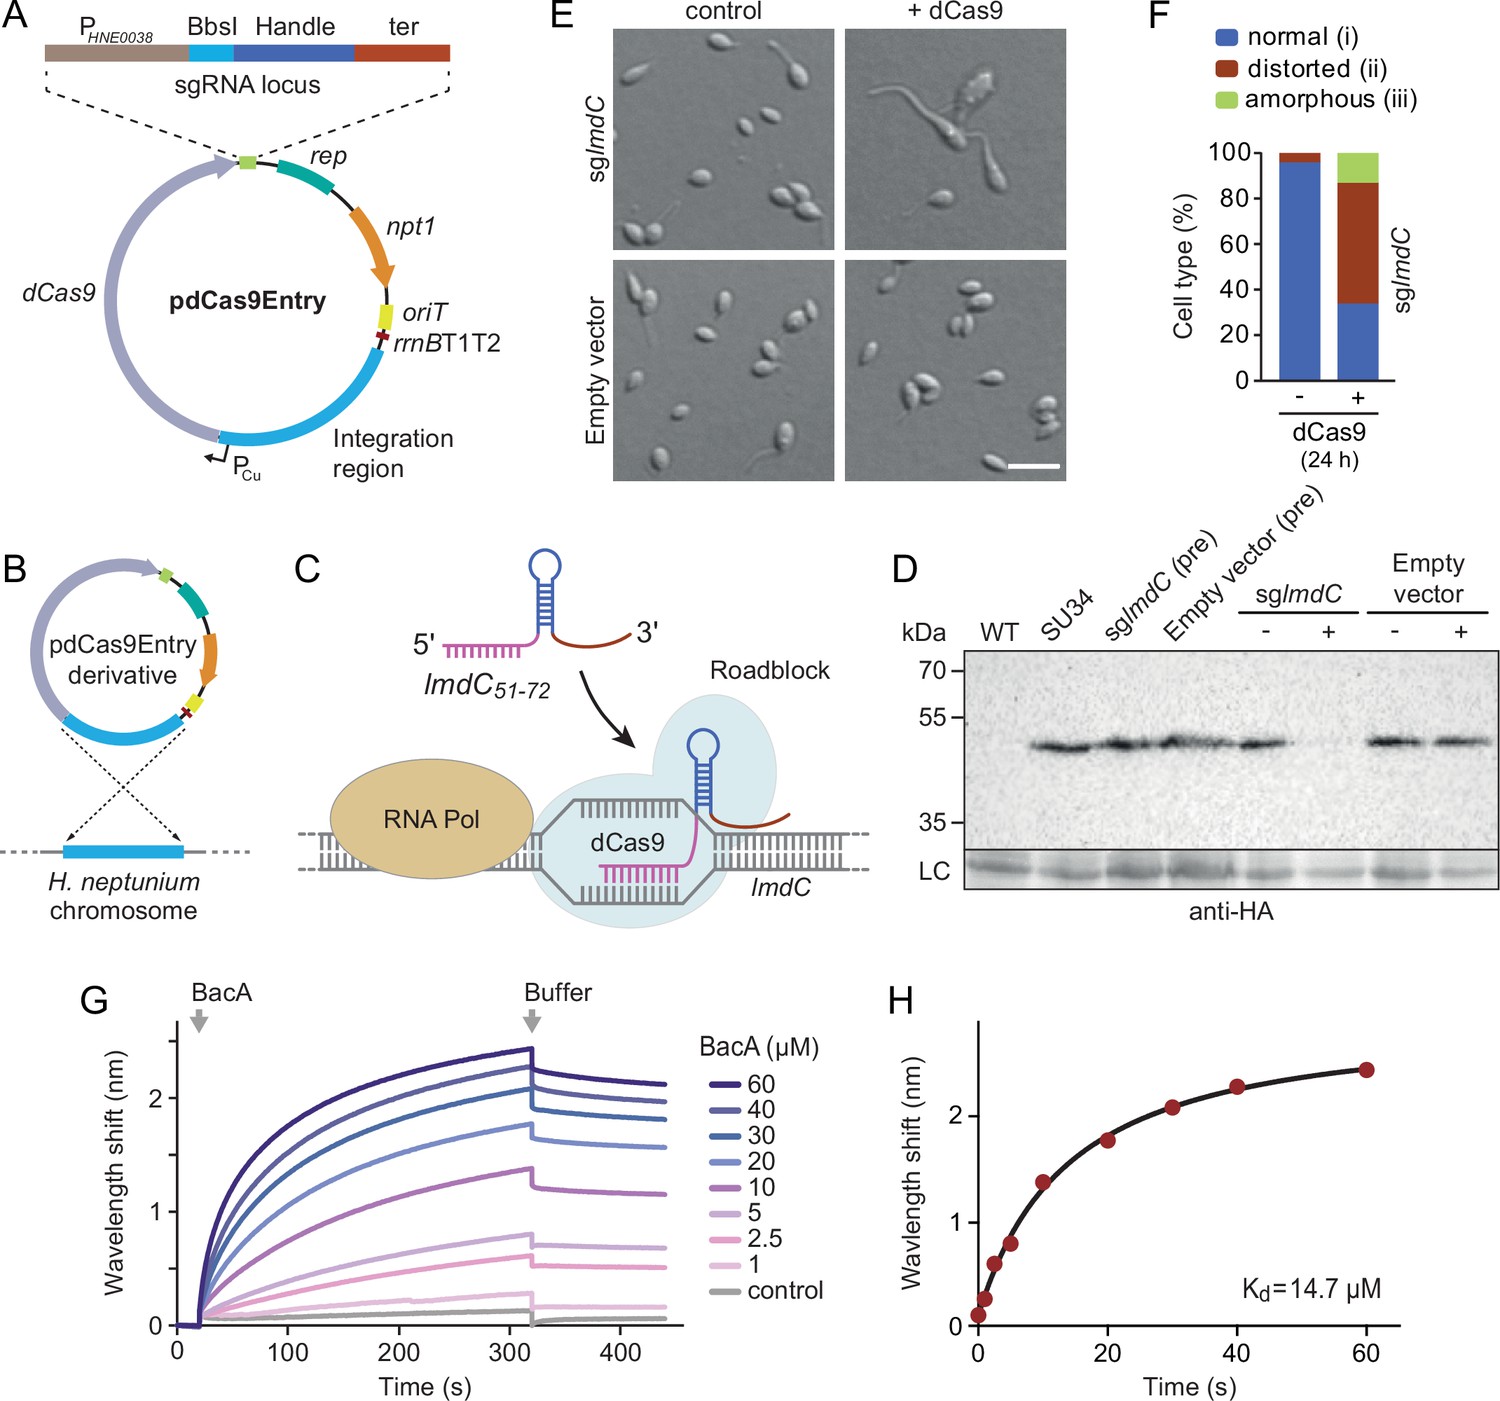
LmdC interacts with BacA to mediate H. neptunium morphogenesis.
(A) Schematic representation of the integrative plasmid pdCas9Entry, enabling CRISPR interference (CRISPRi) in H. neptunium. The plasmid harbors a chromosomal fragment containing the copper-inducible PCu promoter, followed by a gene encoding a nuclease-deficient variant of Cas9 (dCas9). It also contains an sgRNA expression cassette composed of the constitutive PHNE0038 promoter, a BbsI cloning site for the insertion of target-specific DNA fragments, a sequence encoding an optimized small guide RNA (sgRNA) handle (Chen et al., 2013), and a transcriptional terminator (ter). Other features of the plasmid are a replication initiator gene (rep), a kanamycin resistance gene (npt1), an origin of transfer (oriT), and a strong transcriptional terminator (rrnBT1T2) that is placed upstream of the PCu-containing fragment. The DNA sequence of the sgRNA expression cassette is given in Figure 9—figure supplement 1. (B) Schematic showing the integration of a pdCas9Entry derivative into the H. neptunium chromosome by single homologous recombination at the PCu locus. (C) Mechanism of the CRISPRi-mediated repression of lmdC expression. In the presence of inducer, dCas9 interacts with a constitutively produced sgRNA that targets bases 51–72 of the non-coding strand of lmdC (sglmdC). The formation of the interference complex creates a roadblock that blocks the transcription of lmdC by RNA polymerase. (D) Immunoblot analysis verifying the CRISPRi-mediated depletion of LmdC. Strain SU34 (lmdC::lmdC-HA), which produces a fully functional variant of LmdC carrying the HA affinity tag inserted in between the transmembrane helix and the coiled-coil domain, was transformed with pdCas9Entry (empty vector) or plasmid pJH13 (sglmdC). The resulting strains (SP249 and SP236) were grown for 24 hr in the absence (-) or presence (+) of 0.3 mM CuSO4 and subjected to immunoblot analysis with an anti-HA antibody. The wild-type strain (LE670), the parental strain SU34 as well as the uninduced pre-cultures (pre) of strains SP249 and SP236 used for the experiment were analyzed as controls. A non-specific band served as a loading control (LC). (E) Morphology of H. neptunium cells depleted of LmdC. Shown are representative cells of strains SP236 (lmdC::lmdC-HA pJH13) (sglmdC) and SP249 (lmdC::lmdC-HA pCas9Entry) (empty vector) grown for 24 hr in the absence (control) or presence (+dCas9) of 0.3 mM CuSO4. Cells were imaged by DIC and fluorescence microscopy. Bar: 2 µm. (F) Quantification of the proportion of phenotypically abnormal stalked and budding cells in the cultures of strain SP236 (lmdC::lmdC-HA pJH13) analyzed in panel E (n=100 cells per condition). (G) Bio-layer interferometric analysis of the interaction between cytoplasmic domain of LmdC and BacA. Sensors derivatized with a biotinylated synthetic peptide comprising the N-terminal cytoplasmic region of LmdC (amino acids 1–38) were probed with the indicated concentrations of BacA. After the association of BacA, the sensors were transferred to protein-free buffer to induce BacA dissociation. The interaction kinetics were followed by monitoring the wavelength shifts resulting from changes in the optical thickness of the sensor surface during association or dissociation of the analyte. The extent of non-specific binding of BacA to the sensor surface was negligible (control). (H) Affinity of the BacA-LmdC interaction. The maximal wavelength shifts measured in the experiment shown in panel G were plotted against the corresponding BacA concentration. The data were fitted to a one-site binding model, yielding an apparent KD value of ~15 µM.
-
Figure 9—source data 1
Raw images for the immunoblot analysis in Figure 9D.
- https://cdn.elifesciences.org/articles/86577/elife-86577-fig9-data1-v2.zip
Figure 9—figure supplement 1
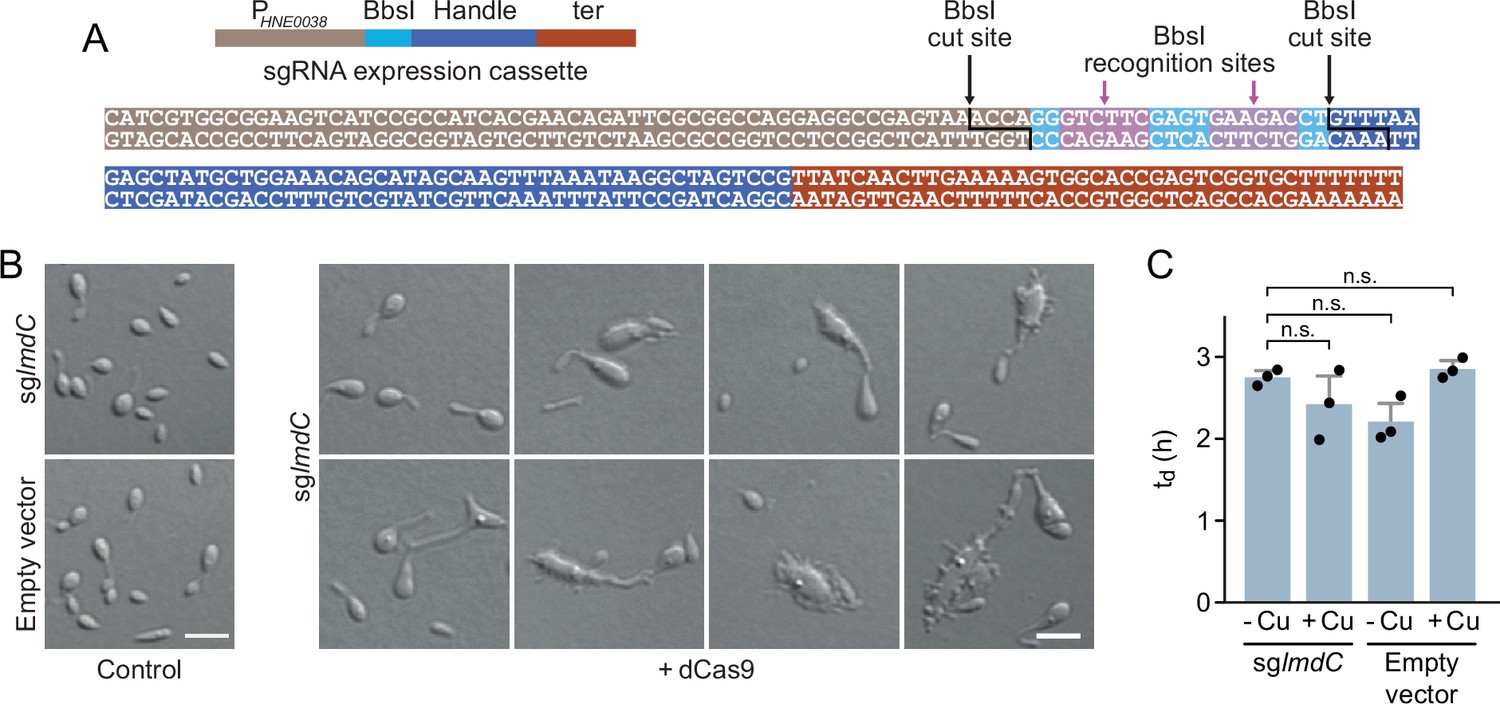
Characterization of the phenotype induced by the CRISPRi-mediated depletion of LmdC in H. neptunium.
(A) Sequence of the small guide RNA (sgRNA) expression cassette of pdCas9Entry. The different parts of the sequence are colored as defined in the schematic on top. The BsbI recognition and cut sites are indicated by arrows. (B) Morphological diversity of H. neptunium cells depleted of LmdC. Shown are representative cells of strains SP236 (lmdC::lmdC-HA pJH13) (sglmdC) and SP249 (lmdC::lmdC-HA pCas9Entry) (empty vector) grown for 24 hr in the absence (control) or presence (+dCas9) of 0.3 mM CuSO4. Cells were imaged by DIC microscopy. Bar: 2 µm.(C) Doubling times of the strains analyzed in panel B in the absence (-Cu) or presence (+Cu) of 0.3 mM CuSO4. Bars represent the mean (± SD) of three independent experiments (dots). Statistical significance was determined using an unpaired two-sided Welch’s t-test (n.s., not significant).
Figure 10 with 4 supplements
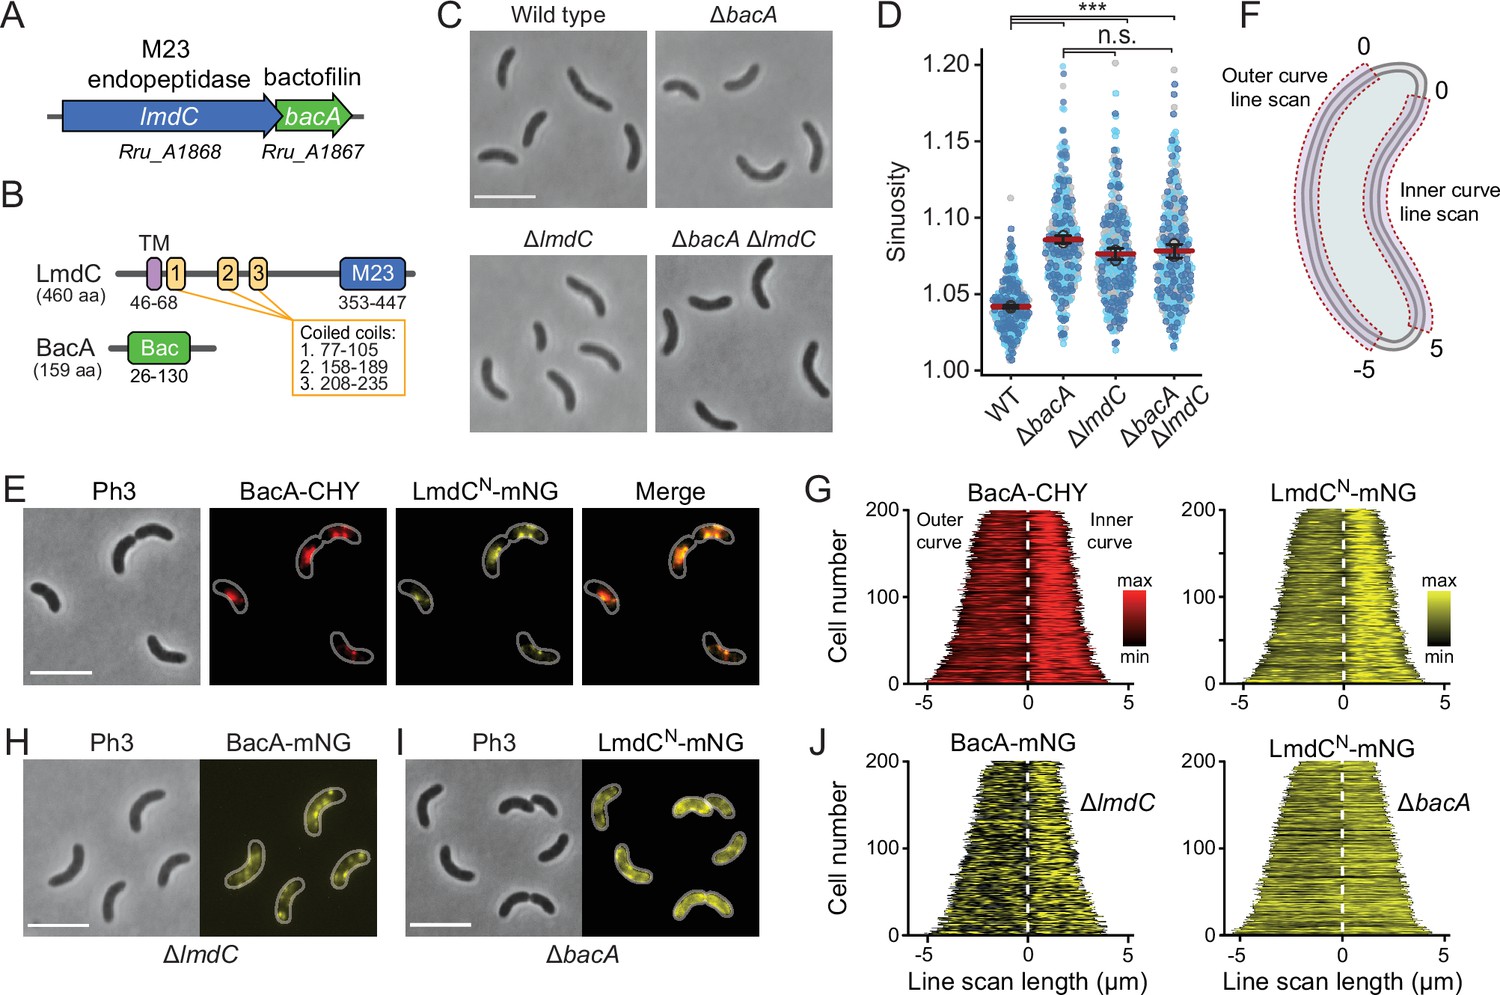
BacA and LmdC contribute to cell morphogenesis in R. rubrum.
(A) Schematic representation of the bacA-lmdC operon in R. rubrum. (B) Domain organization of LmdC and BacA from R. rubrum. LmdCRs consists of a transmembrane helix (TM) followed by a coiled-coil-rich region and a C-terminal M23 peptidase domain (M23). The bactofilin polymerization domain (green box) is flanked by non-structured N- and C-terminal regions. Numbers indicate the first and last amino acid of a domain. (C) Phenotypes of R. rubrum wild-type (S1), ΔbacARs (SP70), ΔlmdCRs (SP68), and ΔbacARs ΔlmdCRs (SP116) cells, imaged using phase-contrast microscopy. Bar: 5 µm. (D) Superplots showing the distribution of cell sinuosities in populations of the indicated R. rubrum strains. Small dots represent the data points, large dots represent the median values of the three independent experiments shown in the graphs (dark blue, light blue, gray). The mean of the three median values is indicated by a horizontal red line. Whiskers represent the standard deviation. ***p<0.005; ns, not significant; unpaired two-sided Welch's t-test. (E) Co-localization of BacARs-CHY and LmdCNRs-mNG in the ΔlmdCRs background (SP119). The Pearson’s Correlation Coefficient (PCC) of the two fluorescence signals in a random subpopulation of cells is 0.916. Scale bar: 5 µm. (F) Schematic showing the approach used to quantify the distribution of proteins along the outer and inner curve of a cell in panels G and J. (G) Demographs showing the enrichment of BacA-CYH and LmdCN-mNG at the inner curve the populations of strain SP119 analyzed in panel E (n=200 cells per strain). The white dashed line represents the point of transition from the outer to the inner curve. (H) Localization of BacARs-mNG in the ΔlmdCRs background (SP98). Bar: 5 µm. (I) Localization of LmdCRs-mNG in the ΔbacARs background (SP118). Bar: 5 µm. (J) Demographs showing the outer-versus-inner curve distribution of BacARs-mNG in the ΔlmdCRs background (SP98; n=200 cells) and LmdCNRs-mNG in the ΔbacARs background (SP118; n=200 cells). The white dashed line represents the point of transition from the outer to the inner curve.
Figure 10—figure supplement 1

Analysis of the role of BacA and LmdC in R. rubrum morphogenesis.
(A) Clearer visualization of the abnormal curvature of BacA- and LmdC-deficient R. rubrum cells by the inhibition of cell division. Cells of strains SP68 (ΔlmdC), SP70 (ΔbacA) and SP116 (ΔlmdC ΔbacA) were treated with 5 μg/ml cefalexin (Cfx) for 6 hr. Bar: 5 µm. (B) Muropeptide profiles of different R. rubrum strains. Cell walls of strains S1 (wild-type), SP70 (ΔbacARs), and SP68 (ΔlmdC) were digested with cellosyl to release muropeptides, which were reduced and separated by HPLC chromatography. The identities of major muropeptide species, assigned based on the previously reported retention times (Glauner, 1988), are given above the corresponding peaks. Tetra stands for N-acetylglucosamine-N-acetylmuramitol tetrapeptide. ‘Anh’ indicates muropeptides containing 1,6-anhydromuramic acid. A quantification of the different muropeptide species is given in Supplementary file 2.
Figure 10—figure supplement 2

Cell lengths of R. rubrum strains.
Superplots showing the distribution of cell sinuosities in populations of strains S1 (wild-type), SP105 (∆bacARs PbacA-bacARs), and SP109 (bacARs::bacARs-mCherry). Small dots represent the data points, large dots represent the median values of the three independent experiments shown in the graphs (dark blue, light blue, gray). The mean of the three median values is indicated by a horizontal line. Whiskers represent the standard deviation. ***p<0.005; ns, not significant; unpaired two-sided Welch's t-test.
Figure 10—figure supplement 3

Lysis of E. coli upon heterologous expression of full-length R. rubrum lmdC.
Shown are cells of E. coli Rosetta(DE3)pLysS harboring pSP120 (PT7-lmdCRs) or the corresponding empty vector imaged 4 hr after the induction of gene expression with 0.5 mM isopropyl-β-D-1-thiogalactopyranoside (IPTG). Arrowheads indicate ghost cells, cell debris, lysing cells, or highly elongated cells. Scale bar: 5 µm.
Figure 10—figure supplement 4
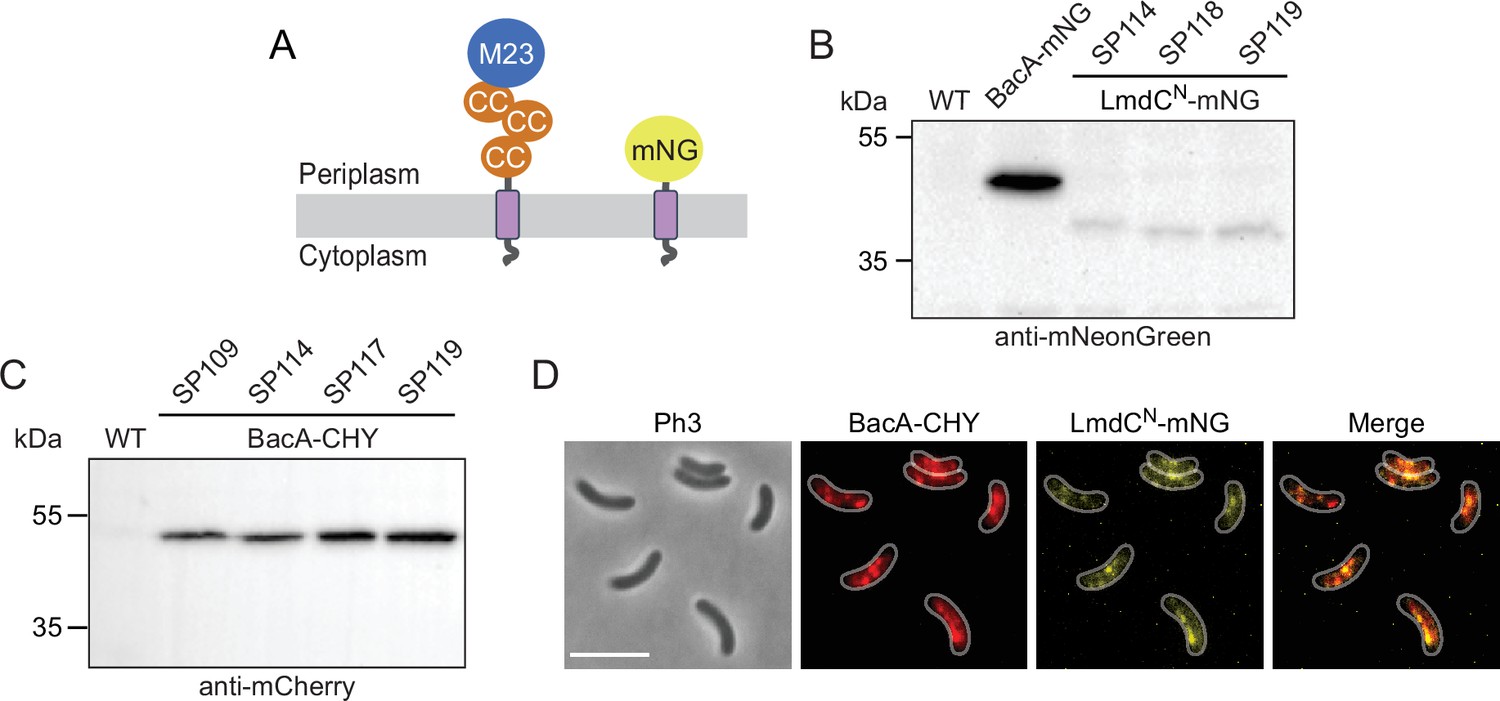
Analysis of R. rubrum strains producing fluorescent protein fusions.
(A) Domain architectures of the native LmdCRs protein and the truncated LmdCNRs-mNG reporter construct used for localization studies. The transmembrane helix is shown in purple. Abbreviations: CC (coiled-coil domain), M23 (M23 peptidase domain), mNG (mNeongreen). (B) Levels of the LmdCNRs-mNG fusion in different R. rubrum strains. Strains SP98 (∆lmdCRs bacARs::bacARs-mNeongreen), SP114 (bacARs::bacARs-mCherry PlmdC-lmdCNRs-mNeongreen), SP118 (∆bacA ∆lmdC PlmdC-lmdC1-80-mNeongreen), and SP119 (bacA::bacA-mCherry ∆lmdC PlmdC-lmdC1-80-mNeongreen) were subjected to immunoblot analysis with an anti-mNeonGreen antibody. Predicted molecular weights: BacARs-mNG (44.8 kDa), LmdCNRs-mNG fusion (35.9 kDa). (C) Levels of the BacARs-CHY fusion protein in different R. rubrum strains. Strains SP109 (bacARs::bacARs-mCherry), SP114 (bacARs::bacARs-mCherry PlmdC-lmdCNRs-mNeongreen), SP117 (bacARs::bacARs-mCherry ∆lmdC), and SP119 (bacARs::bacARs-mCherry ∆lmdC PlmdC-lmdCNRs-mNeongreen) were subjected to immunoblot analysis with an anti-mCherry antibody. The predicted molecular weight of BacARs-CHY is 44.9 kDa. (D) Co-localization of BacARs-CHY and LmdCRs-mNG in R. rubrum cells carrying the native lmdCRs gene. The Pearson’s Correlation Coefficient (PCC) of the two fluorescence signals in a random subpopulation of cells (n=177) is 0.54. Scale bar: 5 µm.
-
Figure 10—figure supplement 4—source data 1
Raw images for the immunoblot analyses in Figure 10—figure supplement 4B and C.
- https://cdn.elifesciences.org/articles/86577/elife-86577-fig10-figsupp4-data1-v2.zip
Figure 11
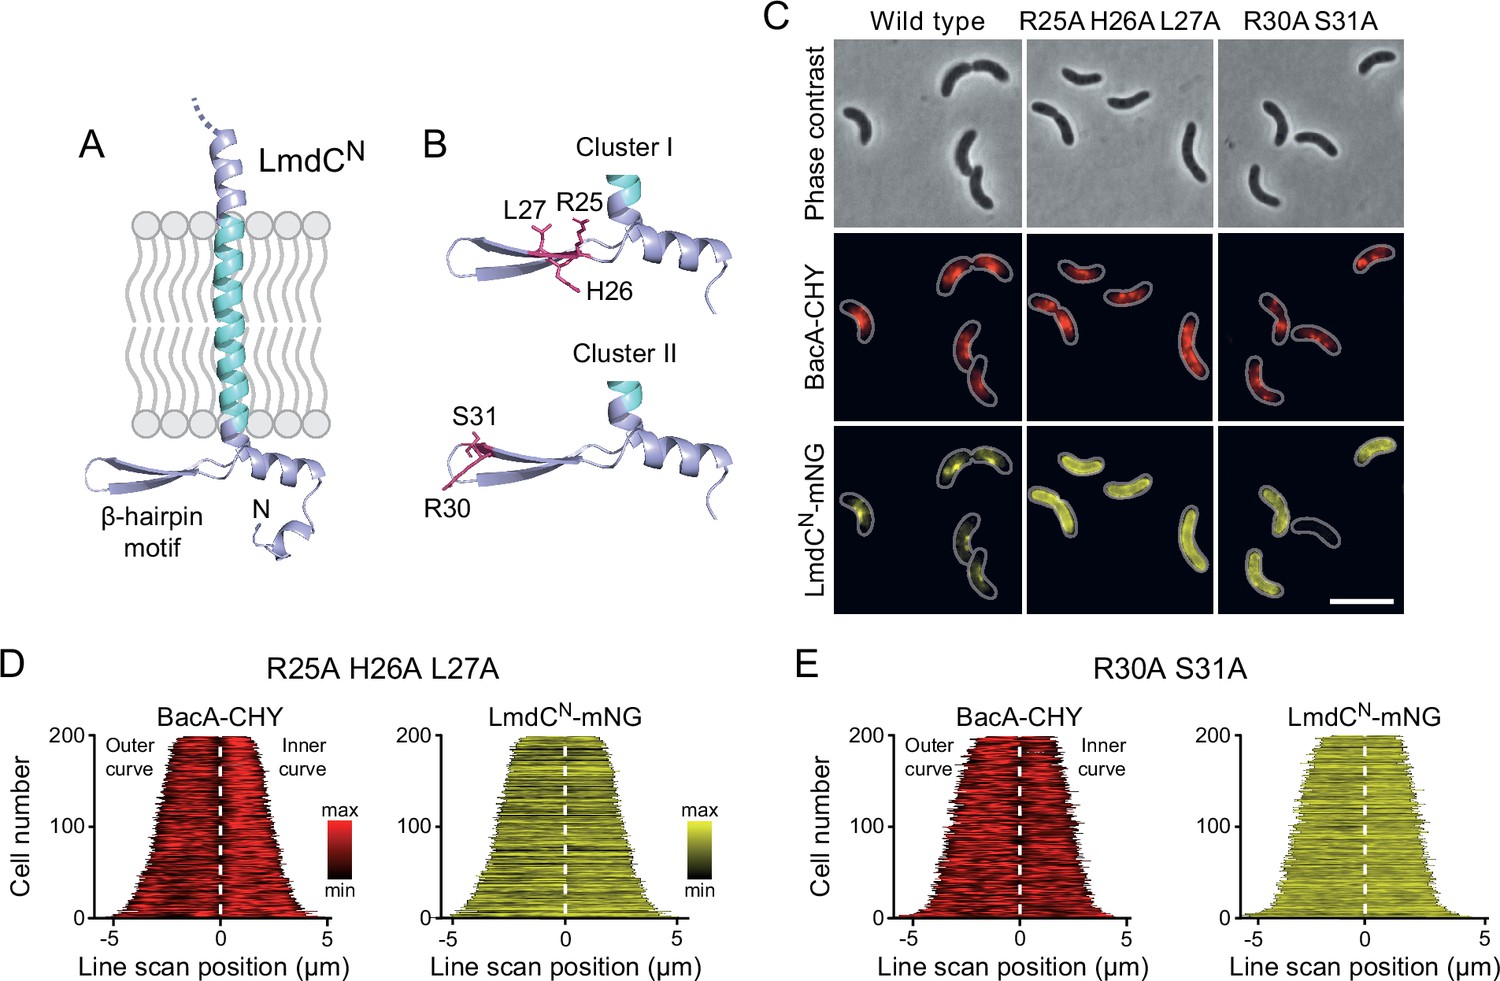
The β-hairpin in the cytoplasmic region of LmdC is critical for BacA binding.
(A) Predicted structure of LmdCN, comprising the first 80 amino acids of LmdC. The transmembrane domain is colored light blue. The cytoplasmic domain includes a conserved β-hairpin motif. (B) Clusters of amino acids mutated for the analysis of BacA-LmdC interaction. Mutated amino acids are shown as red sticks. (C) Localization of BacARs-CHY and the indicated LmdCNRs-mNG variants in the ΔlmdCRs background. The Pearson’s Correlation Coefficient (PCC) of the two fluorescence signals in a random subpopulation of cells is 0.914 for the wild-type fusion protein (SP119), 0.887 for the R25A-H26A-L27A variant (SP237) and 0.827 for the R30A-S31A variant (SP238). Scale bar: 5 µm. (D,E) Demographs showing the distribution of BacA-mCherry and (D) R25A-H26A-L27A variant (SP237) or R31A-S31A variant (SP238) of LmdCN-mNG along the outer and inner curve of the cell (n=200 cells per strain). The white line marks the point of transition from the outer and the inner curve. The analysis was performed as described in Figure 10F.
Figure 12
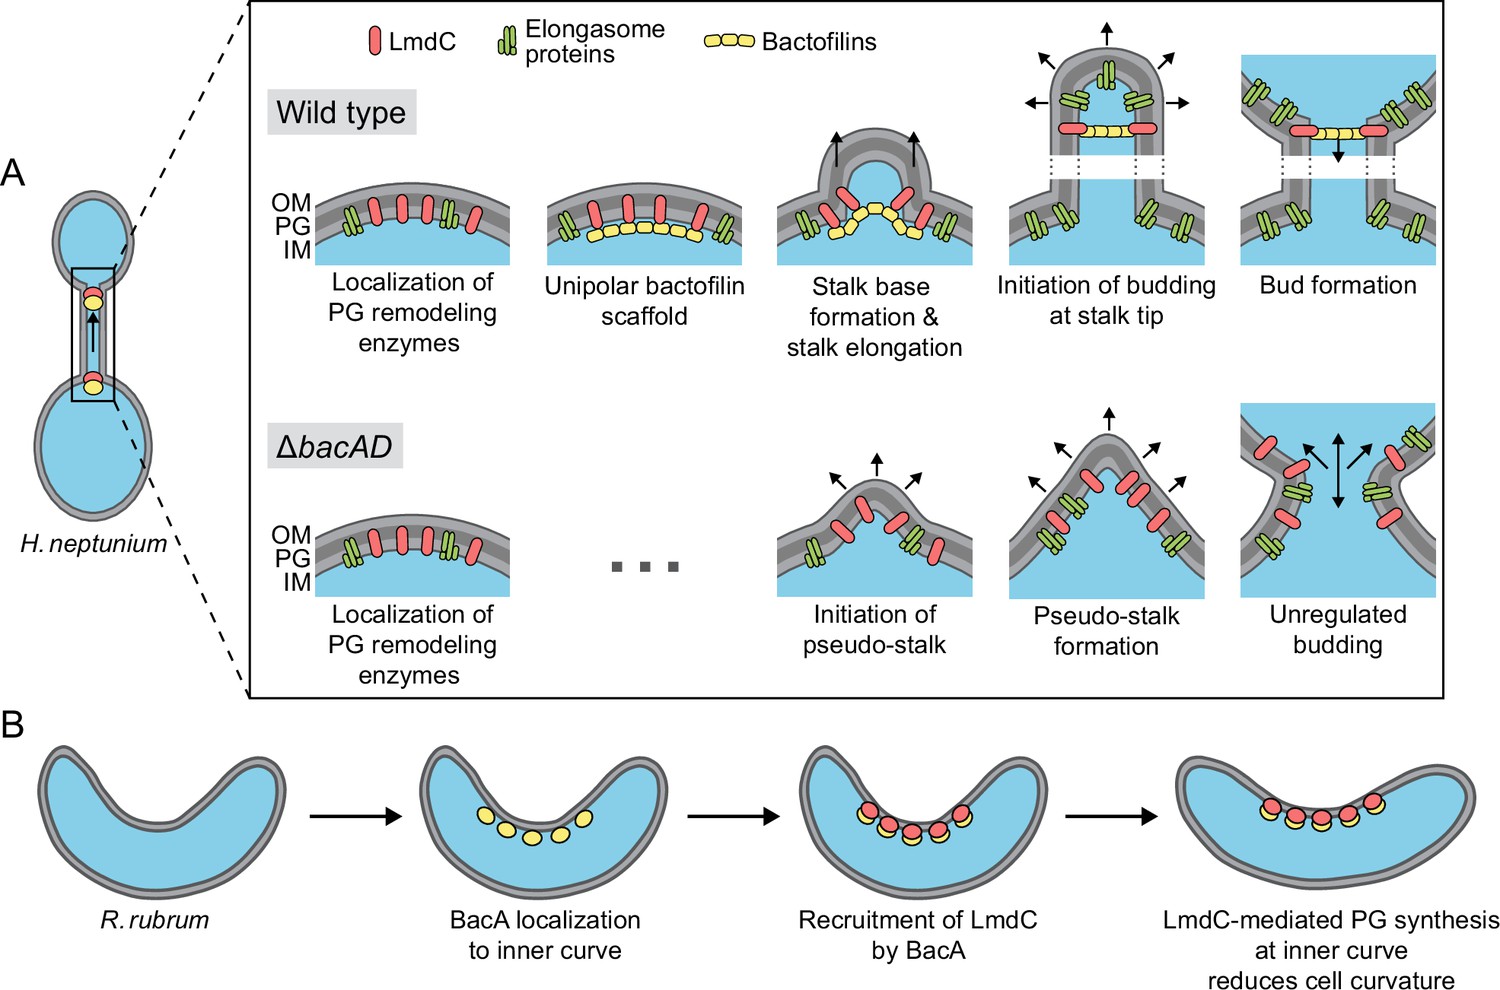
Model of the roles of BacA and LmdC in H. neptunium and R. rubrum cell morphogenesis.
(A) Cell morphogenesis in H. neptunium wild-type (top) and ΔbacAD cells (bottom). In wild-type cells, BacA polymers form a complex with the DD-endopeptidase LmdC at the future stalked pole. The hydrolytic activity of LmdC, possibly stimulated by its interaction with BacA, helps to curve the cell wall at the incipient stalk base and thus determine stalk morphology. The zone of high positive inner cell curvature and, potentially, the physical barrier constituted by the bactofilin polymer prevent the movement of elongasome complexes from the mother cell body into the stalk, thereby limiting peptidoglycan biosynthesis to the stalked cell pole. At a later stage, the bactofilin-LmdC complex localizes close to the tip of the stalk and again generates a ring-shaped zone of positive cell curvature, thereby promoting the remodeling of the stalk tip into a spherical bud. At the onset of the budding process, elongasome complexes accumulate in the nascent bud by a so-far unknown mechanism. The positively curved bud neck and the bactofilin polymers prevent the movement of elongasome complexes from the bud into the stalk, thereby limiting cell growth to the bud compartment. In the ΔbacAD mutant, cells fail to concentrate LmdC at the future stalk base and bud neck. As a consequence, peptidoglycan biosynthesis is no longer limited to the different growth zones, leading to pseudo-stalk formation and unregulated bud expansion. (B) Bactofilin-mediated modulation of cell curvature in R. rubrum. BacARs (yellow) recruits LmdCRs (red) to the inner curve of the cell. The hydrolytic activity of LmdC ultimately stimulates peptidoglycan biosynthesis at this position, leading to a reduction in cell helicity.
Tables
Appendix 1—key resources table
| Reagent type (species) or resource | Designation | Source or reference | Identifiers | Additional information |
|---|---|---|---|---|
| Gene (Hyphomonas neptunium) | bacA | GenBank | ABI77372 | |
| Gene (Hyphomonas neptunium) | bacD | GenBank | ABI76590 | |
| Gene (Hyphomonas neptunium) | lmdC | GenBank | ABI76766 | |
| Gene (Rhodospirillum rubrum) | bacA | GenBank | ABC22667 | |
| Gene (Rhodospirillum rubrum) | lmdC | GenBank | ABC22668 | |
| Strain (Hyphomonas neptunium) | LE670 | Leifson, 1964 | ATCC 15444 | Wild-type strain |
| Strains (Hyphomonas neptunium) | LE670 derivatives | This paper | See Supplementary file 1 | |
| Strain (Rhodospirillum rubrum) | S1 | Molisch, 1907 | ATCC 11170 | Wild-type strain |
| Strains (Rhodospirillum rubrum) | S1 derivatives | This paper | See Supplementary file 1Supplementary material 1 | |
| Strain (Escherichia coli) | BL21(DE3) | Invitrogen | Cat. #: CMC0016 | E. coli B dcm ompT hsdS(rB- mB-) gal |
| Strain (Escherichia coli) | Rosetta(DE3)pLysS | Merck Millipore | Cat. #: 70956 | F- ompT hsdSB(rB- mB-) gal dcm (DE3) pLysSRARE (CamR) |
| Strain (Escherichia coli) | TOP10 | Thermo Fisher Scientific | Cat. #: C404003 | F- mcrA Δ(mrr-hsdRMS-mcrBC) Φ80lacZΔM15 ΔlacX74 recA1 araD139 Δ(ara-leu) 7697 galU galK rpsL (StrR) endA1 nupG |
| Strain (Escherichia coli) | WM3064 | Metcalf (unpublished) | thrB1004 pro thi rpsL hsdS lacZΔM15 RP4–1360 Δ(araBAD)567 ΔdapA1341::[erm pir(wt)] | |
| Antibody | anti-mNeongreen (Mouse monoclonal) | Chromotek | Cat. #: 32f6 | 1:1,000 |
| Antibody | anti-GFP (Rabbit polyclonal) | Sigma | Cat. #: G1544 | 1:10,000 |
| Antibody | anti-mCherry (Rabbit polyclonal) | BioVision | Cat. #: 5993 | 1:10,000 |
| Antibody | anti-HA (Mouse monoclonal) | Millipore | Cat. #: 05–904 | 1:1,000 |
| Recombinant DNA reagent | pCCFPC-3 (plasmid) | Jung et al., 2015 | Integrating plasmid for the generation of C-terminal CFP fusions under the control of PCu, RifR | |
| Recombinant DNA reagent | pCCFPC-3 derivatives | This paper | See Supplementary file 1 | |
| Recombinant DNA reagent | pCCHYC-2 (plasmid) | Jung et al., 2015 | Integrating plasmid for generation of C-terminal mCherry fusions under control of PCu, KanR | |
| Recombinant DNA reagent | pCCHYC-2 derivatives | This paper | See Supplementary file 1 | |
| Recombinant DNA reagent | pCCHYC-3 (plasmid) | Jung et al., 2015 | Integrating plasmid for the generation of C-terminal mCherry fusions under the control of PCu, RifR | |
| Recombinant DNA reagent | pCCHYC-3 derivatives | This paper | See Supplementary file 1 | |
| Recombinant DNA reagent | pCCHYN-2 (plasmid) | Jung et al., 2015 | Integrating plasmid for the generation of N-terminal mCherry fusions under the control of PCu, KanR | |
| Recombinant DNA reagent | pCCHYN-2 derivatives | This paper | See Supplementary file 1 | |
| Recombinant DNA reagent | pCVENC-3 (plasmid) | Jung et al., 2015 | Integrating plasmid for the generation of C-terminal Venus fusions under the control of PCu, RifR | |
| Recombinant DNA reagent | pCVENC-3 derivatives | This paper | See Supplementary file 1 | |
| Recombinant DNA reagent | pdCas9-humanized (plasmid) | Qi et al., 2013 | Addgene plasmid #: 44246; RRID: Addgene_44246 | Plasmid carrying a codon-optimized version of the S. pyogenes dCas9 gene |
| Recombinant DNA reagent | pdCas9-humanized derivatives | This paper | See Supplementary file 1 | |
| Recombinant DNA reagent | pET21a(+) | Novagen | Plasmid for the overexpression of C-terminally His6-tagged proteins, AmpR | |
| Recombinant DNA reagent | pET21a(+) derivatives | This paper | See Supplementary file 1 | |
| Recombinant DNA reagent | pNPTS138 (plasmid) | R. K. Alley, unpublished | sacB-containing suicide vector used for double homologous recombination, KanR | |
| Recombinant DNA reagent | pNPTS138 derivatives | This paper | See Supplementary file 1 | |
| Recombinant DNA reagent | pRSFDuet-1 (plasmid) | Novagen | Plasmid for the coexpression of genes under the control of the T7 promoter | |
| Recombinant DNA reagent | pRSFDuet-1 derivatives | This paper | See Supplementary file 1 | |
| Recombinant DNA reagent | pRXMCS-2 (plasmid) | Thanbichler et al., 2007 | Low-copy replicative plasmid for the ectopic expression of genes under the control of Pxyl, KanR | |
| Recombinant DNA reagent | pRXMCS-2 derivatives | This paper | See Supplementary file 1 | |
| Recombinant DNA reagent | pTB146 (plasmid) | Bernhard, unpublished | Plasmid for overexpression of N-terminally His6-SUMO-tagged proteins, AmpR | |
| Recombinant DNA reagent | pTB146 derivatives | This paper | See Supplementary file 1 | |
| Recombinant DNA reagent | pXYFPC-2 (plasmid) | Thanbichler et al., 2007 | Integrating plasmid for generation of C‐terminal eYFP fusions under control of Pxyl, KanR | |
| Recombinant DNA reagent | pXYFPC-2 derivatives | This paper | See Supplementary file 1 | |
| Recombinant DNA reagent | pZVENC-2 (plasmid) | Jung et al., 2015 | Integrating plasmid for the generation of C-terminal Venus fusions under the control of PZn, KanR | |
| Recombinant DNA reagent | pZVENC-2 derivatives | This paper | See Supplementary file 1 | |
| Sequence-based reagent | DNA oligonucleotides | This paper | See Supplementary file 1 | |
| Peptide, recombinant protein | LmdCHne (aa 1-38) | GenScript | Biotin-MAKWSANLKATFDRAFPERQIYHRSGGTVRYISISPWQ | |
| Chemical compound, drug | 2,6-diaminopimelic acid (DAP) | Sigma | Cat. #: 33240–5 g | |
| Chemical compound, drug | ampicillin | Carl Roth | Cat. #: K029.3 | |
| Chemical compound, drug | cefalexin | Sigma | Cat. #: C4895-5G | |
| Chemical compound, drug | CuSO4 | Carl Roth | Cat. #: P024.2 | |
| Chemical compound, drug | kanamycin | Carl Roth | Cat. #: T832.3 | |
| Chemical compound, drug | rifampicin | Sigma | Cat. #: R3501 | |
| Chemical compound, drug | ZnSO4 | Carl Roth | Cat. #: K301.1 | |
| Chemical compound | hydroxy coumarin-carbonyl-amino-D-alanine (HADA) | Kuru et al., 2015 | Pulse-labeling of sites of ongoing cell wall biosynthesis | |
| Software, algorithm | BLAST | Altschul et al., 1990 | https://blast.ncbi.nlm.nih.gov/Blast.cgi | |
| Software, algorithm | DeepTMHMM | Hallgren et al., 2022 | https://dtu.biolib.com/DeepTMHMM | |
| Software, algorithm | PCOILS | Lupas, 1996 | https://toolkit.tuebingen.mpg.de/tools/pcoils | |
| Software, algorithm | PFAM | Mistry et al., 2021 | http://pfam.xfam.org | |
| Software, algorithm | AlphaFold2 | Jumper et al., 2021 | https://colab.research.google.com/github/sokrypton/ColabFold/blob/main/AlphaFold2.ipynb | |
| Software, algorithm | AlphaFold-Multimer | Evans et al., 2022 | https://colab.research.google.com/github/sokrypton/ColabFold/blob/main/AlphaFold2.ipynb | |
| Software, algorithm | SuperPlotsOfData | Goedhart, 2021 | https://huygens.science.uva.nl/SuperPlotsOfData | |
| Software, algorithm | ImageJ | Schneider et al., 2012 | https://imagej.net/ij/download.html | Plug-ins: JACoP (Bolte and Cordelières, 2006; https://imagej.net/plugins/jacop), MicrobeJ (Ducret et al., 2016; https://www.microbej.com/download-2) |
| Software, algorithm | BacStalk | Hartmann et al., 2020 | https://drescherlab.org/data/bacstalk/ | |
| Software, algorithm | SMTracker | Oviedo-Bocanegra et al., 2021 | https://sourceforge.net/projects/singlemoleculetracker/ | |
| Software, algorithm | Cell-profiles R package | Cameron et al., 2014 | https://github.com/ta-cameron/Cell-Profiles |
Additional files
-
Supplementary file 1
Muropeptide composition of peptidoglycan from wild-type and bactofilin-deficient H. neptunium cells.
The spreadsheet gives the abundance of different muropeptide species in strains LE670 (wild-type), EC28 (ΔbacA), EC23 (ΔbacD), and EC33 (ΔbacAD), as obtained in the analysis described in Figure 2—figure supplement 2.
- https://cdn.elifesciences.org/articles/86577/elife-86577-supp1-v2.xlsx
-
Supplementary file 2
Muropeptide composition of peptidoglycan from wild-type and mutant R. rubrum cells.
The spreadsheet gives the abundance of different muropeptide species in strains S1 (wild-type), SP70 (ΔbacARs), and SP68 (ΔlmdCRs), as obtained in the analysis described in Figure 10—figure supplement 1B.
- https://cdn.elifesciences.org/articles/86577/elife-86577-supp2-v2.xlsx
-
Supplementary file 3
Plasmids, strains, and oligonucleotides were used in this study.
- https://cdn.elifesciences.org/articles/86577/elife-86577-supp3-v2.docx
-
MDAR checklist
- https://cdn.elifesciences.org/articles/86577/elife-86577-mdarchecklist1-v2.docx
-
Source data 1
This file contains source data for Figure 1F, Figure 9G and H, Figure 10D, Figure 1—figure supplement 2D, Figure 9—figure supplement 1C, Figure 10—figure supplement 2.
- https://cdn.elifesciences.org/articles/86577/elife-86577-data1-v2.xlsx
Download links
A two-part list of links to download the article, or parts of the article, in various formats.
Downloads (link to download the article as PDF)
Open citations (links to open the citations from this article in various online reference manager services)
Cite this article (links to download the citations from this article in formats compatible with various reference manager tools)
A dynamic bactofilin cytoskeleton cooperates with an M23 endopeptidase to control bacterial morphogenesis
eLife 12:RP86577.
https://doi.org/10.7554/eLife.86577.3


