Optical tools for visualizing and controlling human GLP-1 receptor activation with high spatiotemporal resolution
- Institute of Pharmacology and Toxicology, University of Zürich, Switzerland
- Department of Chemistry, University of Zürich, Switzerland
- Neuroscience Center Zurich, University and ETH Zürich, Switzerland
Figures
Figure 1 with 3 supplements
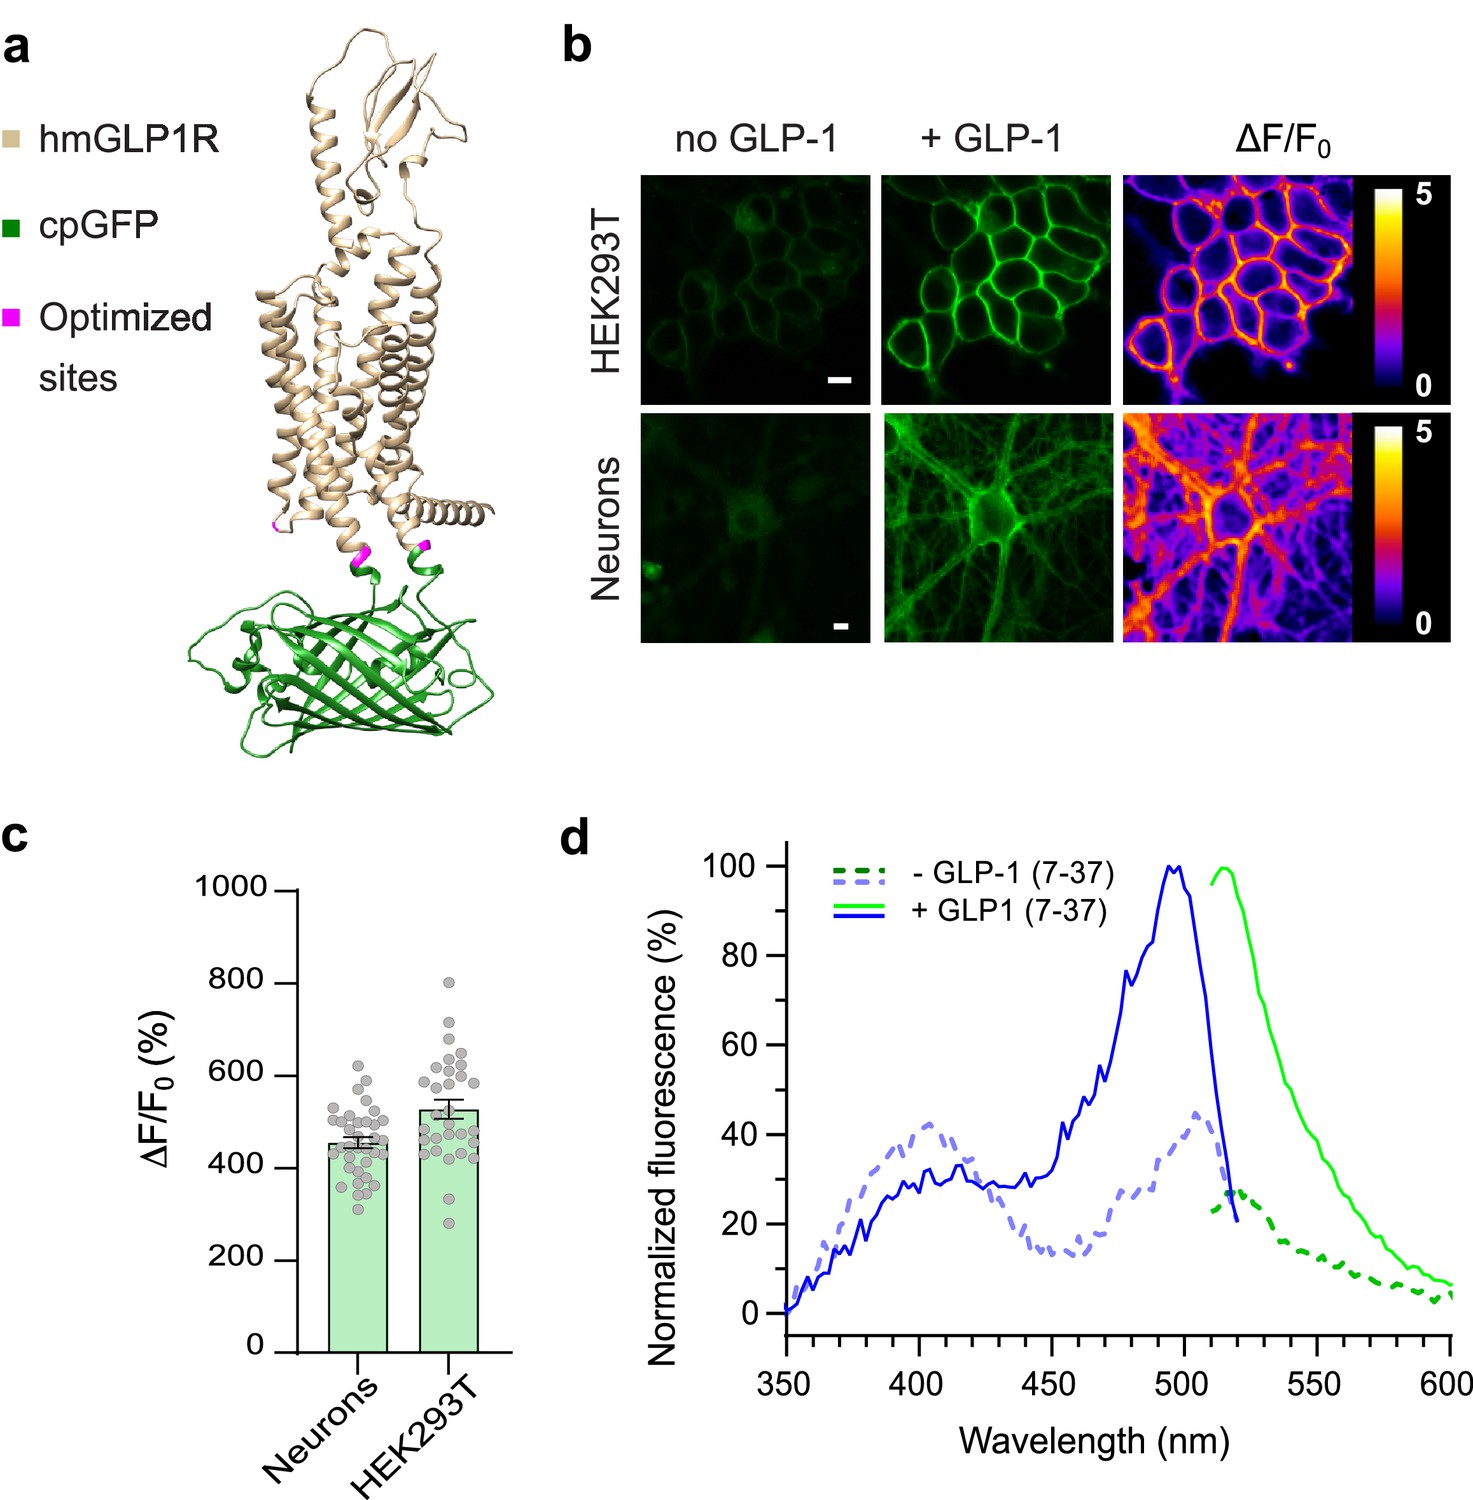
Development and optical properties of GLPLight1.
(a) Structural model of GLPLight1 obtained using Alphafold (Mirdita et al., 2022). The human glucagon-like peptide-1 receptor (GLP1R) is shown in gold, cpGFP in green, and residue targets of mutagenesis are shown in magenta. (b) Representative images showing GLPLight1 expression and fluorescence intensity change before (left) and after (center) addition of 10 μM glucagon-like peptide-1 (GLP-1) (7–37) as well as their respective pixel-wise ΔF/F0 images in HEK293T cells (top) and primary cortical neurons (bottom). Scale bars, 10 μm. (c) Maximal fluorescence response of GLPLight1 expressed in the indicated cell types after the addition of 10 μM GLP1. n=35 neurons and n=30 HEK293T cells, from 3 independent experiments. (d) One-photon excitation/emission spectra of GLPLight1-expressing HEK293T cells before (dark green and dark blue) and after (light green and light blue) addition of 10 μM GLP-1 (7–37) normalized to the peak excitation and emission of the GLP-1-bound state of the sensor. Data were obtained from three independent experiments. Only mean values are shown. All data shown as mean ± SEM unless stated otherwise.
-
Figure 1—source data 1
Development and optical properties of GLPLight1.
- https://cdn.elifesciences.org/articles/86628/elife-86628-fig1-data1-v1.xlsx
Figure 1—figure supplement 1
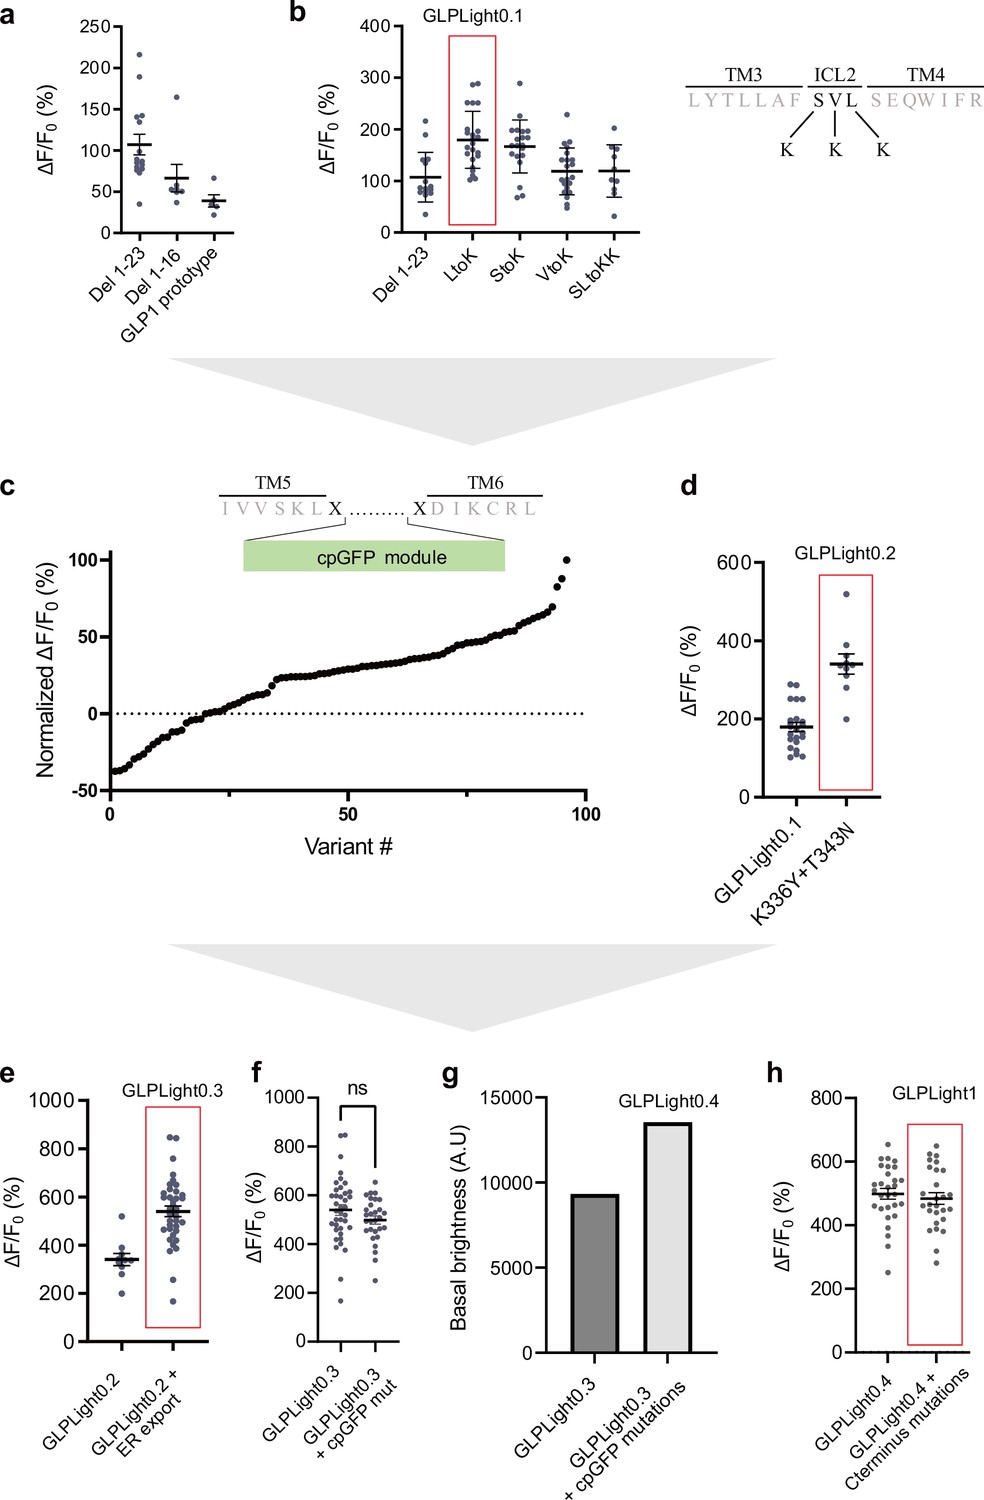
Screening process for the development of GLPLight1.
(a) Maximal fluorescence response to 10 μM glucagon-like peptide-1 (GLP-1) of the prototype GLP-1 sensor and the N-terminus deletion variants (16 or 23 first amino acids). (b) Maximal fluorescence response to 10 μM GLP-1 of the ICL2 lysine variants compared to GLP-1 sensor prototype with deletion of the first 23 amino acids. The variant with the best response containing the mutation L260K was named GLPLight0.1. The top-right insert depicts the site that were mutated on the sensor’s ICL2 in black letters. (c) Overview of the randomized screening of residues K336 and T343 on GLPLight0.1 backbone after addition of 10 μM GLP-1. The data were normalized to the variant showing the highest response. The two randomized residues are shown above in the diagram as the black letters: x. (d) Comparison of the maximal response to 10 μM GLP-1 of GLPLight0.1 to the best variant from (c), subsequently called GLPLight0.2. (e) Comparison of the maximal response to 10 μM GLP-1 of GLPLight0.2 constructs with or without addition of an ER export sequence at the C-terminus. The construct containing the ER export sequence was called GLPLight0.3. (f) Comparison of the maximal response to 10 μM GLP-1 of GLPLight0.3 with or without the cpGFP mutations as well as their basal brightness in (g). The construct containing the mutations was called GLPLight0.4. (h) Comparison of the maximal response to 10 μM GLP-1 of GLPLight0.4 with or without the alanine mutations of the C-terminal phosphorylation sites. The final version of the sensor was called GLPLight1. All data were acquired in HEK293T cells with multiple repeats shown as mean ± SEM.
-
Figure 1—figure supplement 1—source data 1
Screening process for the development of GLPLight1.
- https://cdn.elifesciences.org/articles/86628/elife-86628-fig1-figsupp1-data1-v1.xlsx
Figure 1—figure supplement 2
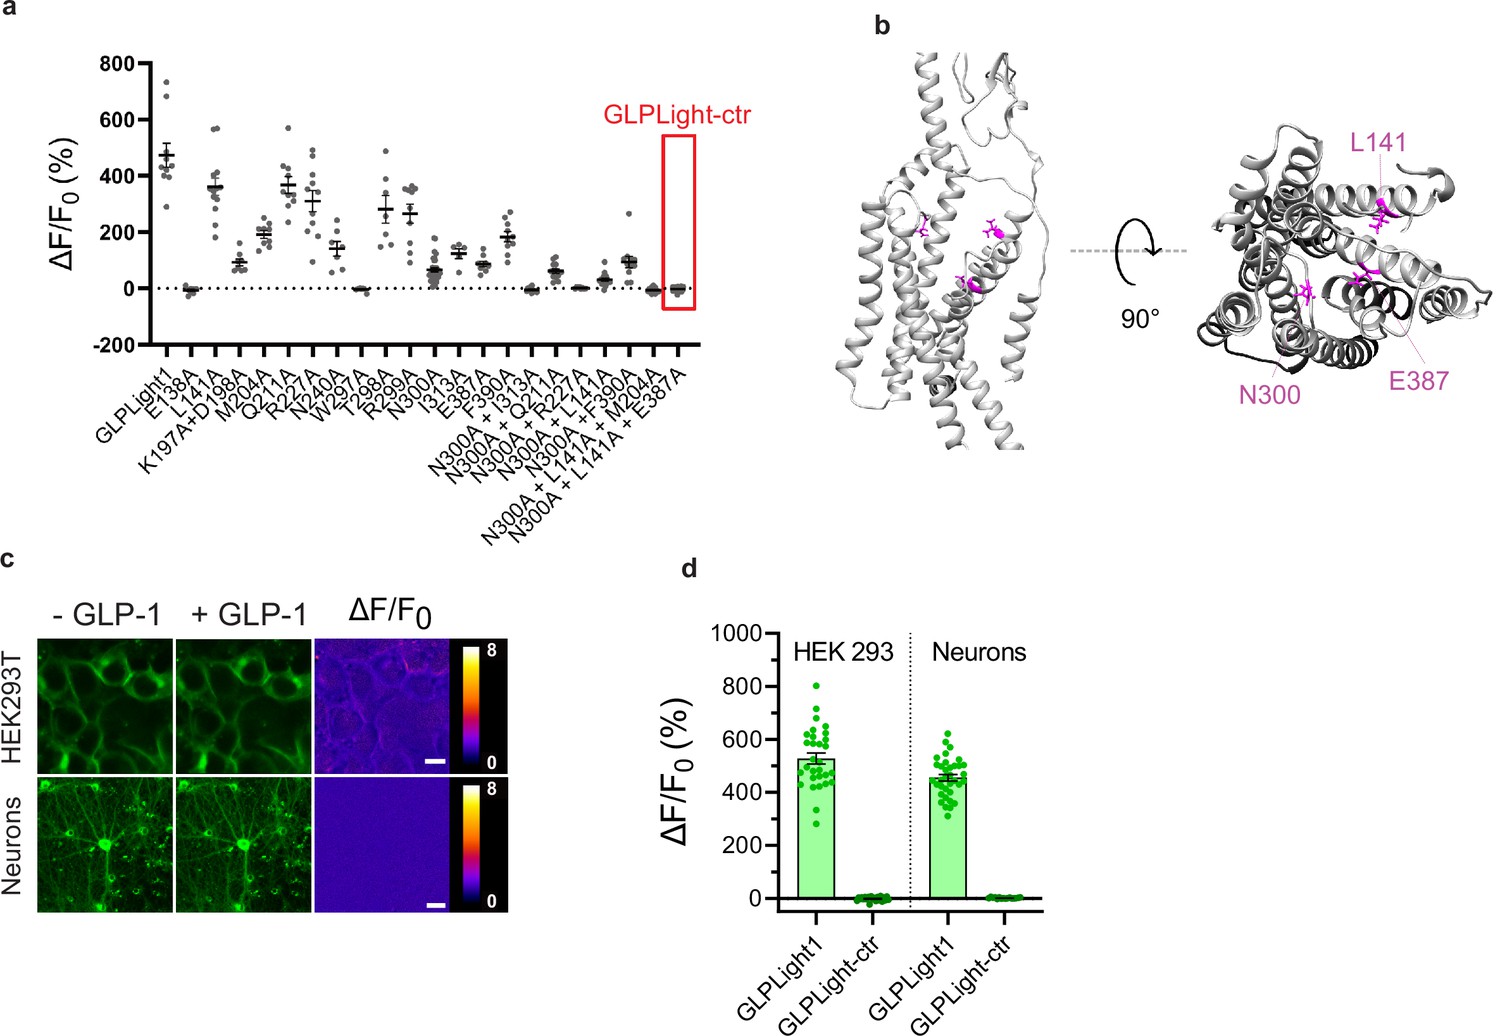
Development of the control sensor GLPLight-ctr.
(a) Maximal response of GLPLight1 binding pocket variants to 1 μM glucagon-like peptide-1 (GLP-1) (7–37). (b) Structural model of GLPLight-ctr shown from the side (left) or top (right) perspective. The residues mutated to alanine compared to GLPLight1 are shown in magenta. (c) Representative images from GLPLight-ctr expression and fluorescence intensity change before (left) and after (center) addition of 10 μM GLP-1 (7–37) as well as the respective pixel-wise ΔF/F0 images in HEK293T cells (top) and primary cortical neurons (bottom). Scale bars: 10 μm for HEK cells and 20 μm for neurons. (d) Maximal response of either GLPLight1 or GLPLight-ctr in HEK293T cells and primary cortical neurons after addition of 10 μM GLP-1 (7–37). All data shown as mean ± SEM.
-
Figure 1—figure supplement 2—source data 1
Development of the control sensor GLPLight-ctr.
- https://cdn.elifesciences.org/articles/86628/elife-86628-fig1-figsupp2-data1-v1.xlsx
Figure 1—figure supplement 3
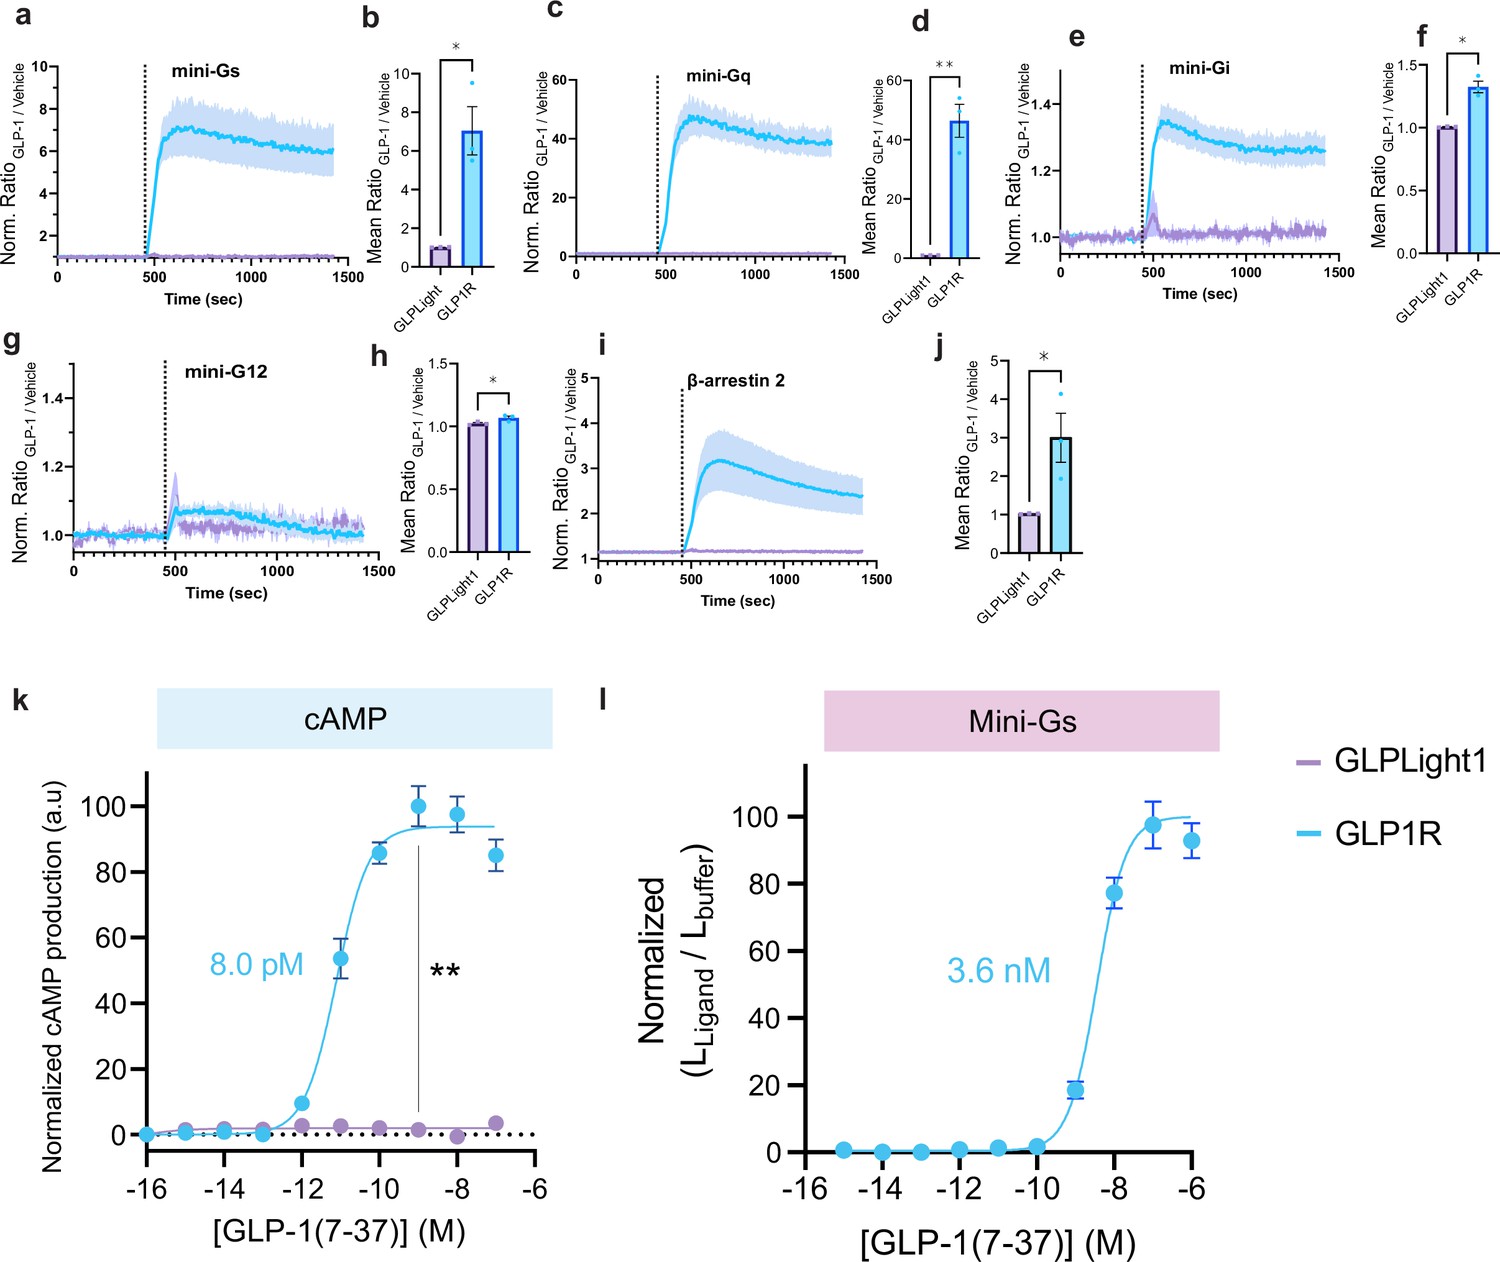
Intracellular signaling characterization of glucagon-like peptide-1 receptor (GLP1R) and GLPLight1.
Normalized timelapse recording of agonist-induced miniG protein or β-arrestin recruitment in GLP1R or GLPLight1 expressing HEK293T cells along with quantification of the mean signal between t=600–700 s for miniGs in (a–b), miniGq in (c–d), miniGi in (e–f), miniG12 in (g–h), and β-arrestin-2 in (i–j). The dashed line corresponds to the addition of 100 nM glucagon-like peptide-1 (GLP-1) (7–37). One-tailed unpaired t-test with Welch’s correction, miniGs: p=0,0202; miniGq: p=0,0074; miniGi: p=0,0102; miniG12: p=0,0356, and β-arrestin-2: p=0,0452. (k) Titration of GLP-1-induced intracellular cyclic-AMP (cAMP) in HEK293T cells co-expressing GLO20F cAMP sensor and GLP1R or GLPLight1. The data were normalized to the maximum signal observed for GLP1R. Unpaired two-tailed t-test with Welch’s correction for both constructs after 100 nM GLP-1. p=0,0041. (l) Titration of GLP-1 on miniGs-recruitment assay in GLP1R expressing HEK293T cells. The curve fit was performed using a four-parameter non-linear fit and the EC50 value is shown next to the trace. All data obtained from three independent experiments and shown as mean ± SEM.
-
Figure 1—figure supplement 3—source data 1
Intracellular signaling characterization of glucagon-like peptide-1 receptor (GLP1R) and GLPLight1.
- https://cdn.elifesciences.org/articles/86628/elife-86628-fig1-figsupp3-data1-v1.xlsx
Figure 2 with 1 supplement
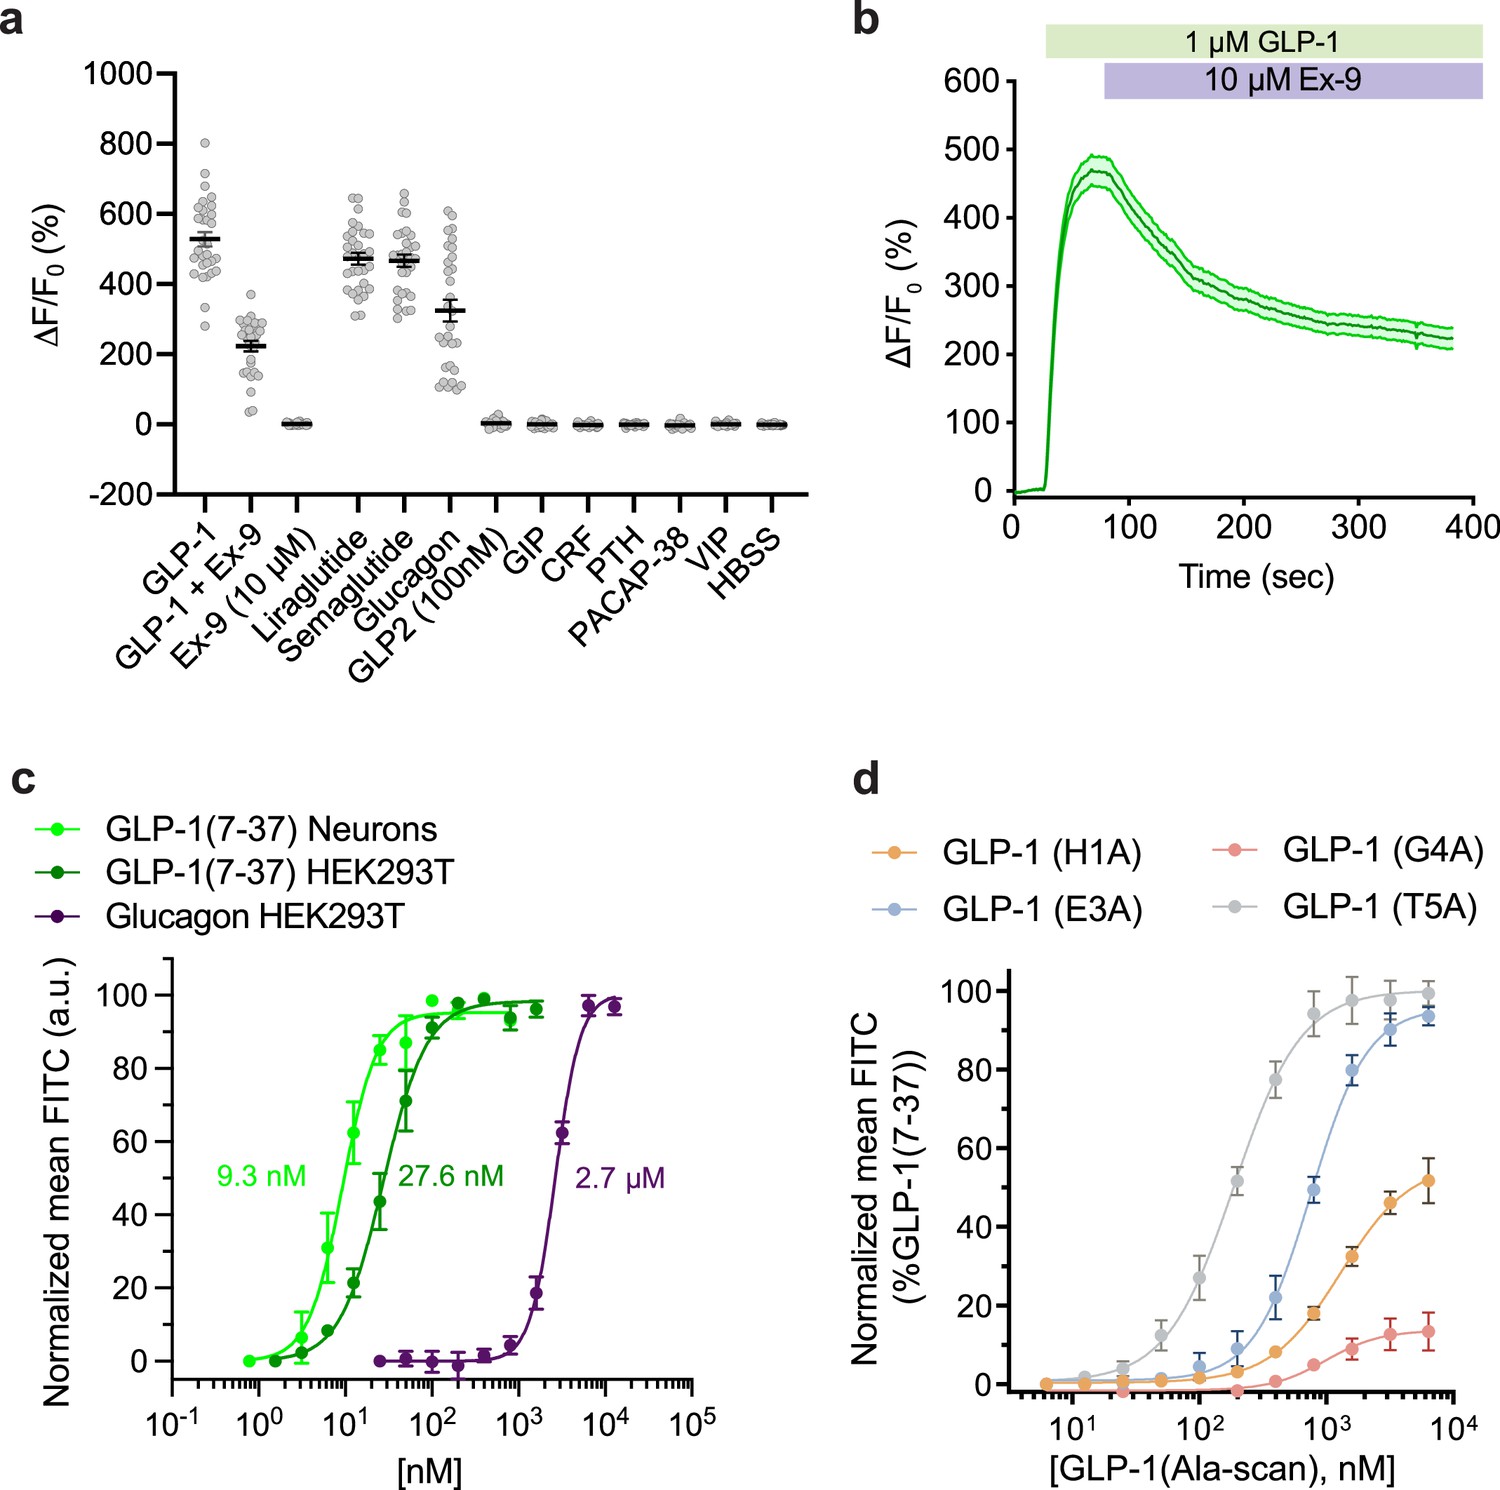
Pharmacological characterization of GLPLight1.
(a) Absolute ΔF/F0 responses of GLPLight1 expressing HEK293T cells to various glucagon-like peptide-1 (GLP-1) agonists, antagonist, or to other class B1 neuropeptide ligands applied at 1 μM final (unless stated otherwise). n=30 cells from three independent experiments for all conditions. (b) ΔF/F0 responses from timelapse imaging experiments in which 1 μM GLP-1 and 10 μM exendin-9 (Ex-9, a peptide antagonist of glucagon-like peptide-1 receptor [GLP1R]) were subsequently bath-applied onto GLPLight1-expressing HEK293T cells. n=30 cells from three independent experiments. (c) Normalized dose-response curves showing the fluorescent responses of GLPLight1-expressing HEK293T cells and primary cortical neurons to GLP-1 (dark green and light green, respectively) or GLPLight1-expressing HEK293T cells to glucagon (purple). The curves fit were performed using a four-parameter equation and the mean EC50 values determined are shown next to the traces in the corresponding color. n=3, 6 and 3 independent experiments for GLP-1 (7–37) in neurons, GLP-1 (7–37) and glucagon in HEK293T cells, respectively. (d) Dose-response curves showing the fluorescent responses of GLPLight1-expressing HEK293T cells to alanine mutants of the GLP-1 peptide normalized to the maximum mean fluorescence response (FITC intensity) obtained for the WT GLP-1 peptide. n=3 independent experiments for each peptide. All data are displayed as mean ± SEM.
-
Figure 2—source data 1
Pharmacological characterization of GLPLight1.
- https://cdn.elifesciences.org/articles/86628/elife-86628-fig2-data1-v1.xlsx
Figure 2—figure supplement 1
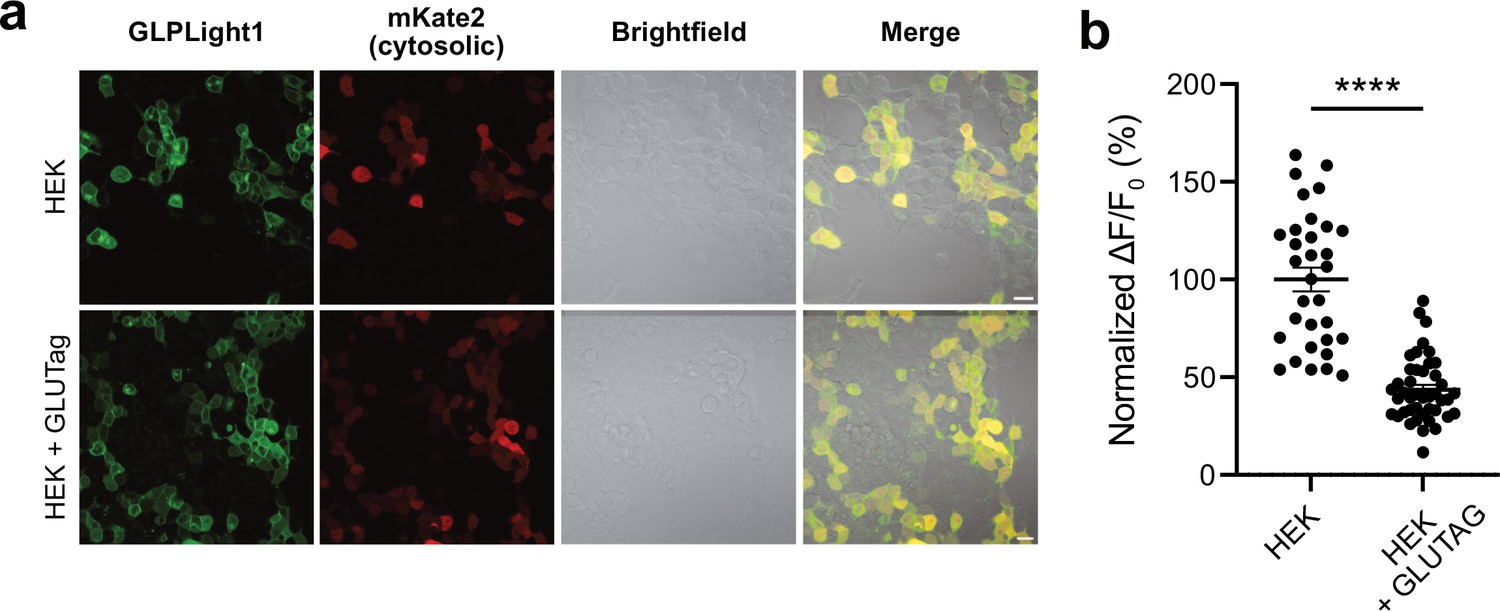
Detecting endogenous glucagon-like peptide-1 (GLP-1) release from enterocrine cells using GLPLight1.
(a) Representative fluorescence and brightfield images of HEK293T co-transfected with GLPLight1 and cytosolic mKate2 cultured overnight in the absence (top row) or presence (bottom row) of GLUTag cells. (b) Fluorescence response of GLPLight1 expressing HEK cells cultured with (right) or without (left) GLUTag cells. The data were normalized to the average response of GLPLight1 from the HEK cells only population. Statistical analysis was done using a two-tailed unpaired t-test, ****p=3.399 × 10⁻¹⁴; n=32 and 43 cells from three independent experiments for HEK cells only or HEK+GLUTag cells, respectively. All data shown as mean ± SEM.
-
Figure 2—figure supplement 1—source data 1
Detecting endogenous glucagon-like peptide-1 (GLP-1) release from enterocrine cells using GLPLight1.
- https://cdn.elifesciences.org/articles/86628/elife-86628-fig2-figsupp1-data1-v1.xlsx
Figure 3 with 2 supplements
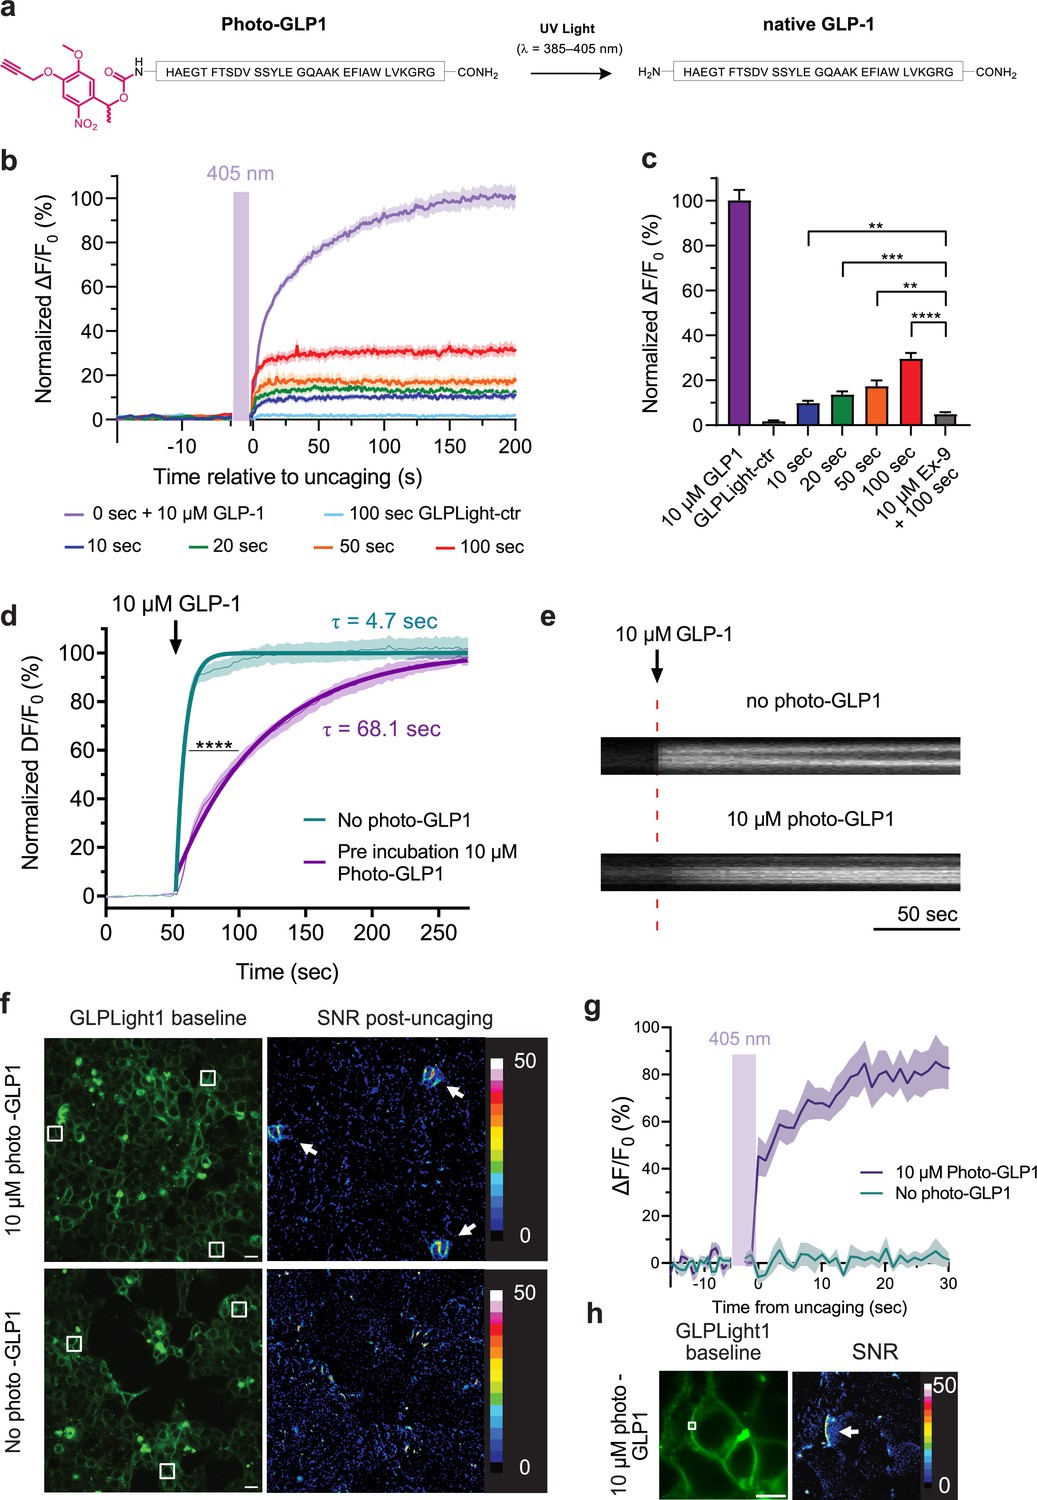
All-optical visualization and control of human glucagon-like peptide-1 receptor (GLP1R) activation.
(a) Schematic representation of the N-terminal chemical caging strategy used to generate photocaged glucagon-like peptide-1 derivative (photo-GLP1). The peptide product (native GLP-1) after optical uncaging is shown. (b) Timelapses of fluorescence response for GLPLight1 or GLPLight-ctr expressing HEK293T cells before and after optical uncaging (purple vertical bar, 405 nm laser, scanning rate of 0.8 Hz and variable durations as specified below the graph). The values were normalized to the maximal response of GLPLight1 between t=150 and 200 s to 10 μM GLP-1 (purple trace). In all cases, cells were pre-incubated for 1–2 min with 10 μM photo-GLP1 before imaging and optical uncaging started. All fluorescent signals were analyzed within 20 μm distance from the uncaging area. n=11–19 cells from three independent experiments. (c) Quantification of the normalized average fluorescence from (b) between t=25–75 s for uncaging experiments and t=150–200 s for GLP-1 application experiments. All uncaging experiments on GLPLight1 were compared to the one with pre-incubation with exendin-9 (Ex-9, see Figure 3—figure supplement 2) using Brown-Forsythe ANOVA test followed by Dunnett’s T3 multiple comparison. p=0.0061; 0.0001; 0.0026 and 1293×10–6 for 10, 20, 50, and 100 s uncaging events, respectively. (d) Fluorescence response of GLPLight1-expressing HEL293T cells to 10 μM GLP-1 either after pre-incubation with 10 μM photo-GLP1 (magenta) or in the absence of it (blue). The data were normalized to the maximal response of GLPLight1-expressing cells in the absence of photo-GLP1 and fitted with a non-linear mono exponential fit to determine τ values. Statistical analysis was performed using the extra sum-of-squares F test; ****p<0.0001; n=18 and 17 cells from three independent experiments in the absence or presence of photo-GLP1 respectively. All data are displayed as mean ± SEM. (e) Kymographs of representative cells from (d) showing the fluorescence intensity of a line drawn across a cell membrane over time in the absence (top) or presence (bottom) of photo-GLP1 (10 μM) in the bath. The timepoint of GLP-1 application is shown by the red dotted line. (f) Representative images of multiple uncaging events performed at different locations across the field of view. Images show the basal fluorescence of GLPLight1-expressing HEK cells (left) in the presence (top) or absence (bottom) of 10 μM photo-GLP1, as well as the corresponding pixel-wise heatmap of SNR post-uncaging. Localized functional sensor responses to optical uncaging of photo-GLP1 are indicated by white arrows. Uncaging was performed for a duration of 40 s in total for all the three areas shown as white squares using a scanning rate of 1.5 Hz. Scale bars: 20 μm. (g) Quantification of the timelapse of fluorescence response of GLPLight1 from (f) inside the uncaging areas. (h) Same as (f) but with a sub-cellular localized uncaging region selected on the membrane of a GLPLight1-expressing cell with 1.5 s uncaging duration and a 25 Hz scanning rate. Scale bar 10 μm.
-
Figure 3—source data 1
All-optical visualization and control of human glucagon-like peptide-1 receptor (GLP1R) activation.
- https://cdn.elifesciences.org/articles/86628/elife-86628-fig3-data1-v1.xlsx
Figure 3—figure supplement 1
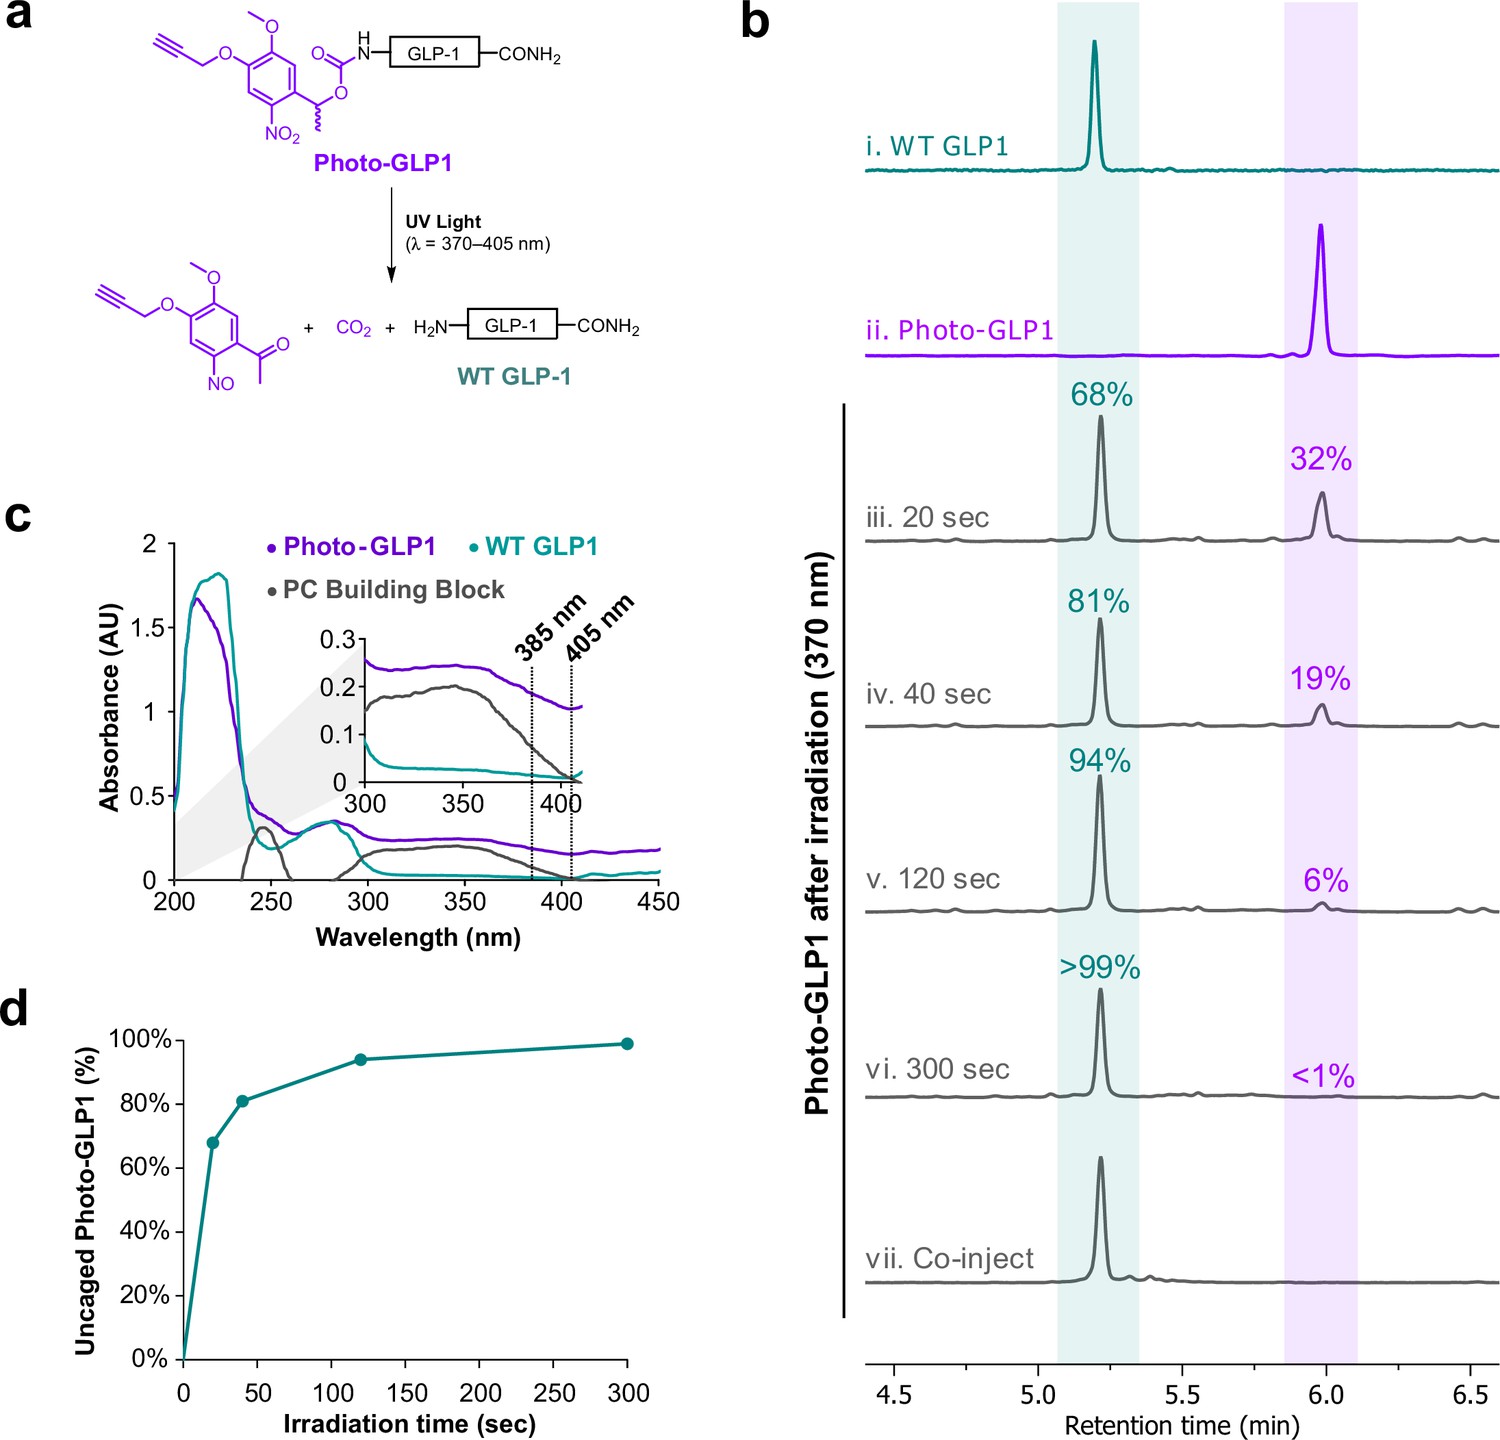
Biochemical characterization of photocaged glucagon-like peptide-1 derivative (photo-GLP1).
(a) Scheme illustrating the uncaging reaction of photo-GLP1 when exposed to UV light at 370–405 nm, producing WT GLP-1. (b) LCMS chromatographic traces of (i) pure WT GLP-1, (ii) pure photo-GLP1, photo-GLP1 after irradiation at 370 nm for (iii) 20 s, (iv) 40 s, (v) 120 s, (vi) 300 s, and (vii) co-injection of photo-GLP1 after irradiation for 300 s (50 µL, 80 µM) with pure WT GLP-1 (50 µL, 80 µM). Chromatographic peaks corresponding to WT GLP-1 are highlighted in blue/green, peaks corresponding to photo-GLP1 are highlighted in purple. (c) UV-Vis spectra (λ=200–450 nm) of photo-GLP1 (purple, 80 µM), WT GLP-1 (blue/green, 80 µM), and α-methyl-5-methoxy-2-nitro-4-(2-propyn-1-yloxy)benzyl alcohol (PC Building Block, gray, 80 µM). All UV-Vis measurements were carried out in HBSS buffer and processed with blank (HBSS buffer) subtraction. (d) Amount of WT GLP-1 produced by irradiation of photo-GLP1 at 370 nm over time. Amount of WT GLP-1 at each timepoint was estimated using area under the curve (AUC) of the corresponding chromatographic peak and given as a percentage of the total AUC value of peaks corresponding to photo-GLP1 and WT GLP-1.
-
Figure 3—figure supplement 1—source data 1
Biochemical characterization of photocaged glucagon-like peptide-1 derivative (photo-GLP1).
- https://cdn.elifesciences.org/articles/86628/elife-86628-fig3-figsupp1-data1-v1.xlsx
Figure 3—figure supplement 2
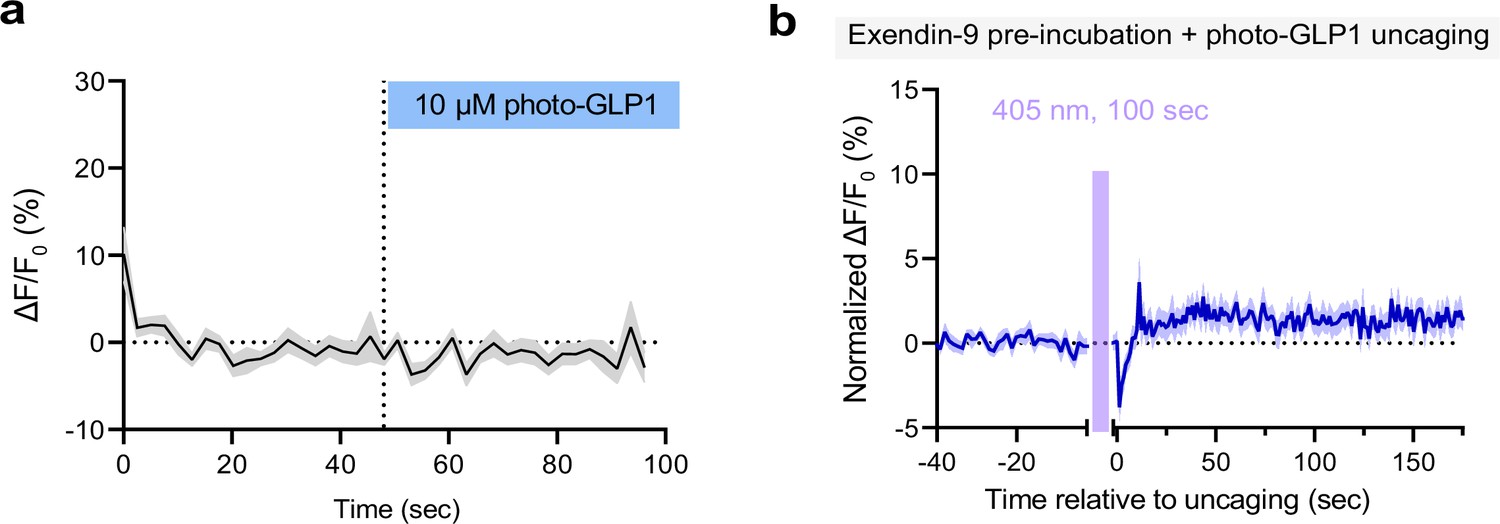
Further characterization of photocaged glucagon-like peptide-1 derivative (photo-GLP1) uncaging.
(a) Fluorescence response (ΔF/F0) of GLPLight1-expressing HEK293T cells after bolus addition of 10 μM photo-GLP1. The time of addition is represented by the blue rectangle above; n=16 cells. (b) Fluorescence response of GLPLight1-expressing HEK293T cells normalized to the maximal response to 10 μM WT GLP-1 after 2 min pre-incubation with a mix of 10 μM exendin-9+10 μM photo-GLP1 and following optical uncaging for 100 s with a 405 nm laser (represented by the magenta shaded area); n=17 cells. All data shown as mean ± SEM and acquired from three independent experiments.
-
Figure 3—figure supplement 2—source data 1
Further characterization of photocaged glucagon-like peptide-1 derivative (photo-GLP1) uncaging.
- https://cdn.elifesciences.org/articles/86628/elife-86628-fig3-figsupp2-data1-v1.xlsx
Figure 4 with 1 supplement
Effect of photocaged glucagon-like peptide-1 derivative (photo-GLP1) uncaging on intracellular signaling.
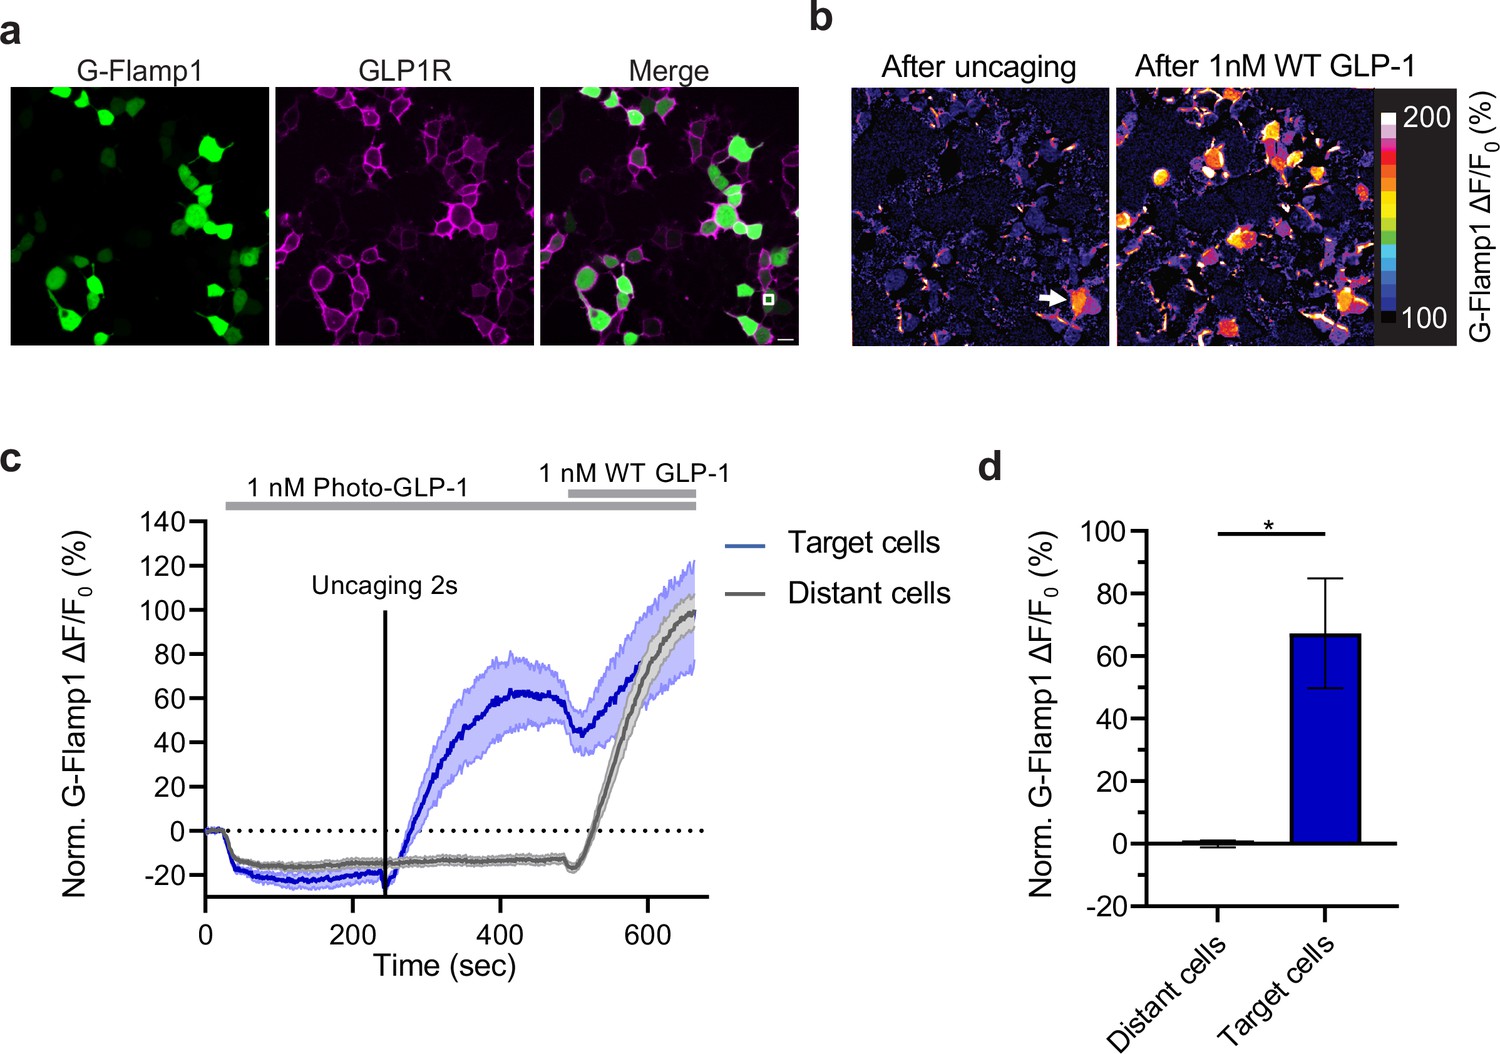
(a) Representative images of HEK293T cells used in (c,d). Human glucagon-like peptide-1 receptor (hmGLP1R) expression was visualized using an Alexa-647-conjugated anti-FLAG antibody. The uncaging region is represented by the white square in the lower right area. (b) Representative images from the pixel-wise fluorescence response from G-Flamp1 after uncaging (left) and bath application of 1 nM WT GLP-1 (right). The white arrow indicates the localized area of uncaging. (c) Fluorescence change during timelapse imaging of G-Flamp1/GLP1R co-expressing cells after addition of 1 nM photo-GLP1 and localized uncaging (405 nm, 2 s, and 32 Hz scanning rate), followed by bath application of 1 nM WT GLP-1. The timepoints of ligand addition are represented using gray rectangles and the uncaging bout by the vertical black line. Quantification of the fluorescence response is shown separately for ‘target cells’ (blue, cells within the uncaging area) and for ‘distant cells’ (gray, cells positioned at least 10 μm away from the uncaging area). The fluorescent responses from G-Flamp1 were normalized to the maximal activation after addition of WT GLP-1. (d) Quantification from the average normalized fluorescence in (c) between t=400 and t=450 s using the 10 frames before uncaging as a baseline for each condition. n=3 ‘target cells’ and 15 ‘distant cells’ from three independent experiments. *p=0.03061 using a one-tailed Student’s t-test with Welch’s correction. All scale bars: 20 μm and all data displayed as mean ± SEM.
-
Figure 4—source data 1
Effect of photocaged glucagon-like peptide-1 derivative (photo-GLP1) uncaging on intracellular signaling.
- https://cdn.elifesciences.org/articles/86628/elife-86628-fig4-data1-v1.xlsx
Figure 4—figure supplement 1
Control experiment for intracellular signaling characterization.
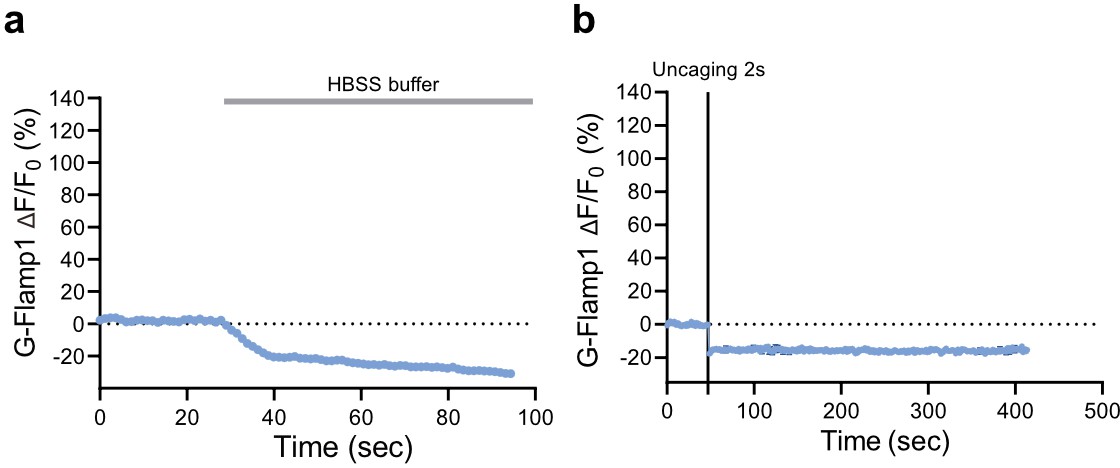
(a) Timelapse imaging of G-Flamp1 response in HEK293T cells co-expressing glucagon-like peptide-1 receptor (GLP1R) after addition of HBSS buffer (used for imaging and dilution of the ligands). The timepoint of buffer addition is indicated by the gray rectangle above. n=15 cells from three independent experiments. (b) Timelapse imaging of G-Flamp1 response in HEK293T cells co-expressing GLP1R after 2 s photo-activation (represented by the black vertical line) in the absence of photo-GLP1. n=3 cells from three independent experiments. All data shown as mean ± SEM.
-
Figure 4—figure supplement 1—source data 1
Control experiment for intracellular signaling characterization.
- https://cdn.elifesciences.org/articles/86628/elife-86628-fig4-figsupp1-data1-v1.xlsx
Tables
Table 1
Titration parameters of alanine scanned variants of glucagon-like peptide-1 (GLP-1) peptide.
The Emax and pEC50 values were derived from the four-parameter non-linear fit for each peptide and the EC50 shift by comparison against WT GLP-1 peptide measured alongside.
| Entry | GLP-1 variant | Emax (% WT GLP-1) | pEC50 (M) | Fold-reduction EC50 vs. WT GLP-1 |
|---|---|---|---|---|
| a | H1A | 56±4 | 5.89±0.05 | ≈ 63 |
| b | E3A | 96±3 | 6.10±0.03 | ≈ 37 |
| c | G4A | 14±3 | 6.00±0.13 | ≈ 48 |
| d | T5A | 100±4 | 6.73±0.04 | ≈ 9 |
| n/a | WT GLP-1 | 100 | 7.69±0.04 | 0 |
Key resources table
| Reagent type (species) or resource | Designation | Source or reference | Identifiers | Additional information |
|---|---|---|---|---|
| Gene (human) | GLP1R | Integrated DNA Technologies | ||
| Strain, strain background (Escherichia coli) | NEB 10-beta Competent E. coli | NEB | C3019 | |
| Commercial assay or kit | NEBuilder HiFi | NEB | E2621 | |
| Recombinant DNA reagent | Pfu-Ultra II Fusion | Agilent | 600387 | |
| Cell line (Mus musculus) | GLUTag enterocrine cell line | Daniel J Drucker (Univ. of Toronto) | ||
| Cell line (Homo sapiens) | Human Embryonic Kidney (HEK293T) | ATCC | CRL-3216 | |
| Antibody | Anti-FLAG-Alexa-647 | M1 (Sigma-Aldrich) In-house conjugated to Alexa-647 (Miriam Stoeber, University of Geneva) | F3040 | IF(1:1000) |
| Chemical compound | Fmoc- and side chain-protected L-amino acids | Bachem AG | ||
| Chemical compound | Piperidine | Chemie Brunschwig AG | 110-89-4 | 99% |
| Chemical compound | O-(7-Azabenzotriazol-1-yl)-N,N,N’,N’-tetramethyluronium hexafluorophosphate (HATU) | Bachem AG | 148893-10-1 | |
| Chemical compound | (7-Azabenzotriazol-1-yloxy)tripyrrolidinophosphonium hexafluorophosphate (PyAOP) | Advanced ChemTech CreoSalus | 156311-83-0 | |
| Chemical compound | N,N-Diisopropylethylamine (DIPEA) | Sigma-Aldrich Chemie GmbH | 7087-68-5 | |
| Chemical compound | Trifluoroacetic acid (TFA) | Sigma-Aldrich Chemie GmbH | 76-05-1 | For HPLC, ≥99.0% |
| Chemical compound | Triisopropylsilane (TIPS) | Sigma-Aldrich Chemie GmbH | 6485-79-6 | 98% |
| Chemical compound | 3,6-Dioxa-1,8-octane-dithiol (DODT) | Sigma-Aldrich Chemie GmbH | 14970-87-7 | 95% |
| Chemical compound | α-Methyl-5-methoxy-2-nitro-4-(2-propyn-1-yloxy)benzyl alcohol | Sigma-Aldrich Chemie GmbH | 1255792-05-2 | |
| Chemical compound | N,N'-Disuccinimidyl carbonate (DSC) | Sigma-Aldrich Chemie GmbH | 74124-79-1 | |
| Other | NovaPEG Rink Amide resins (0.41 mmol/g and 0.20 mmol/g loading) | Sigma-Aldrich Chemie GmbH | ||
| Other | AldraAmine trapping packets (volume 1000–4000 mL) | Sigma-Aldrich Chemie GmbH |
Additional files
-
Source data 1
Synthesis and Characterization of Building Blocks and Peptides.
- https://cdn.elifesciences.org/articles/86628/elife-86628-data1-v1.pdf
-
MDAR checklist
- https://cdn.elifesciences.org/articles/86628/elife-86628-mdarchecklist1-v1.docx
Download links
A two-part list of links to download the article, or parts of the article, in various formats.
Downloads (link to download the article as PDF)
Open citations (links to open the citations from this article in various online reference manager services)
Cite this article (links to download the citations from this article in formats compatible with various reference manager tools)
Optical tools for visualizing and controlling human GLP-1 receptor activation with high spatiotemporal resolution
eLife 12:RP86628.
https://doi.org/10.7554/eLife.86628.3


