Transcriptomic profiling of tissue environments critical for post-embryonic patterning and morphogenesis of zebrafish skin
- Department of Biology, University of Virginia, United States
- Department of Genome Sciences, University of Washington, United States
- National Human Genome Research Institute, National Institutes of Health, United States
- Department of Cell Biology, University of Virginia, United States
Figures
Figure 1 with 4 supplements
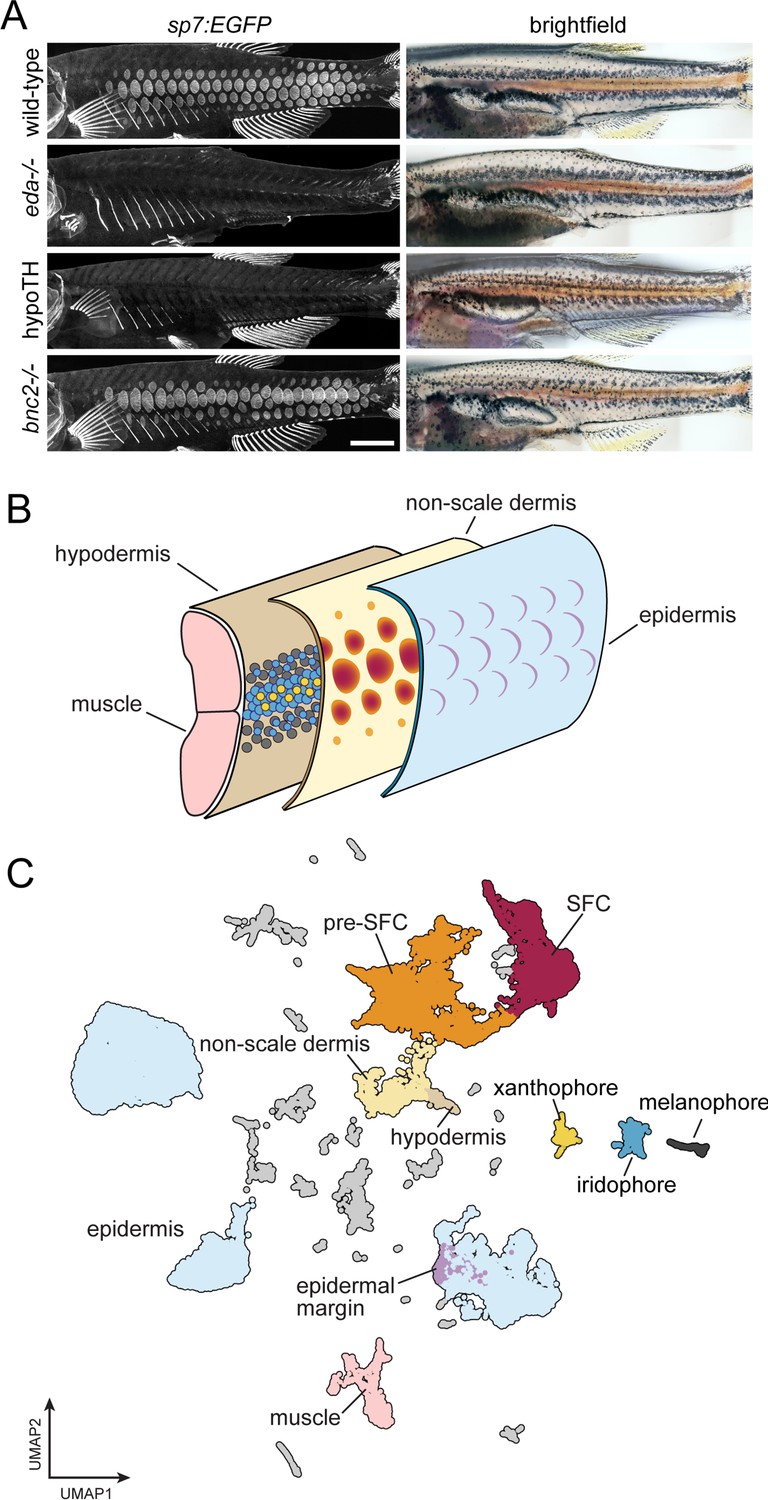
A whole-skin single-cell transcriptome from zebrafish undergoing skin patterning.
(A) Confocal images illustrate scale-forming cells (SFCs) expressing sp7:EGFP, and brightfield images of the same fish show pigment pattern. At 9.2 standardized standard length (SSL), approximately 3 wk post fertilization under standard conditions, wild-type zebrafish have all steps of scale development represented and are developing a pigment pattern of dark stripes, with melanophores and sparse iridophores, alternating with light interstripes of densely packed iridophores and yellow xanthophores. Wild-type individuals of 9.6 SSL having precisely four rows of scales were selected for preparation of nuclei to be used in single-cell indexed RNA-seq (sci-RNA-seq); eda mutants and hypoTH fish, devoid of scales, as well as bnc2 mutants having fewer, dysmorphic scales, were likewise reared to 9.6 SSL for isolation of nuclei. (B) Schematic representation of zebrafish skin at 9.2 SSL. The outermost layer of skin is the epidermis (blue), which develops crescent-shaped placodes (epidermal margin, lavender) above each scale. In the dermis (yellow), SFCs differentiate (orange → red). In the hypodermis (brown), dark melanophores, yellow xanthophores, and iridescent iridophores (gray, yellow, and blue circles, respectively) organize into alternating stripes. (C) UMAP visualization of 35,114 transcriptomes from nuclei of wild-type fish, colored by cell type assignments inferred by marker gene enrichment. Colors correspond to the schematic in (B). Scale bar, 500 mm (A).
Figure 1—figure supplement 1
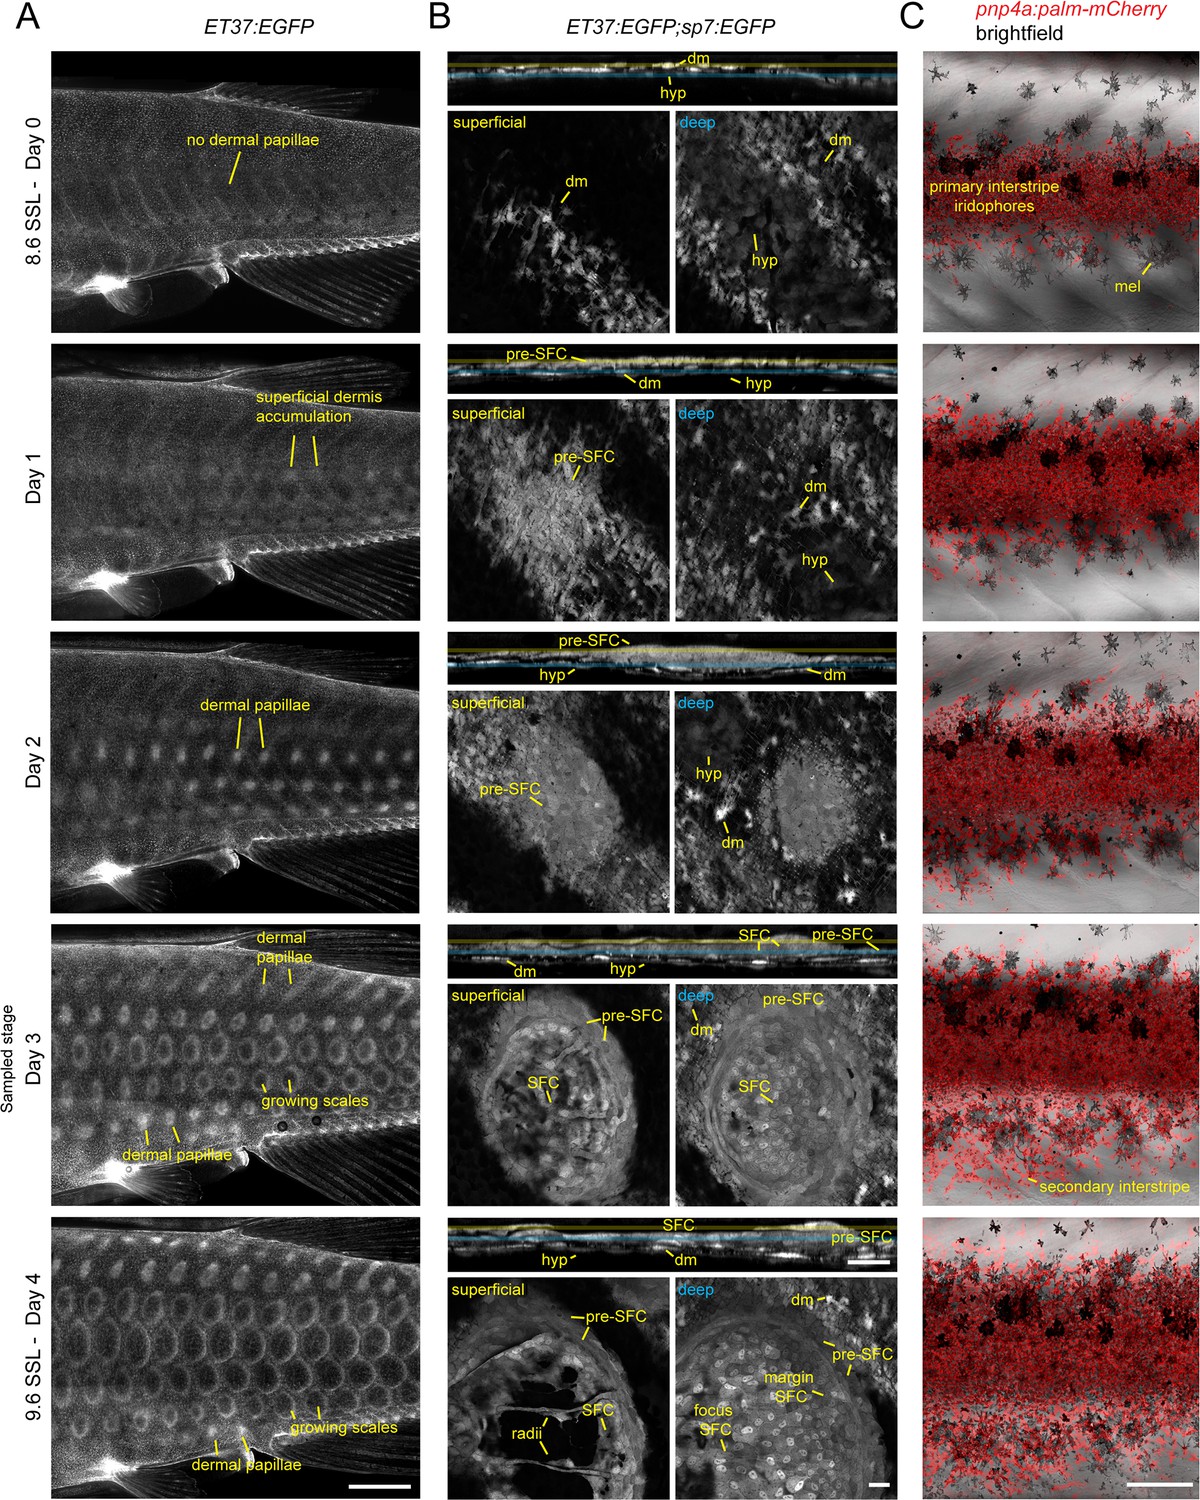
Post-embryonic skin morphogenesis.
(A) Overview of dermal development between 8.6 and 9.6 standardized standard length (SSL), visualized by imaging fish transgenic for ET37:EGFP, which labels most dermal cells (Aman et al., 2021; Parichy et al., 2009). Morphology on day 3 of this series corresponds to the stage at which fish were selected for skin dissection and isolation of nuclei. (B) Development of an individual scale in ET37:EGFP;sp7:EGFP double transgenics. Each timepoint shows an orthogonal projection through the entire dermis above single confocal slices of superficial dermis (yellow) and deep dermis (blue). (C) Stripe and interstripe reiteration occurs during the same timeframe, with secondary interstripe initiation occurring at the sampled stage. Each series was made by repeated imaging of individual specimens. hyp, hypodermis; dm, dermal mesenchyme; mel, melanophore. Scale bars, 1 mm (A), 10 µm (B), 500 µm (C).
Figure 1—figure supplement 2
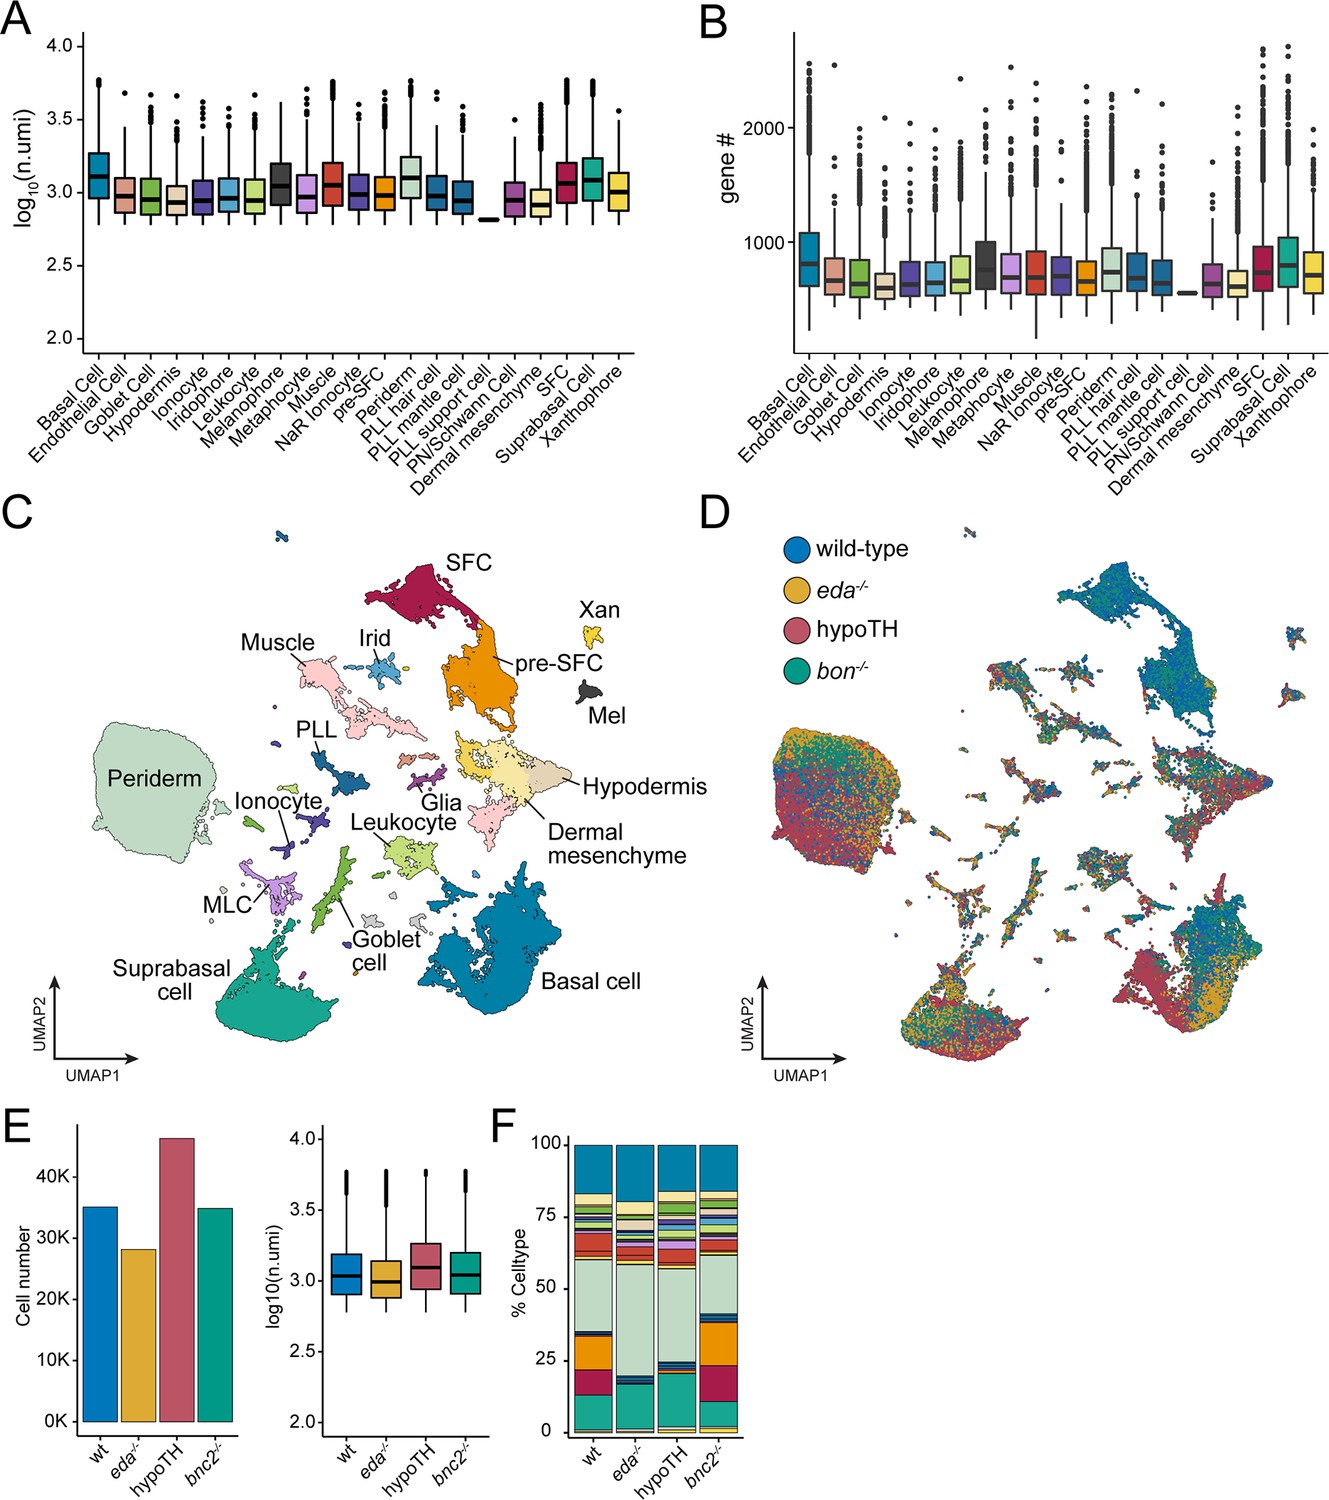
Sci-RNA-seq data quality metrics across backgrounds.
(A, B) Counts of unique molecular identifiers (UMIs) and unique genes expressed across annotated cell types (shown are medians with boxes spanning interquartile ranges; vertical lines indicate farthest observations of data with outlier samples shown individually). (C) UMAP plot with cells from all genetic backgrounds, colored by cell type annotation with major groups labeled (cell n = 144,466). (D) The same UMAP plot as (C) with cells colored by their genetic background of origin (wild-type, eda-/-, hypoTH, and bnc2-/-). (E) Recovered cell counts from each genetic background and boxplots displaying UMI counts across backgrounds. (F) Cell type percentages across backgrounds. Colors correspond to cell types in (C).
Figure 1—figure supplement 3
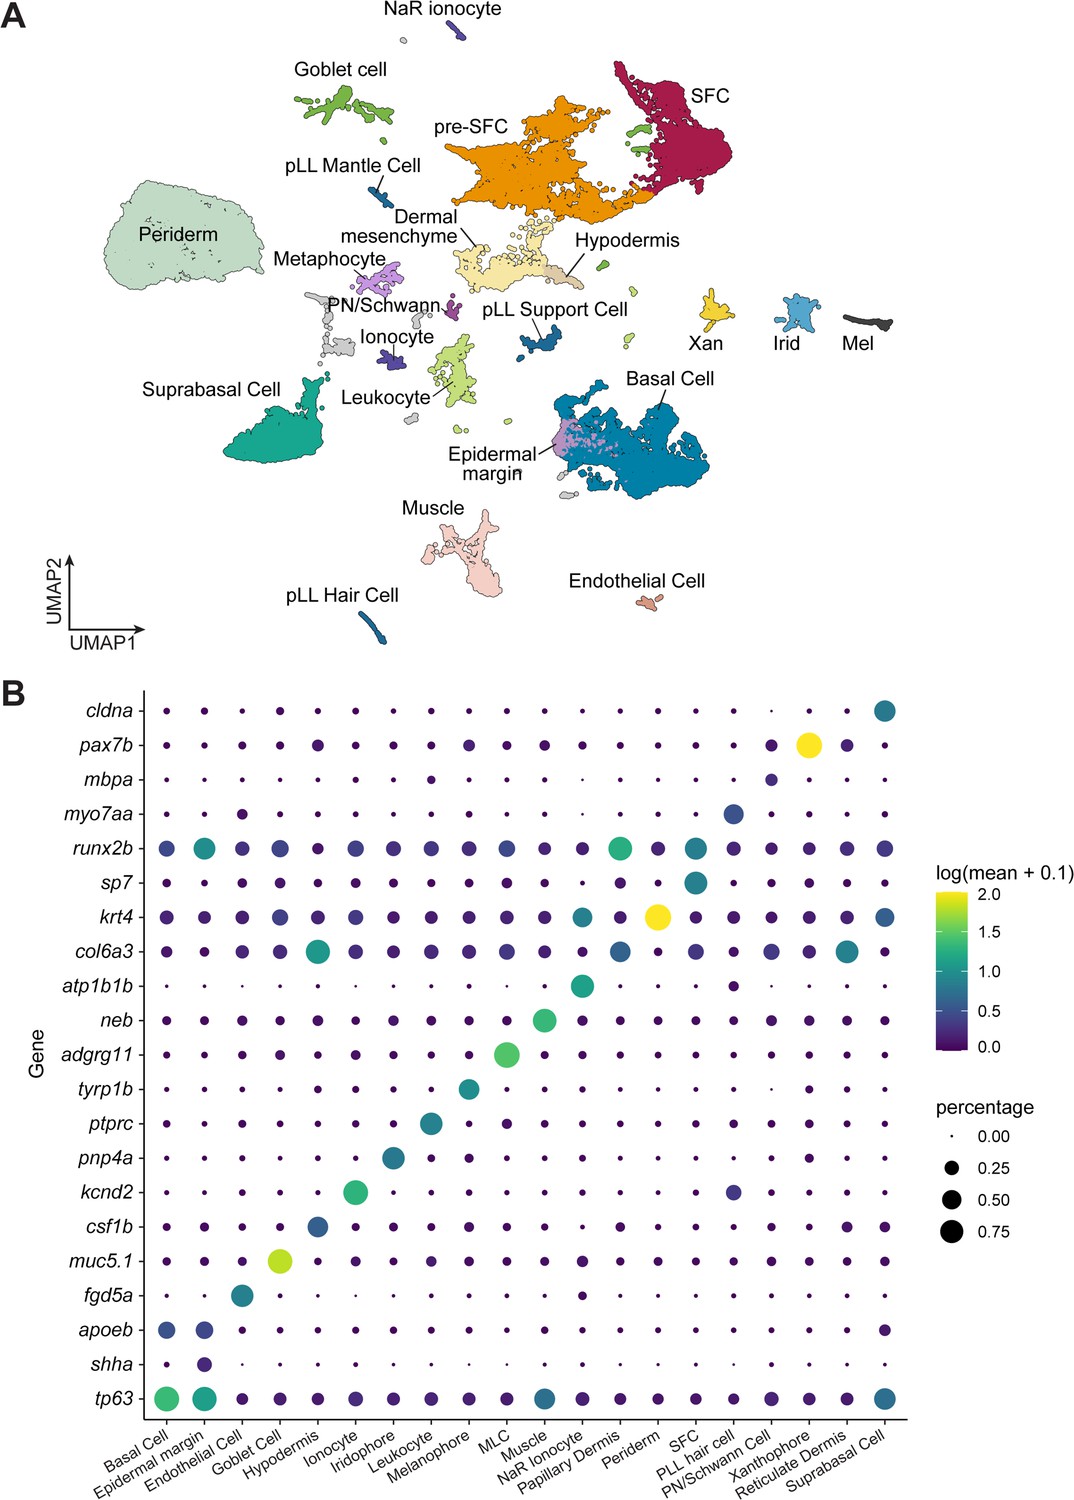
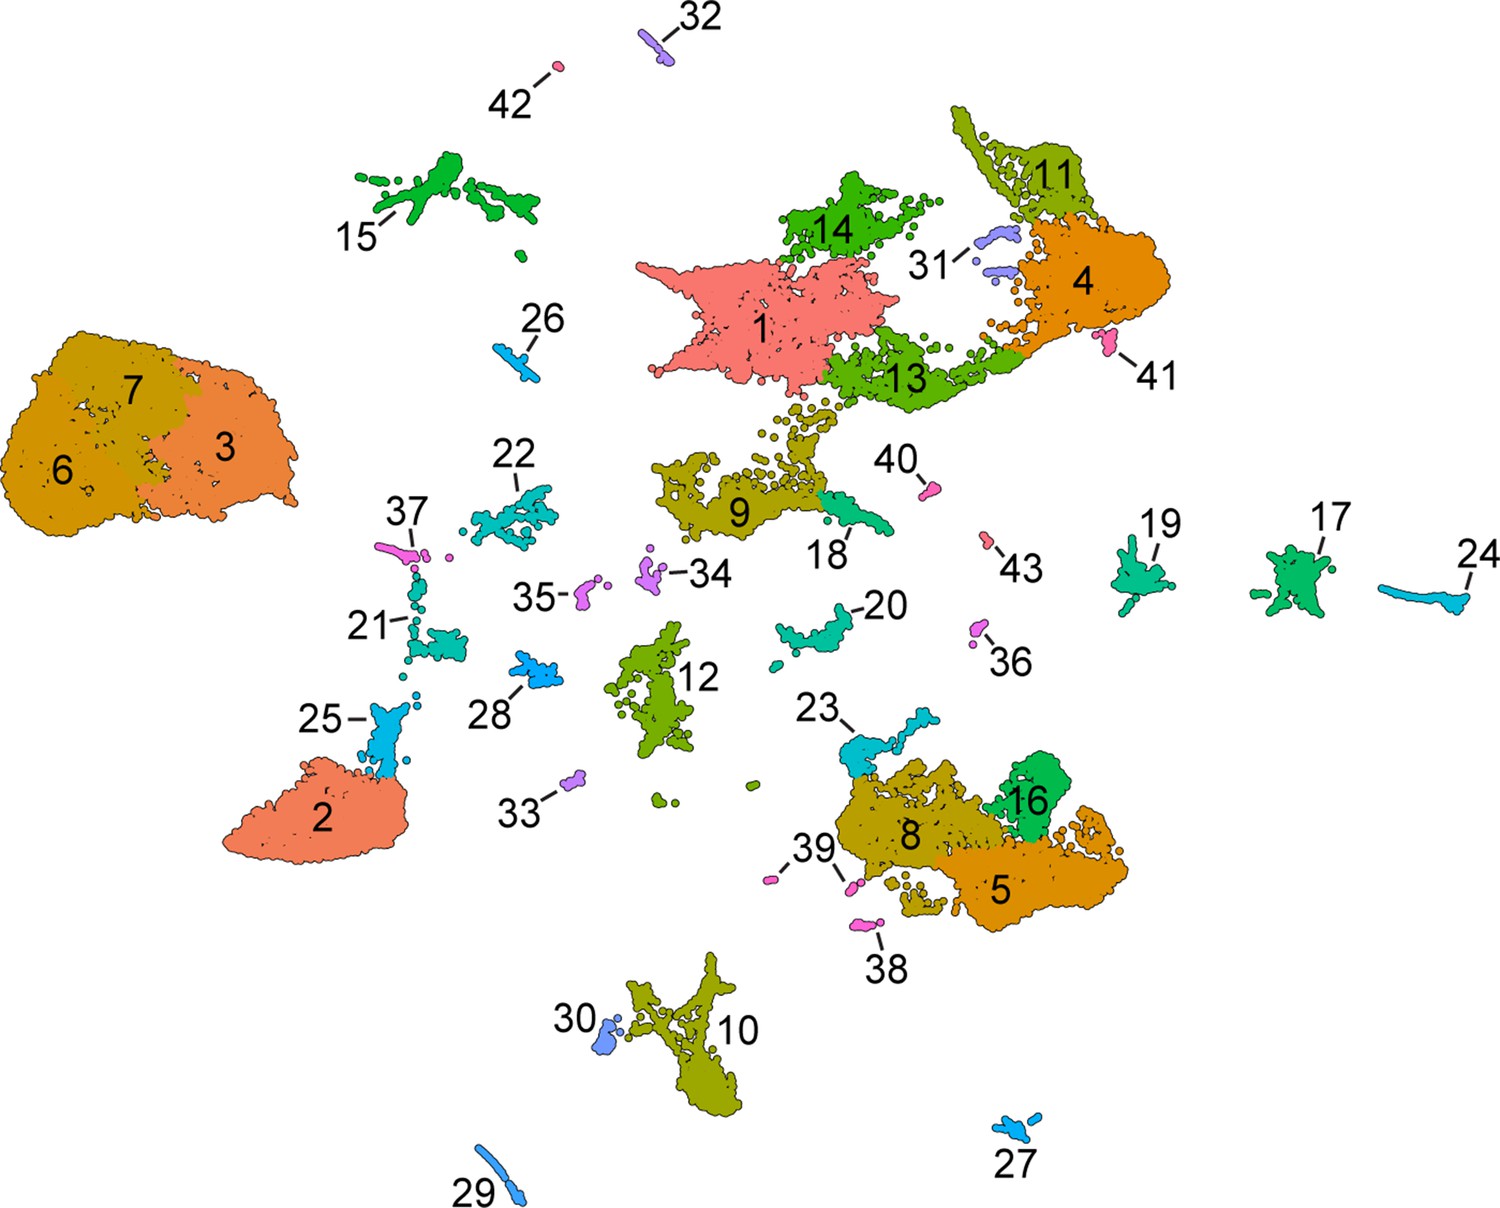
A transcriptome atlas identifies major cell types in post-embryonic skin.
(A) A UMAP plot for wild-type cells, colored and labeled by annotated cell types (cell n = 35,114 cells). (B) Dotplot heatmap displaying known cell type marker genes and new candidate markers.
Figure 1—figure supplement 4
Unsupervised Leiden clustering of wild-type skin cells.
This analysis reveals additional, potentially biologically relevant cell states nested within the cell types annotated by analysis of marker genes.
Figure 2 with 2 supplements
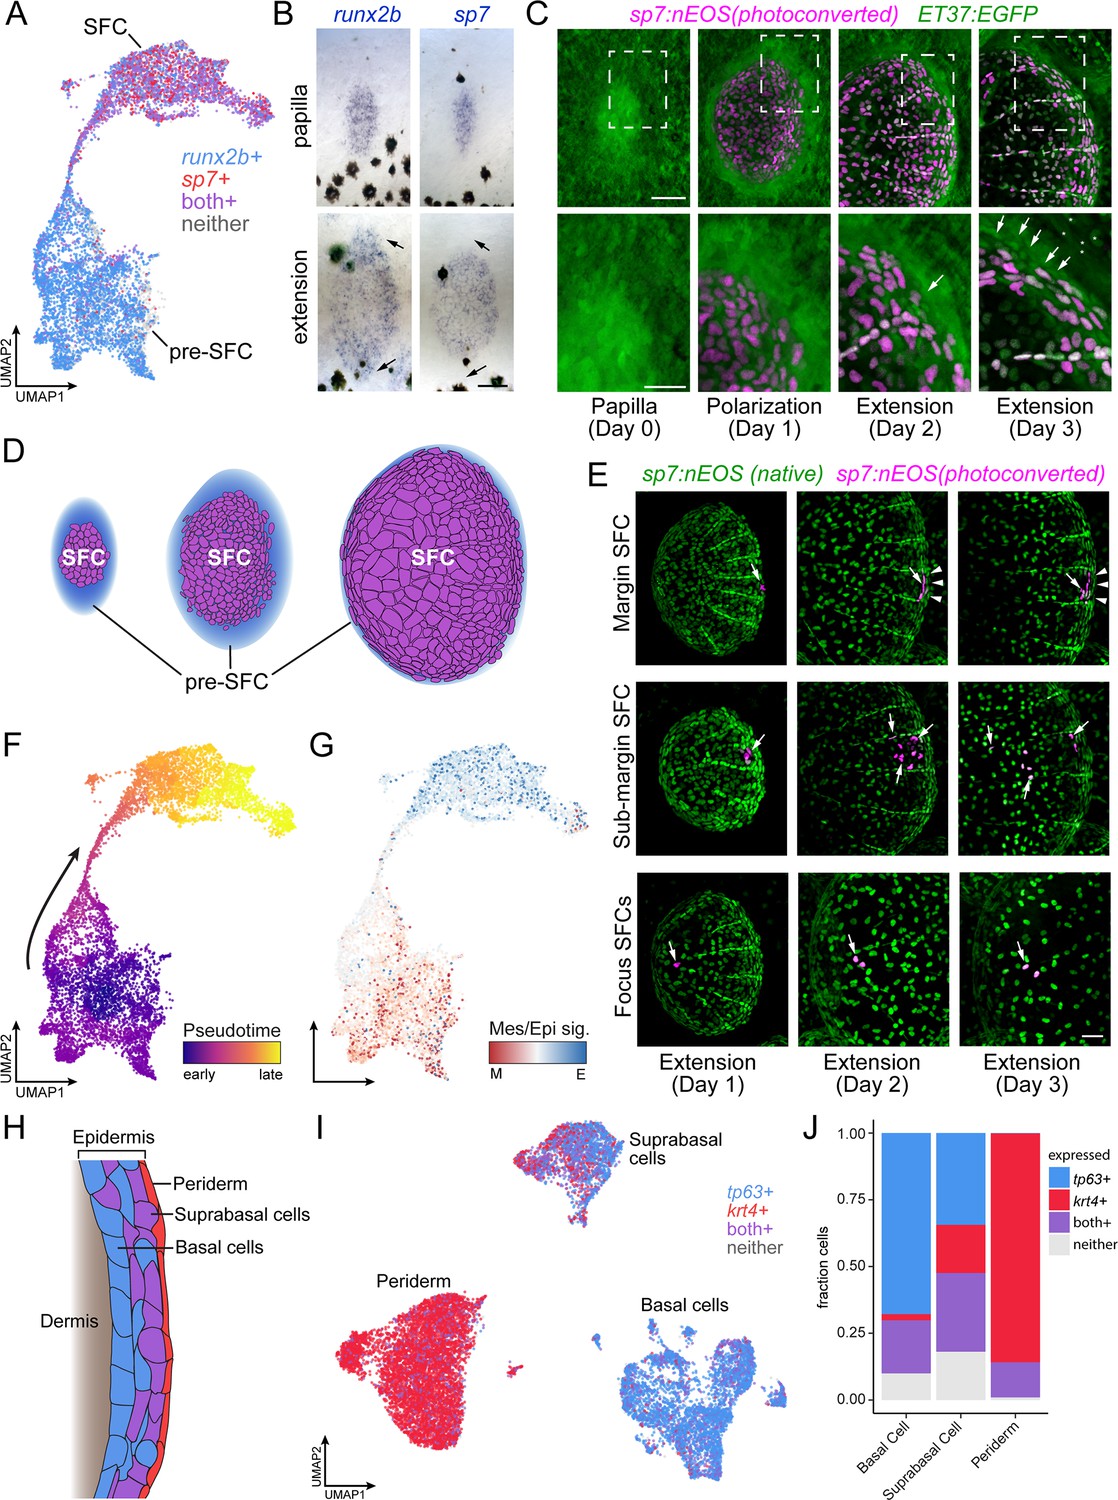
Postembryonic skin cell lineage relationships are not reflected in UMAP space.
(A) UMAP visualization showing distribution of differentiated scale-forming cell (SFC) expressing sp7 and pre-SFC progenitors expressing runx2b. (B) In situ hybridization of sp7 and runx2b shows that a halo of pre-SFC progenitors surround the growing scale (arrows). (C) sp7:nEOS-expressing differentiated SFC (magenta) were labeled by photoconversion on day 1. Over the following 2 d, newly differentiated, un-photoconverted SFC appeared at the scale margin (arrows; n = 5 fish). (D) Schematic representation of differentiated SFC (purple) and the associated halo of pre-SFC (blue). (E) Photoconversion of small groups of SFC in the scale margin and sub-margin; and single-cell photoconversion of focus SFCs (arrows) showed that SFC are progressively displaced toward the scale focus and that SFC in all these regions are capable of cell division (arrows, n ≥ 4 fish for each region tested). Margin SFCs were displaced toward the posterior by newly differentiated, un-photoconverted SFCs (arrowheads). (F) SFCs in UMAP space colored by ‘pseudotime’ rooted in the SFCs. (G) SFCs in UMAP space colored by the ratio of a mesenchymal (migratory) signature to an epithelial signature (Supplementary file 2—Table 3). (H) Schematic representation of epidermis with major substrata. (I) UMAP visualization of wild-type epidermis, subclustered independently of other cell types and displaying expression of the epidermal basal cell marker tp63 (blue) and the periderm marker krt4 (red). (J) The fraction of cells from panel (H) that pass a minimum threshold for expression of tp63, krt4, or both genes. Scale bars, 50 μm (B, C, E); 25 μm, (C, lower).
Figure 2—figure supplement 1
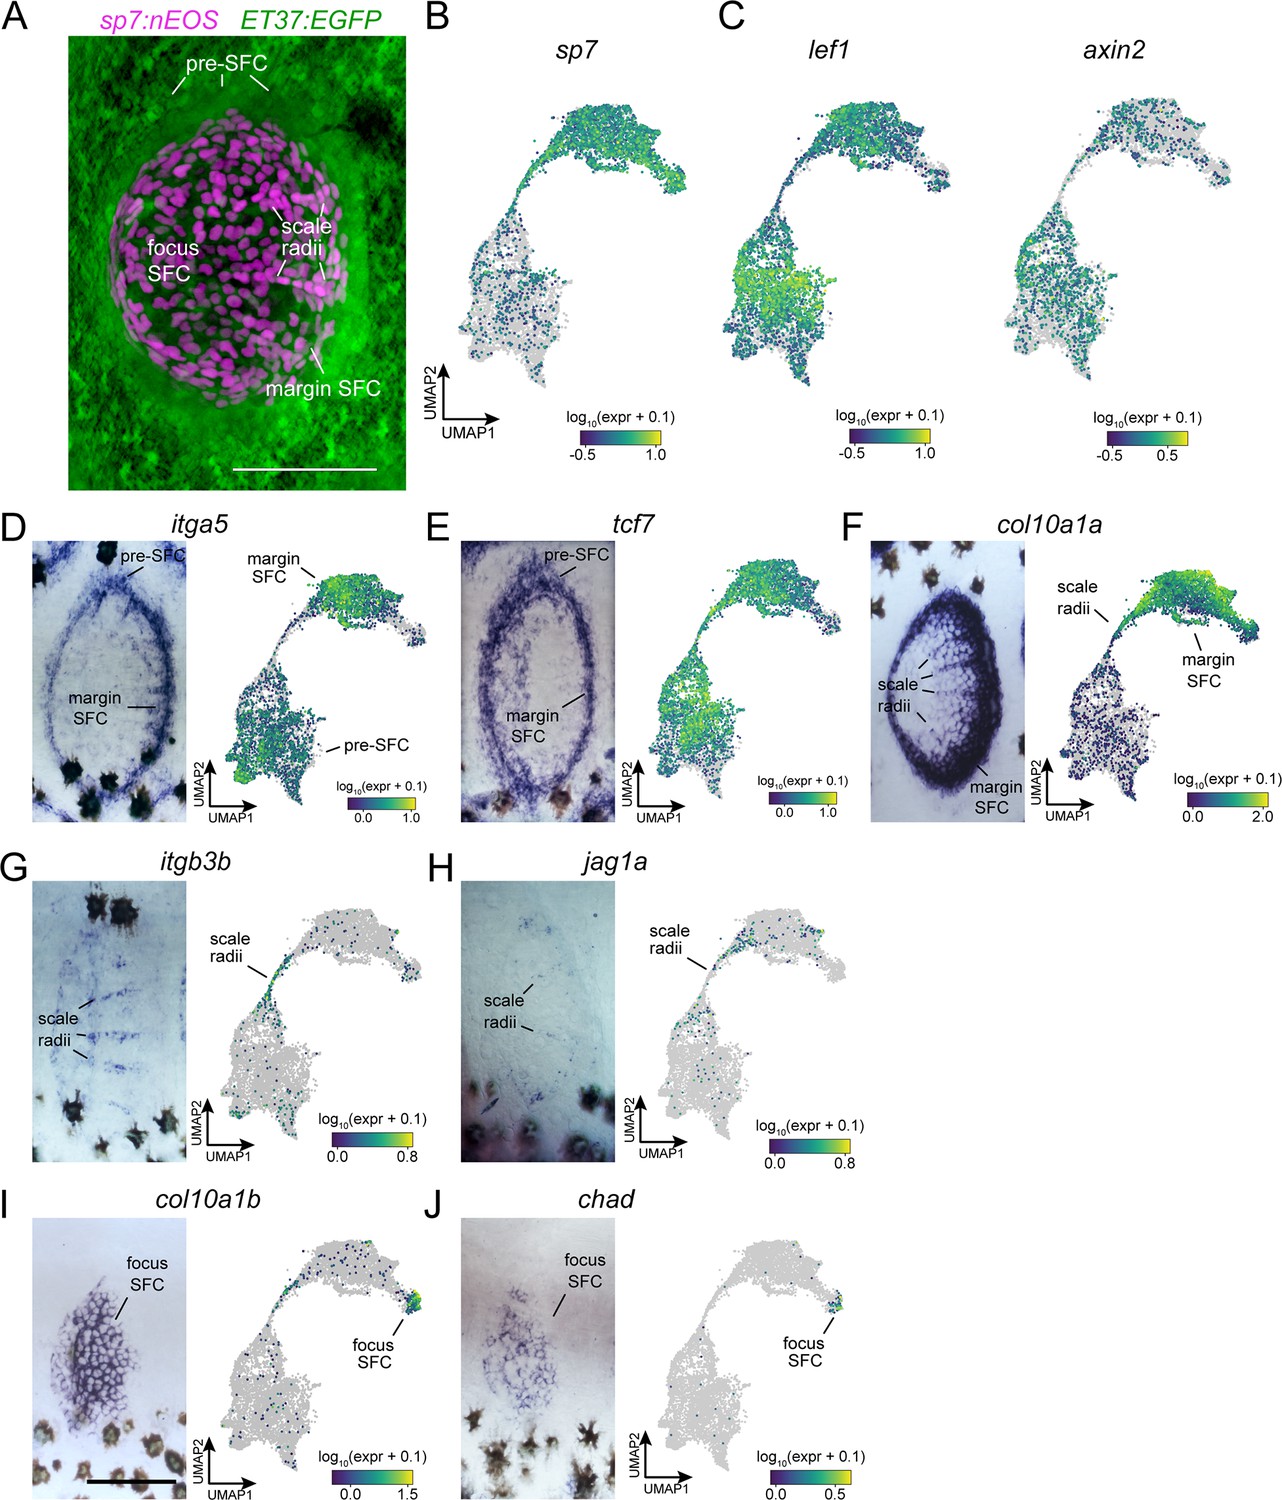
In situ hybridization using probes against specific transcripts localizes heterogeneous scale-forming cell (SFC) in the developing scale.
(A) Live imaging of differentiated SFC expressing sp7:nEOS (green) surrounded by a halo of pre-SFC labeled with ET37:EGFP (magenta). (B) UMAP visualization of sp7+ differentiated SFC and sp7- pre-SFC. (C) UMAP visualization of lef1 and axin2, transcripts localized to pre-SFC and margin SFC in previously published in situ hybridization (Aman et al., 2018). (D, E) itga5 and tcf7 were expressed in pre-SFC and SFC at the scale margin. (F) col10a1a was highly expressed in scale margin SFCs and radii SFCs but not pre-SFCs. (G, H) itgb3b and jag1a localized to radii SFCs. (I, J) col10a1b and chad were expressed predominantly in SFC at the scale focus. Scale bars, 50 μm.
Figure 2—figure supplement 2
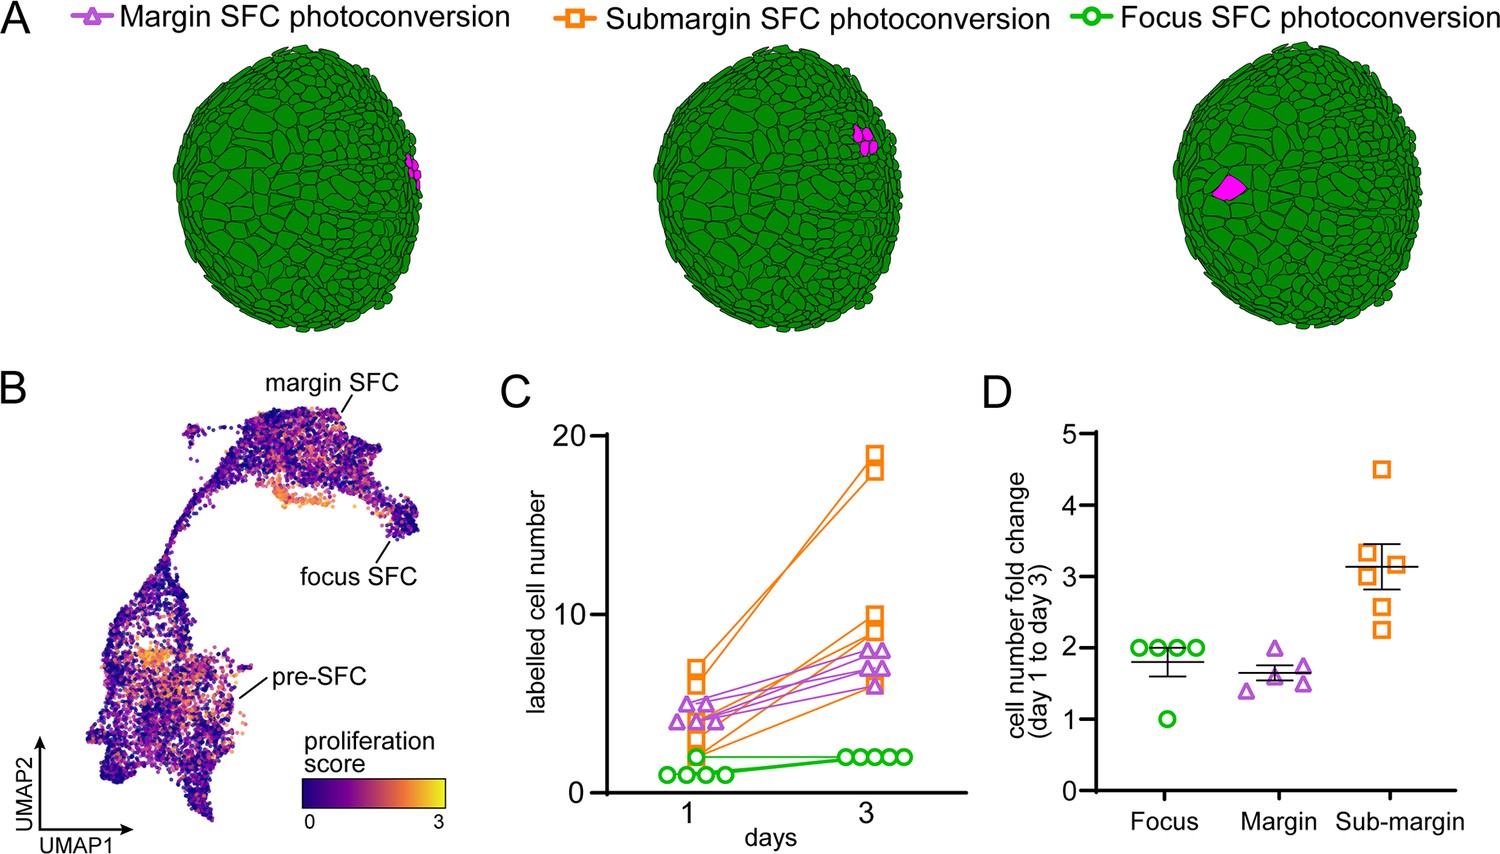
Scale-forming cell (SFC) lineage and proliferation.
(A) Schematic representation of photoconversion experiments in (Figure 3C) showing representative photoconversion regions. (B) UMAP visualization of transcripts associated with high rates of cell proliferation. (C) The number of labeled cells increased in every specimen examined. (D) Fold change of labeled cell number (mean ± SEM) over 2 d of scale growth (margin and submargin, n = 5 each; focus n = 6).
Figure 3
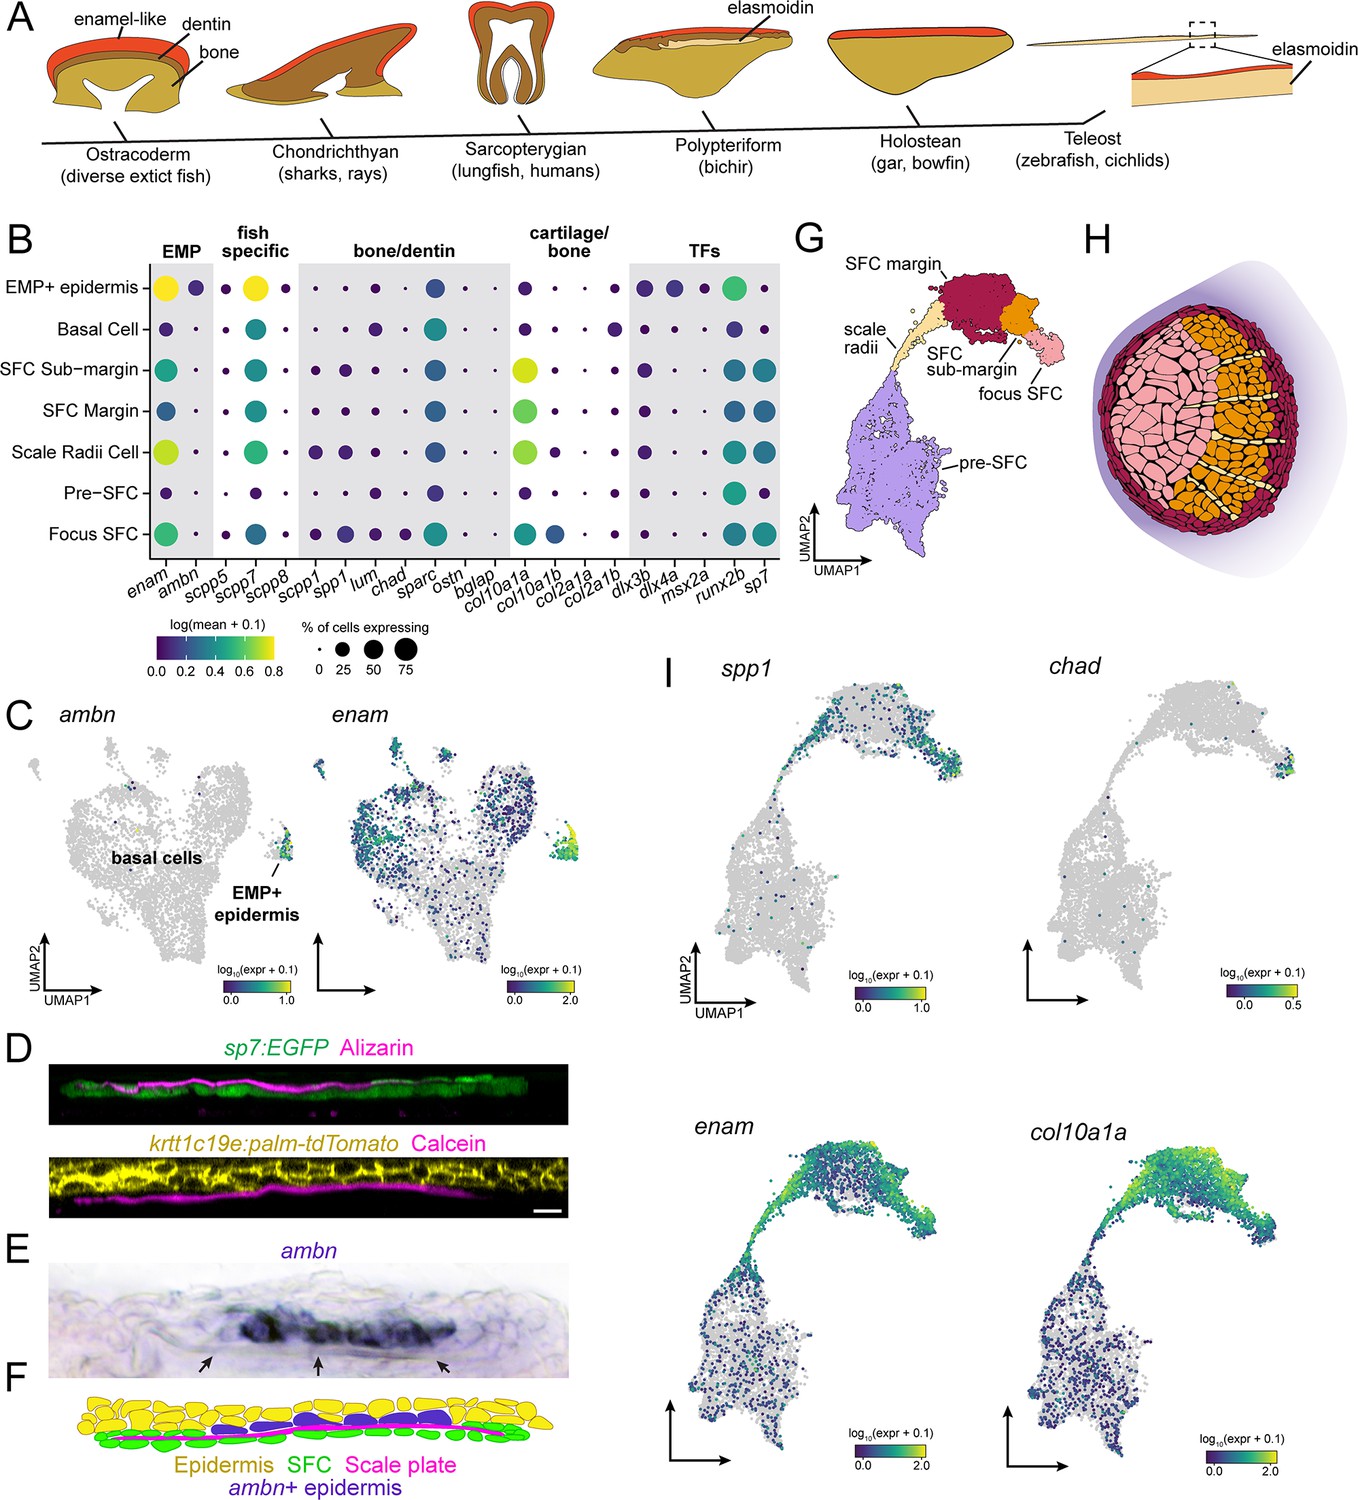
Evidence for epidermal and dermal contributions to scale plate ECM.
(A) Simplified vertebrate phylogeny with schematic depictions of calcified appendages. Phylogeny based on Near et al., 2012; Betancur-R et al., 2013; schematics drawn after (Sire et al., 2009). (B) Dotplot visualization of transcripts encoding enamel matrix proteins (EMPs), fish-specific secretory calcium-binding phosphoprotein (SCPP) tandem duplicates, non-collagen matrix proteins associated with bone and dentin, collagen associated with cartilage and transcription factors that regulate osteoblast and ameloblast differentiation. (C) UMAP visualization of epidermal basal cells showing distribution of transcripts encoding EMPs. (D) Optical sections of growing scale in live animals showing the relative position of calcified matrix dyed with Alizarin Red S (ARS) or Calcein, and dermal scale-forming cell (SFC) visualized with sp7:EGFP transgene and epidermis visualized with krtt1c19e:palm-tgTomato transgene. (E) In situ hybridization of ambn, encoding the EMP Ameloblastin. Arrows point to the calcified scale plate. (F) Schematic representation of epidermal ambn expressing cells (blue), the calcified scale plate (magenta), dermal SFC (green), and epidermis (yellow). (G) UMAP visualization of dermal SFC and pre-SFC. (H) Position of SFC sub-types within a scale inferred from in situ hybridization assays (Figure 2—figure supplement 1). (I) UMAP visualization of transcripts encoding non-collagen matrix proteins associated with bone (spp1, chad), enamel (enam), and cartilage (col10a1a). Scale bar, 10 μm.
Figure 4
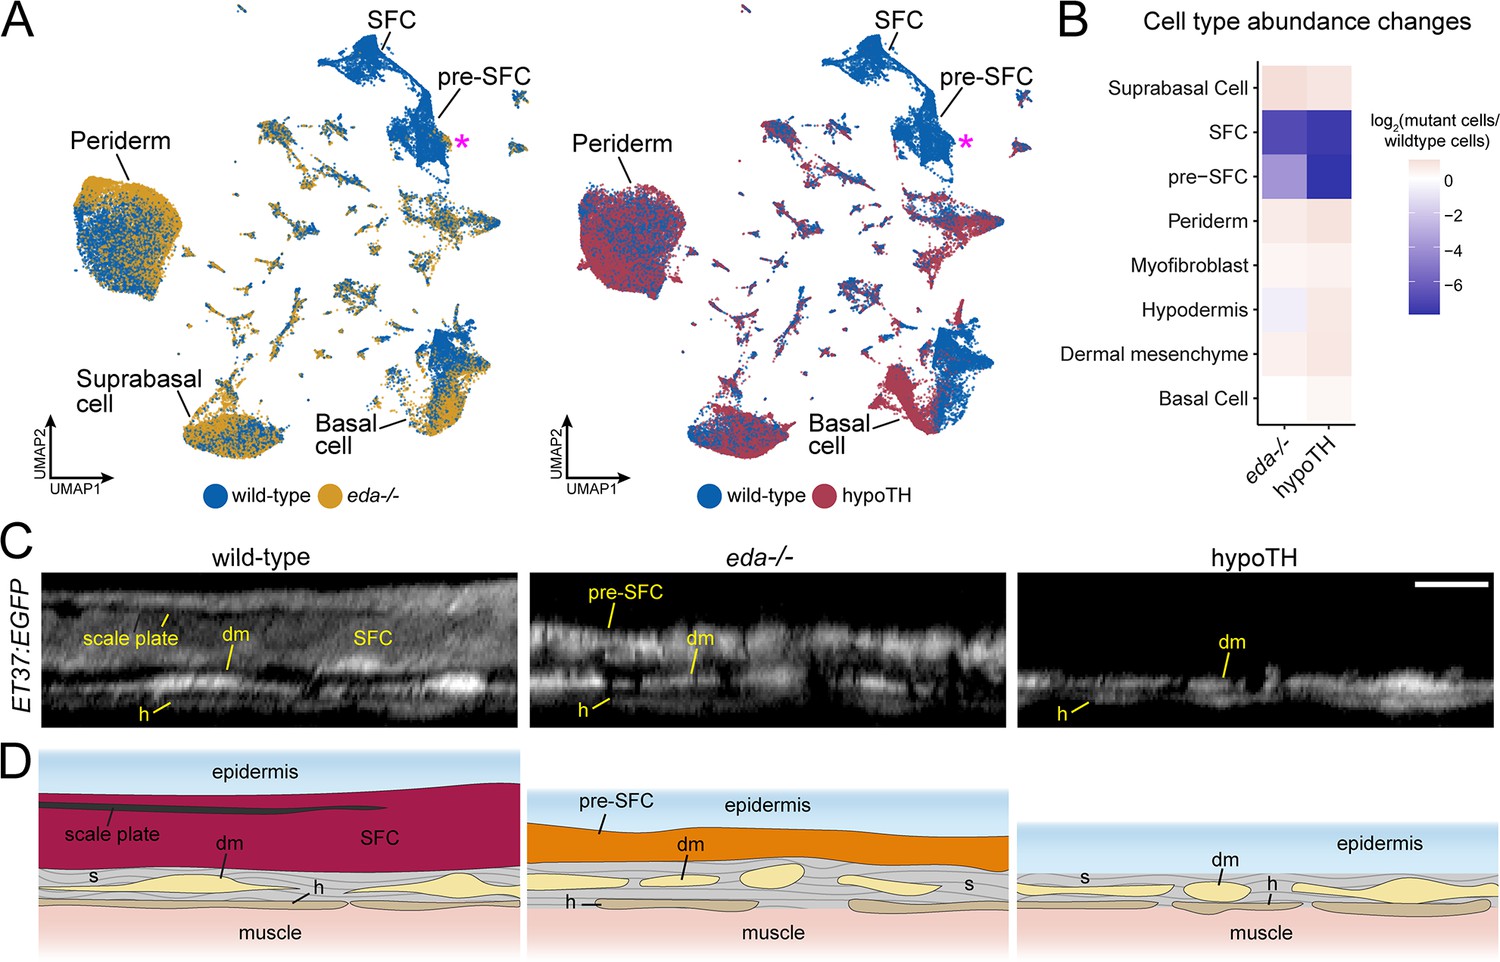
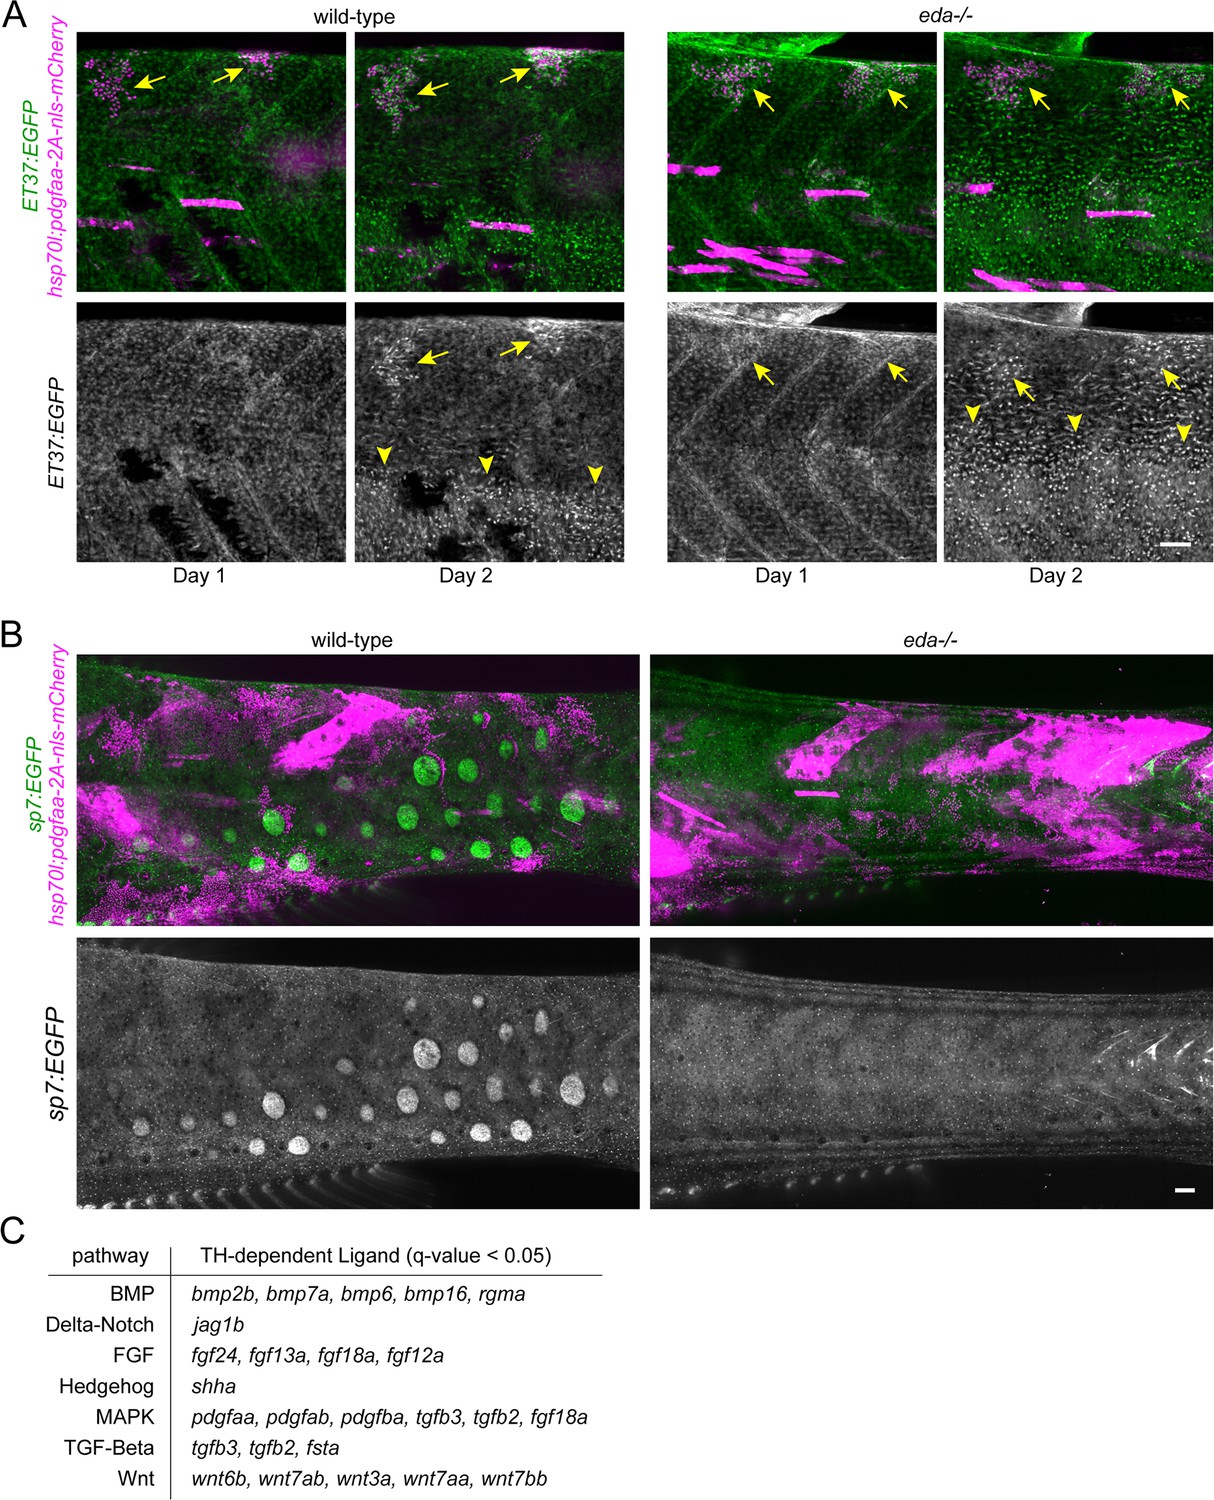
eda and thyroid hormone (TH) regulate signaling ligand transcription in basal epidermal cells.
(A) UMAP visualizations with wild-type cells in blue, eda mutant cells in yellow, and hypoTH cells in red highlighting the absence of scale-forming cell (SFC) and residual pre-SFC in skins of eda mutants and the absence of both populations in skins of hypoTH fish. Magenta asterisks mark differences in pre-SFC complements between eda mutant and hypoTH; other cell types designated in Figure 1C. (B) Heatmap visualization of cell type abundance shows that eda mutants retain more pre-SFCs than hypoTH fish. (C) Optical sections and (D) schematic representations of wild-type, eda mutant and hypoTH skin, visualized in ET37:EGFP transgenics, showing abundance of SFC in wild-type, a thin layer of pre-SFC in eda mutants, and lack of pre-SFC in hypoTH skin. dm, dermal mesenchyme; h, hypodermis; s, stromal collagen. Scale bar, 10 μm (C).
Figure 5
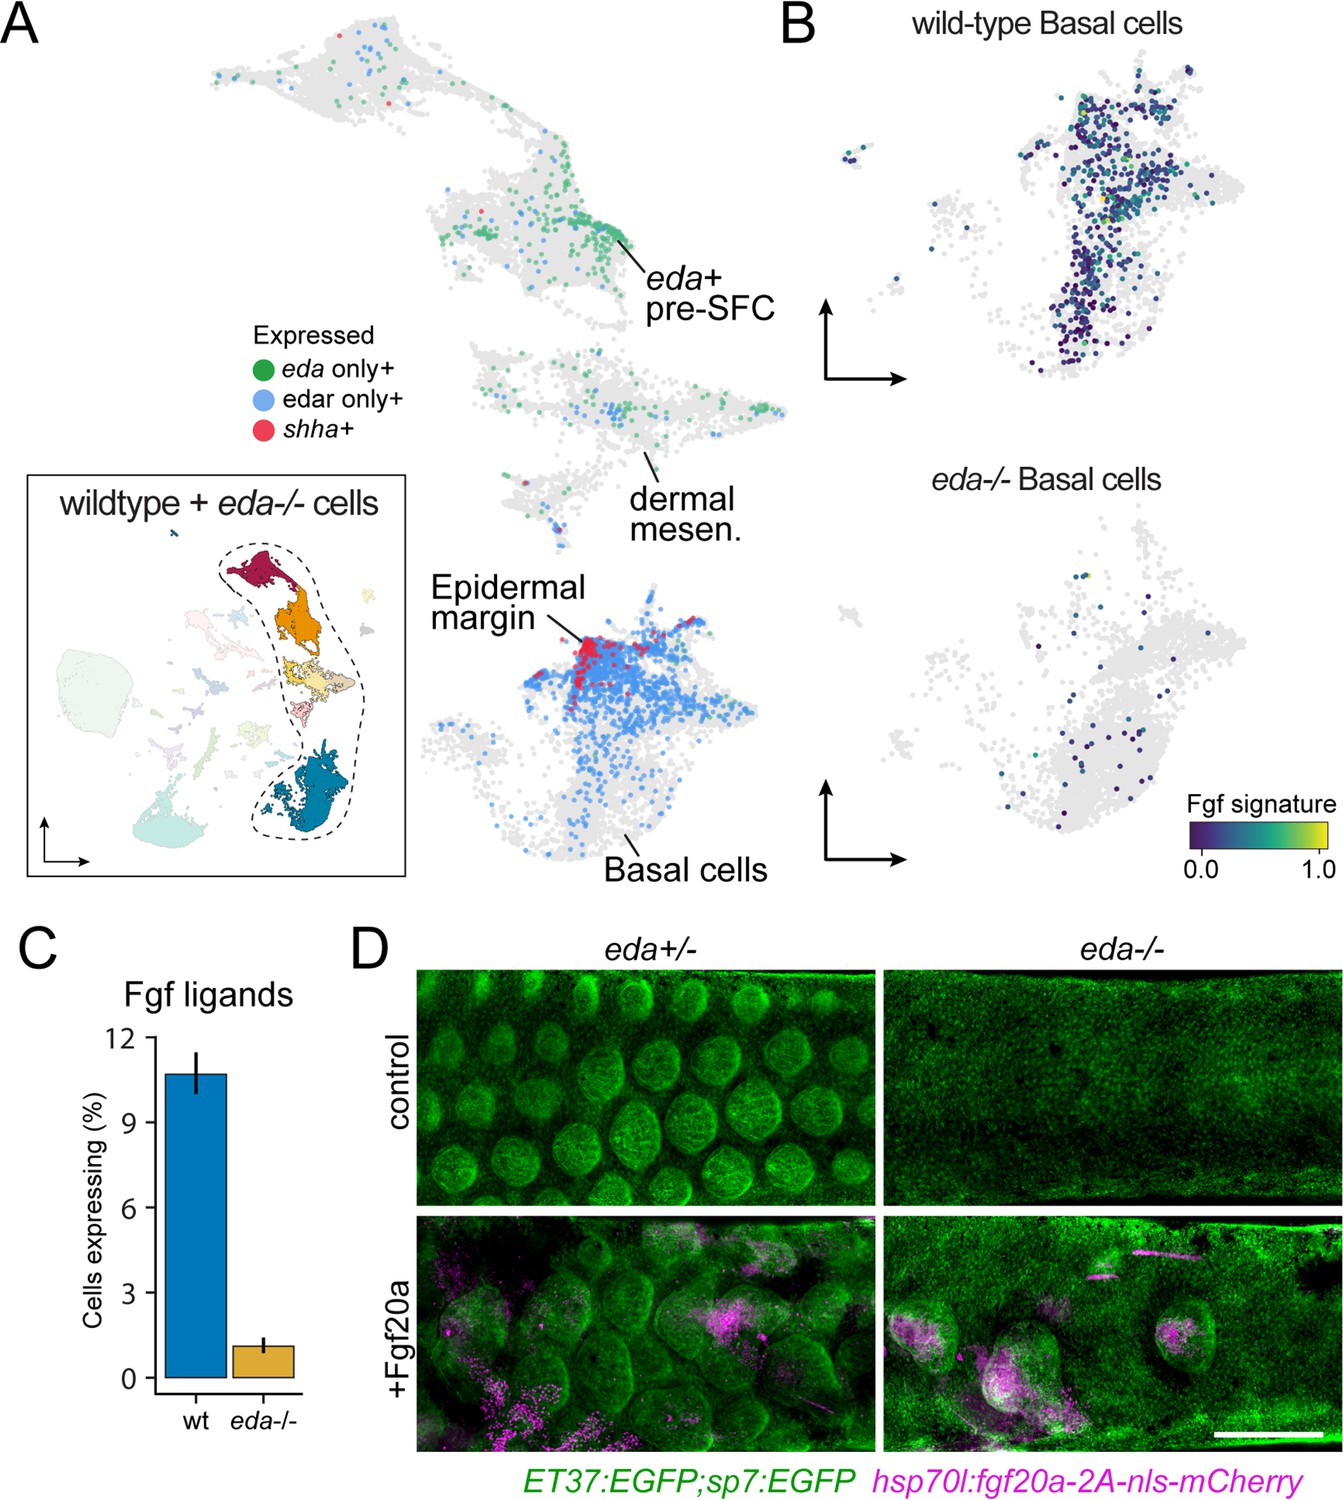
eda regulates scale-forming cell (SFC) differentiation via transcriptional regulation of basal epidermal Fgf ligands.
(A) Wild-type dermal and basal epidermal cells plotted in UMAP space and colored by whether they are expressing eda, edar, or shha (shha+ cells also include cells expressing both edar and shha). (B) Wild-type and Eda mutant basal cells plotted in UMAP space and colored by the expression of the signature score of Fgf ligands that are specifically expressed in basal cells (fgf24, fgf20a, fgf20b; specificity score >0.1). (C) Percent of cells expressing the Fgf ligand signature between wild-type and Eda mutant basal cells (error bars estimated via bootstrapping [n = 100]). (D) Scales and dermis visualized in sp7:EGFP; ET37:EGFP double transgenics (green). Heat-shocked control eda+/- larvae developed well-patterned, uniformly shaped scales (n = 6), whereas heat-shocked control eda-/- larvae developed no scales (n = 6). Mosaic heat-shock induction of Fgf20a, stringently selected for expression in epidermal cells (magenta) caused mis-patterned and dysmorphic scales to grow in wild-type eda+/- larvae (n = 25 epidermal clones in six fish) and rescued scale formation in eda-/- larvae (n = 36 epidermal clones in six fish). Scale bar, 500 μm (D).
Figure 6 with 1 supplement
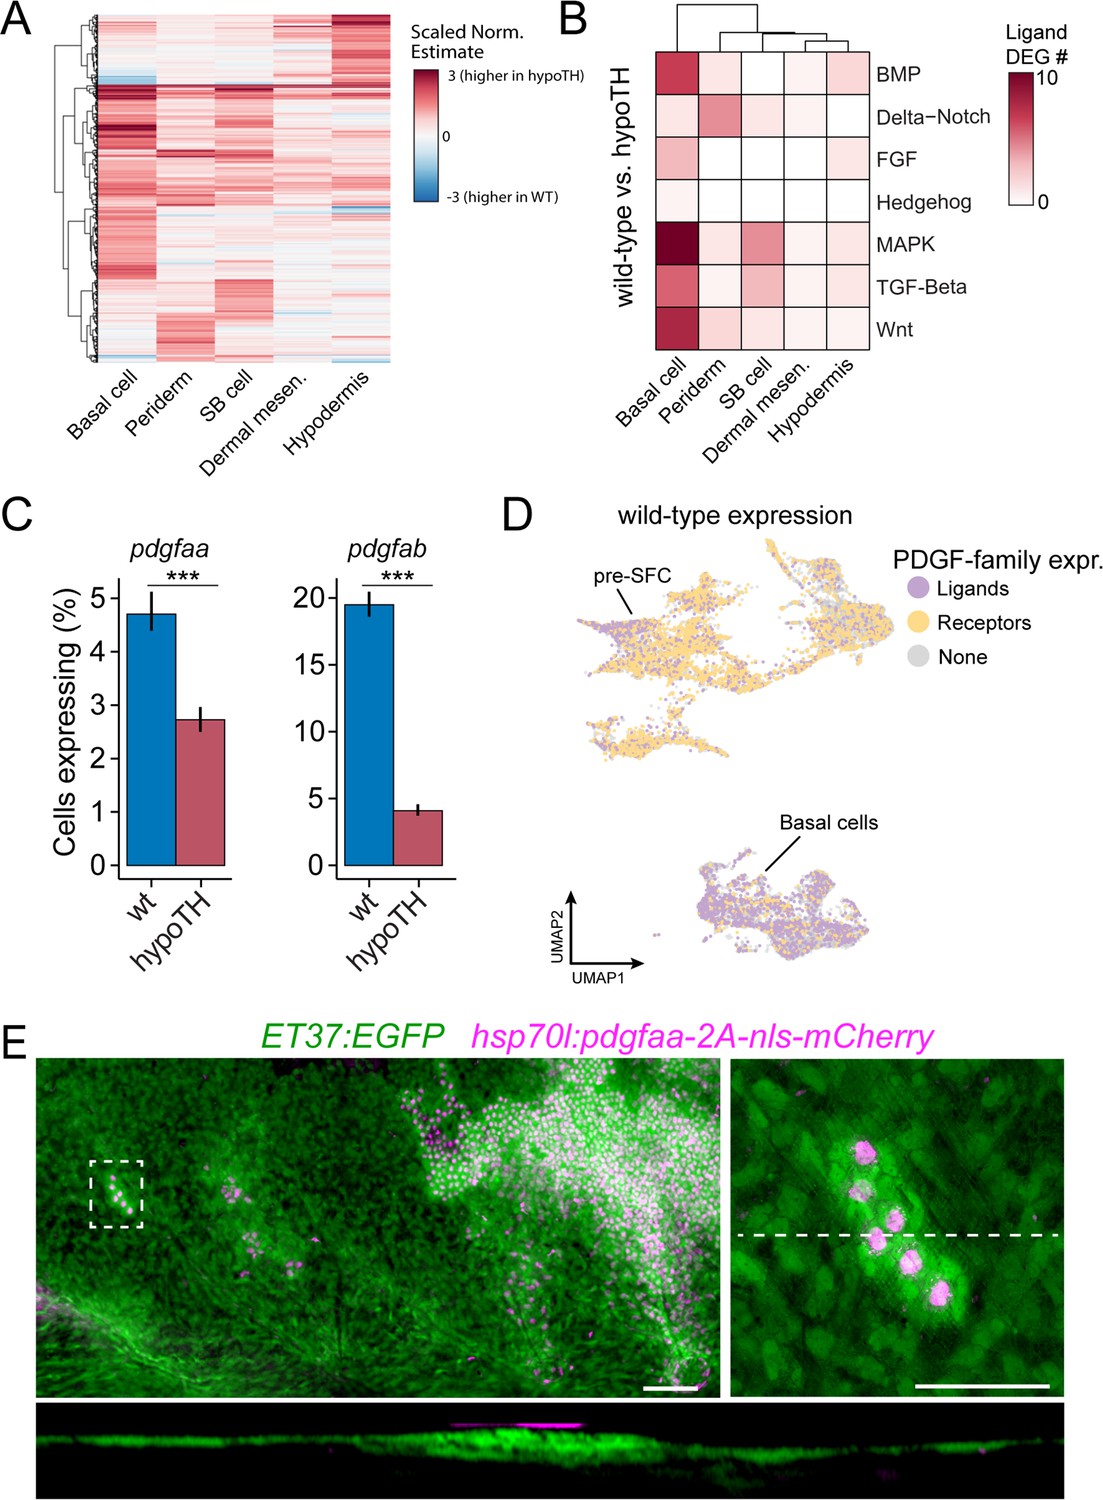
Thyroid hormone (TH) drives dermal stratification via transcriptional regulation of epidermal Pdgfα expression.
(A) Differential gene expression analysis between cell types of wild-type and hypoTH fish revealed extensive changes in expression across dermal and epidermal cell types (n = 836 genes, q-value < 0.01, normalized effect >2) (Supplementary file 2—Table 4). SB cell, suprabasal cell. (B) Of the differentially expressed genes, ligands of major signaling pathways involved in morphogenesis are also enriched in basal cells. (C) Both pdgfaa and pdgfab ligands are differentially expressed (***q-value < 1e-10) between wild-type and hypoTH basal cells of the epidermis (error bars estimated via bootstrapping [n = 100]). (D) Wild-type dermal and basal cells of epidermis plotted in UMAP space and colored by whether they express pdgfaa, pdgfab, or both (ligands) as well as pdgfra, pdgfrb, or both (receptors). (E) Upper left: mosaic heat-shock induction of Pdgfaa (magenta), stringently selected for expression in epidermal basal cells, rescued stratification of hypoTH dermis, visualized with ET37:EGFP (green) (n = 65 clones in eight fish). Upper right: higher magnification of boxed area showing accumulation of dermal cells underneath Pdgfaa+ epidermal cells. Bottom: optical cross section of boxed area reveals multiple dermal layers only in proximity to Pdgfaa+ epidermal cells. Scale bars, 50 μm (E, upper-left panel), 10 μm (E, enlarged region, upper-right and lower panels).
Figure 6—figure supplement 1
Excess Pdgfaa expression led to precocious dermal stratification in wild-type and eda mutant fish.
(A) Pdgfaa expression (magenta), stringently selected for basal epidermal expression, caused precocious dermal stratification, labeled with ET37:EGF (green) in wild-type and eda mutants (n = 8 clones in four fish for wild-type; 9 clones in four fish for eda mutant). Arrows indicate regions of precocious dermal stratification. Arrowheads indicate regions where normal dermal stratification is occurring. (B) Pdgfaa expression did not lead to dysmorphic and mis-patterned scales, visualized with sp7:EGFP (green) in wild-type and did not rescue scale formation in eda mutants (n = 54 clones in 8 wild-type fish, 70 clones in 10 eda mutant fish). Scale bars, 50 μm (A, B). (C) Differentially expressed signaling ligands downregulated in hypoTH basal epidermal cells.
Figure 7
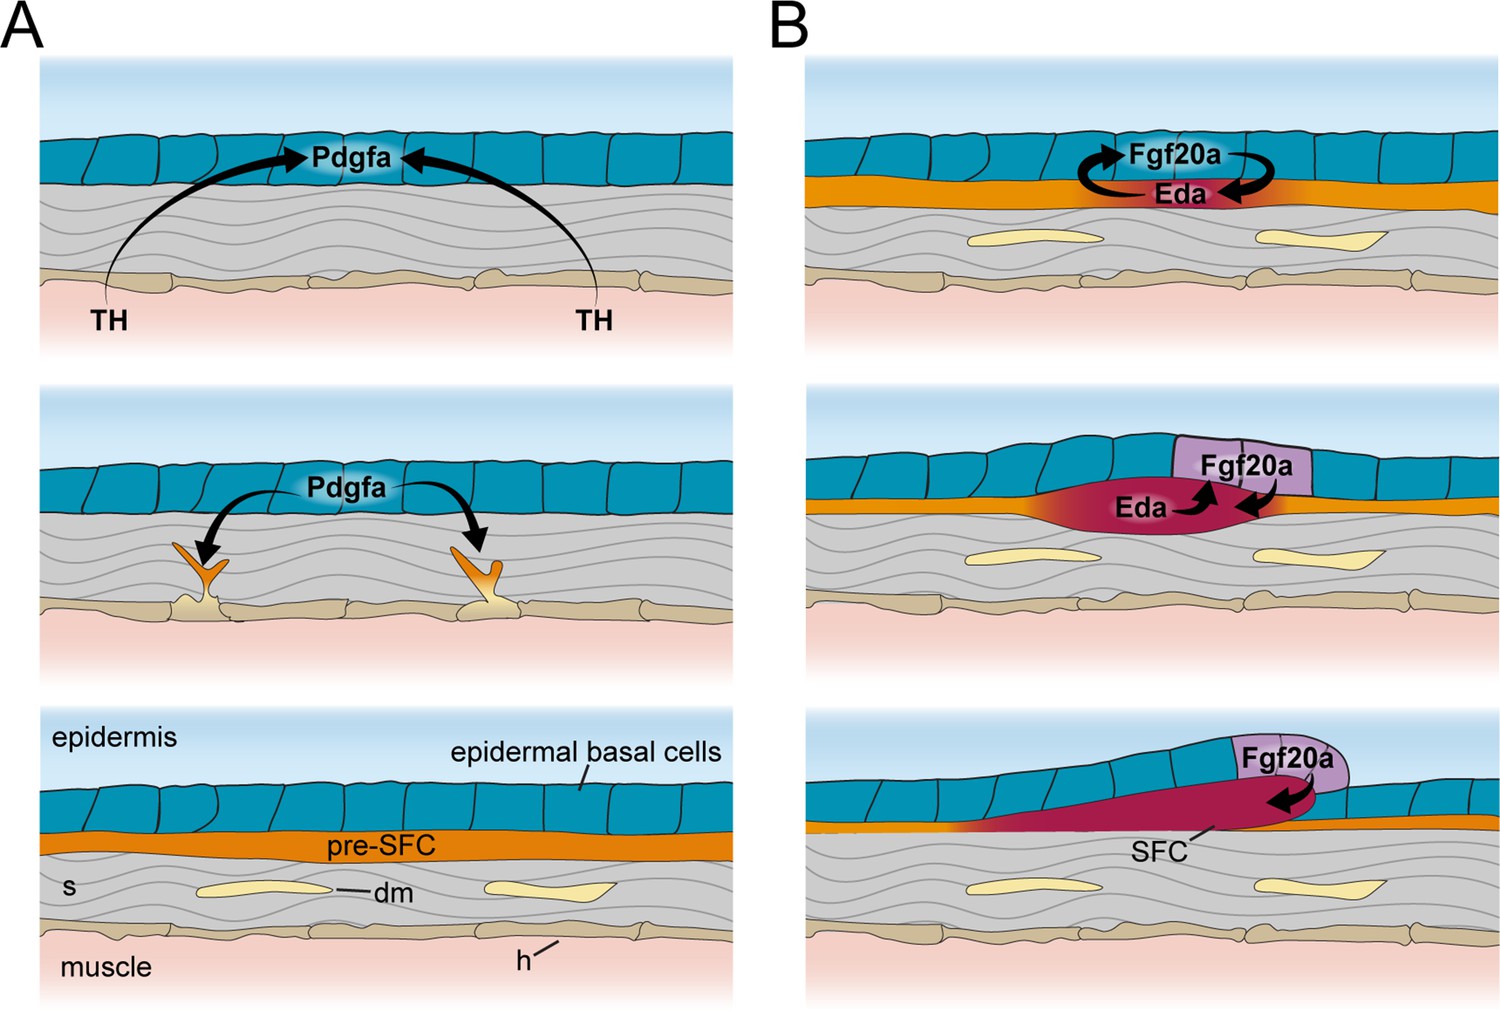
Schematic representation of signaling interactions that regulate dermal morphogenesis.
(A) Globally circulating thyroid hormone (TH) stimulates expression of transcripts encoding Pdgfα ligand in basal epidermal cells (blue). Epidermally expressed Pdgfa ligand regulates migration and differentiation of dermal mesenchyme in the stroma and pre-scale-forming cells (pre-SFCs) that accumulate just beneath the epidermis prior to scale development. (B) Epidermally expressed Fgf20a ligand stimulates differentiation of SFCs in the superficial pre-SFC population. Subsequently, SFCs express Eda ligand, which, in turn, maintains expression of Fgf20a. The mechanisms that initiate squamation and regulate hexagonal scale patterning remain unknown.
Figure 8 with 2 supplements
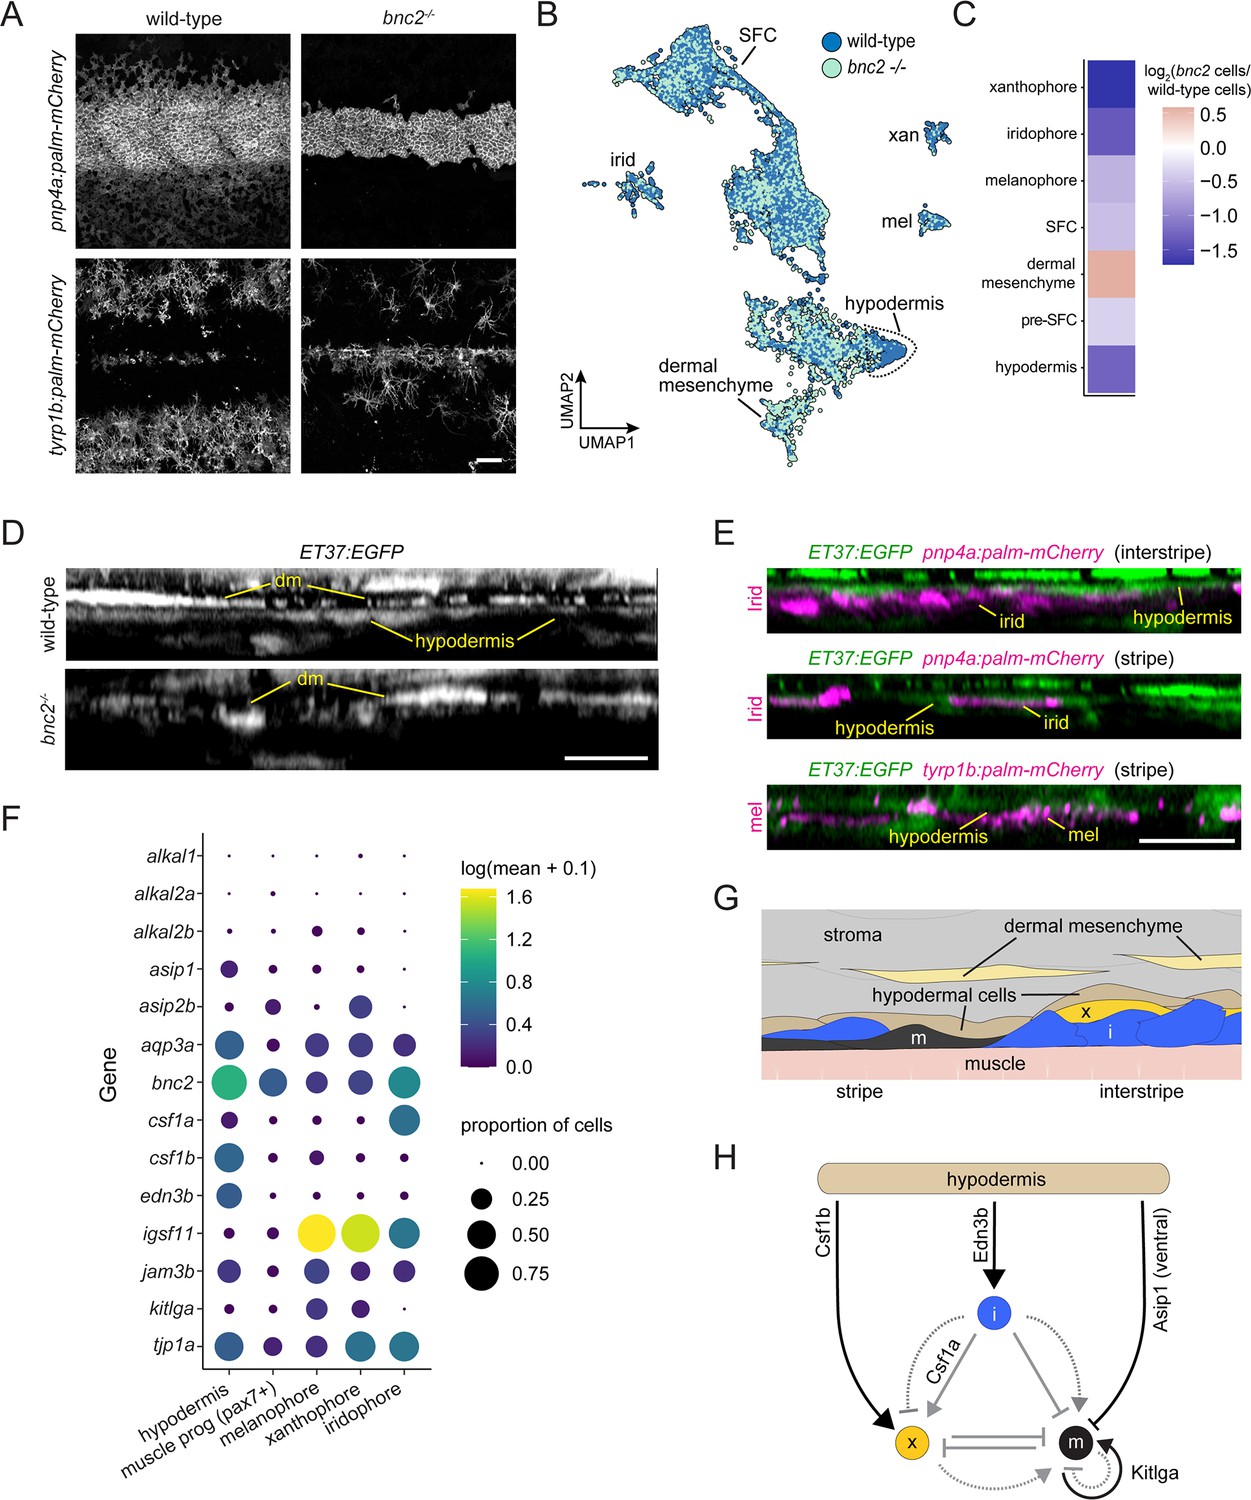
Hypodermis is a pigment cell support cell population.
(A) At 9.6 standardized standard length (SSL), bonaparte mutants have grossly fewer iridophores (pnp4a:palm-mCherry) and melanophores (tyrp1b:palm-mCherry). (B) UMAP visualization of dermal cells and pigment cells with wt in blue and bnc2 mutant in red shows specific deficiency in hypodermal cells. (C) Heatmap showing the log2 proportion of dermal cell subtypes and pigment cells. (D) Orthogonal projections of live, super-resolution imaging of dermal cells in wild-type and bnc2 mutants expressing ET37:EGFP. Wild-type hypodermis is a thin, confluent cell layer underneath the more brightly labeled dermal mesenchyme (dm). Stage-matched bnc2 mutant dermis had dermal mesenchyme, but lacked a hypodermal layer. (E) Live imaging of fish doubly transgenic for ET37:EGFP to visualize hypodermis, and pnp4a:palm-mcherry to visualize iridophores (irid) or tyrp1b:palm-mCherry to visualize melanophores (mel). Both pigment cell types reside in close contact with hypodermal cells. (F) Dotplot heatmap showing expression level of known pigment cell trophic factors. (G) Schematic representation of pigment cell microenvironment, greatly expanded along its deep-to-superficial axis to better illustrate organization of the very flat pigment and hypodermal cells. Xanthophore location inferred from Hessle et al., 2013. (H) Potential regulatory linkages between hypodermis and pigment cell types, inferred from expression (black arrows). Previously documented interactions among the pigment cells represented by gray arrows. Scale bars, 100 μm (A), 10 μm (D, E).
Figure 8—figure supplement 1
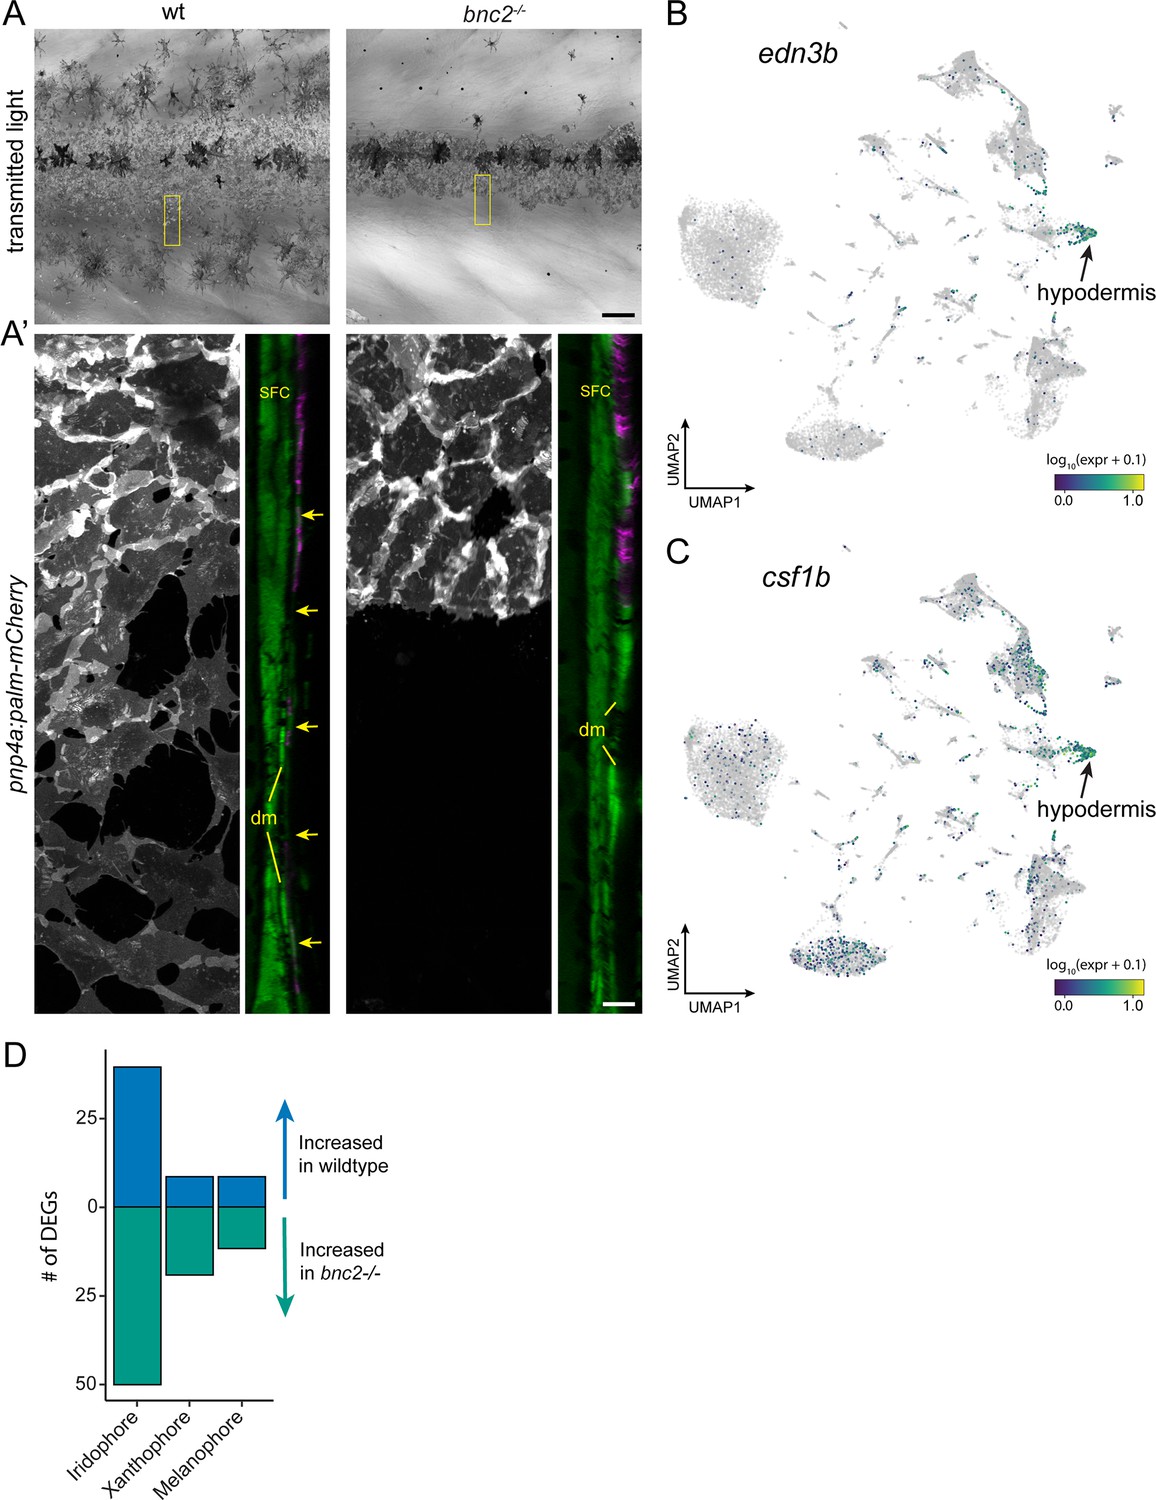
Hypodermis supports pigment cells.
(A) Iridophores and melanophores in wild-type and bnc2 mutant skins highlighting the relative dearth of pigment cells in the mutant. (A’) Super-resolution images of boxed region in (A), iridophores expressing pnp4a:palm-mCherry and orthogonal projection showing both iridophores and dermal cells expressing ET37:EGFP. bnc2 mutant dermis is bounded by dermal mesenchyme (dm) and lacks the thin, confluent hypodermis seen in wild-type individuals (arrows). (B, C) UMAP visualizations of pigment cell trophic factors, edn3b and csf1b. Compare to cell types illustrated in Figure 1C. (D) bnc2-dependent loss of hypodermis is associated with a greater number of differentially expressed genes (DEGs) in iridophores than in other pigment cell types. Scale bars, 100 μm (A), 10 μm (A’).
Figure 8—figure supplement 2
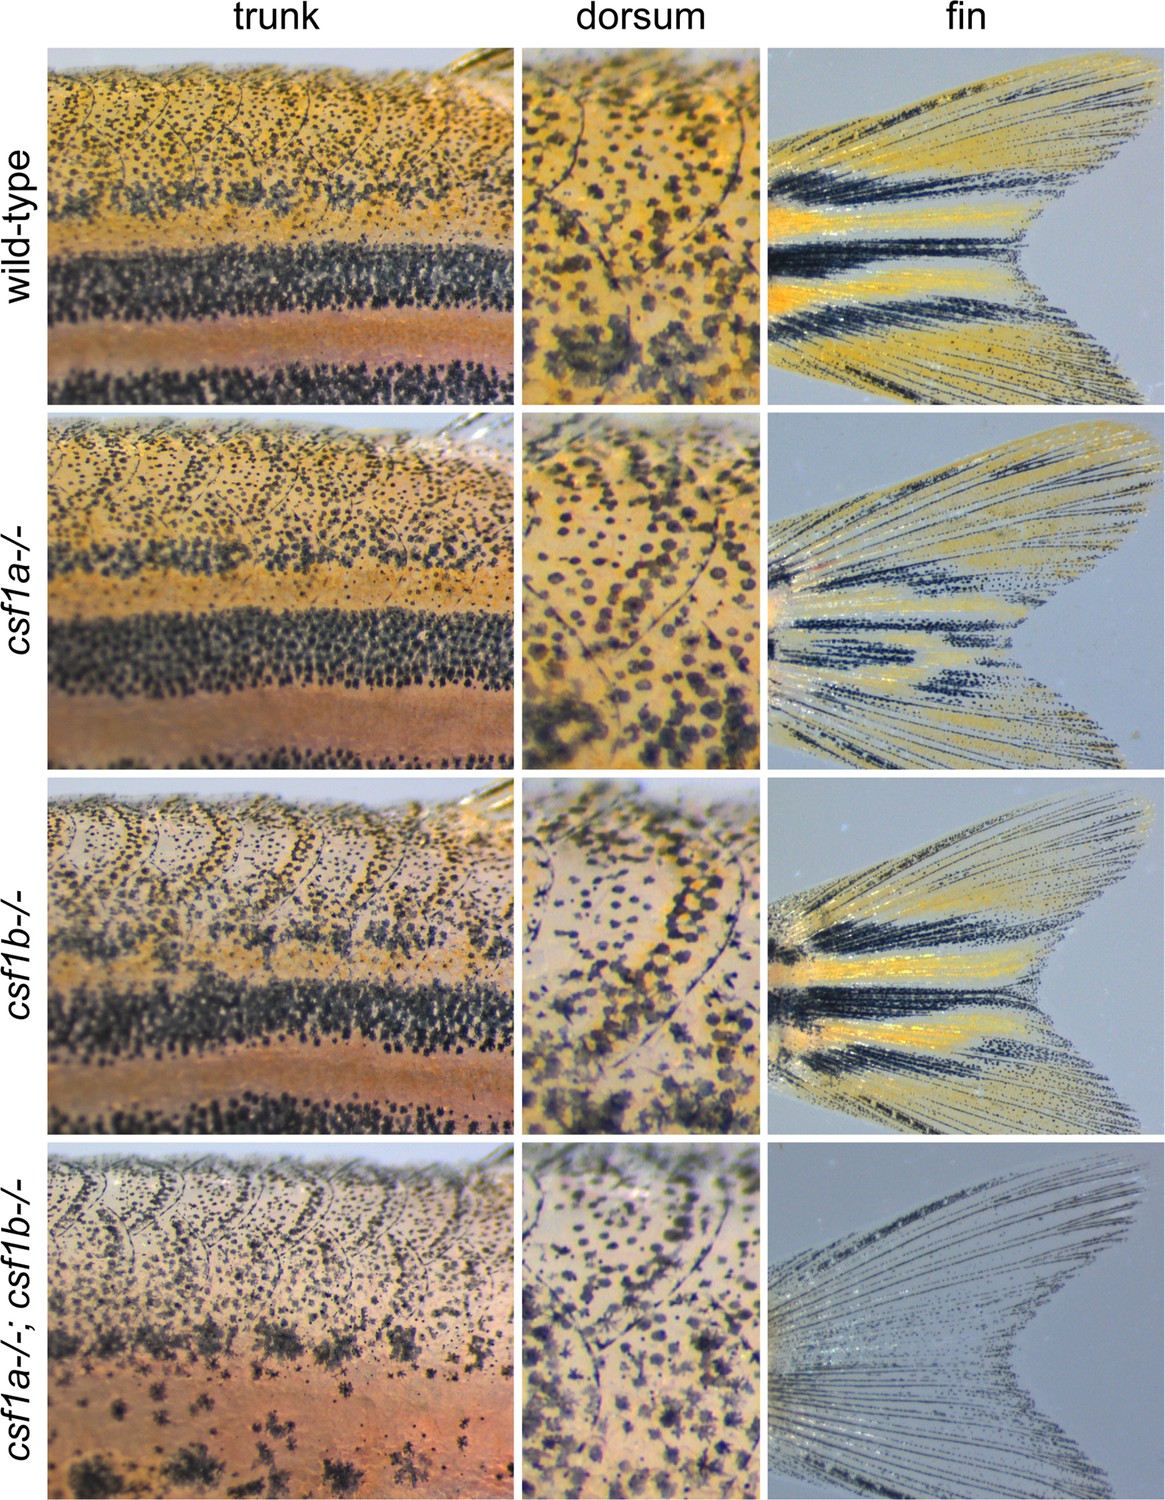
Csf1 requirements for xanthophore pigmentation.
Fish that were wild-type (n = 23), homozygous mutant for csf1a (n = 15), csf1b (n = 9), or both csf1a and csf1b (n = 10) were examined 4–12 wk post-fertilization, with representative phenotypes at 6 wk shown here. csf1a mutants had disrupted patterns and reduced xanthophore pigmentation in fins, whereas csf1b mutants had fewer pigmented xanthophores in the hypodermis and on scales, deficiencies especially apparent on the dorsum of the fish. Fish doubly mutant for both Csf1 loci lacked virtually all xanthophores and resembled csf1ra mutants (Parichy and Turner, 2003).
Tables
Key resources table
| Reagent type (species) or resource | Designation | Source or reference | Identifiers | Additional information |
|---|---|---|---|---|
| Strain, strain background (Danio rerio) | sp7:EGFP; Tg(sp7:EGFP)b1212 | Gift; PMID:20506187 | RRID:ZDB-ALT-100402-1 | |
| Strain, strain background (D. rerio) | ET37; Et(krt4:EGFP)sqet37 | Gift; PMID:15366023 | RRID:ZDB-ALT-070702-16 | |
| Strain, strain background (D. rerio) | Tg(sp7:nEOS)vp46rTg | Previous study; PMID:34089732 | ||
| Strain, strain background (D. rerio) | (bnc2)utr16e1 | Previous study; PMID:19956727 | RRID:ZDB-FISH-150901-26677 | |
| Strain, strain background (D. rerio) | (eda)dt1261 | Gift; PMID:18833299 | RRID:ZDB-ALT-090324-1 | |
| Strain, strain background (D. rerio) | Tg(tg:nVenus-v2a-nfnB)wprt8Tg | Previous study; PMID:25170046 | RRID:ZDB-ALT-141218-1 | |
| Strain, strain background (D. rerio) | Tg(pnp4a:palm-mCherry)wprt10Tg | Previous study; PMID:31138706 | RRID:ZDB-ALT-200507-3 | |
| Strain, strain background (D. rerio) | csf1a | This study | Available from Pavan Lab, NHGRI, Bethesda MD, USA | |
| Strain, strain background (D. rerio) | csf1b | This study | Available from Pavan Lab, NHGRI, Bethesda MD, USA | |
| Recombinant DNA reagent | fgf20a-2A-mCherry;hsp70l:fgf20a-2A-nls-mCherry | This study | NA | Available from Parichy Lab, UVA, Charlottesville VA, USA |
| Recombinant DNA reagent | pdgfaa-2A-mCherry;hsp70l:pdgfaa-2A-nls-mCherry | This study | NA | Available from Parichy Lab, UVA, Charlottesville VA, USA |
| Antibody | Anti-Dig-AP, Fab fragments (sheep monoclonal) | MilliporeSigma | Roche; Cat# 11093274910; RRID:AB_514497 | Used at 1:5000 |
| Software, algorithm | GraphPad Prism | GraphPad | NA | |
| Chemical compound, drug | Alizarin-Red-S; ARS | MilliporeSigma | SKU_A5533 Sigma-Aldrich |
Additional files
-
Supplementary file 1
Published markers of skin and skin-associated cell types.
- https://cdn.elifesciences.org/articles/86670/elife-86670-supp1-v2.docx
-
Supplementary file 2
scRNA-seq metadata.
These tables include marker genes for both assigned cell types and unsupervised clustering, as well as definitions of gene signatures and differentially expressed genes between euthyroid and hypothyroid conditions for each cell type.
- https://cdn.elifesciences.org/articles/86670/elife-86670-supp2-v2.xlsx
-
MDAR checklist
- https://cdn.elifesciences.org/articles/86670/elife-86670-mdarchecklist1-v2.docx
Download links
A two-part list of links to download the article, or parts of the article, in various formats.
Downloads (link to download the article as PDF)
Open citations (links to open the citations from this article in various online reference manager services)
Cite this article (links to download the citations from this article in formats compatible with various reference manager tools)
Transcriptomic profiling of tissue environments critical for post-embryonic patterning and morphogenesis of zebrafish skin
eLife 12:RP86670.
https://doi.org/10.7554/eLife.86670.4


