Calcium transients trigger switch-like discharge of prostaglandin E2 in an extracellular signal-regulated kinase-dependent manner
- Research Center for Dynamic Living Systems, Graduate School of Biostudies, Kyoto University, Japan
- Department of Pathology and Biology of Diseases, Graduate School of Medicine, Kyoto University, Japan
- Department of Drug Discovery Medicine, Graduate School of Medicine, Kyoto University, Japan
- Institute for Integrated Cell-Material Sciences, Kyoto University, Japan
Figures
Figure 1 with 2 supplements
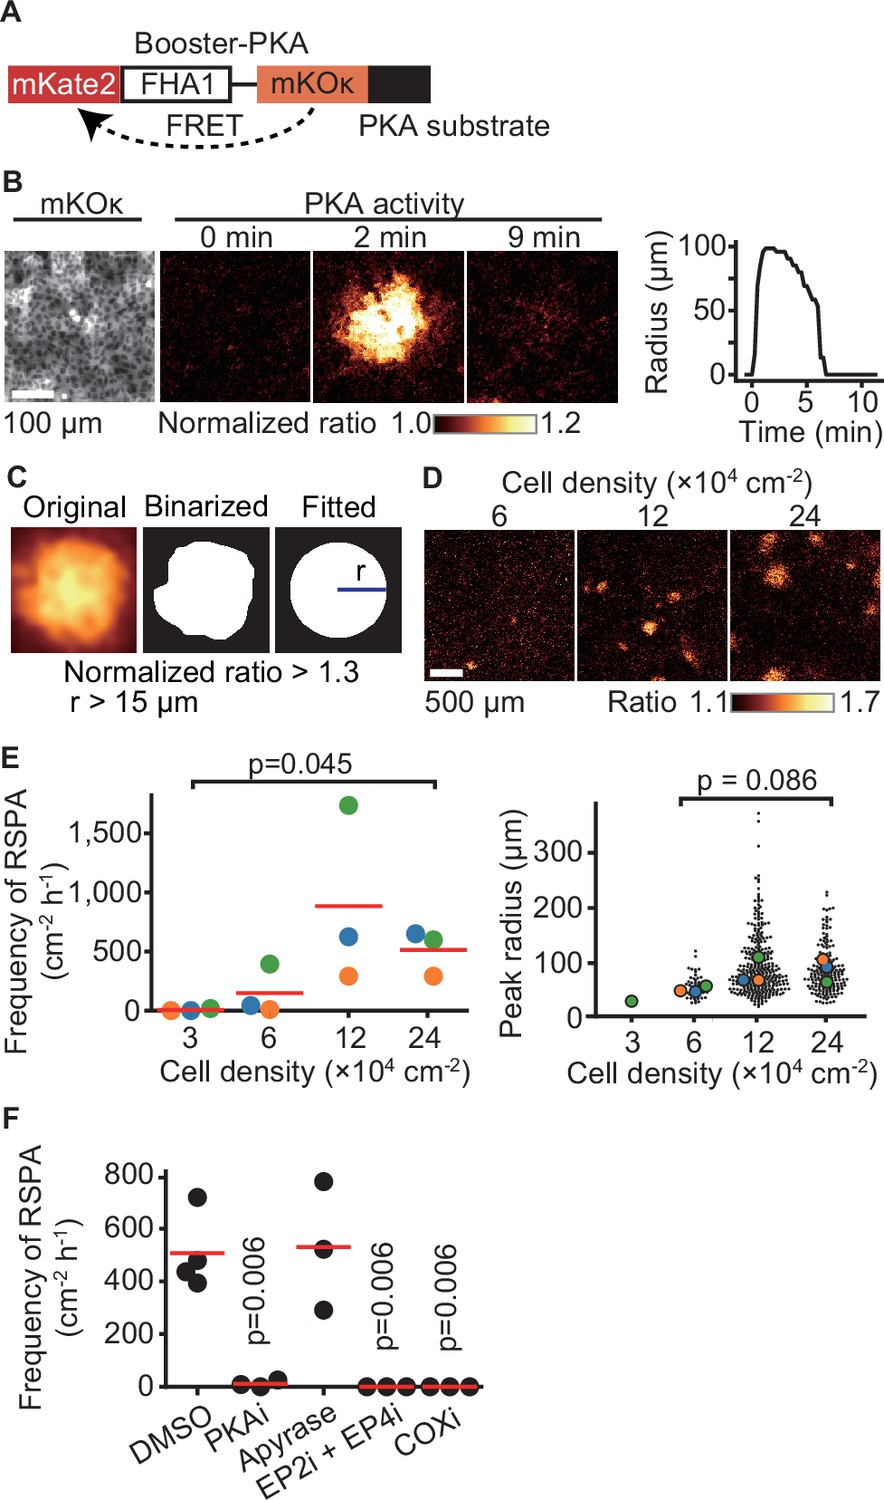
Radial spread of PKA activation (RSPA) in Madin–Darby canine kidney (MDCK) cells.
(A) A scheme of Booster-PKA, a PKA sensor. (B) Booster-PKA-expressing MDCK cells in a confluent condition were observed every 15 s under a fluorescence microscope (Figure 1—video 1). The image of mKOκ represents the cell density, which is seeded at 2.4 × 10⁵ cells cm-2. mKate2 and mKOκ images were acquired to generate mKate2/mKOκ ratio images representing PKA activity in pseudocolor. The time 0 is set the just before initiation of PKA activation. The radius of RSPA as determined in (C) was plotted as a function of time. (C) Procedure to call RSPA positive. The original ratio images were binarized with the threshold value 1.3 of mKate2/mKOκ ratio. The fitted radius of RSPA, r, was defined as the radius of a circle with the same area. When r is >15 µm, it is counted as RSPA. The detailed procedure is provided in the ‘Materials and methods’ section. (D, E) MDCK cells expressing Booster-PKA were seeded at the indicated density and analyzed. Representative images in indicated cell densities are shown in pseudocolor (D). Each color in panel (E) represents an individual experiment. Red lines indicate average values. (F) MDCK cells expressing Booster-PKA in the presence of the inhibitors were imaged and analyzed for the RSPA frequency. Reagents are as follows: DMSO, 0.1% v/v DMSO; PKAi, 20 μM H89; Apyrase, 10 unit mL-1; EP2i, 10 μM PF-04418948; EP4i, 1 μM ONO-AE3-208; COXi, 10 μM indomethacin. The frequency of RSPA was analyzed 20–80 min after the treatment. Each dot represents an individual experiment. Red lines indicate their average value. p-Values were calculated between the labeled sample and the DMSO-treated sample.
Figure 1—figure supplement 1

The probability of radial spread of PKA activation (RSPA) in each cell.
(A) Madin–Darby canine kidney (MDCK) cells expressing Booster-PKA were seeded at the indicated density and analyzed. Each color represents an individual experiment. Red lines indicate average values. (B) A scheme of hyBRET-Epac, a cAMP sensor. (C) MDCK cells expressing hyBRET-Epac were imaged to generate Turquoise/YPet ratio images representing cAMP concentration (cAMP) in pseudocolor. The image of Turquoise represents the cell density, which is seeded at 1.2 × 10⁵ cells cm-2. The time 0 was set as just before cAMP production. The normalized ratio images were binarized with the threshold value 1.06 of Turquoise/YPet ratio. (D) MDCK expressing hyBRET-Epac or Booster-PKA were seeded at seeded at 2.4 × 10⁵ cells cm-2. The gradients of normalized ratio were measured with a 10 pixel-width line scanning across the center of RSPA. Each color represents an individual RSPA. (E) MDCK cells expressing hyBRET-Epac were seeded at 2.4 × 10⁵ cells cm-2 and analyzed for the peak radius of RSPA.
Figure 1—video 1
Radial spread of PKA activation (RSPA) in Madin–Darby canine kidney (MDCK) cells.
The experiments described in Figure 1B are performed and analyzed.
Figure 2 with 1 supplement
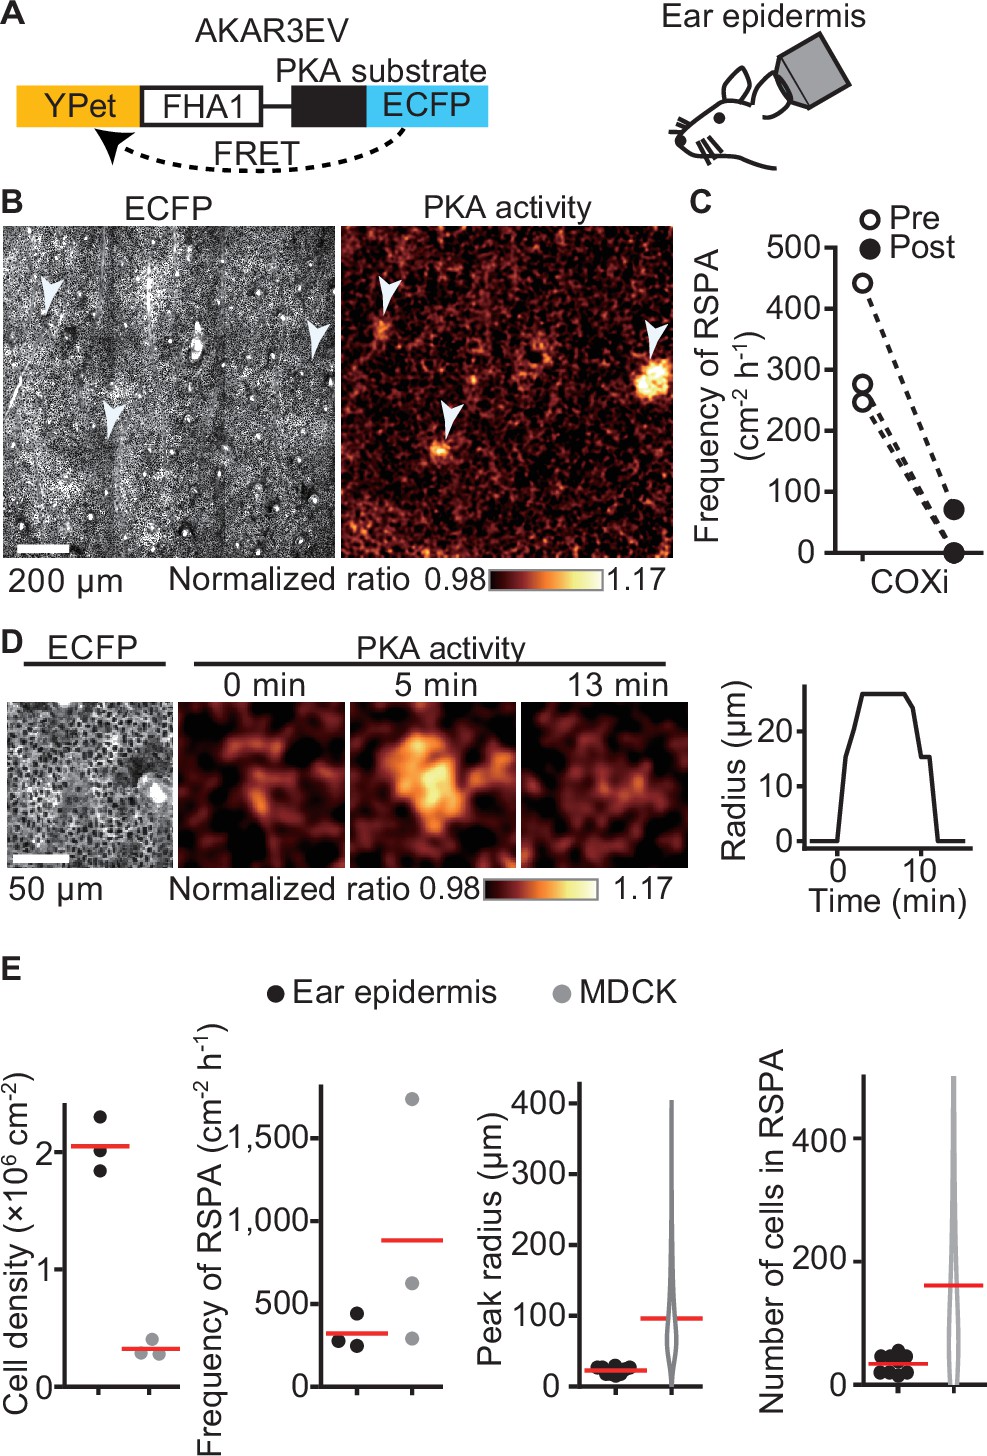
Radial spread of PKA activation (RSPA) in the basal layer of mouse auricular epidermis.
(A) A scheme of AKAR3EV, a PKA sensor. (B) Transgenic mice expressing AKAR3EV were observed under a two-photon excitation microscope. Shown are an ECFP image and a YPet/ECFP ratio image representing the cell density and PKA activity in pseudocolor, respectively. (C) Three mice were administrated a COXi, 30 mg/kg flurbiprofen intraperitoneally. The frequency of RSPA in pretreatment was quantitated more than 40 min before the injection. Similarly, the frequency of a post-COX inhibitor treatment was analyzed 15–58, 15–97, and 15–63 min. Each dotted line represents an individual mouse experiment. (D) Magnified views of an RSPA in vivo. Shown are an ECFP image and a YPet/ECFP ratio image representing the cell density and PKA activity in pseudocolor, respectively. The radius was determined as in Figure 1C, with the detection limit of 6.4 µm. (E) The properties of RSPA are compared between in vivo and in vitro. Data from three independent experiments are shown for each condition. The data of MDCK is from Figure 1E, seeded at the 1.2 × 10⁵ cells cm-2. Cell density and frequency of RSPA data are values per experiment. Peak radius data are pooled from three independent experiments for each condition. Red lines indicate average values.
Figure 2—video 1
Radial spread of PKA activation (RSPA) in living mice.
The experiments described in Figure 2B are performed and analyzed.
Figure 3 with 1 supplement
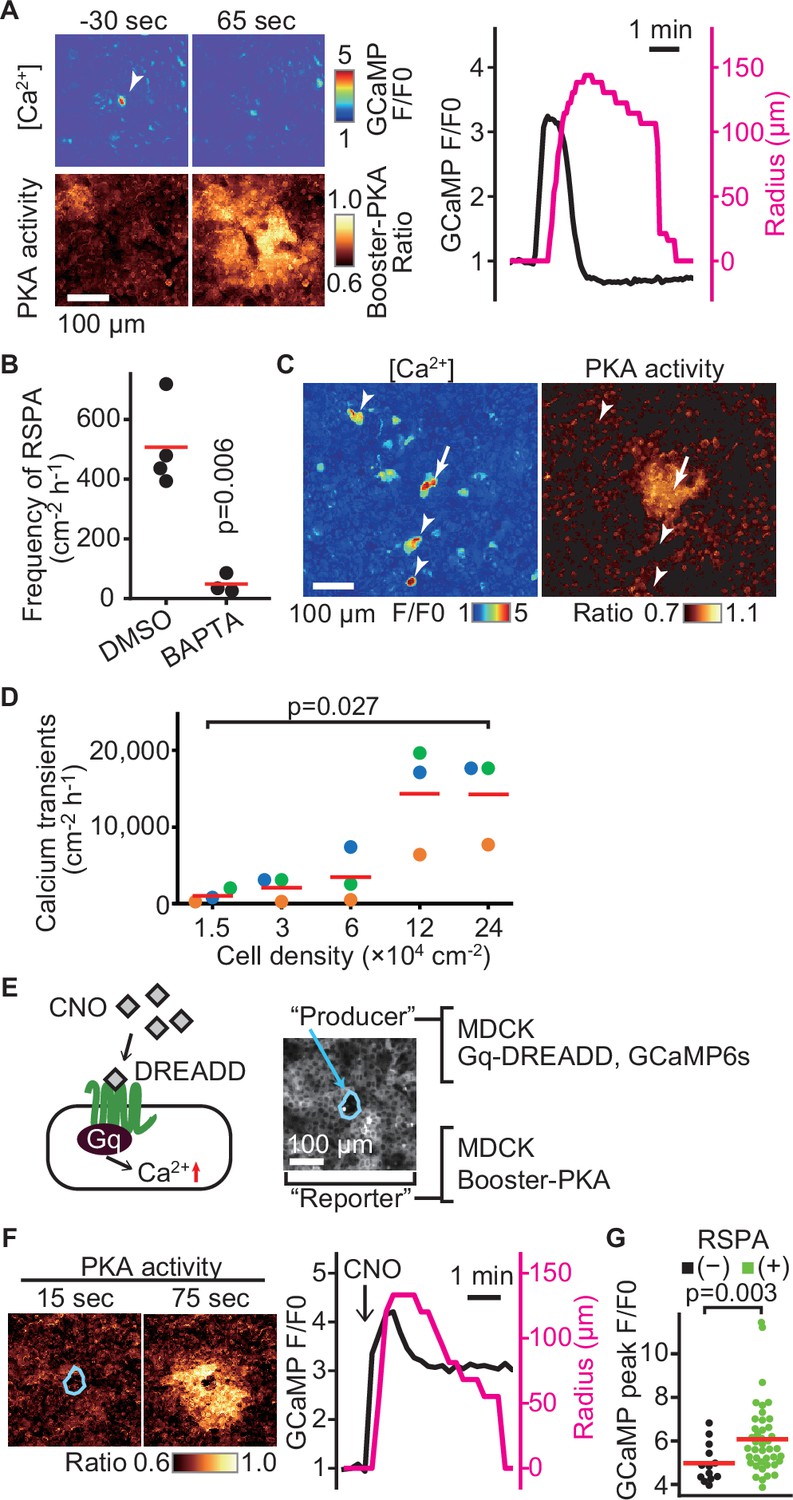
Radial spread of PKA activation (RSPA) induction by calcium transients.
(A) Madin–Darby canine kidney (MDCK) cells expressing GCaMP6s and Booster-PKA were observed for calcium transients and RSPA. Calcium transients are represented by the fluorescence of GCaMP normalized to the basal level (F/F0). RSPA is analyzed as in Figure 1C. (B) The frequency of RSPA was analyzed 20–80 min after 30 μM BAPTA-AM treatment. Data from three or four independent experiments. The DMSO control data set is from Figure 1F. (C) Maximum projection images of the ratio over 10 min. An arrow or arrowheads represent calcium transients with or without RSPA, respectively. Shown is a part of Figure 3—video 1. (D) MDCK cells expressing GCaMP6s were seeded at the indicated density. Calcium transients showing F/F0 to be >3 were counted in an indicated cell density. (E) Schematic representation of RSPA induction using Gq-DREADD. MDCK cells expressing Gq-DREADD served as producer cells, while MDCK cells expressing Booster-PKA were employed as reporter cells. (F, G) MDCK cells expressing Gq-DREADD with GCaMP6s or Booster-PKA were mixed and plated, treated with 1 μM CNO, and imaged. Blue circled cells are producer cells, expressing Gq-DREADD. The FRET ratio, the value of mKate2/mKOκ, in each pixel is shown in pseudocolor as indicated. The time 0 was set as just before CNO addition. Cells showing an F/F0 value >4 were analyzed for their RSPA as Figure 1C. Red lines indicate their average value.
Figure 3—video 1
Correlation of calcium concentration with radial spread of PKA activation (RSPA).
The experiments described in Figure 3C are performed and analyzed.
Figure 4
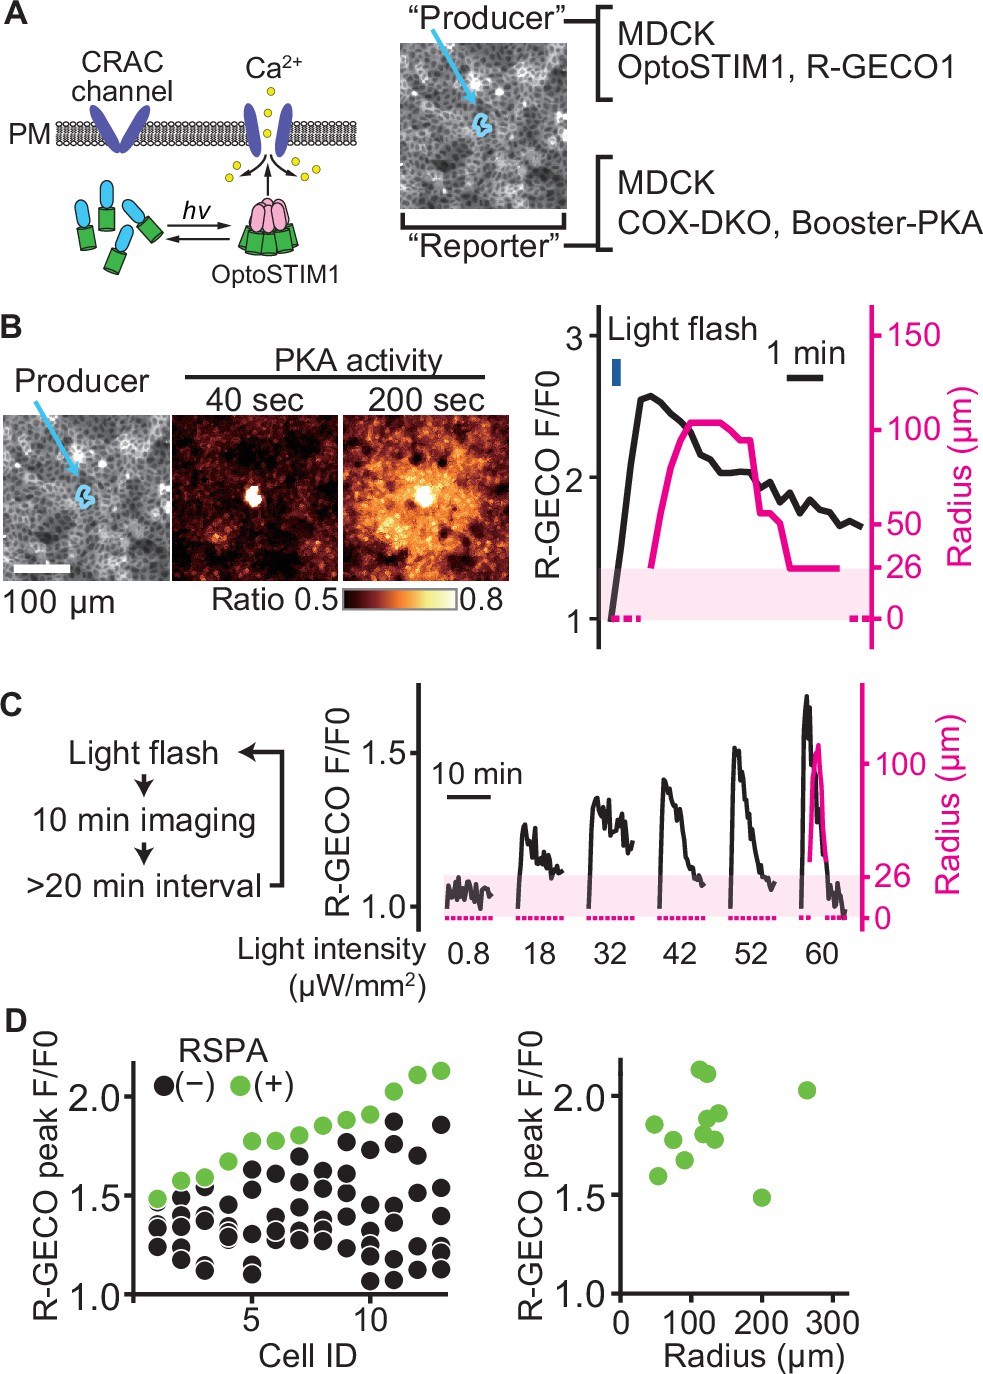
A switch-like response of radial spread of PKA activation (RSPA) to calcium transients.
(A) Schematic representation of RSPA induction using OptoSTIM1. Madin–Darby canine kidney (MDCK) cells expressing OptoSTIM1 and R-GECO1 were employed as the producer cells. The Booster-PKA-expressing MDCK cells, deficient in COX-1 and COX-2 (COX-DKO), were employed as the reporter cells. (B) The producer cells were stimulated by a flashlight during imaging. Blue circled cells in the mKOκ image are the producer cells. The FRET ratio, the value of mKate2/mKOκ, in each pixel is shown in pseudocolor as indicated. The time 0 was set as just before blue light irradiation. The detection limit for the RSPA radius was 26 µm, as shown in the shaded area. (C) Flashlight illumination was repeated with increasing LED power. (D) Vertically aligned dots (left) are the results from an individual producer cell. The right panel shows the relationship between R-GECO fluorescence intensity and the radius of RSPA.
Figure 5 with 1 supplement
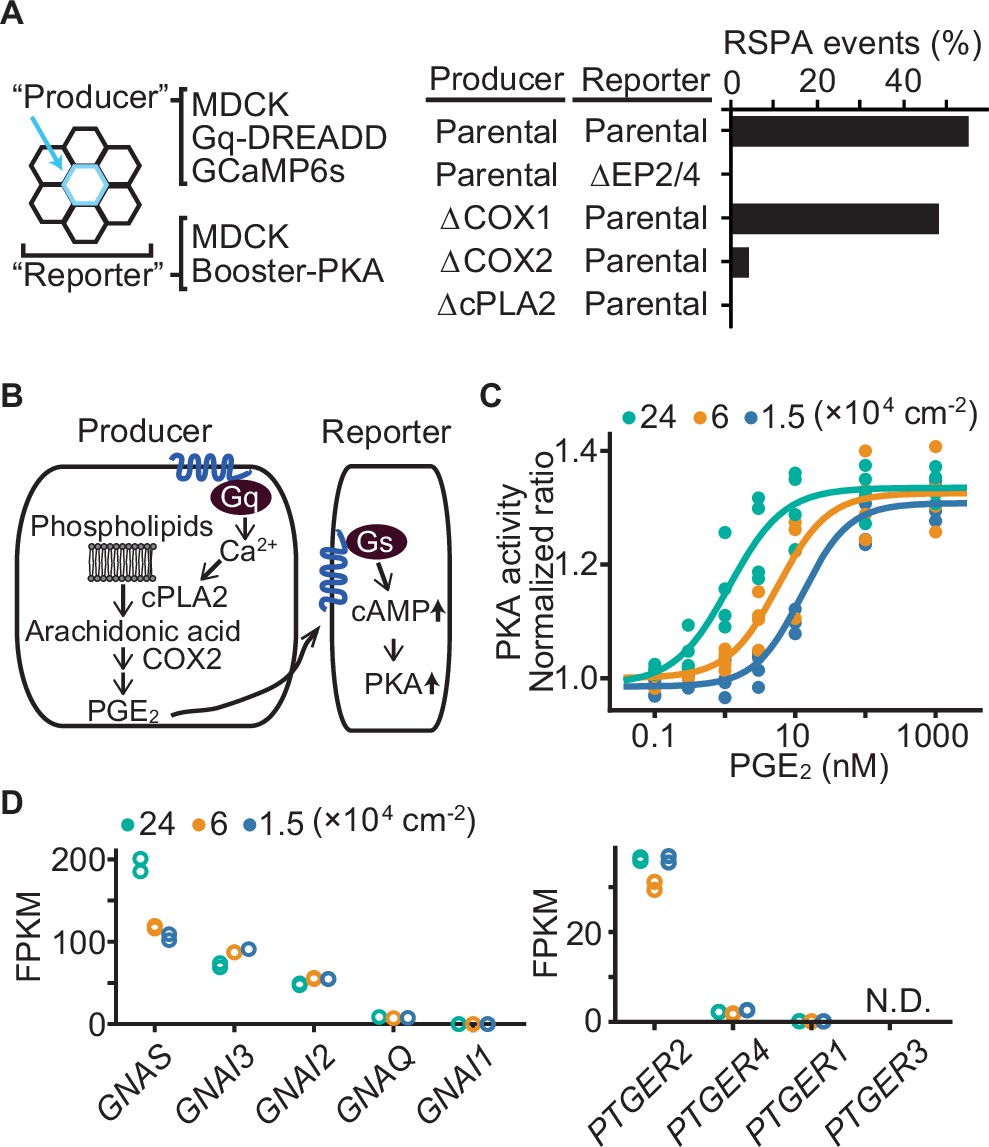
Effect of cell density on prostaglandin E2 (PGE2) sensitivity and the transcriptome.
(A) Madin–Darby canine kidney (MDCK) cells expressing Gq-DREADD and GCaMP6s were employed as the parental producer cells. Meanwhile, MDCK cells expressing Booster-PKA were employed as the parental reporter cells. The genes knocked out by CRIPSR/Cas9 system are depicted in the figure. Analysis was performed as in Figure 3G. Each producer cell exhibiting F/F0 values >3 was analyzed for the occurrence of radial spread of PKA activation (RSPA). Data from two independent experiments was summed up. (B) Inter- and intracellular pathway of RSPA. (C) COX-DKO MDCK cells expressing Booster-PKA were plated at the indicated cell density, treated with increasing concentrations of PGE2, and analyzed for PKA activity. The mKate2/mKOκ ratio representing PKA activity was calculated and plotted against PGE2 concentration. The average intensity of the whole view field of mKate2 or mKOκ, at 20–30 min after the addition of PGE2, was applied to calculate the mKate2/mKOκ ratio. Three or four independent experiments were performed. (D) COX-DKO MDCK cells were seeded at the indicated cell densities and subjected to RNA-seq analysis. FPKM values of other genes are in Figure 5—figure supplement 1. N.D. represents not detected.
Figure 5—figure supplement 1

Effect of cell density on the transcriptome.
COX-DKO Madin–Darby canine kidney (MDCK) cells were seeded at the indicated cell densities and subjected to RNA-seq analysis. FPKM values of genes related to prostaglandin E2 (PGE2) homeostasis: isoforms of phosphodiesterase (PDE), isoforms of adenylyl cyclase (ADCY), and phospholipase A2 (PLA2G4A). In agreement with previous reports, Yap target genes, CYR61, CTGF, and AXL, were suppressed at high cell density.
Figure 6 with 4 supplements
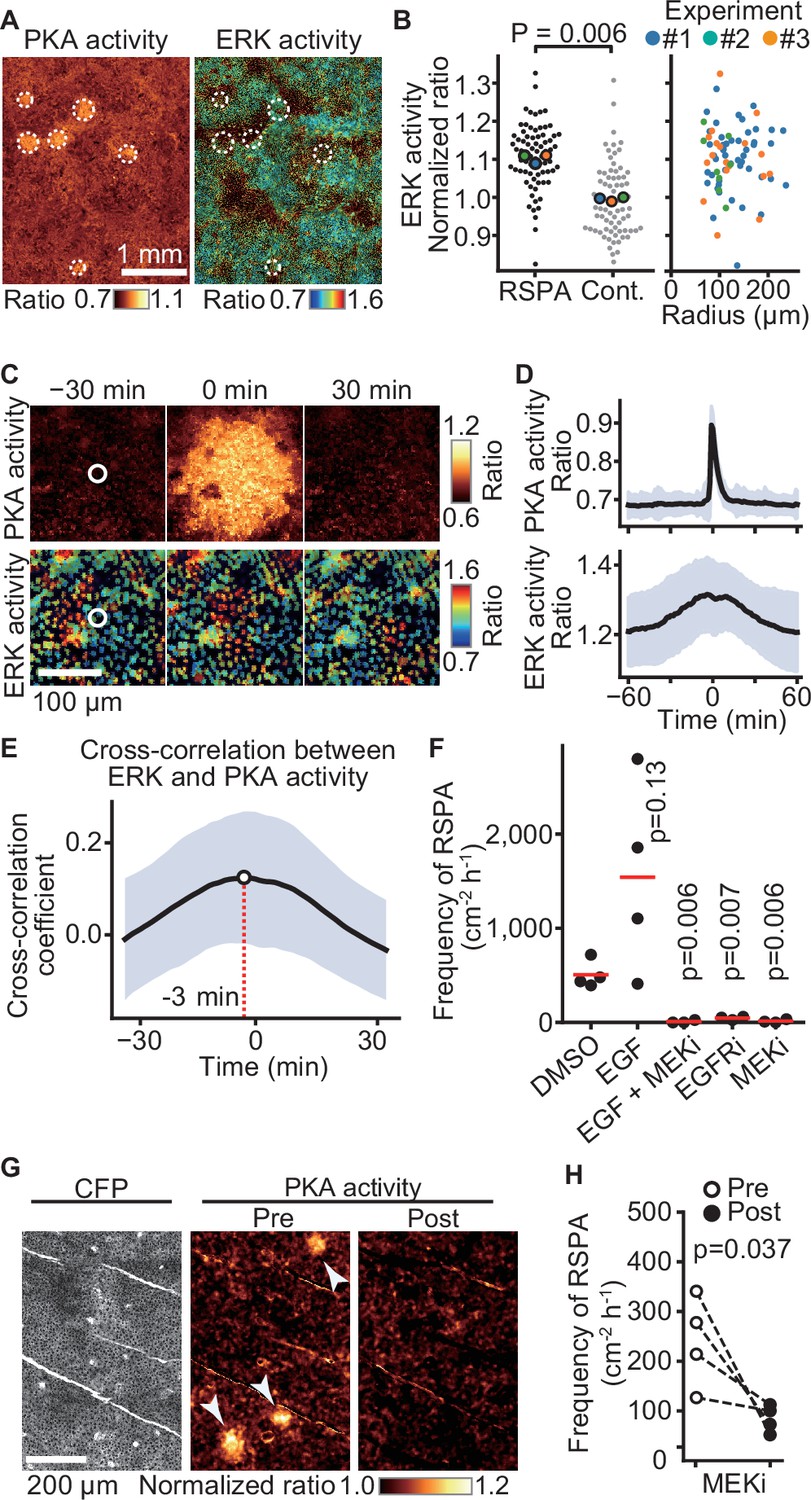
Requirement of ERK activation for radial spread of PKA activation (RSPA).
(A) Madin–Darby canine kidney (MDCK) cells expressing EKAREV and Booster-PKA were observed for ERK and PKA activities every 5 min and 1 min, respectively. The mKate2/mKOκ ratio image represents PKA activity in pseudocolor. The YPet/ECFP ratio image represents ERK activity in IMD mode. RSPA is indicated by white circles. (B) The ERK activities within 10 µm from the center of RSPA and within 10 µm from randomly set positions with a random number table generated by Python are plotted in the left panel. Each colored dot represents an average value of an independent experiment. The right scattered plot shows the relationship between ERK activity and the size of RSPA. (C) The correlation between ERK activation and RSPA is shown. This is a part of Figure 6—video 1. (D) Cross-correlation analysis of PKA and ERK activities. The average and SD values from 67 samples are shown in the black lines and blue shades, respectively. (E) Temporal cross-correlations between RSPA and ERK activation rate. The black line indicates the average temporal cross-correlation coefficients with SD. (F) MDCK cells expressing Booster-PKA were imaged in the presence of the following reagents: 0.1% v/v DMSO, 50 ng/mL EGF, 1 μM PD0325901 (MEKi), and 1 μM AG1478 (EGFRi). The frequency of RSPA was analyzed 20–80 min after the treatment. Each dot represents an individual experiment. Red lines indicate their average value. The control data set is from Figure 1F. p-Values were calculated between the labeled sample and the DMSO-treated sample. (G, H) Similar to Figure 2. Transgenic mice expressing AKAR3EV were observed under a two-photon excitation microscope and administrated a MEKi, 5 mg/kg PD0325901 intravenously. Shown are an ECFP image and a YPet/ECFP ratio image representing the cell density and PKA activity in pseudocolor, respectively. The images of PKA activity were projected over 30 min. The frequency of RSPA in pretreatment was quantitated more than 120 min before the injection. Similarly, the frequency of RSPA in a post-treatment was analyzed 15–90, 15–125, 15–85, and 15–115 min. Each dotted line represents an individual mouse experiment.
Figure 6—figure supplement 1

Representative ERK and PKA activities in the center of radial spread of PKA activation (RSPA).
Five representative plots of ERK and PKA activities in Figure 5D. Each color represents an individual RSPA.
Figure 6—figure supplement 2

Effect of MEK inhibitor on calcium transients.
Madin–Darby canine kidney (MDCK) cells expressing GCaMP6s were seeded at 1.2 × 10⁵ cells cm-2. Cells were incubated with 0.1% v/v DMSO or 1 mM PD0325901 (MEKi) for 90 min and imaged every 5 s for 20 min. Cells in interphase showing the indicated values of F/F0 peak were counted and shown as calcium transients per cell per hour. Data are from a field of view containing around 2.0 × 10⁴ cells from a single experiment.
Figure 6—video 1
Correlation of ERK activity with radial spread of PKA activation (RSPA).
The experiments described in Figure 6C are performed and analyzed.
Figure 6—video 2
Requirement of ERK activation for radial spread of PKA activation (RSPA) in vivo.
The experiments described in Figure 6G are performed and analyzed.
Figure 7
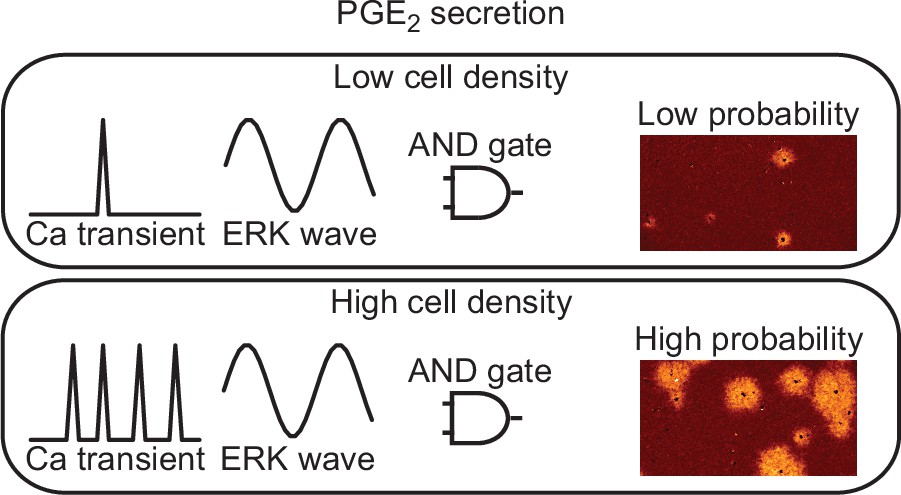
Models for prostaglandin E2 (PGE2) secretion.
The frequency of calcium transients is cell density-dependent manner. The ERK activation wave is there in both conditions. Because both calcium transient and ERK activation are required for radial spread of PKA activation (RSPA), the probability for PGE2 secretion is regulated as ‘AND gate’.
Additional files
-
MDAR checklist
- https://cdn.elifesciences.org/articles/86727/elife-86727-mdarchecklist1-v1.pdf
-
Supplementary file 1
Plasmids in this paper.
- https://cdn.elifesciences.org/articles/86727/elife-86727-supp1-v1.xlsx
-
Supplementary file 2
Primers for validating the gene knockout.
- https://cdn.elifesciences.org/articles/86727/elife-86727-supp2-v1.xlsx
-
Supplementary file 3
Cell lines.
- https://cdn.elifesciences.org/articles/86727/elife-86727-supp3-v1.xlsx
Download links
A two-part list of links to download the article, or parts of the article, in various formats.
Downloads (link to download the article as PDF)
Open citations (links to open the citations from this article in various online reference manager services)
Cite this article (links to download the citations from this article in formats compatible with various reference manager tools)
Calcium transients trigger switch-like discharge of prostaglandin E2 in an extracellular signal-regulated kinase-dependent manner
eLife 12:RP86727.
https://doi.org/10.7554/eLife.86727.3


