Adaptive biasing of action-selective cortical build-up activity by stimulus history
- Section Computational Cognitive Neuroscience, Department of Neurophysiology and Pathophysiology, University Medical Center Hamburg-Eppendorf, Germany
- Charité – Universitätsmedizin Berlin, corporate member of Freie Universität Berlin and Humboldt-Universität zu Berlin, Department of Psychiatry and Neurosciences, Germany
- Charité – Universitätsmedizin Berlin, corporate member of Freie Universität Berlin and Humboldt-Universität zu Berlin, Department of Child and Adolescent Psychiatry, Germany
- Bernstein Center for Computational Neuroscience, Charité – Universitätsmedizin Berlin, Germany
Figures
Figure 1 with 3 supplements
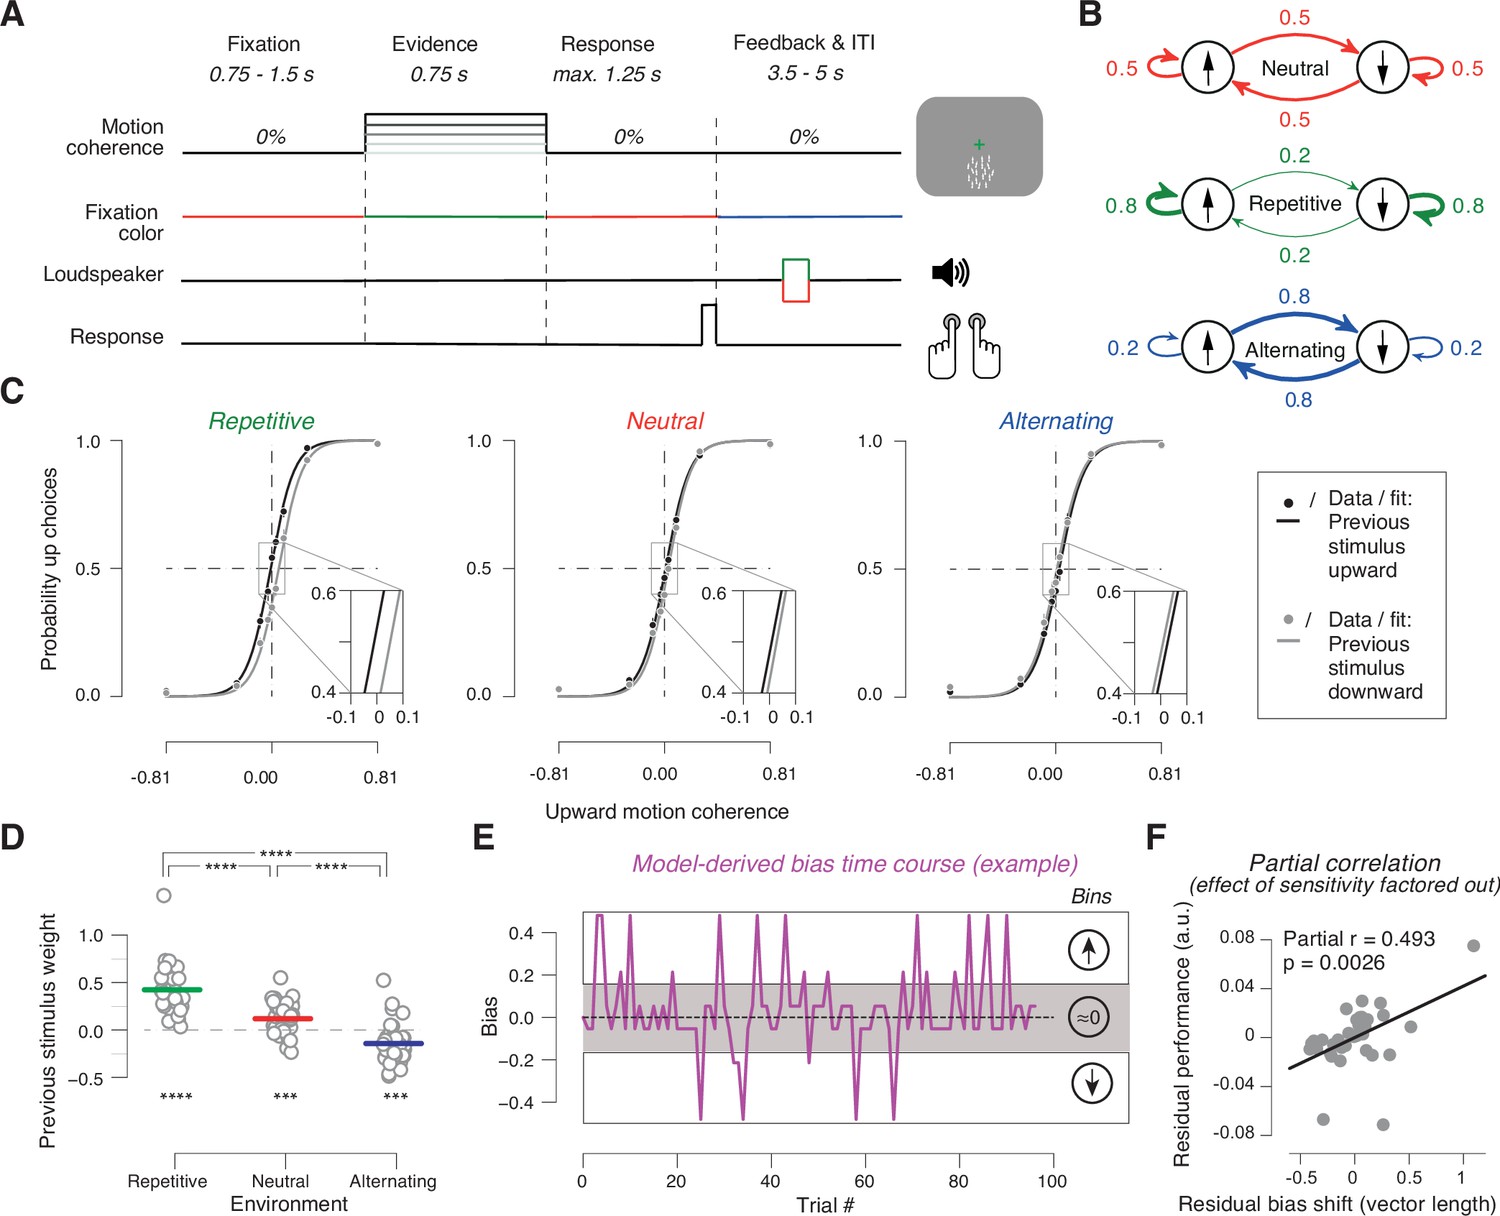
Task and behavior in the different sensory environments.
(A) Time course of events during a trial. Participants judged the net direction of motion of random dot kinematograms with varying levels of motion coherence and direction. 0% coherent motion was presented throughout the trial. Color switch of fixation cross indicated the onset of the decision interval with coherent motion (or 0% coherence on some trials). After 0.75 s, the color of the fixation cross switched back to red, to prompt the choice. After the button-press or 1.25 s deadline, the fixation cross turned blue indicating the variable inter-trial interval with auditory feedback. (B) Manipulation of stimulus environments through variation of repetition probability of motion direction across trials. Repetition probability was 0.8 (repetitive), 0.5 (neutral), or 0.2 (alternating). Adapted from Braun et al., 2018, B; Creative Commons Attribution License Creative Commons Attribution 4.0 International. The copyright holder has granted permissions to publish under CC BY 4.0 licence. (C) Psychometric functions conditioned on previous stimulus category (group average), for the three environments (n = 38). Vertical lines, SEM (most are smaller than data points); insets, close-ups of the part in rectangle around 0% coherence indicating the systematic shift of history bias between the environments. (D) Impact of previous stimulus categories on current choice for lag 1. Circles refer to values from individual participants. Lines refer to group means. ***p<0.001, ****p<0.0001 two-tailed permutation test. (E) Single-trial history bias estimates for an example participant and block from the neutral environment. Positive values correspond to a bias for choice ‘up’ and negative values correspond to a bias for choice ‘down’. The magnitude indicates the strength of the bias. When binned into three bins of equal size, the low bin contains trials with a bias for choice ‘down’, the medium bin contains trials with a bias around zero, and the high bin contains trials with a bias for choice ‘up’. (F) Bias adjustment improves performance. Partial regression (Pearson correlation) between length of the vector of previous choice weights plotted against previous stimulus weights between repetitive and alternating in Figure 1—figure supplement 2A and proportion of correct choices averaged across repetitive and alternating while factoring out the effect of sensitivity. Data points are the residuals from two separate regressions: length of vector difference on sensitivity (x-axis) and sensitivity on proportion correct (y-axis).
Figure 1—figure supplement 1

Best fitting model orders for behavioral history bias.
Best fitting model orders, defined as number of lags n of the history bias terms of the logistic regression model (Materials and methods), were determined via a cross-validation procedure, separately for each individual and for the three different environments. Shown are histograms of the resulting model orders across subjects, separated by sensory environment. Dashed vertical lines, mean of model orders (black), and model order determined from mean of likelihoods (gray).
Figure 1—figure supplement 2

Patterns of individual stimulus history biases across environments.
(A) Impact of previous choices versus impact of previous stimulus categories on current choice for lag 1. Green dots and blue triangles refer to values from individual participants in repetitive and alternating, respectively. Gray lines connect values from both environments. Green and blue arrows indicate shift of group averages from neutral (red x) during repetitive and alternating, respectively. Positive weights corresponded to tendency to repeat, and negative weights to tendency to alternate previous choice (x) or stimulus category (y). Angles of vectors from the origin to individual data points differed from uniform in neutral (z=7.536, p=0.0004; Rayleigh’s test). Individual vector angles of shift from neutral differed from uniform in repetitive (z=19.382, p<0.0001) and alternating (z=21.287, p<0.0001; Rayleigh’s test), with a difference in shift between both environments (F(2,34) = 75.79, p<0.0001, Hotelling test). (B) History kernels quantifying the impact of previous stimulus categories on current choice as a function of lag, for the three environments. Circles and thin lines, individual subjects; thick lines, group average. Circles are drawn for subjects whose best fitting lag is 1. The predominant effect of sensory environment is evident at lag 1.
Figure 1—figure supplement 3
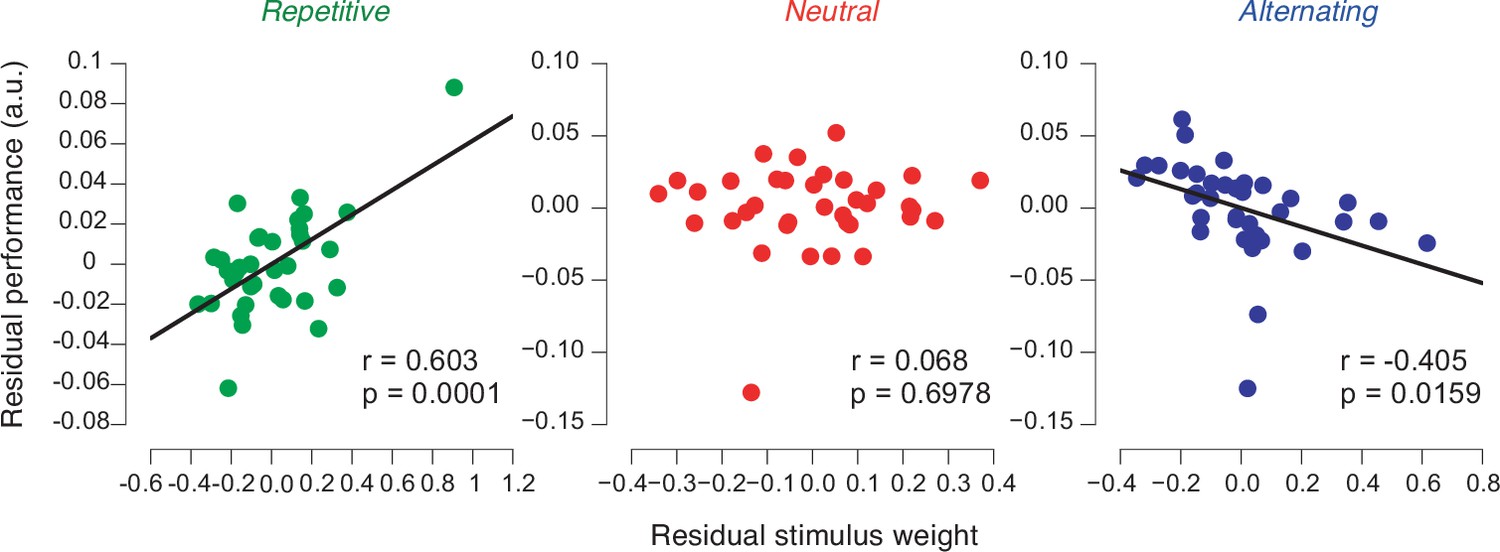
Performance in biased environments depends on strength of previous stimulus weights.
Partial correlation analysis (Pearson correlation) between previous stimulus weights and individual performance in each environment after factoring out the correlation of both variables with perceptual sensitivity (see main text, Materials and methods). Data points are the residuals from two separate regressions: previous stimulus weight on sensitivity (x-axis) and sensitivity on proportion correct (y-axis).
Figure 2 with 2 supplements
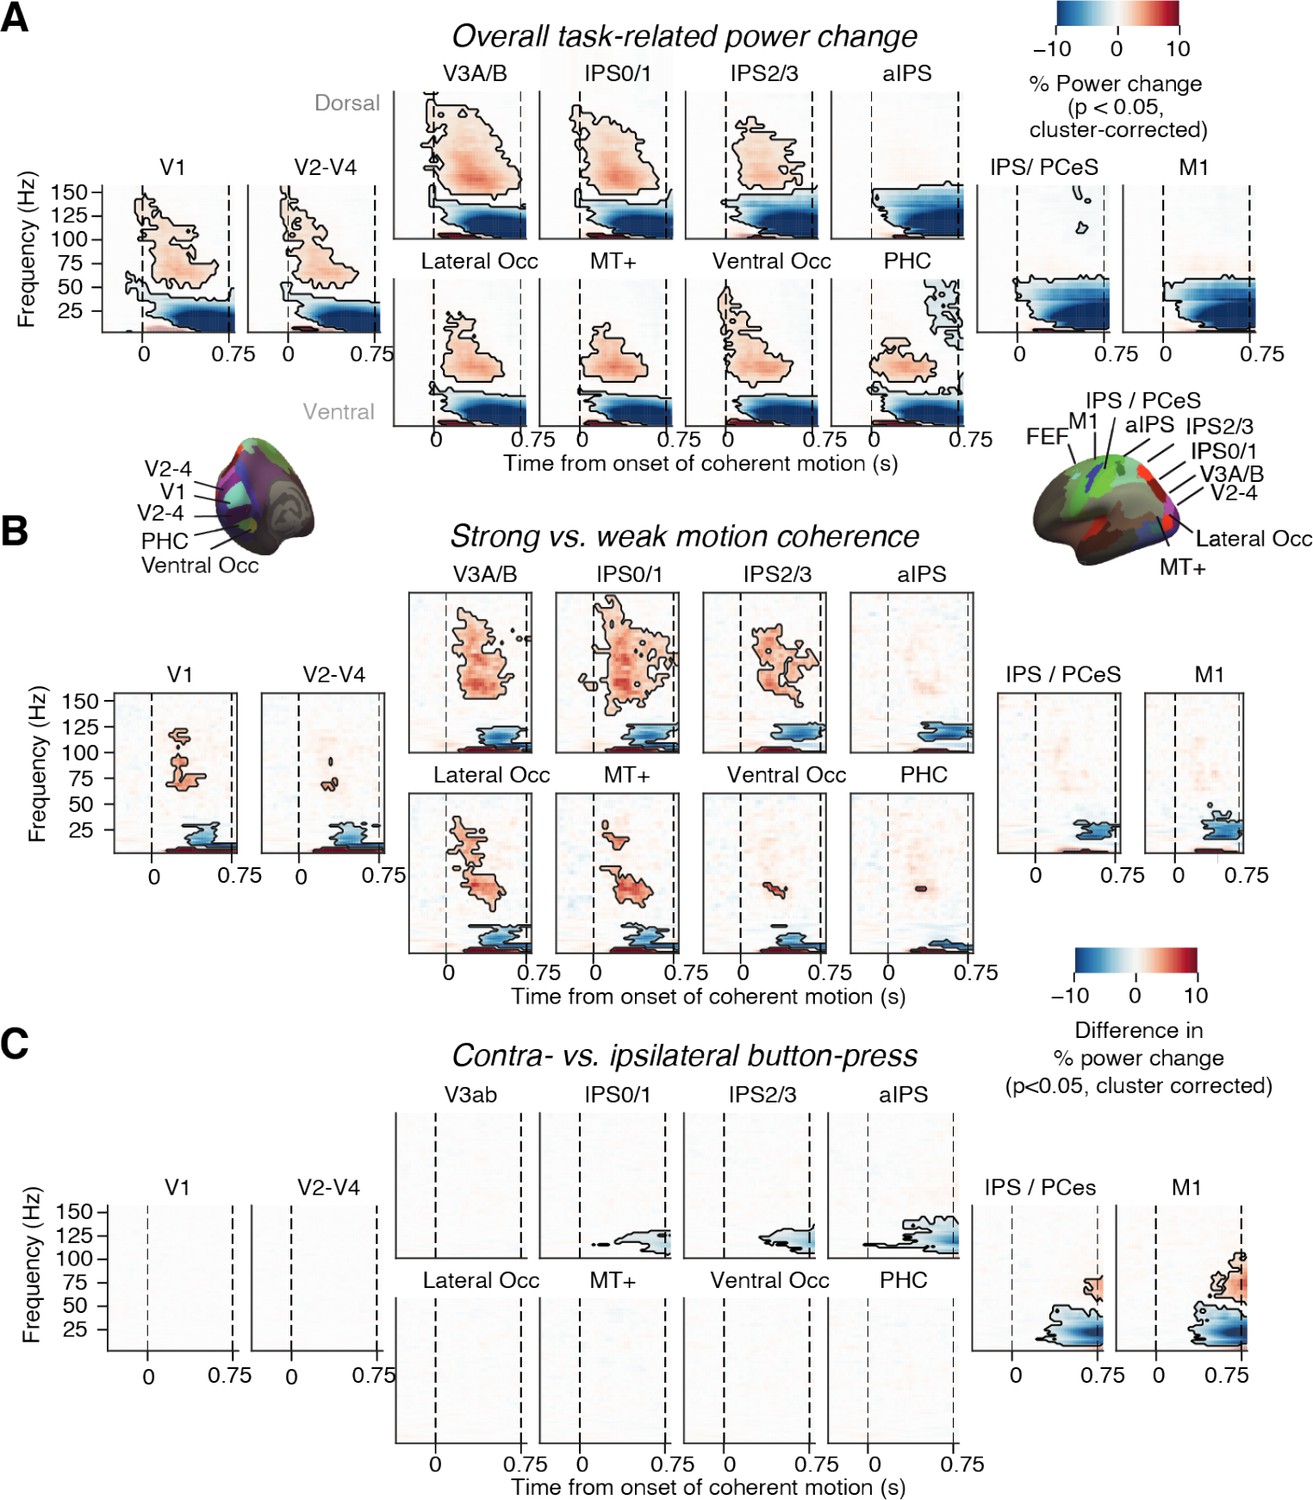
Neural signatures of stimulus processing and action planning across the cortical visuo-motor pathway.
(A) Overall task-related power change (average across hemispheres). Increase in visual gamma-band response and decrease in alpha- and low-beta-band power in visual cortex during presentation of coherently moving dots. (B) Motion coherence-specific sensory response. Difference in time-frequency response between high (0.81%) and 0% motion coherence (average across hemispheres). Increase in visual gamma-band power and decrease in alpha- and low-beta-band power scale with motion coherence of stimulus. (C) Time-frequency representation of action-selective power lateralization contralateral vs. ipsilateral to upcoming button-press. All signals are expressed as percentage of power change relative to the pre-trial baseline. Dashed vertical lines, onset and offset of coherent motion. Saturation, significant time-frequency clusters (p<0.05, two-tailed cluster-based permutation test).
Figure 2—figure supplement 1
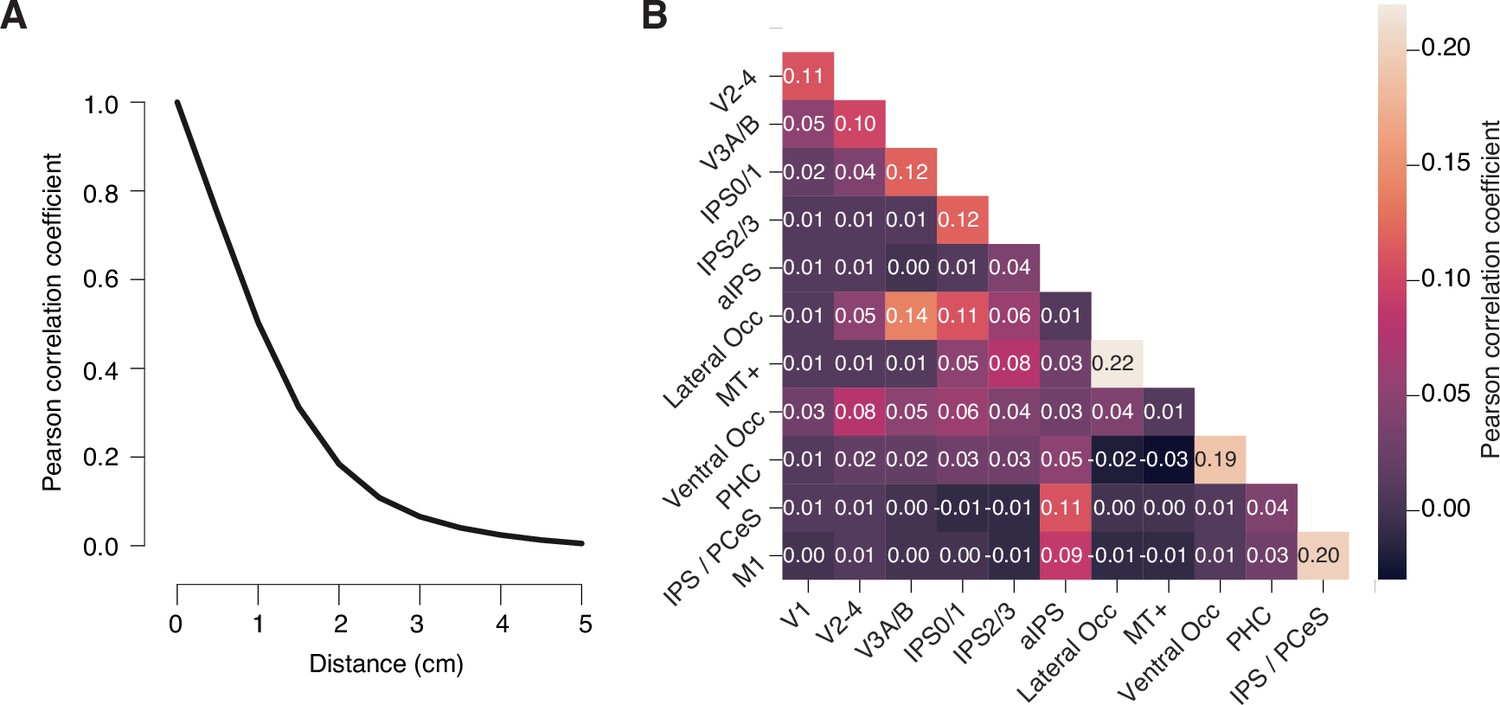
Correlation of linearly constrained minimum variance (LCMV) beamformer weights.
(A) Pearson correlation coefficient of LCMV beamformer (i.e., spatial filter) weights as a function of distance between vertices. (B) Matrix of Pearson correlation coefficients of beamformer weights for all pairs of regions of interest from Figure 2. Numbers on top of each cell are the correlation coefficients for that cell. All values in A and B are group average correlations (see Materials and methods) (n = 36); shaded areas in A, SEM (narrower than black line). Filter correlations between all regions of interest (ROIs) were small overall (r ≤ 0.22 for all ROI pairs in the group average matrix). As expected, filter correlations were largest for immediately neighboring ROIs and negligible (r<0.1) for all except three ROI pairs separated by at least one ROI in between.
Figure 2—figure supplement 2

Action-selective motor cortical activity ramps up to a larger amplitude during the stimulus interval for correct vs. error but converges at same level before choice.
Time course of action-selective beta-power (12–36 Hz) lateralization in the M1 hand area, contralateral vs. ipsilateral to upcoming button-press, collapsed across trials separately for correct (dark gray) and error (light gray) responses locked to stimulus onset (left) and locked to choice (right) (n = 36). Shaded areas, SEM. Bars, p<0.05 (two-tailed cluster-based permutation test) across participants.
Figure 3
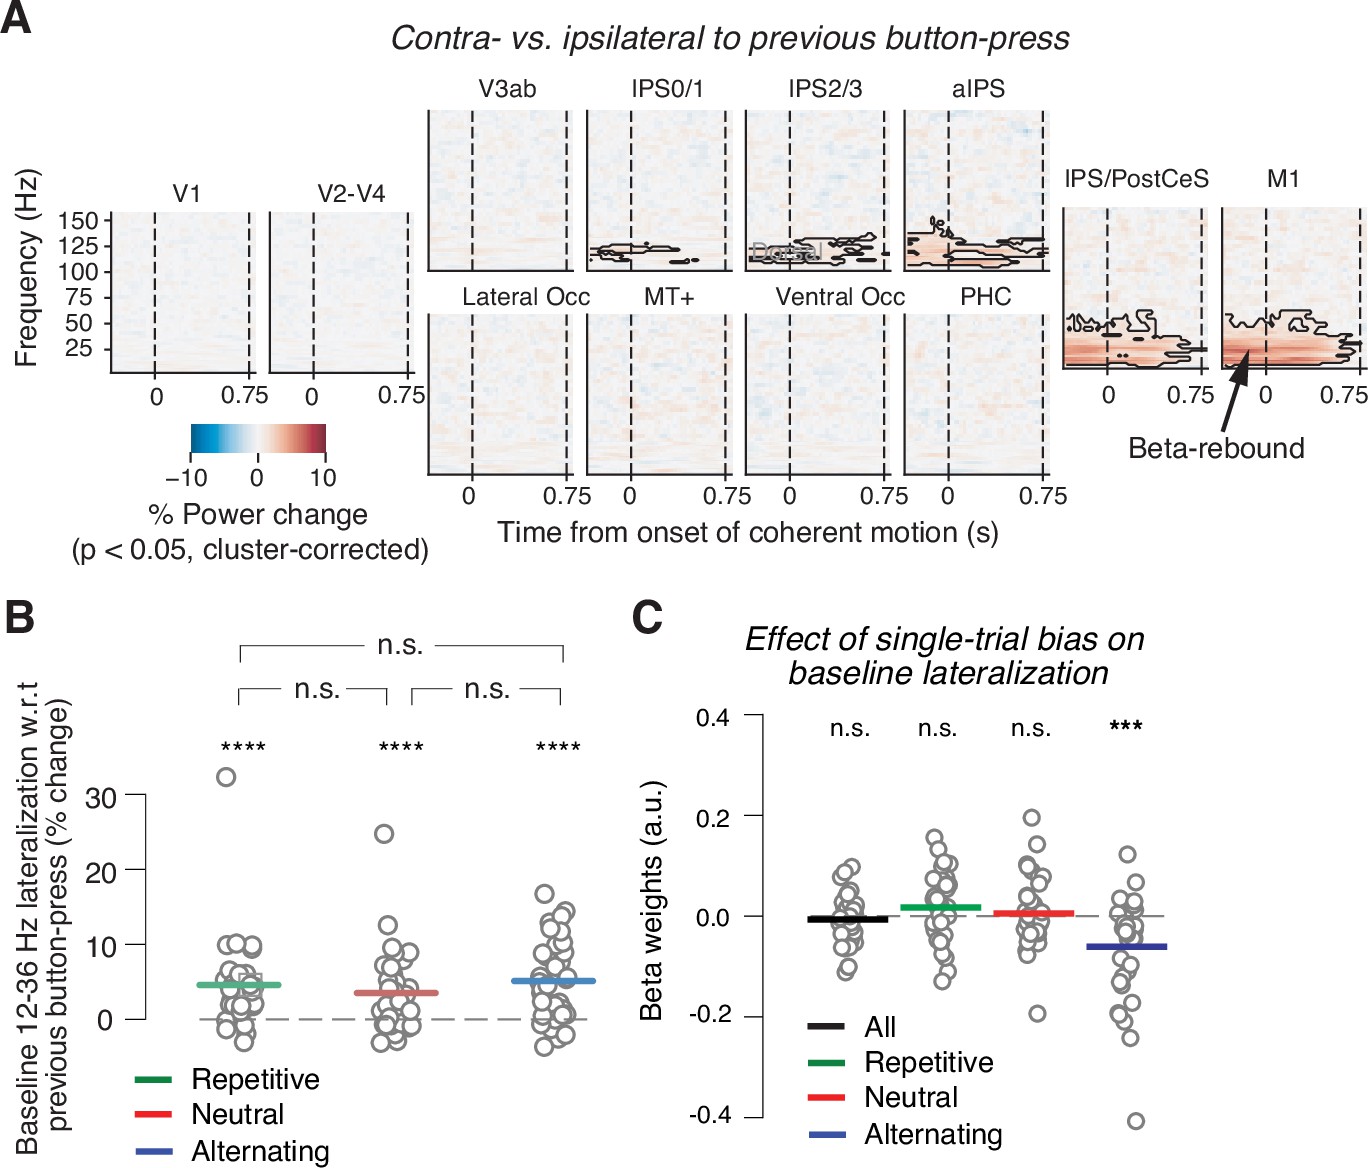
Baseline state of motor cortex reflects previous choice, but not consistently context or history bias.
(A) Spill-over of action-selective beta-power rebound from previous into current trial. Time-frequency representation of power lateralization contra- vs. ipsilateral to the previous button-press, expressed as percentage power change from baseline. Enhanced beta-band power contra- vs. ipsilateral to the previous button-press in motor cortices. Dashed vertical lines mark the onset and offset of coherent motion. Saturation, significant time-frequency clusters (p<0.05), two-tailed cluster-based permutation test across participants. (B) Impact of sensory environment on overall baseline state of beta lateralization (350 to 100 ms before stimulus onset) contra- vs. ipsilateral to previous button-press. (C) Impact of single-trial history bias on amplitude of M1 beta lateralization (relative to up-coding hand) during baseline interval (from 350 to 100 ms before evidence onset). ***p<0.001, ****p<0.0001 (two-tailed permutation test).
Figure 4 with 1 supplement
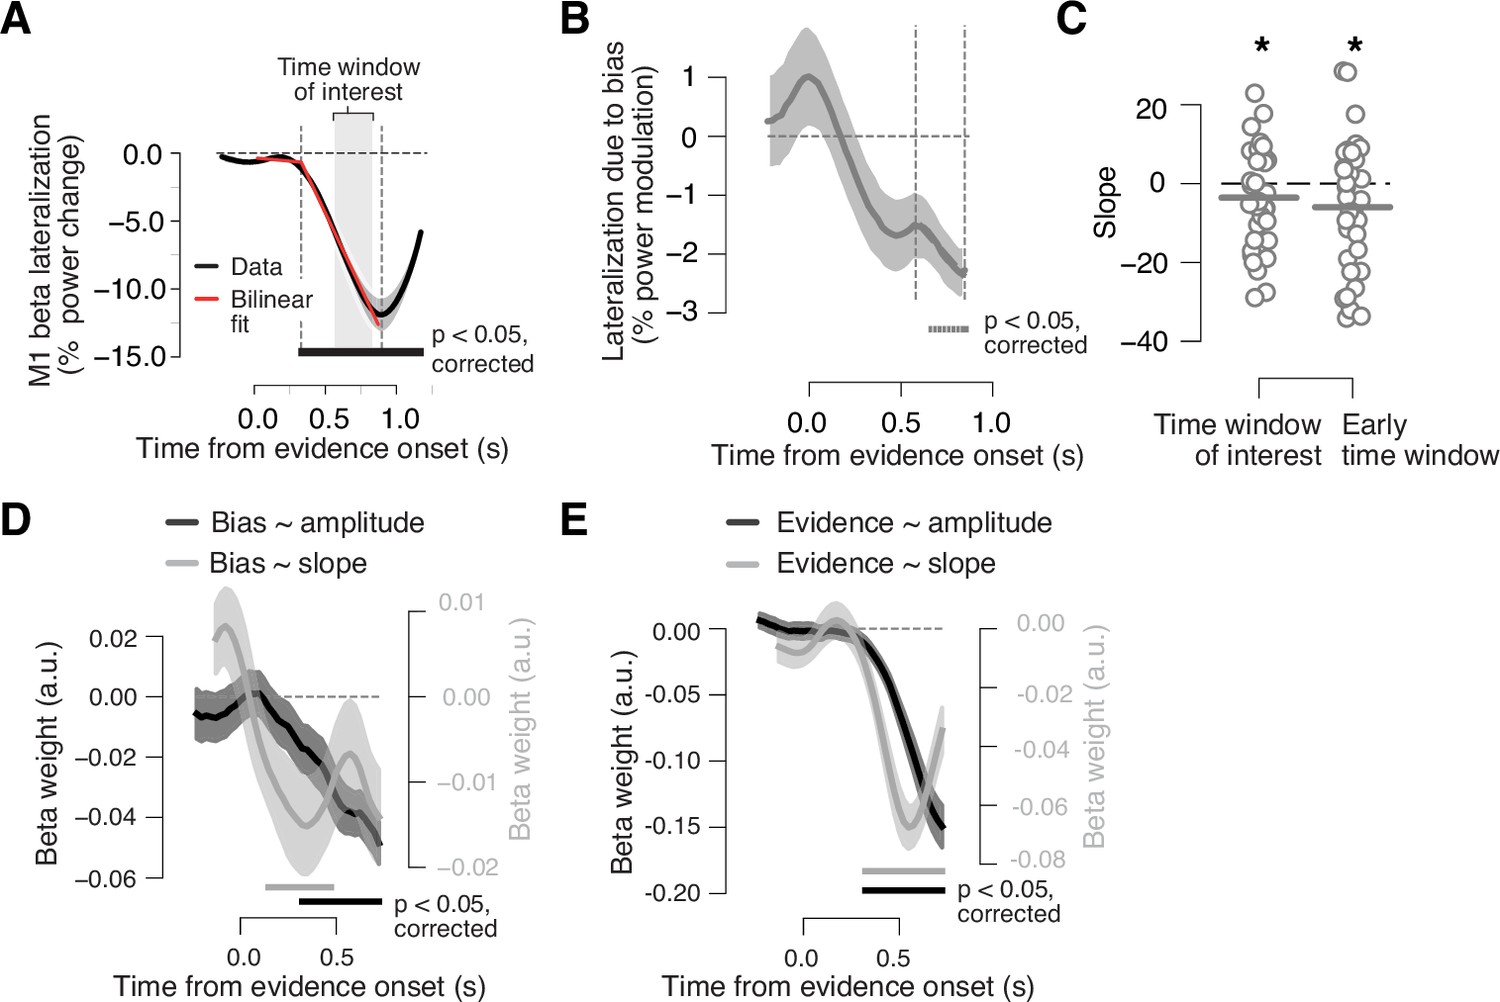
Adaptive biasing of action-selective build-up activity in M1.
(A) Time course of action-selective beta-power (12–36 Hz) lateralization in the M1 hand area, contralateral vs. ipsilateral to upcoming button-press, collapsed across trials (black line). Red line, bilinear fit. Gray box, time window (0.58 to 0.8475 s from evidence onset) used to quantify the (rate of) build-up of power lateralization in panels B and C (vertical dashed lines in B). The window was defined to start 250 ms after the intersection point of bilinear fit and end 50 ms before the minimum of power lateralization, chosen so as to cover the interval containing ramping activity in the majority of trials. (B) Component of action-selective lateralization governed by single-trial bias, irrespective of upcoming behavioral choice and pooled across sensory environments (see main text for details). (C) Slope estimates for neural bias measures from panel B. Left, time window from panel A. Right, early time window derived from single-trial regression in panel D. (D) Time-variant impact of single-trial history bias on amplitude (black) and slope (gray) of M1 beta lateralization (relative to up-coding hand). (E) Same as D but for impact of signed stimulus strength. N = 36; shaded areas, SEM. Bars, p<0.05 (two-tailed cluster-based permutation test) across participants. *p<0.05 (one-tailed paired permutation test).
Figure 4—figure supplement 1

Subsampling procedure does not change distribution of coherences.
Distribution of coherences for up (top row) and down choices (bottom row) averaged across the low and high single-trial bias bins before (left column) and after subsampling (right column) to yield an equal number of up and down choices within each single-trial bias bin in Figure 4B and C (n = 36). We averaged across the low and high single-trial bias bins because this average is also shown in Figure 4B and C. Error bars, SEM.
Author response image 1

Proportion correct and motion coherence split by environment and consistency of current choice and previous stimulus.
In the Repetitive environment (Rep.), accuracy and motion coherence are larger for current choice consistent vs. inconsistent with previous stimulus category and vice versa in the Alternating environment (Alt.).
Additional files
Download links
A two-part list of links to download the article, or parts of the article, in various formats.
Downloads (link to download the article as PDF)
Open citations (links to open the citations from this article in various online reference manager services)
Cite this article (links to download the citations from this article in formats compatible with various reference manager tools)
Adaptive biasing of action-selective cortical build-up activity by stimulus history
eLife 12:RP86740.
https://doi.org/10.7554/eLife.86740.3


