Imaging microglia surveillance during sleep-wake cycles in freely behaving mice
- PKU-Nanjing Institute of Translational Medicine, Nanjing Raygen Health, China
- National Platform for Medical Engineering Education Integration, Southeast University, China
- Jiangsu Key Laboratory of Molecular and Functional Imaging, Department of Radiology, Zhongda Hospital, Medical School, Southeast University, China
- Key Laboratory of Developmental Genes and Human Diseases, Department of Histology Embryology, Medical School, Southeast University, China
- Institute of Basic Medical Sciences Chinese Academy of Medical Sciences, School of Basic Medicine Peking Union Medical College, China
- Research Unit of Mitochondria in Brain Diseases, Chinese Academy of Medical Sciences, PKU-Nanjing Institute of Translational Medicine, China
- Academy of Advanced Interdisciplinary Study, College of Engineering, Peking University, China
- State Key Laboratory of Membrane Biology, Beijing Key Laboratory of Cardiometabolic Molecular Medicine, Peking-Tsinghua Center for Life Sciences, Institute of Molecular Medicine, College of Future Technology, Peking University, China
- National Biomedical Imaging Center, State Key Laboratory of Membrane Biology, Peking-Tsinghua Center for Life Sciences, College of Future Technology, Peking University, China
Figures
Figure 1 with 3 supplements
Imaging microglial surveillance in the somatosensory cortex in freely moving mice.
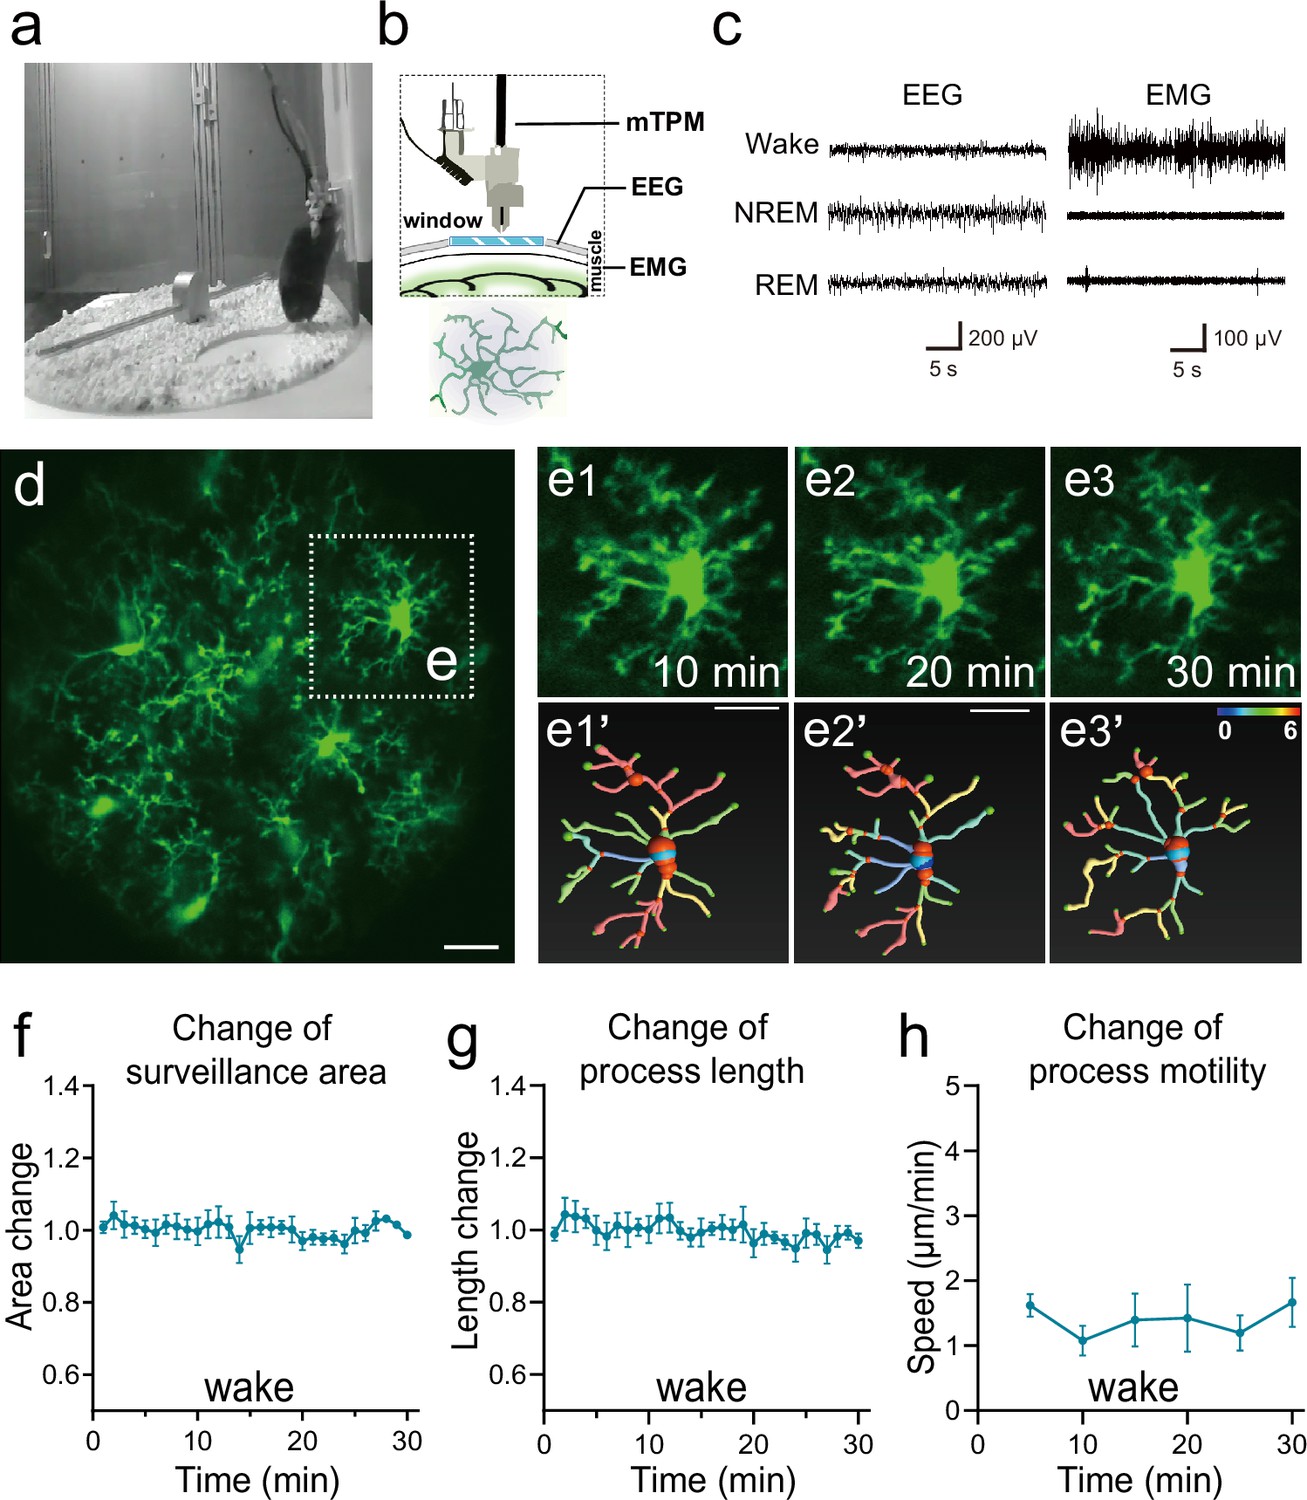
(a–c) Experimental setup. The animal was head-mounted with a miniature two-photon microscope (mTPM) and electroencephalography (EEG)/electromyography (EMG) electrodes and behaved freely in a cylindrical chamber (a). Microglia expressing green fluorescent protein (GFP) in the somatosensory cortex were imaged through a cranial window using the mTPM (b) and the sleep/wake state of the animal was simultaneously monitored using an EEG/EMG recording system (b–c). (d-e) Microglial morphological dynamics when the animal was awake. A representative image with a field-of-view (FOV) of 220 μm × 220 μm. (e1–e3) Expanded views of selected microglia in box from (d) at 10 min (e1), 20 min (e2), and 30 min (e3) of continuous recording. (e1'-e3') Microglial process graphs digitally reconstruction for e1-e3 using Imaris software. In Figure e1′-e3′, the branch points of processes are represented in red and the number of different branches of the whole cell is represented as gradient colors. (f–h) Quantitative analysis of changes in microglia surveillance area (f), process length (g), and process motility, indexed by the speed of the extension and retraction at endpoints of the processes (h). Note that the gross morphology of microglia remained largely unchanged over a 30 min time frame in the wake state, despite significant motility at the ends of the processes. Scale bars, 25 μm. n=12 cells from three mice.
Figure 1—figure supplement 1
Microglia dynamics imaging and analysis in freely behaving mice.
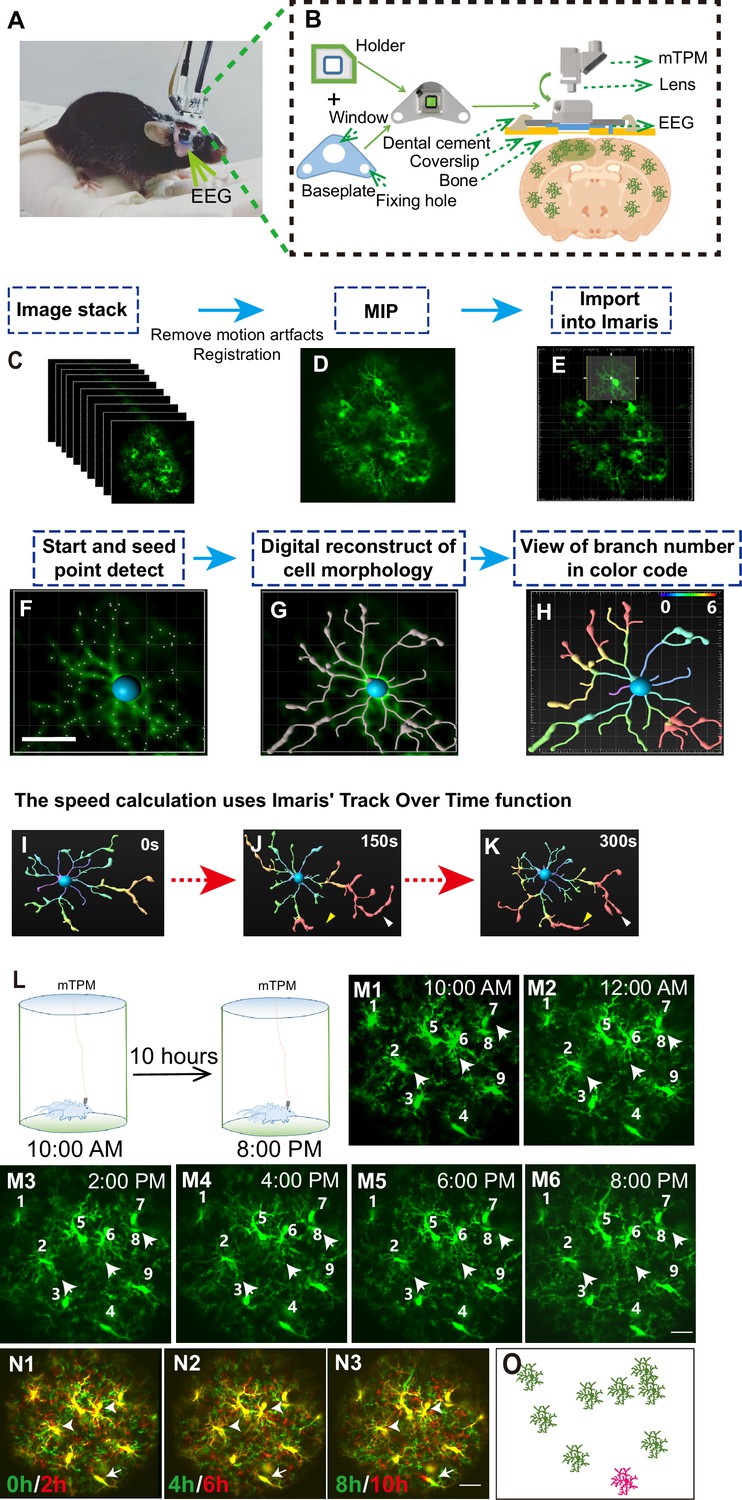
(A) Head-mounting of the miniature two-photon microscopy (mTPM). Picture of a free-moving mouse with a head-mounted mTPM and electroencephalography (EEG)/electromyography (EMG) recording electrodes. (B) Cartoon illustration showing that the mTPM headpiece was mounted onto an assembly consisting of a baseplate plus a holder glued onto a glass coverslip over a cranial window. Initially, the headpiece was screw-fastened to its holder, and their placement on the baseplate was fine-adjusted using a triaxial motorized stage when the animal was immobilized on an imaging stage. The holder was then fixed to the baseplate with dental cement once a proper field-of-view (FOV) was located. The animal could then be released and left to move freely in a mouse cage. After an imaging session, the dismounting of the headpiece was made easy by unscrewing and unplugging it from the holder. (C–K) Pipeline for microglial surveillance analysis. (C–D) An image stack (5 min, 1500 frames) pre-processed using ImageJ software to correct for motion artifacts and to align them using the StackReg plugin. In the case of multi-plane imaging, consecutive z-stacks were first each compressed to single xy projections. A maximum-intensity projection (MIP) was created from the final stack for morphological analysis. (E) Importing the MIP image to Imaris software and setting ROIs (region of interest) to encompass selected cells with clear cell bodies and processes. (F–H) For a given cell, Autopath’s algorithm was used to find the right starting point and seed point. The radius of the process was measured by the shortest distance algorithm. Microglial processes were digitally reconstructed from the calculated seed point and process radius. Each branch was color-coded by its branch point number. (I–K) Process endpoint speed was calculated through Imaris’ track-over-time function, the average absolute speed is given by track length divided by time of tracking. Yellow and white arrowheads in (G) and (K) show elongating and contracting process ends, respectively. Scale bars, 20 μm. (L–O) An example illustrating long-term imaging of microglia in freely behaving mice. (L) Experimental setup. While the animal was roaming freely in the cage, time-lapse mTPM images were obtained continually at 5 FPS, starting from 10:00 AM and ending at 8:00 PM. (M) mTPM images of microglia at different time points. Note that no signs of photodamage or photobleaching are caused by long-enduring in vivo mTPM imaging. All images shown correspond to the wake states of the animal. Numerals identify individual microglia. (N–O) Overlay of images in (M) paired at 2 hr time intervals. Arrows mark the translocation of a cell body (cell number 4). Cartoon in (O) shows that only 1 out of 9 microglia cells exhibited local motility (pink) with the rest (green) position unchanged over the duration of observations. Scale bars, 30 μm.
Figure 1—video 1
Imaging data of a 1 hr continuous recording of somatosensory cortex in a freely behaving mouse.
The frame rate of image acquisition was 5 Hz. Raw data with 10-frame averaging (field-of-view of 220 μm × 220 μm). Scale bar, 30 μm.
Figure 1—video 2
Correction for xy motion artifacts (field-of-view of 220 μm × 220 μm).
Scale bar, 30 μm.
Figure 2 with 1 supplement
Microglial surveillance is state-dependent in the sleep-wake cycle.
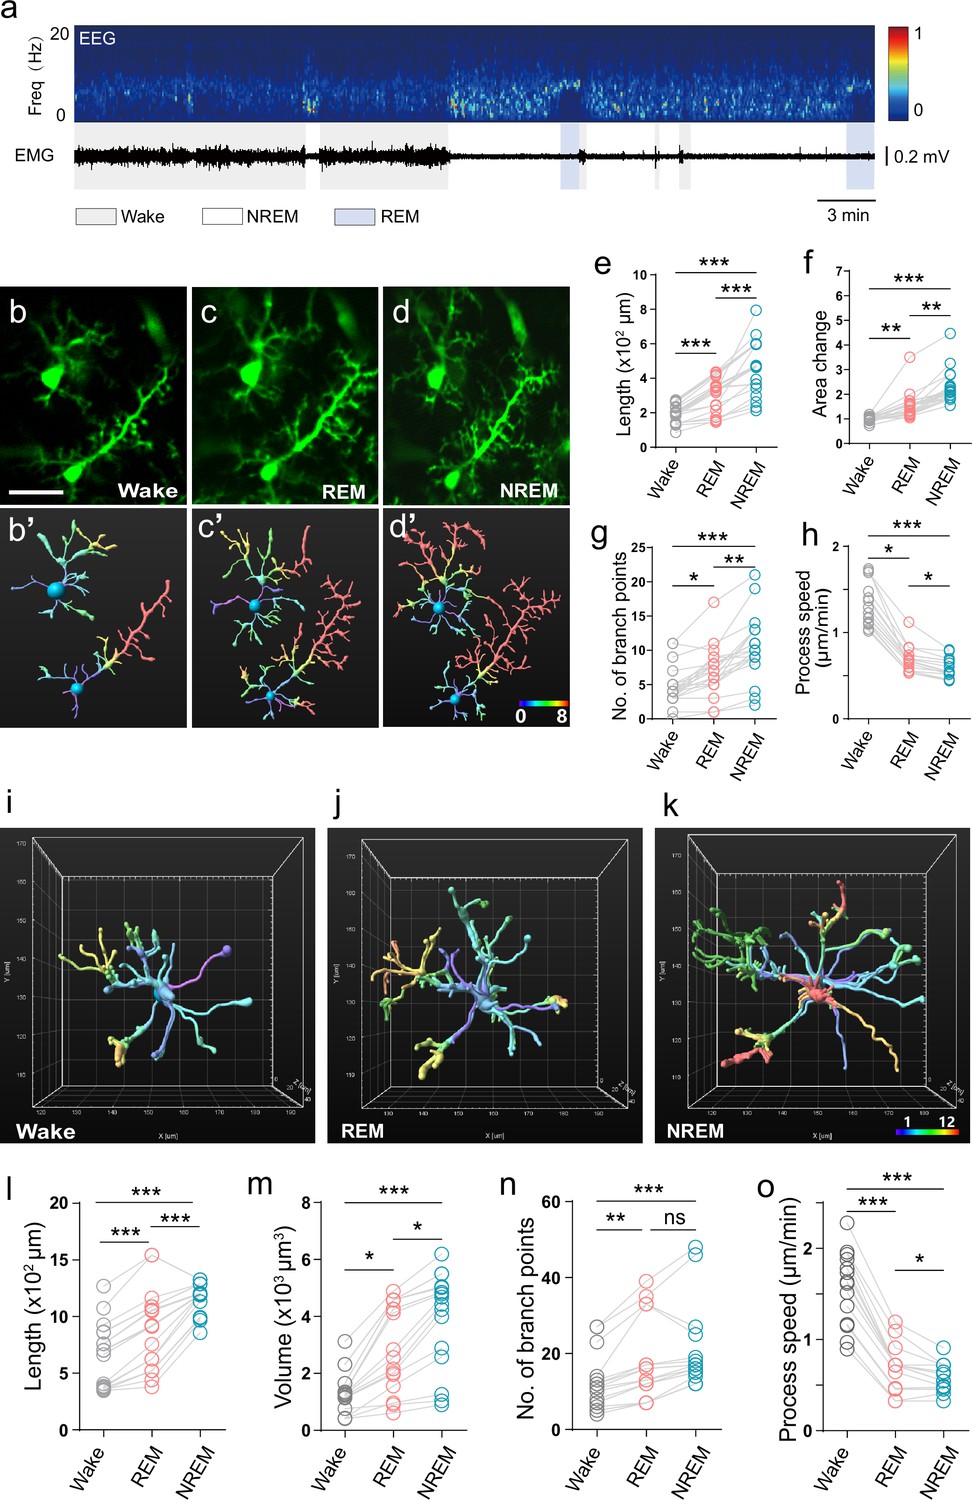
(a) Representative electroencephalography (EEG)/electromyography (EMG) recordings showing the sleep-wake stage switch. Top, EEG power spectrogram (0–20 Hz). Middle, EMG trace. Bottom, brain states are classified as wake (color code: gray), rapid eye movement (REM) (blue), and non-rapid eye movement (NREM) (white). (b–d) Representative microglial morphological changes during the sleep-wake cycle. (b′-d′) Microglial morphology reconstructed from b-d using Imaris software. (e–h) Microglial morphological parameters, length (e), area change (f), number of branch points (g), and process endpoint speed (h), all exhibited brain state-dependent dynamic change. One-way ANOVA with Tukey’s post-hoc test in e; Friedman test with Dunn’s post-hoc test in f–h; n=20 cells from seven mice for each group (e–g), n=15 cells from six mice for each group (h); *p<0.05, **p<0.01, ***p<0.001. (i–o) 3D multi-plane imaging and reconstruction of microglial morphology. A 3D electrical tunable lens (ETL) lens was used to acquire multi-plane imaging (220 μm × 220 μm × 40 μm) at Z-intervals of 2 μm, at a rate of 7.5 stacks/5 min. (i–k) 3D reconstructed microglial morphology in wake (i), REM (j), and NREM (k) states, with corresponding time stamps shown at the bottom. (l-o) Quantitative analysis of microglial length (l), volume change (m), number of branch points (n), and process motility (o) based on multi-plane microglial imaging. Data from 3D imaging corroborated state-dependent changes of microglial morphology in the sleep-wake cycle. Scale bars, 30 μm. One-way ANOVA with Tukey’s post-hoc test in l, o; Friedman test with Dunn’s post-hoc test in m, n; n=17 cells from 7 mice for each group (l-n), n=15 cells from six mice for each group (o); *p<0.05, **p<0.01, ***p<0.001.
Figure 2—figure supplement 1
Multiplane imaging of microglial surveillance and changes of microglial surveillance under anesthesia.
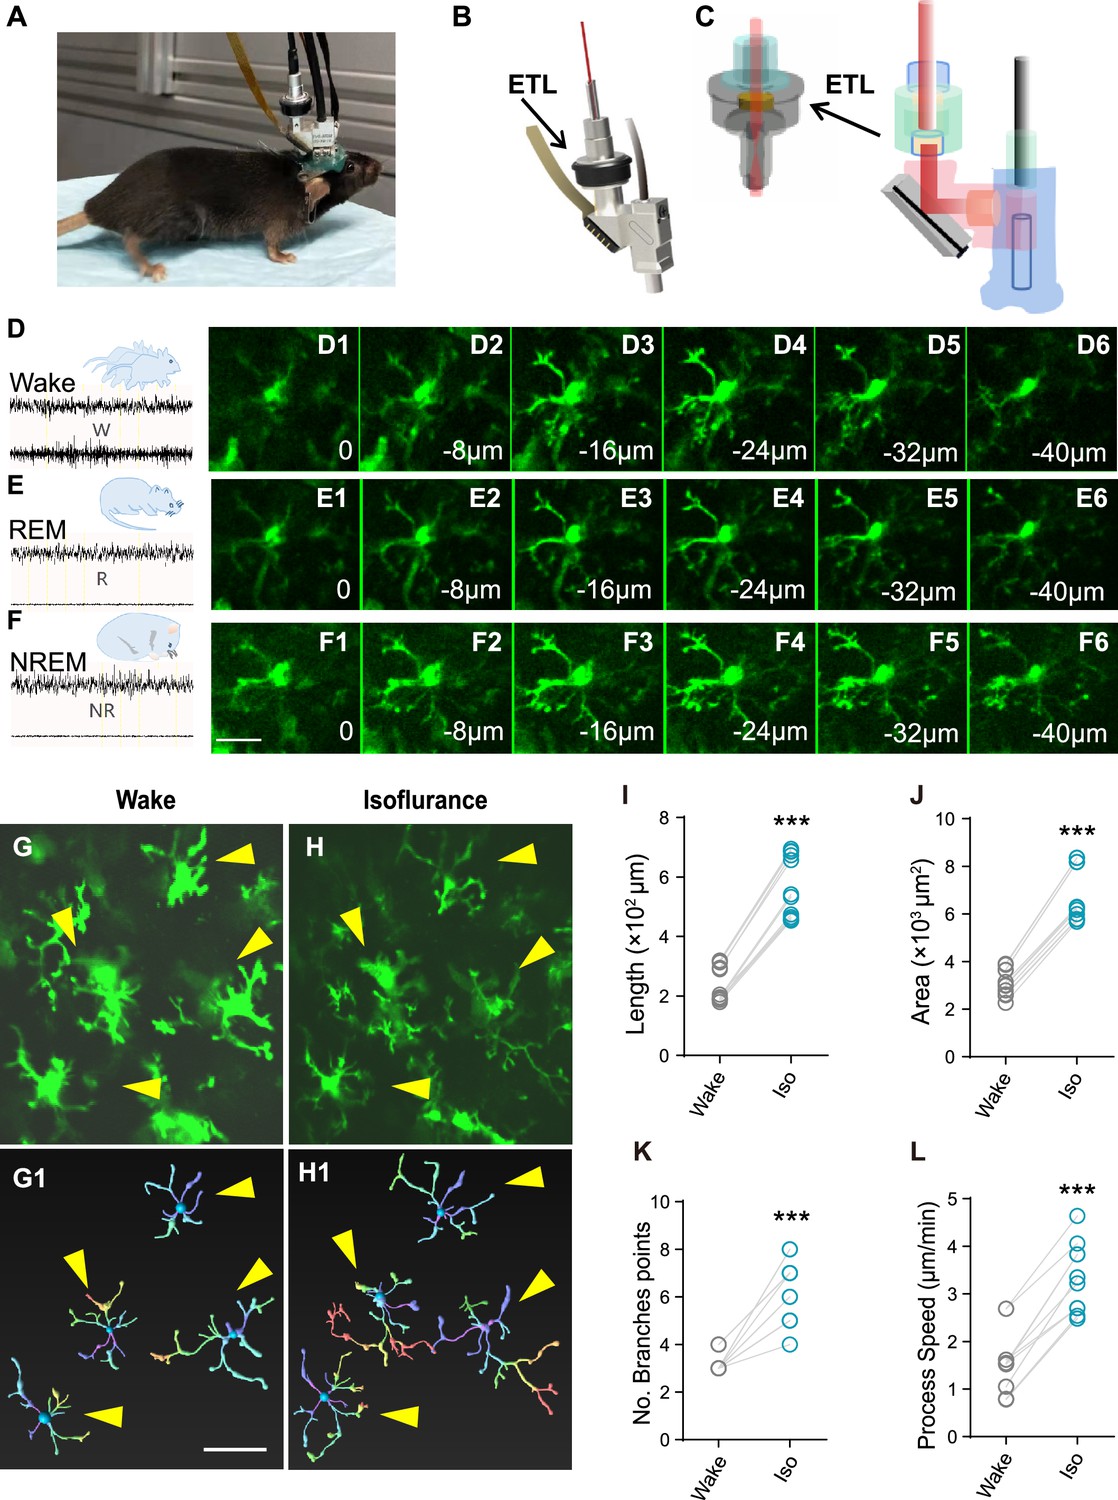
(A) Freely behaving mouse wearing an miniature two-photon microscopy (mTPM) integrated with an electrical tunable lens (ETL). (B–C) Schematic of the ETL assembled into the headpiece. The ETL (EL-3–10, Optotune, Dietikon, Switzerland) provided a Z-level change of ~45 μm, allowing for multi-plane imaging. (D–F) Multi-plane imaging at different wake-sleep states: wake (D), rapid eye movement (REM) (E), and non-rapid eye movement (NREM) (F). The z-stack could then be used for correction of z-drift artifacts and for 3D analysis of microglial surveillance. Scale bar, 15 μm. (G–L) Changes of microglial surveillance under anesthesia. (G–H) Representative micrographs of microglia under wake and anesthetized states. (G1–H1) Digitally reconstructed microglial morphology corresponding to G-H. (I–L) Changes of microglial process length (I), area (G), number of branch points (K), and process endpoints speed (L) induced by anesthesia. paired t-test. Scale bar, 30 μm. ***p<0.001, Wake versus Iso. n=12 cells from three mice for each group.
Figure 3 with 1 supplement
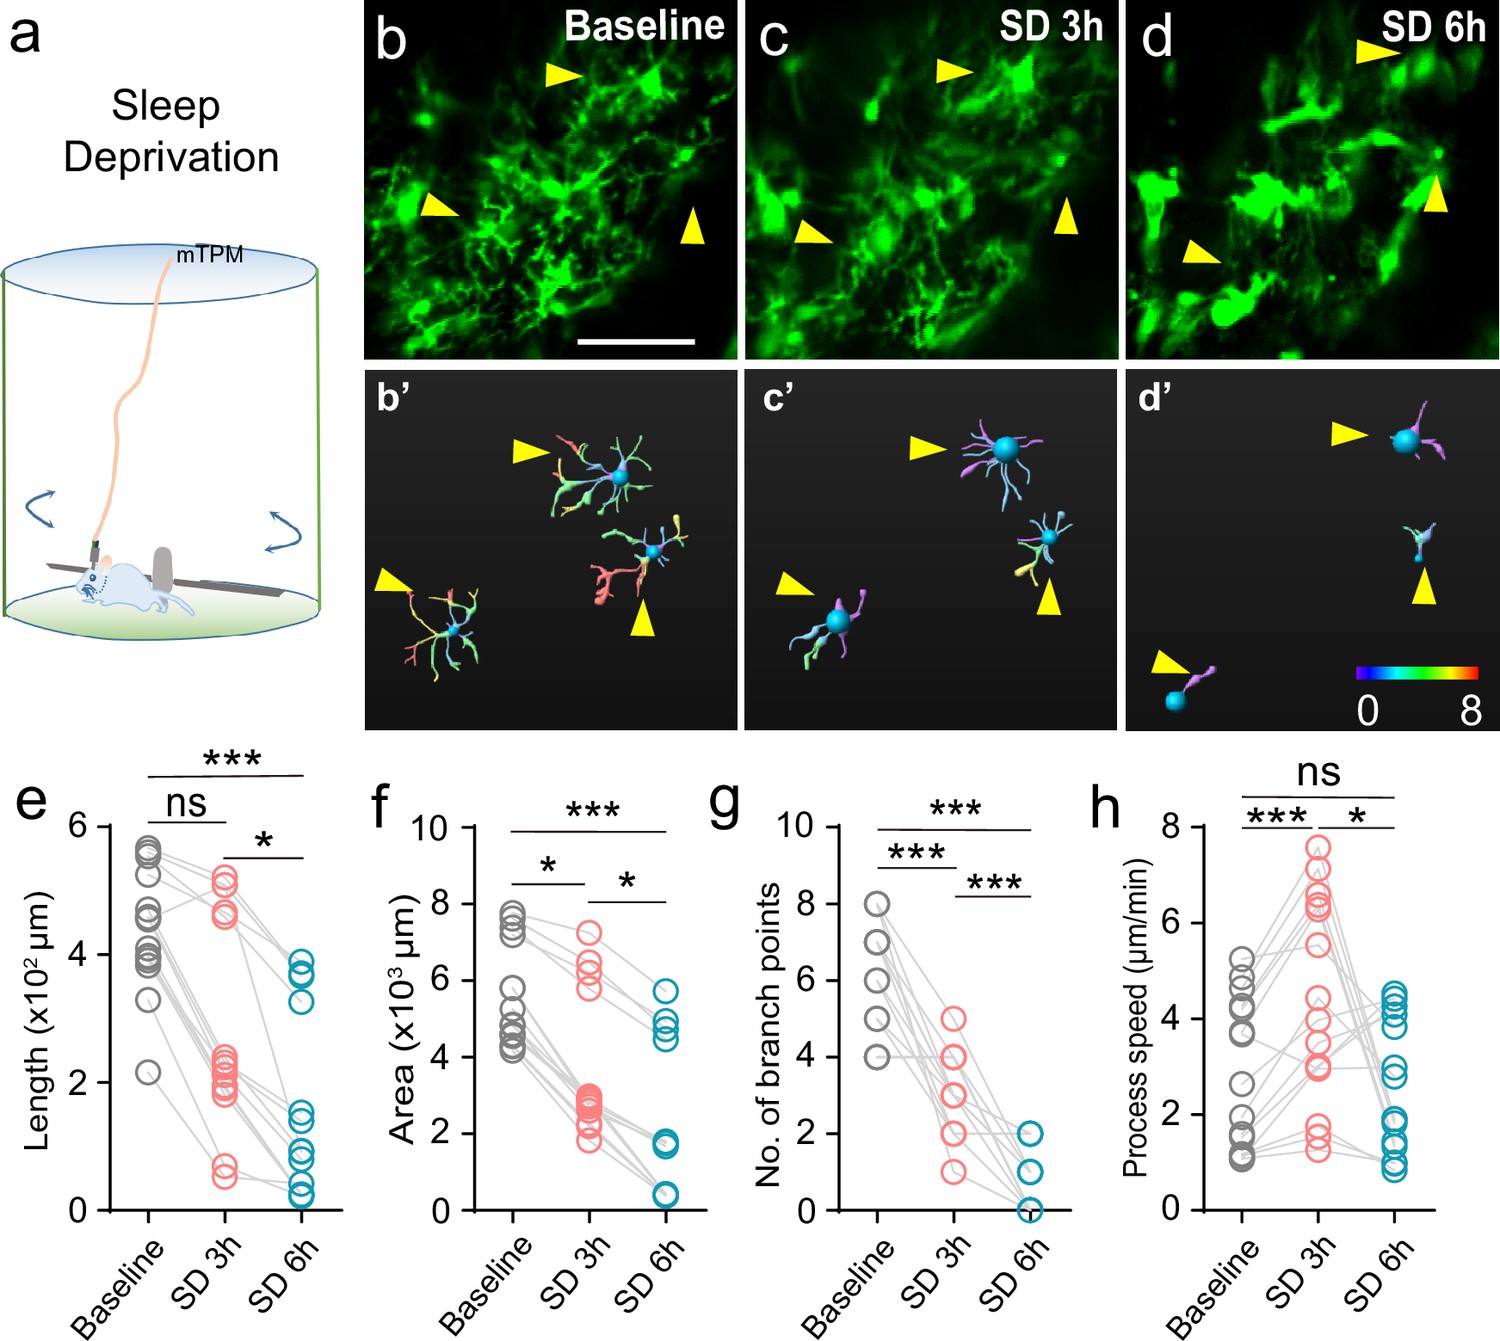
Changes of microglial surveillance in the state of sleep deprivation.
(a) Experimental setup for sleep deprivation. Sleep deprivation in mice was achieved by forcing them to exercise and interrupting their sleep with the rotation of a 46 cm rod (18 turns/min) in the chamber (diameter 50 cm). (b–d) Microglial processes contracted after sleep deprivation (SD), baseline (b), SD 3 hr (c), and SD 6 hr (d). (b′-d′) Morphological changes of microglia reconstructed using Imaris software. b'-d' correspond to b-d, respectively. (e–h) Statistics for length (e), area (f), number of branch points (g), and process motility (h). Scale bars, 30 μm. One-way ANOVA with Tukey’s post-hoc test in g, h; Friedman test with Dunn’s post-hoc test in e, f; n=15 cells from six mice for each group; *p<0.05, ***p<0.001.
Figure 3—figure supplement 1
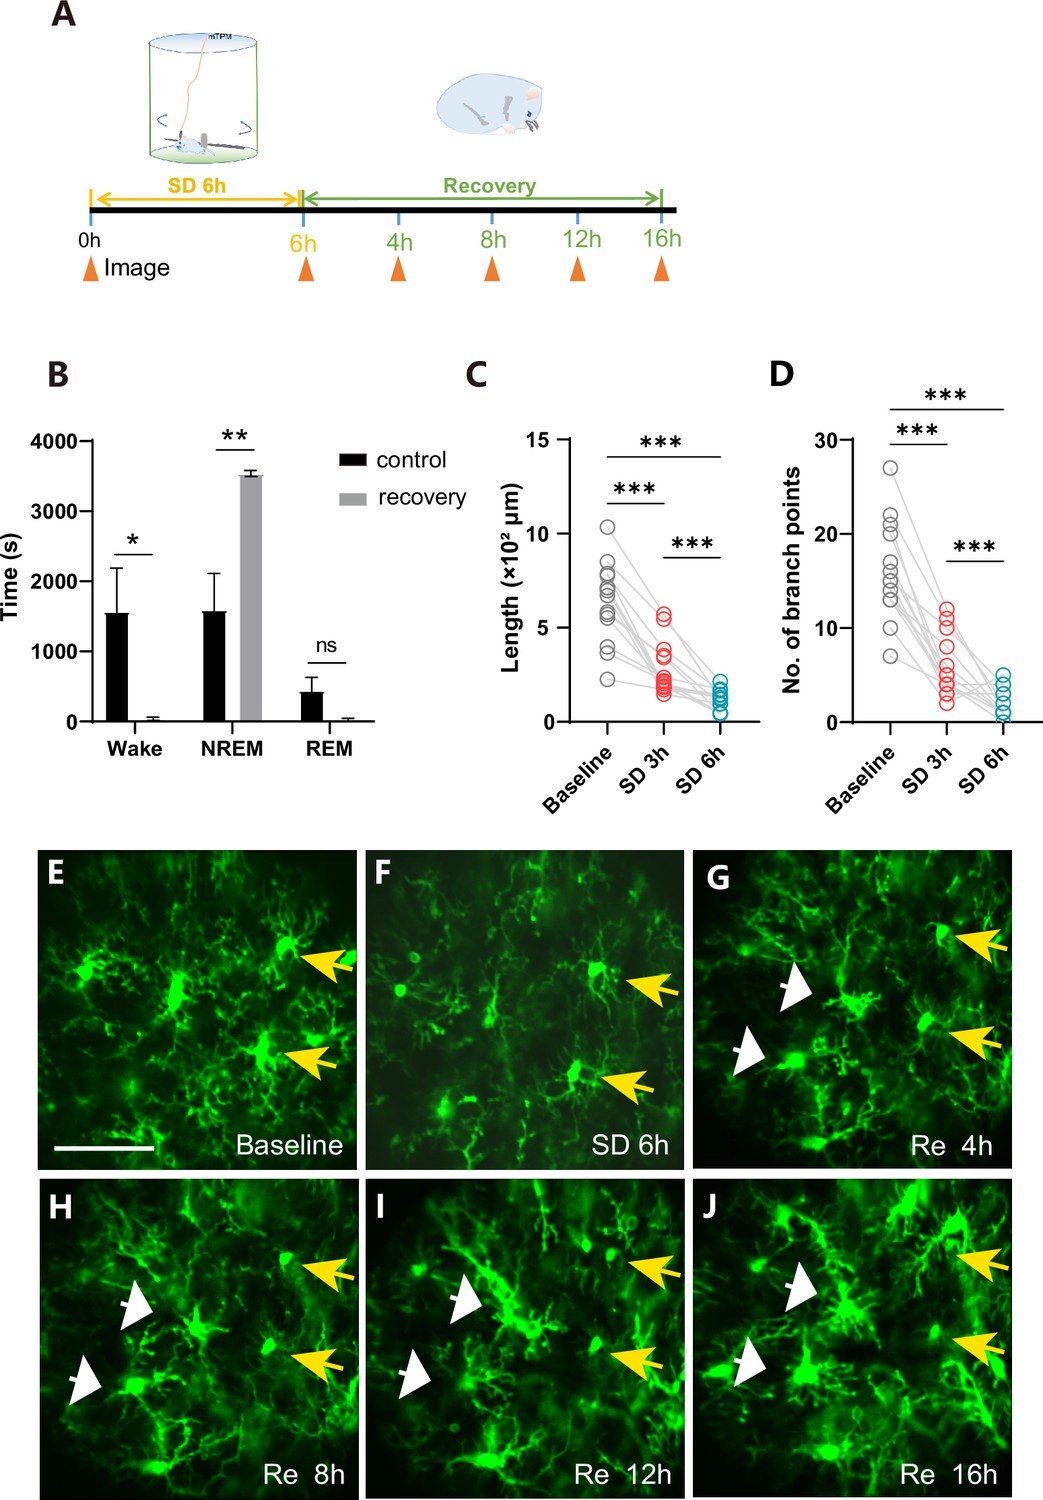
Changes of microglial surveillance in the state of sleep deprivation and recovery.
(A) Experimental setup for sleep deprivation and recovery. (B) Altered sleep-wake homeostasis during recovery from sleep deprivation (zeitgeber time 2–8). Recovery was during zeitgeber time 9–10. unpaired t-test. ns, not significant, *p<0.05, **p<0.01. n=4 mice for each group. (C–D) Quantitative analysis of microglial length (C) and number of branch points (D) based on multi-plane microglial imaging. One-way ANOVA with Tukey’s post-hoc test. n=14 cells from three mice for each group, ***p<0.001. (E–J) Microglial processes contracted after sleep deprivation (SD) and partially restored during recovery (Re), baseline (E), SD 6 hr (F), Re 4 hr (G), Re 8 hr (H), Re 12 hr (I), and Re 16 hr (J). Scale bars, 30 μm.
Figure 4
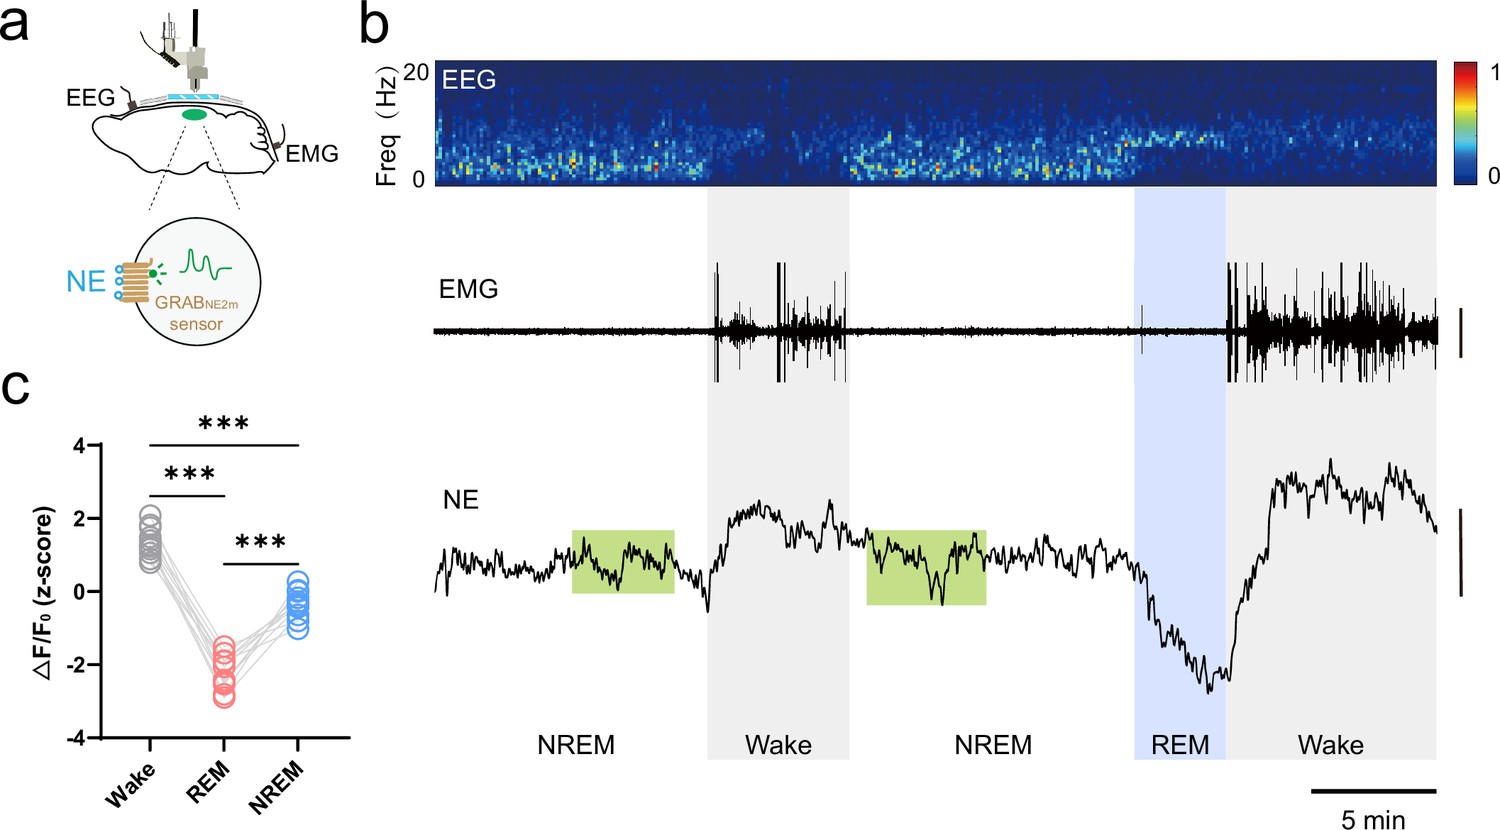
Norepinephrine (NE) dynamics in mouse somatosensory cortex during the sleep-wake cycle.
(a) Schematic diagram depicting miniature two-photon microscopy (mTPM) recording of extracellular NE indicated by the GRABNE2m sensor expressed in neurons. (b) Representative traces of simultaneous recordings in the somatosensory cortex during the sleep-wake cycle in freely behaving mice. Electroencephalography (EEG) and its power spectrogram (0–20 Hz); electromyography (EMG) (scale, 50 μV); NE signals reflected by the z-score of the GRABNE2m fluorescence (scale, 2 z-score). The brain states are color-coded (wake, gray; non-rapid eye movement (NREM), white; REM, blue; NE oscillatory during NREM sleep, green). (c) Mean extracellular NE levels in different brain states. Data from the same recording are connected by lines. ***p<0.001, one-way ANOVA with Tukey’s post-hoc test (n=11 from three mice).
Figure 5 with 1 supplement
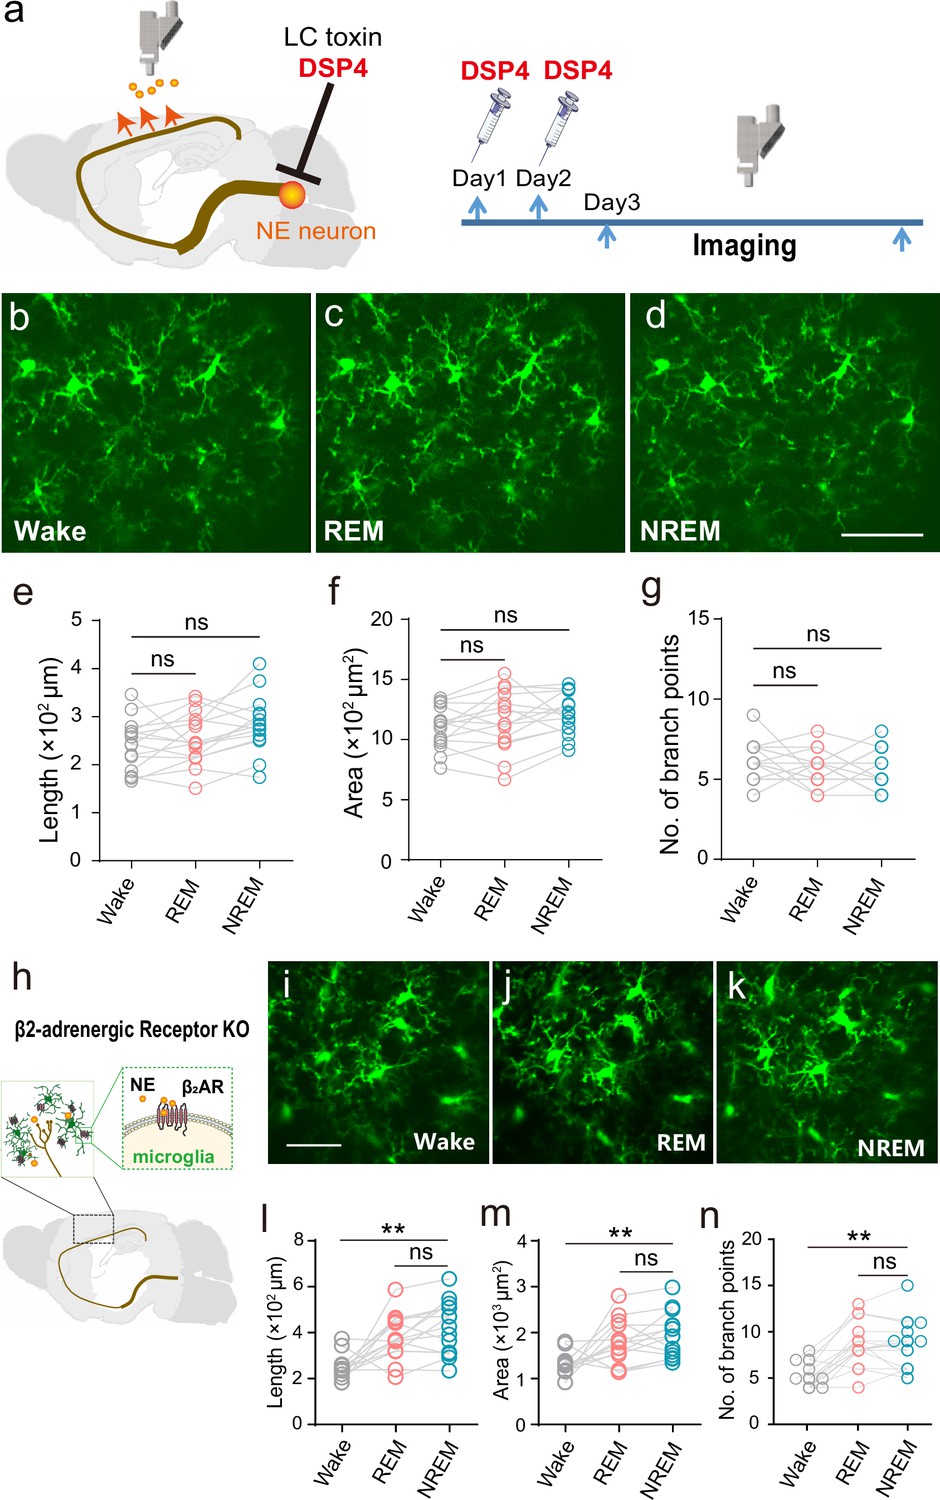
Microglial surveillance during natural sleep is controlled by LC-NE signal.
(a) Experimental setup: LC-selective neurotoxin DSP4 was used to destroy LC-NE neuronal axons. (b–g) Lack of sleep/wake state-dependent microglial surveillance in LC- axon ablated animals. b-d: Representative miniature two-photon microscopy (mTPM) images of microglia at different states. e-g: Statistics for microglial length (e), surveillance area (f), and number of branch points (g) in LC-axon ablated mice. One-way ANOVA with Tukey’s post-hoc test in e, f; Friedman test with Dunn’s post-hoc test in g; n=15 cells from six mice for each group; ns, not significant. (h) Schematic diagram for β2ARs on the plasma membrane of microglia in the cerebral cortex responding to norepinephrine (NE) released from axonal terminals projected from locus coeruleus (LC). (i–k) State-dependent microglial surveillance during sleep-wake cycle in β2AR knockout mice. Representative microglial images (i–k) and statistics for microglial process length (l), surveillance area (m), and number of branch points (n) at different states in (CX3CR1-GFP+/-; Adrb2-/-) mice. Scale bars, 30 μm. One-way ANOVA with Tukey’s post-hoc test in m; Friedman test with Dunn’s post-hoc test in l, n; n=15 cells from six mice for each group; ns, not significant, **p<0.01.
Figure 5—figure supplement 1
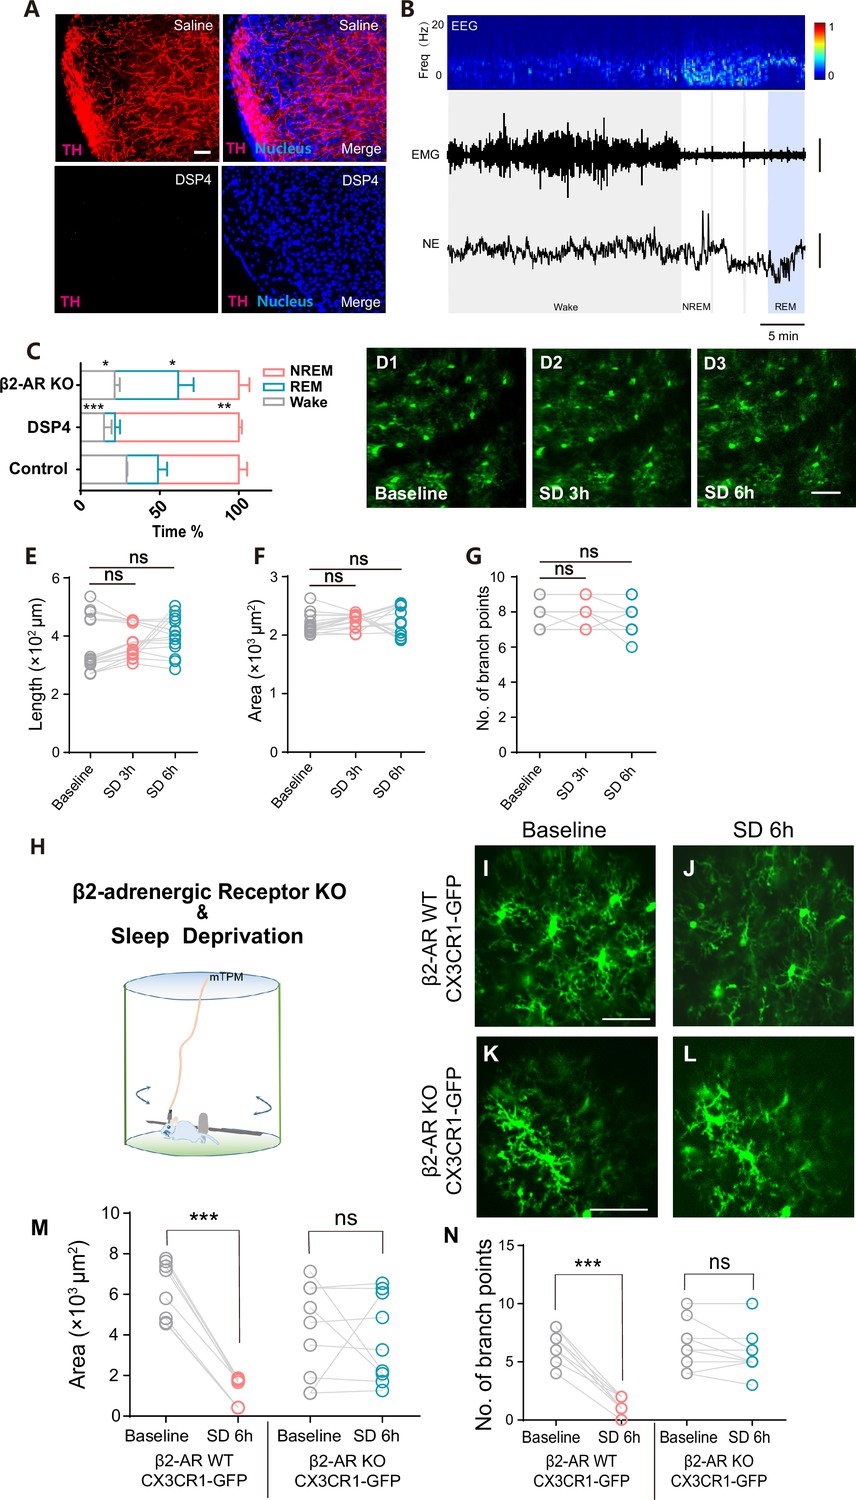
Altered sleep-wake states after DSP4 administration and β2AR knockout and controlling microglial surveillance during sleep deprivation (SD) by LC-NE signal.
(A) Inhibition of tyrosine hydroxylase (TH) expression in somatosensory cortex of mice treated with DSP4. Nuclei were stained with DAPI, and saline was used in the control group. Scale bars, 50 μm. (B) Representative traces of simultaneous multimodal recordings in the somatosensory cortex during the sleep-wake cycle in freely behaving mice treated with DSP4. From top to bottom: electroencephalography (EEG) and its power spectrogram (0–20 Hz); electromyography (EMG) (scale, 0.2 mV); norepinephrine (NE) signals reflected by the z-score of the GRABNE2m fluorescence (scale, 2 z-score). The brain states are color-coded (wake, gray; non-rapid eye movement (NREM), white; rapid eye movement (REM), blue). (C) DSP4 treatment and β2AR knockout both reduced the wake time compared to controls. DSP4 significantly increased NREM time whereas β2AR KO led to more REM time. *p<0.05, **p<0.01, ***p<0.001 versus control, n=3 mice for each group, unpaired t-test (two-tailed). (D–G) Lack of microglial surveillance in LC-axon ablated animals. (D): Representative mTPM images of microglia during SD. (E-G): Statistics for microglial length (E), surveillance area (F) and number of branch points (G) in LC-axon ablated mice. n=15 cells from three mice for each group; ns, not significant, Friedman test with Dunn’s post-hoc test. (H–N) Lack of SD-dependent changes in microglial surveillance in the absence of β2AR signaling. (H) Experiment setup. (I–J) Representative mTPM micrographs from a (Cx3cr1-GFP+/-; Adrb2+/+) mouse. (K–L) Representative mTPM micrographs from a (Cx3cr1-GFP+/-; Adrb2-/-) mouse. No significant morphological changes were observed in β2AR KO mouse subjected to SD. (M–N) Quantitative analysis of changes in microglial surveillance area (M) and number of branch points (N) in wild-type (WT) and β2AR KO mice under baseline (wake state) and SD conditions. Scale bars, 30 μm. **p<0.01, Wilcoxon test (two-tailed), Baseline versus SD 6 hr in WT mice in (M); ***p<0.001, paired t-test (two-tailed) in (N). n=9 cells from three mice for each group; ns, not significant.
Author response image 1

Extracellular adenosine levels in somatosensory cortex in different brain states.
AAV2/9-hSyn-GRABAdo1.0 (Peng W. et al., Science. 2020) was injected into the somatosensory cortex (A/P, -1 mm; M/L, +2 mm; D/V, -0.3 mm). Data from the same recording are connected by lines. n = 9 from 3 mice.
Author response image 2

Long-term tracking of microglia process area in different brain states.
Data analysis used 8 cells. Data total of 31 time points were selected from in vivo imaging data and were used to characterize the morphological changes of microglia over a continuous 7-hour period.
Author response image 3

Reversible changes of microglial process length, area, number of branch points under anesthesia.
Wake group: 30 minute-accommodation to new environment; Isoflurane group: 1.5% in air applied at a flow rate of 0.4 L/min for 30 minutes; Recovery group: 30 minutes after recovery from anesthesia. n = 9 cells from 3 mice for each group.
Author response image 4

Microglial morphological length, area change, and number of branch points of the last 30s of NREM sleep followed by REM or Wake.
n = 9 cells from 3 mice for each group.
Author response image 5
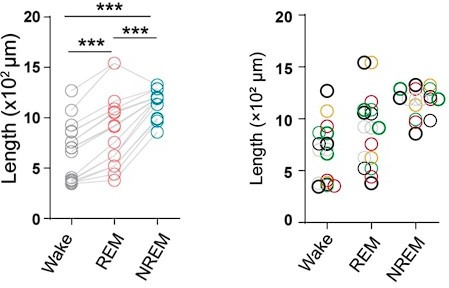
Quantitative analysis of microglial length based on multi-plane microglial imaging.
n = 17 cells from 7 mice for each group. In right panel, each color codes data from the same animal.
Additional files
Download links
A two-part list of links to download the article, or parts of the article, in various formats.
Downloads (link to download the article as PDF)
Open citations (links to open the citations from this article in various online reference manager services)
Cite this article (links to download the citations from this article in formats compatible with various reference manager tools)
Imaging microglia surveillance during sleep-wake cycles in freely behaving mice
eLife 12:RP86749.
https://doi.org/10.7554/eLife.86749.3


