Murine alveolar macrophages rapidly accumulate intranasally administered SARS-CoV-2 Spike protein leading to neutrophil recruitment and damage
- B-Cell Molecular Immunology Section, Laboratory of Immunoregulation, National Institute of Allergy and Infectious Diseases, National Institutes of Health, United States
- Immunopathogenesis Section, Laboratory of Immunoregulation, National Institute of Allergy and Infectious Diseases, United States
- Department of Retrovirology, Armed Forces Research Institute of Medical Sciences – United States Component, Thailand
Figures
Figure 1 with 2 supplements
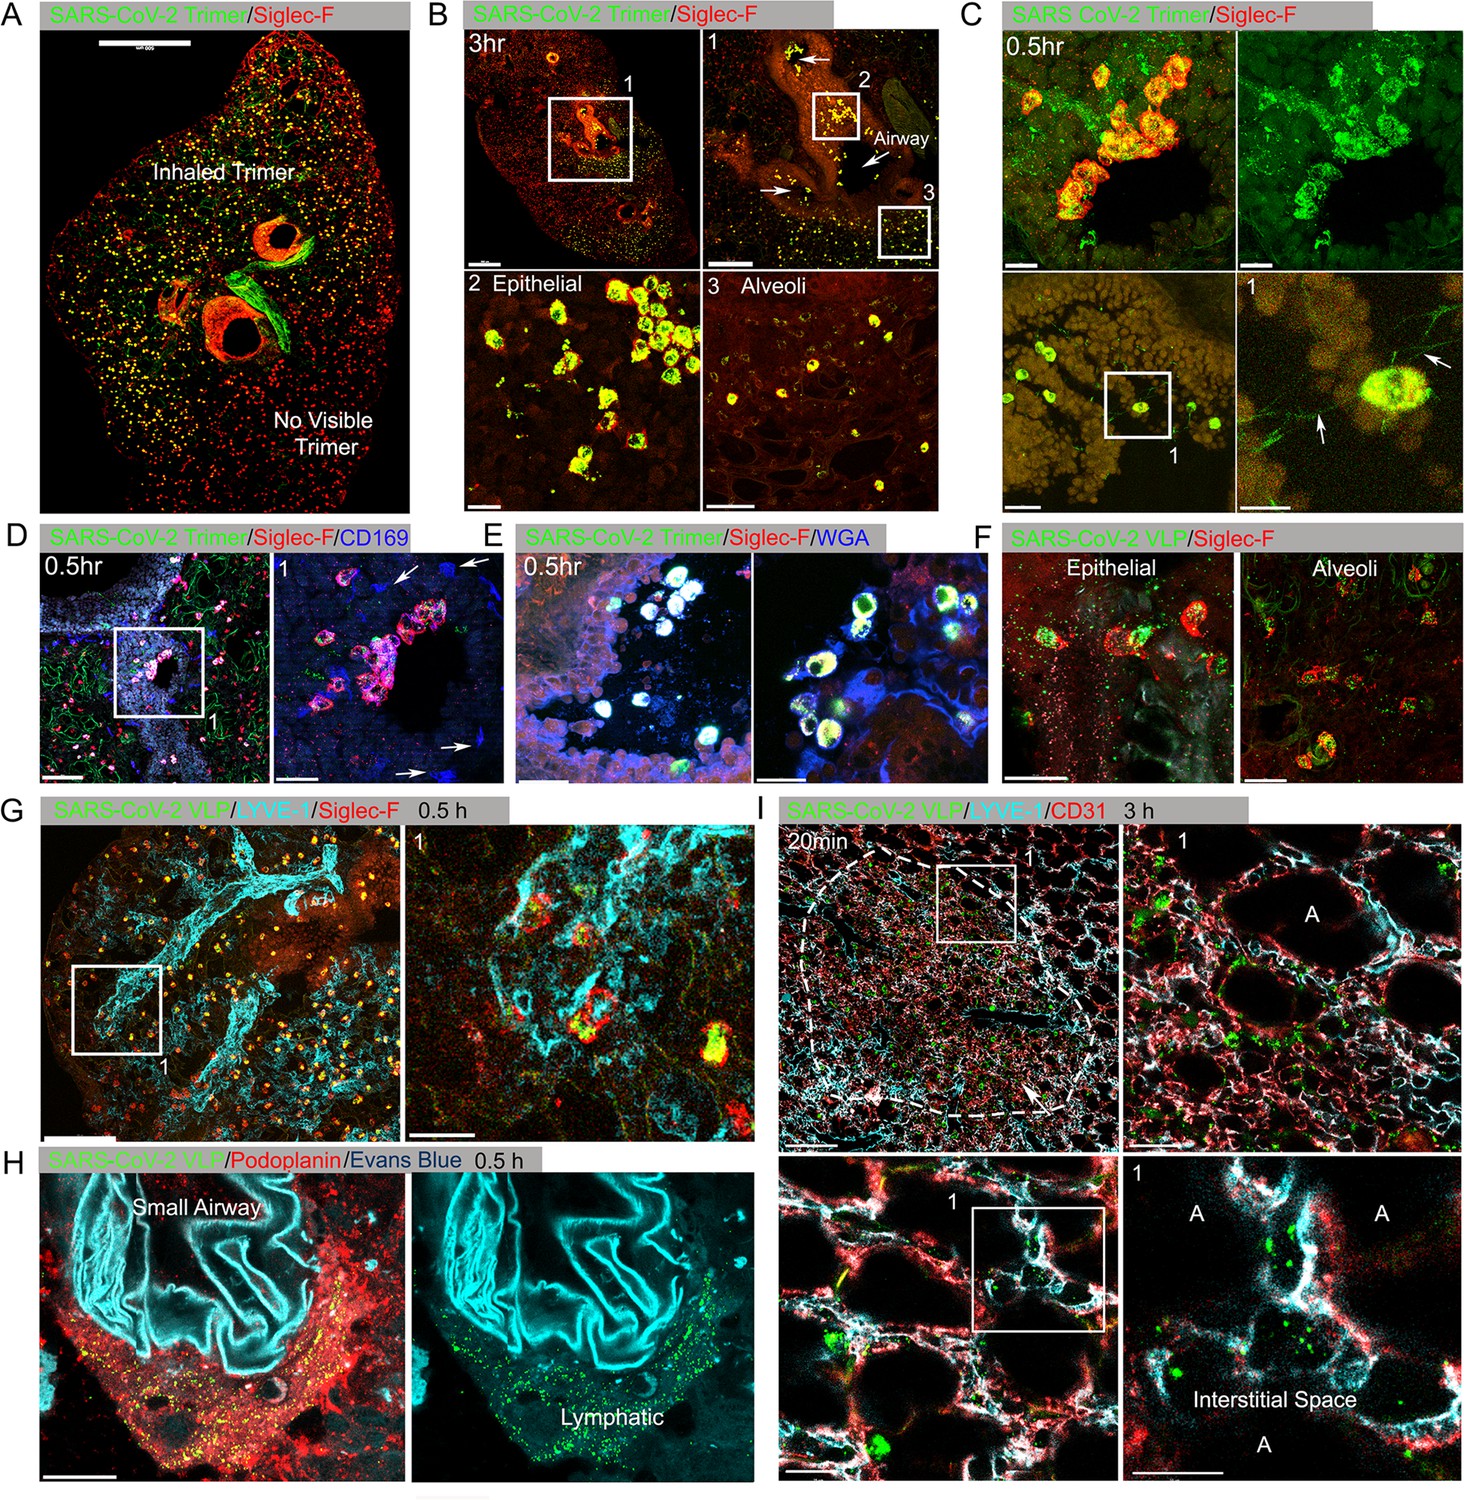
Lung images following intranasal administered SARS-CoV-2 Spike protein.
(A) Confocal micrograph of a lung section 18 hr post SARS-CoV-2 Spike protein (Trimer) instillation. Alveolar macrophages (AMs) visualized with Siglec-F antibody. Alexa Fluor 488-conjugated recombinant SARS-CoV-2 Spike protein (3 μg in 50 μl of saline) was inoculated by nasal instillation. Spike-reached lung region (Instilled Trimer) and non-reached area (No visible Trimer) noted on the micrograph. Scale bar, 500 µm. (B) Confocal micrographs of lung collected at 3 hr post Spike protein instillation. AMs in the large airway and alveoli (upper left) area is shown. ROI-1 (Box 1) (upper right) is enlarged, and arrows indicate large airways. ROI-2 (Box 2) (lower left) shows AMs bearing SARS-CoV-2 Spike protein on airway epithelial cells. ROI-3 (Box 3) (lower left) shows Spike protein bearing AMs in alveoli. Scale bars, 500, 200, 20, and 50 μm. (C) Confocal micrographs of lung collected at 0.5 hr post SARS-CoV-2 Spike protein instillation. AMs were visualized with Siglec-F antibody (upper left and right). AMs connected to each other (lower left) via tunneling nanotubes (arrows) (lower right). Scale bars, 20, 20, 30, and 10 μm. (D and E) Confocal micrographs of lung collected at 0.5 hr post Spike instillation. SARS-CoV-2 Spike protein (green) on airway epithelium and CD169+ macrophages (D). Arrows indicate CD169+ macrophages (right). Scale bars, 100 and 30 μm. AMs with SARS-CoV-2 Spike protein and Mucin (Alexa Fluor 647-conjugated wheat germ agglutin [WGA]) on airway epithelium (E). Scale bars, 30 and 20 μm. (F) Confocal micrographs of lung collected at 2 hr post SARS-CoV-2 Spike protein incorporated viral like particle (VLP) instillation (green). AMs (red, SiglecF) on epithelium (left) and in alveoli (right). Scale bars, 20 μm. (G) Confocal micrographs of lung collected at 0.5 hr post SARS-CoV-2 Spike VLP (green) instillation. AMs (red, Siglec-F antibody) and lung vasculatures visualized LYVE-1 (cyan) (top, left). LYVE-1+ vasculature-associated AMs bearing VLPs is highlighted (box) and enlarged (top, right). Scale bars, 100 and 25 μm. (H) A confocal micrograph shows a lung lymphatic vasculature visualized with Podoplanin antibody. Fifty microliters of a mixture of Evans blue (cyan) (5 μg) and Spike bearing VLPs (green) (0.5 million counts) were applied to the mouse nose. VLPs in lymphatics associated with a small airway highlighted (right). Scale bars, 20 μm. (I) Confocal micrographs of lung collected 20 min post Spike incorporated VLP (green) instillation. Lung vasculatures visualized CD31 (red) and LYVE-1 (cyan). Damaged lung tissue is indicated (dotted line) (upper left). Border of damaged tissue and intact alveoli (box) is enlarged (upper right). A lymphatic structure stained by LYVE-1 in intact alveolus is highlighted (lower left). An image of VLPs in LYVE-1+ lymphatic portal in alveoli (box) is enlarged (lower right). ‘A’ indicates alveolus. Scale bars, 100, 20, 25, and 10 μm.
Figure 1—figure supplement 1
Preparation of SARS-CoV-2 proteins.
Outline of recombinant proteins production and purification from cultured media of pSARS-CoV-2-S-2P transfected CHO or HEK293F cells. See methods for PNGase F and Kifunensine treatment. Calculated molecular weights: wild-type trimer –210 kDa, PNGase F-Tx. (Fr. 6–8)- 146 kDa, PNGase F-Tx (Fx. 9–11)–178 kDa, and Kifunensine Tx.- 197.5 kDa.
Figure 1—figure supplement 2
Confocal micrographs were taken for staining control and to analyze neutrophil fragmentation caused by SARS-CoV-1 Spike viral like particles (VLPs), comparing them to delta Env VLPs.
(A) Confocal micrographs compare the negative control (saline) with the positive sample (SARS-CoV-2 Spike, Alexa Fluor 488). Arrowheads in the upper panels indicate autofluorescence background. The nonspecific Siglec-F antibody stain background is denoted as 'NS' in the lower panels. Scale bars, 500 μm. (B) Confocal micrographs of lungs collected at 3 hr post instillation of SARS-CoV-2 Spike protein (left) or delta envelope (right) VLP (green, green fluorescent protein [GFP]) are shown. Infiltrated neutrophils (red, Ly6G) in lung tissue were visualized. Scale bars, 50 μm. (C) Neutrophil fragmentation was measured by counting the Ly6G+ granules in five different areas of 100×100 μm2 each. **p<0.01, paired t-test (n=5). (D) A confocal micrograph shows a lung lymphatic vasculature visualized with Podoplanin antibody. Fifty microliters of a mixture of Evans blue (cyan) (5 μg) and Spike bearing VLPs (green) (0.5 million counts) were applied to the mouse nose. The first panel presents the merged image of all signals, while the subsequent panels display specific color combinations: green and red in the second, and green and cyan in the third. The fourth panel exclusively exhibits the green signal, with autofluorescence of the lung airway structure indicated. Scale bars, 20 μm.
-
Figure 1—figure supplement 2—source data 1
Source data for Figure 1—figure supplement 2C.
- https://cdn.elifesciences.org/articles/86764/elife-86764-fig1-figsupp2-data1-v1.xlsx
Figure 2 with 1 supplement
Lung leukocyte profile following intranasal administration of SARS-CoV-2 Spike proteins.
(A) Leukocyte numbers in isolated lung tissue. Eighteen hr post intranasal administration of indicated Spike proteins lung tissue collected, processed, and leukocyte cell numbers determined by flow cytometry. Numbers of mice analyzed are indicated. Data mean ± SEM, *p<0.05; **p<0.005. (B) SARS-CoV-2 Spike protein uptake by lung leukocytes 18 hr following intranasal administration. Flow cytometry results from indicated mice. Values significantly different from the wild-type (WT) SARS-CoV-2 protein (Trimer) are indicated, *p<0.05; **p<0.01; ***p<0.005; ****p<0.001.
-
Figure 2—source data 1
Source data for Figure 2A.
- https://cdn.elifesciences.org/articles/86764/elife-86764-fig2-data1-v1.xlsx
-
Figure 2—source data 2
Source data for Figure 2B.
- https://cdn.elifesciences.org/articles/86764/elife-86764-fig2-data2-v1.xlsx
Figure 2—figure supplement 1
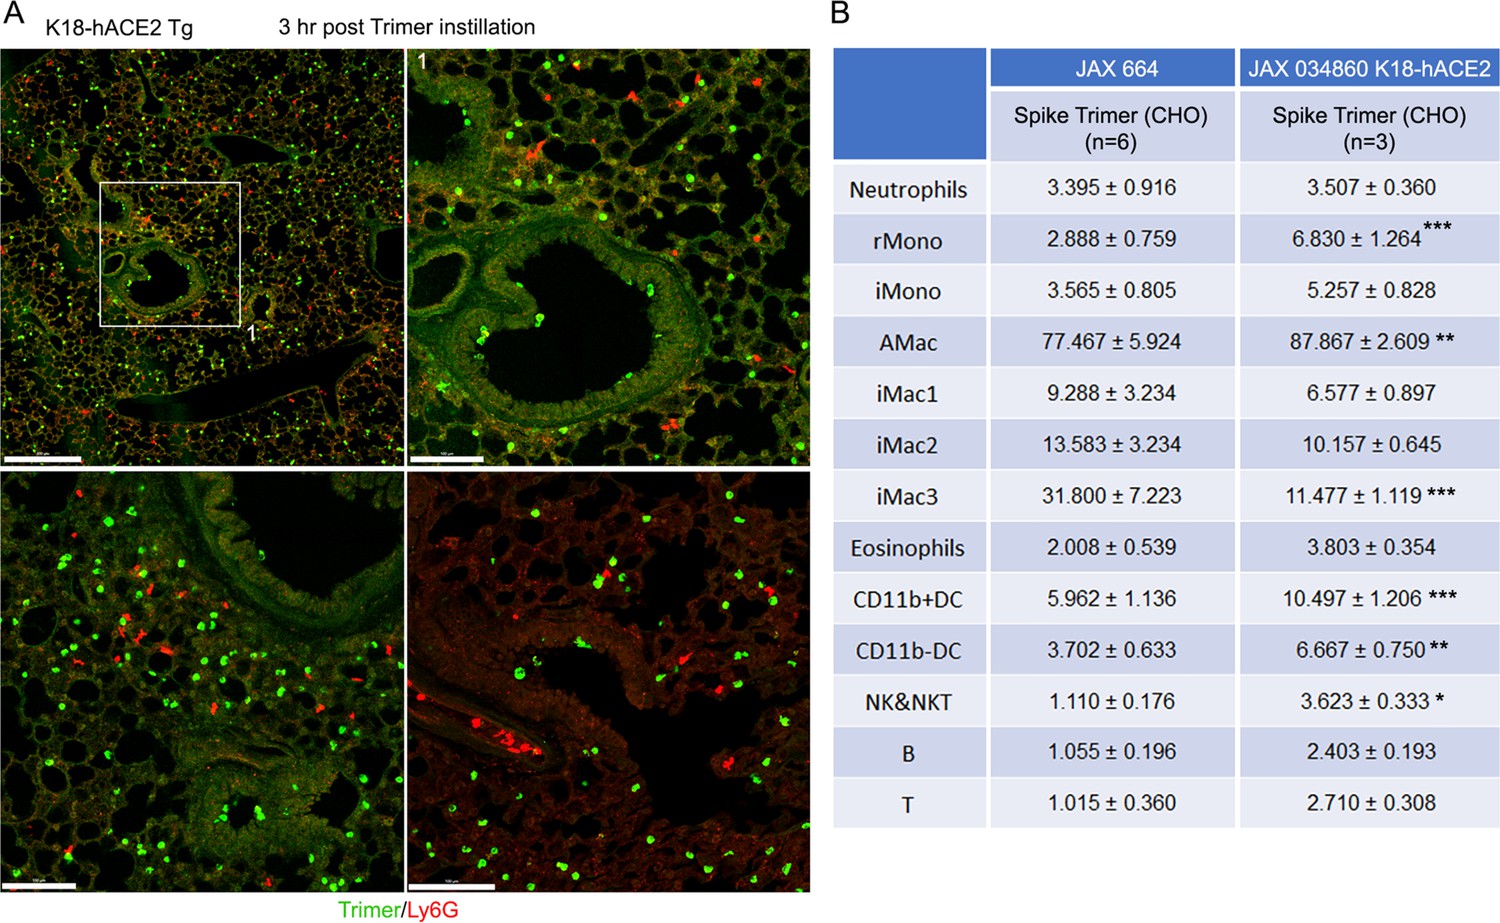
Intranasal SARS-CoV-2 administration to K18-hACE2 mice.
(A) Representative confocal images of lung sections 3 hr post intranasal SARS-CoV-2 Spike protein (3 µg, green). Neutrophils immunostained with Ly6G. (B) SARS-CoV-2 Spike protein uptake by lung leukocytes 18 hr following intranasal administration. Flow cytometry results from analysis of leukocytes purified from the lungs of wild-type (WT) or K18-hACE2 mice. Data for JAX 664 mice same as shown in Figure 2. K18-hACE2 leukocyte values significantly different from those from the JAX 664 mice are indicated, *p<0.05; **p<0.01; ***p<0.001. hACE2, human angiotensin converting enzyme II.
-
Figure 2—figure supplement 1—source data 1
Source data for Figure 2—figure supplement 1B.
- https://cdn.elifesciences.org/articles/86764/elife-86764-fig2-figsupp1-data1-v1.xlsx
Figure 3 with 1 supplement
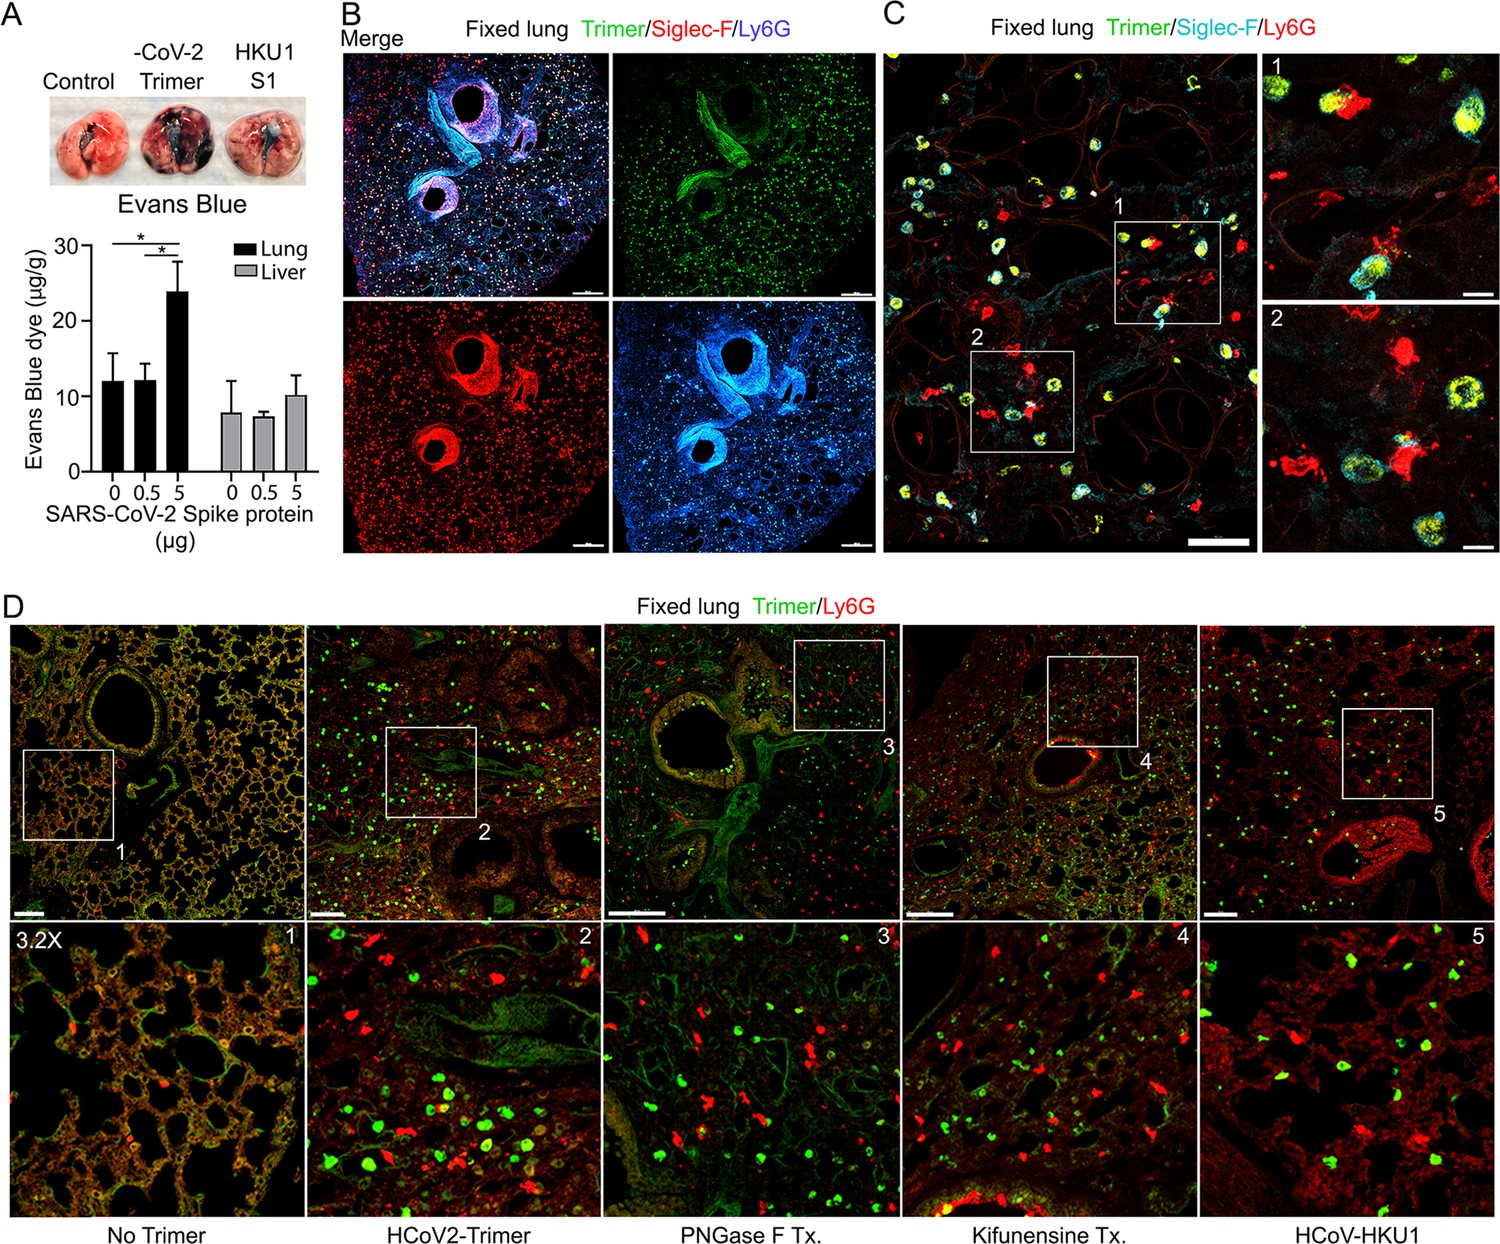
Increased lung vascular permeability and neutrophil localization following intranasal SARS-CoV-2 Spike protein.
(A) Tissue photographs of lungs collected 2.5 hr post Spike protein (-CoV-2 Trimer), the S1 subunit of the human coronavirus (HKU1 S1), or saline instillation. Evans blue (200 µl of 5 mg/ml, PBS) was injected i.v. 1.5 hr post intranasal Spike administration. Lungs collected 1 hr after Evans blue injection. Evans blue amounts in lung and liver tissue are shown. (B) Confocal micrographs of lung collected at 18 hr post Spike protein. Alveolar macrophages (AMs) and neutrophils detected with Siglec-F and Ly6G antibodies, respectively. Scale bar, 500 μm. (C) Confocal micrographs of lung collected at 3 hr post SARS-CoV-2 Spike protein instillation show SARS-CoV-2 Spike protein (green), neutrophils (red), and AMs (cyan). ROI-1 and -2 (boxes) show contact between AMs and neutrophils and are enlarged in the right panels. Scale bars, 50 and 10 μm. (D) Confocal micrographs of lung collected at 3 hr post each SARS-CoV-2 Spike proteins instillation show SARS-CoV-2 Spike protein (green) and neutrophils (red). Left to right panels show saline (No Trimer), SARS-CoV-2 Spike protein (HCoV-2-Trimer), PNGase F-treated SARS-CoV-2 Spike protein (PNGase F Tx.), SARS-CoV-2 Spike protein purified from Kifunensine-treated cells (Kifunensine Tx.), and the S1 subunit of the human coronavirus HKU1 (HCoV-HKU1) Spike protein. ROIs in each upper panel (boxes) are enlarged (×3.2 magnification) in lower panels. Scale bars, 200 μm. Two-way ANOVA multiple comparisons, *p<0.05, (n=3). ROI, regions of interest.
-
Figure 3—source data 1
Source data for Figure 3A.
- https://cdn.elifesciences.org/articles/86764/elife-86764-fig3-data1-v1.xlsx
Figure 3—figure supplement 1
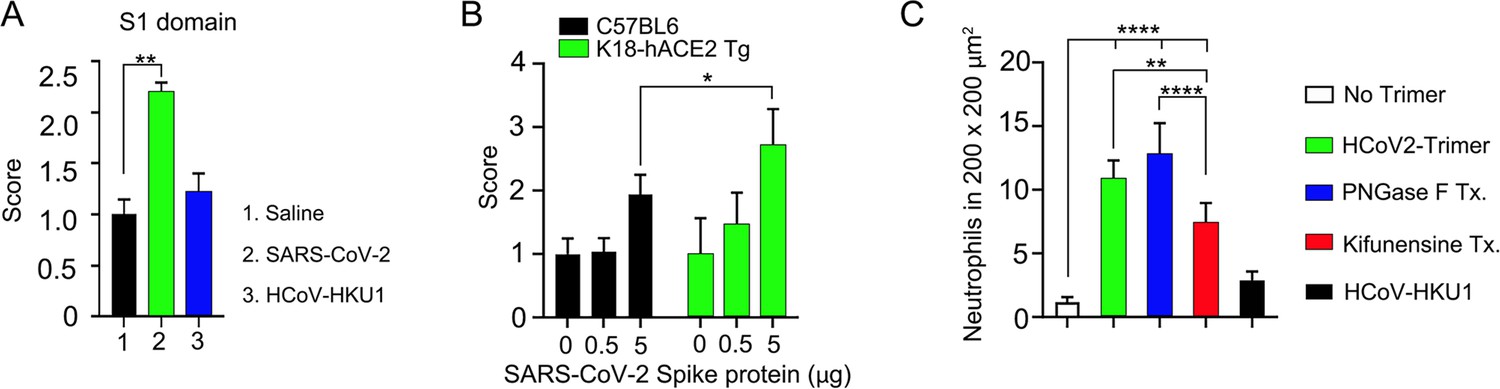
Quantification of lung permeability and neutrophil recruitment.
(A) Evans blue (200 µl of 5 mg/ml in PBS) was intravenously injected 1.5 hr after intranasal Spike administration. The indicated recombinant proteins’ S1 domains (3 μg per mouse) were administered. Lungs were collected 1 hr after Evans blue injection. The score was calculated based on the amount of Evans blue dye (in μg/g) in the lungs administered with the Spike protein, divided by the average amount of Evans blue dye in lungs administered with saline. **p<0.01 (n=3), one-way ANOVA. (B) The permeability of lung vasculature was measured by comparing wild-type mice with K18-hACE2 transgenic mice. The SARS-CoV-2 Spike protein was administered at two different concentrations: 0.5 or 5 μg per mouse. *p<0.05 (n=5), two-way ANOVA. (C) The number of neutrophils was counted in six different areas, each measuring 200×200 μm2. ****p<0.0001 (n=6), one-way ANOVA. hACE2, human angiotensin converting enzyme II.
-
Figure 3—figure supplement 1—source data 1
Source data for Figure 3—figure supplement 1A–C.
- https://cdn.elifesciences.org/articles/86764/elife-86764-fig3-figsupp1-data1-v1.xlsx
Figure 4 with 3 supplements
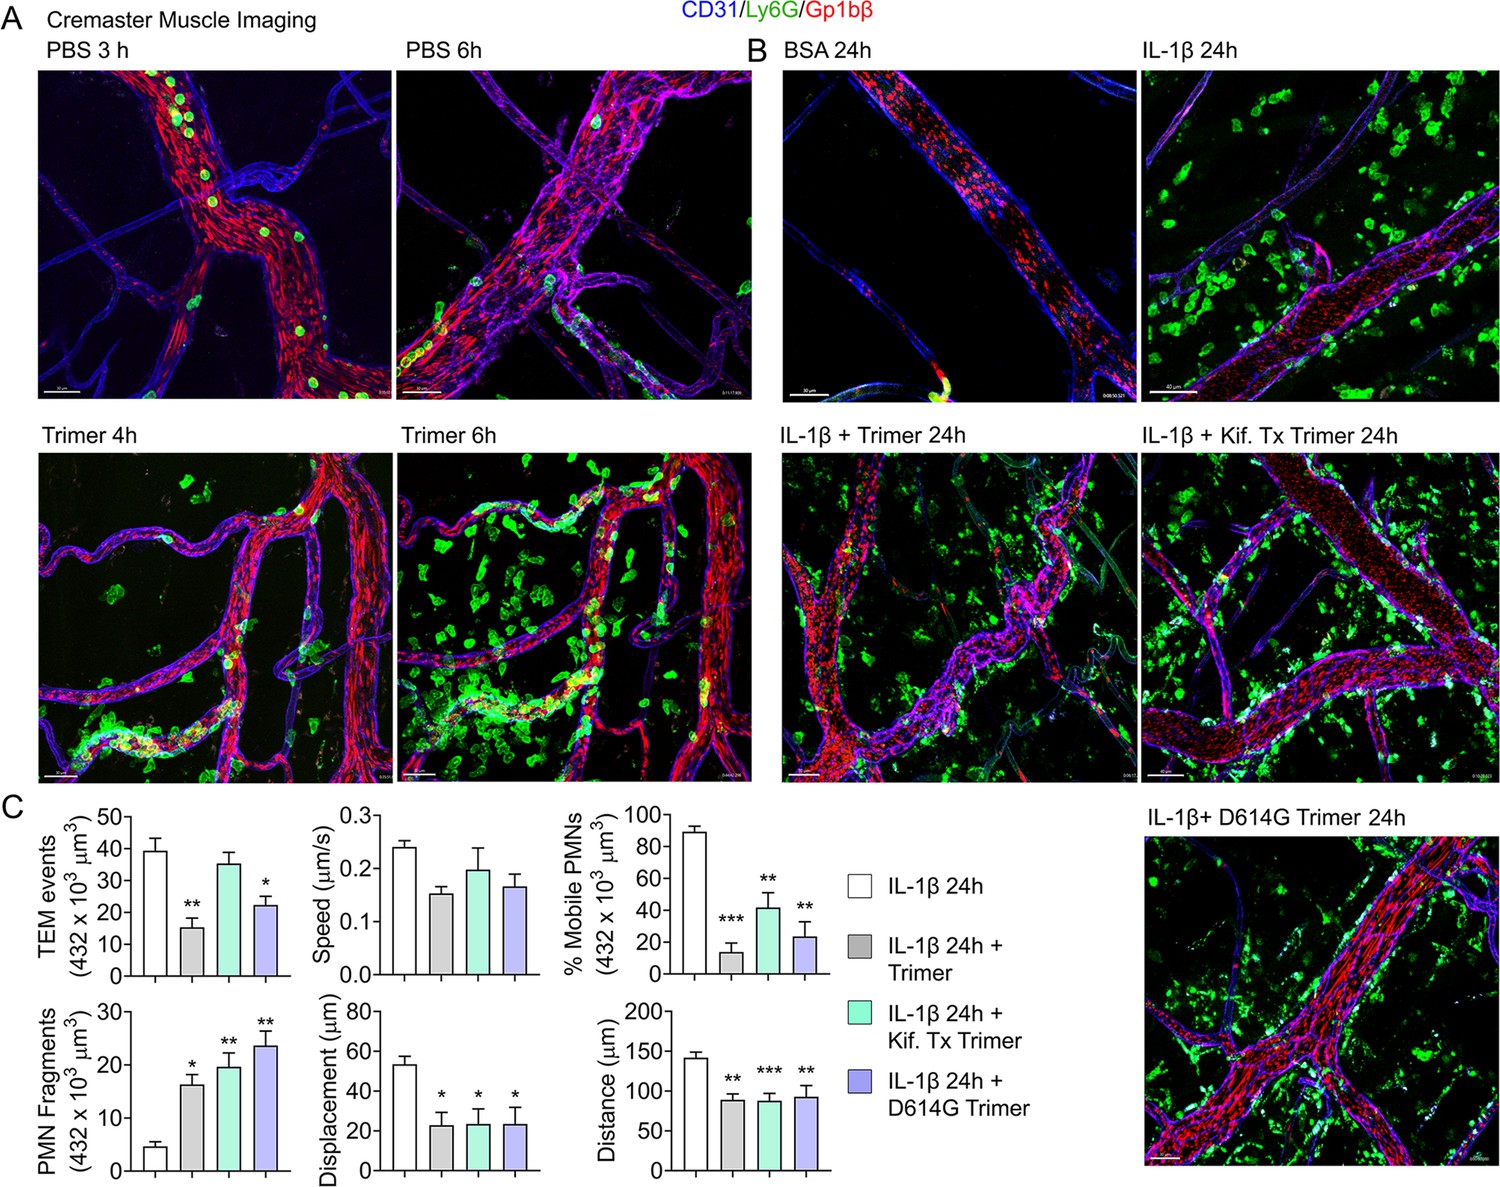
Mouse neutrophil damage following intrascrotal injections of Spike proteins.
(A and B) Confocal snapshots of time-lapse movie of blood vessels in the cremaster muscle following PBS, bovine serum albumin (BSA), Spike protein preparations (Trimer), IL-1β, or IL-1β plus Spike protein (5 µg) at indicated time points. Fluorescently labeled CD31, Ly6G, and Gp1bβ outlined the blood vessel endothelium, neutrophils, and platelets, respectively. Scale bars, 30 µm, except far right top and middle panels, 40 µm. (C) Analysis of imaging data. The count of transendothelial migration (TEM) occurrences, neutrophil (PMN) fragments, and the percentage of mobile neutrophils examined within a defined imaging volume over a 20-minute period. Results of neutrophil tracking in the same defined volume including speed, displacement, and distance. Imaris software used for the tracking. *p<0.05; **p<0.005.
Figure 4—figure supplement 1
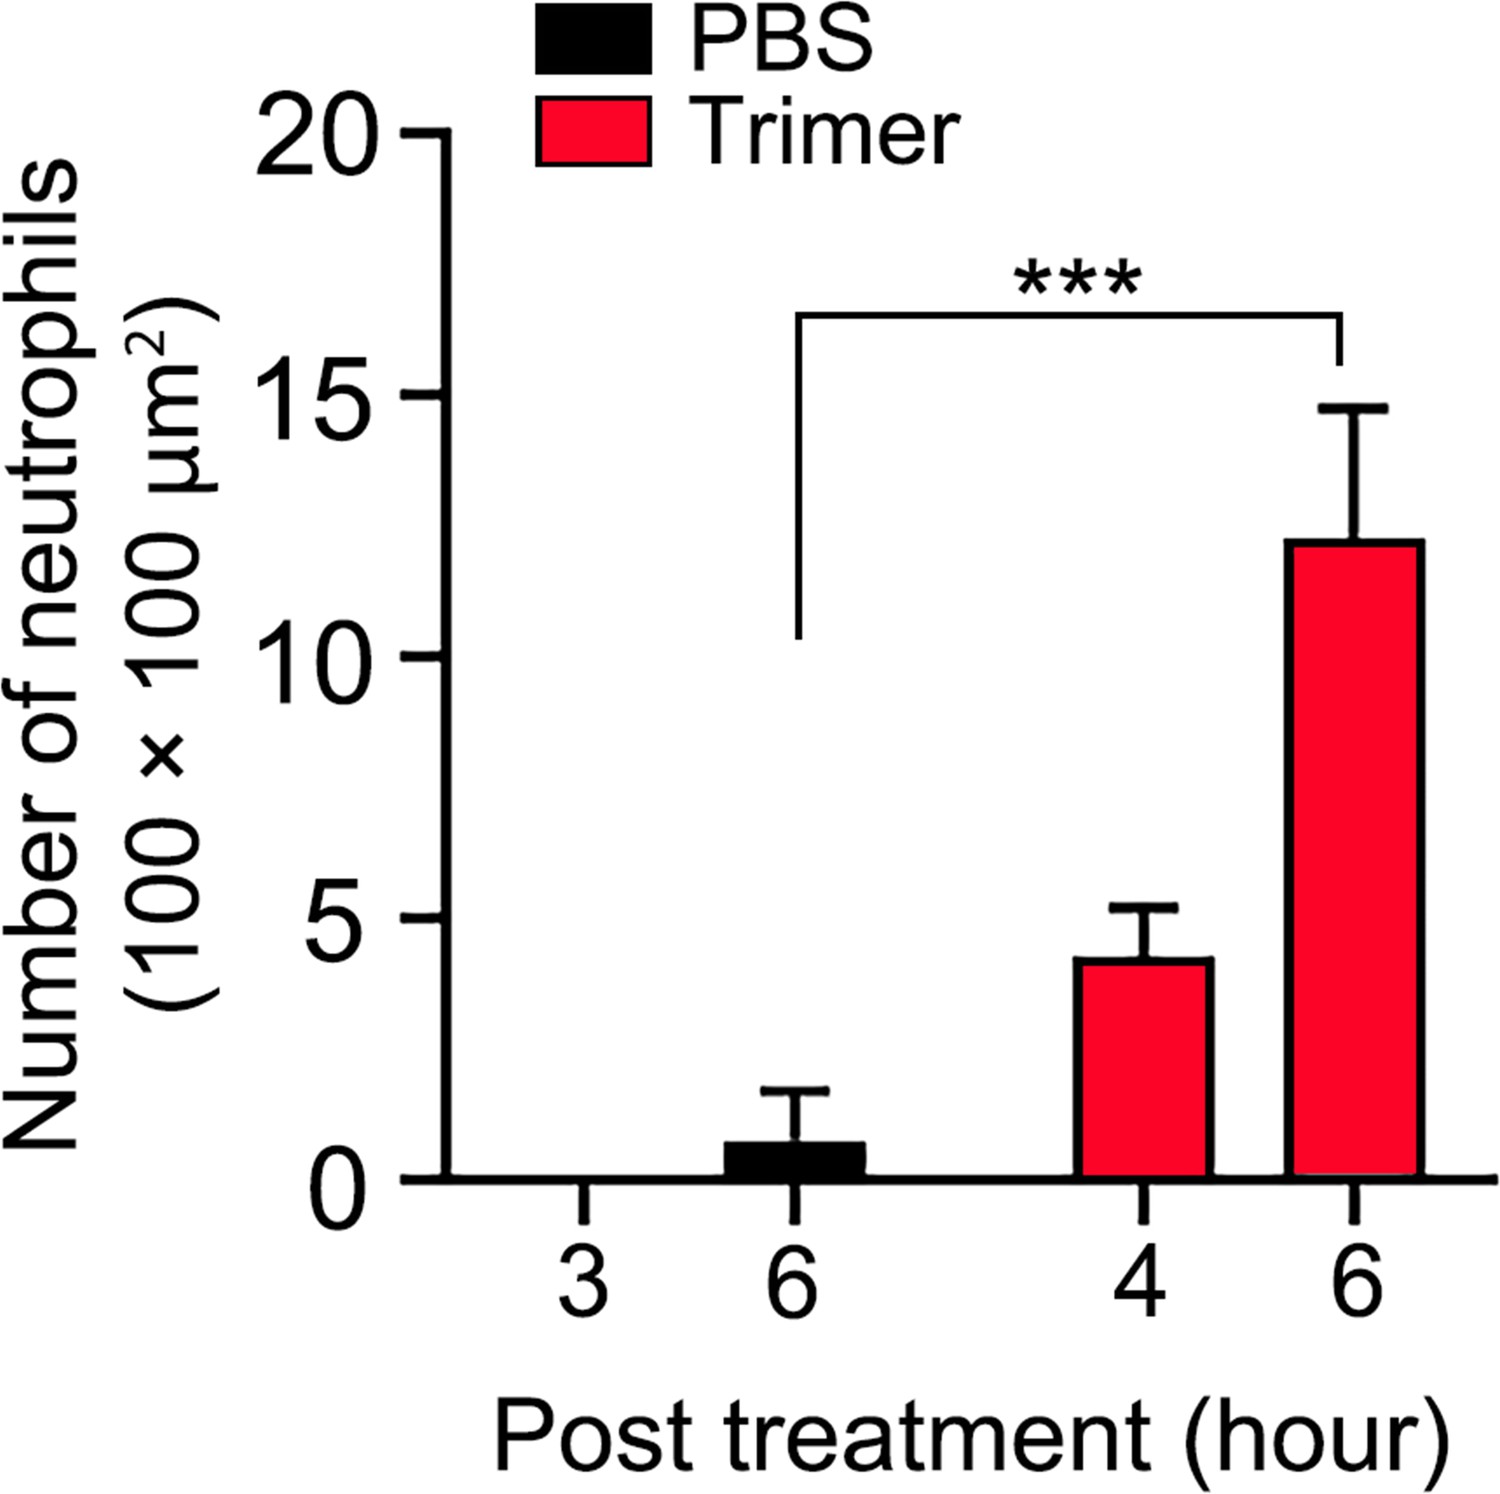
Quantification of neutrophil count in cremaster muscle.
The number of neutrophils was counted in four 100×100 μm2 areas. ***p<0.001 (n=4), two-way ANOVA.
-
Figure 4—figure supplement 1—source data 1
Source data for Figure 4—figure supplement 1.
- https://cdn.elifesciences.org/articles/86764/elife-86764-fig4-figsupp1-data1-v1.xlsx
Figure 4—figure supplement 2
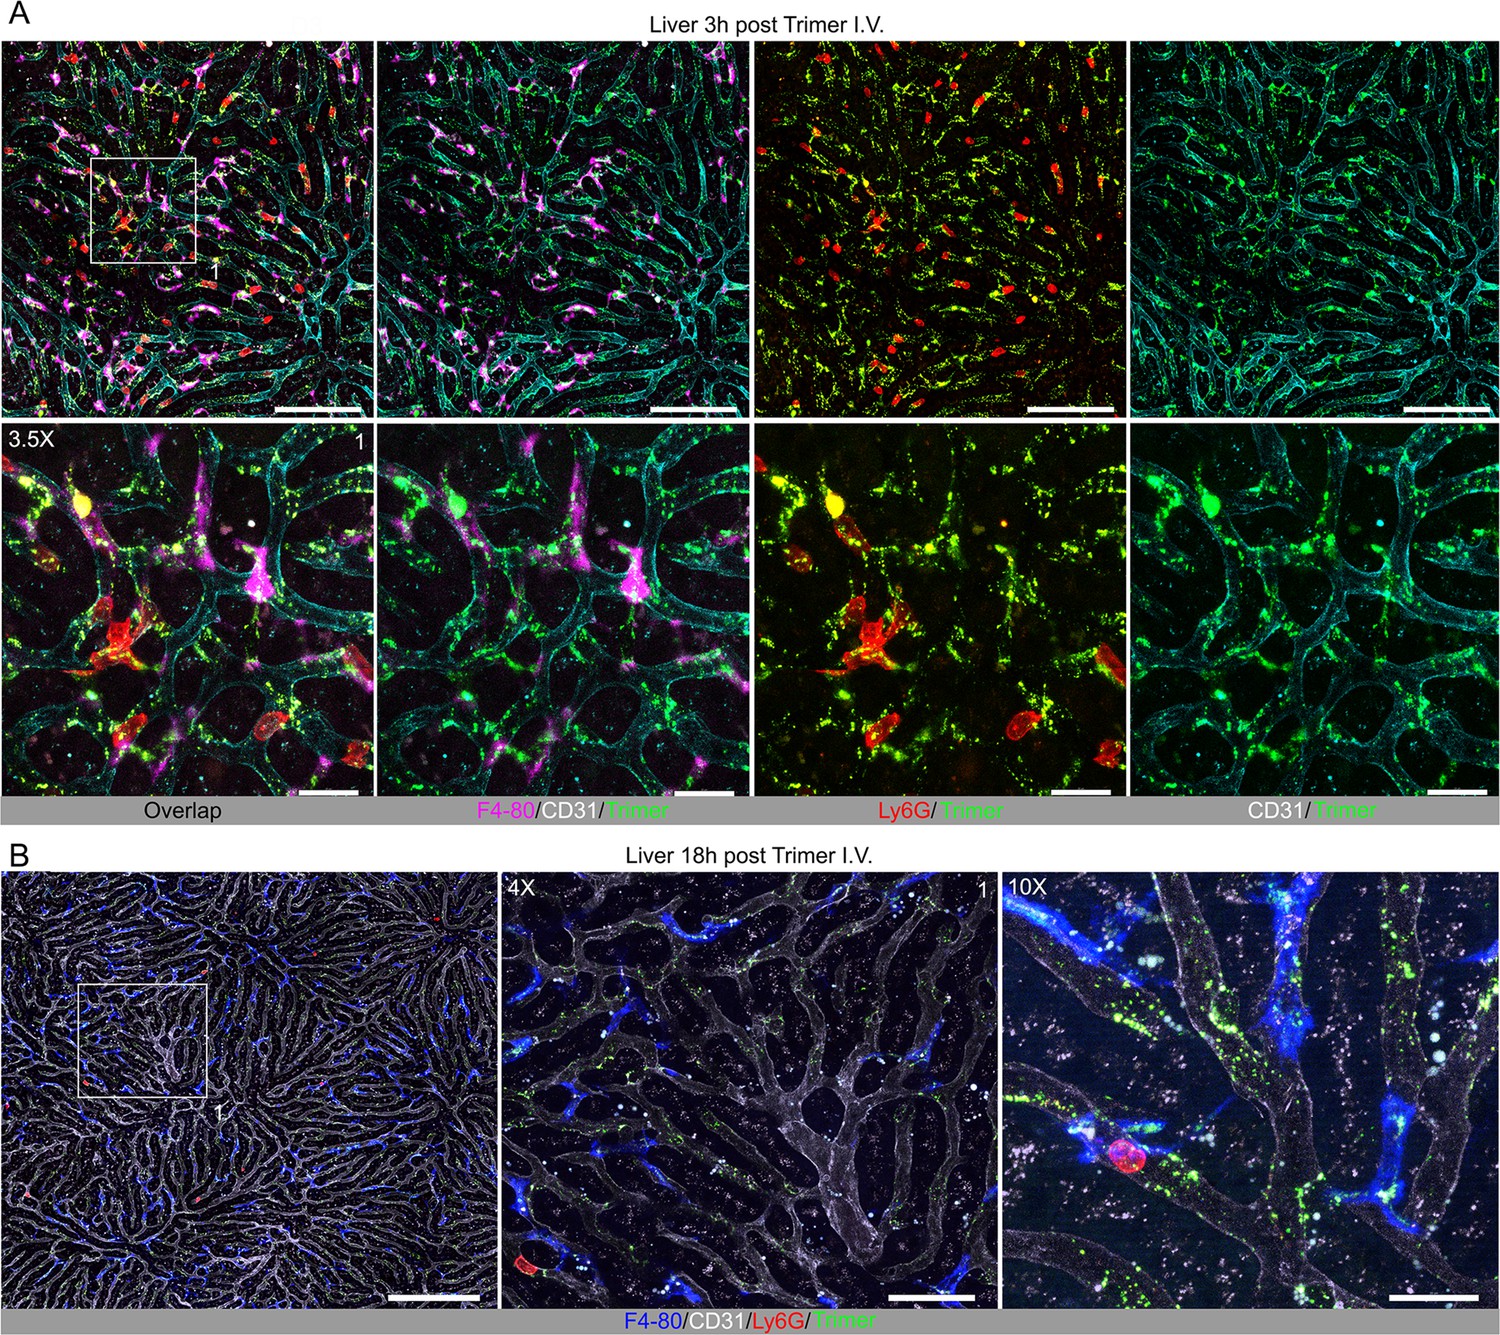
Localization of Spike protein in the liver following intravenous administration.
(A) Confocal micrographs of the liver imaged at 3 hr post intravenous injection of SARS-CoV-2 Spike (Trimer) protein. Spike protein (green), Kupffer cells (magenta, F4/80), and neutrophils (red, Ly6G) shown in liver sinusoid vasculature (cyan, CD31). Antibodies injected 0.3 hr before imaging. ROI-1 (box) (upper left) is enlarged (×3.5 magnification) in lower panels. Scale bars, 100 and 20 μm. (B) Confocal micrographs of liver imaged at 18 hr post intravenous injection of SARS-CoV-2 Spike protein. Spike protein (green), Kupffer cells (blue, F4/80), and neutrophils (red, Ly6G) are shown in liver sinusoid vasculature (white, CD31). Antibodies injected 0.3 hr before imaging. ROI-1 (box) (left) is enlarged in the middle panel (×4 magnification). Enlarged image shows neutrophil contacting Spike protein bearing cells on liver sinusoid endothelium (×10 magnification). Scale bars, 200, 50, and 20 μm.
Figure 4—figure supplement 3
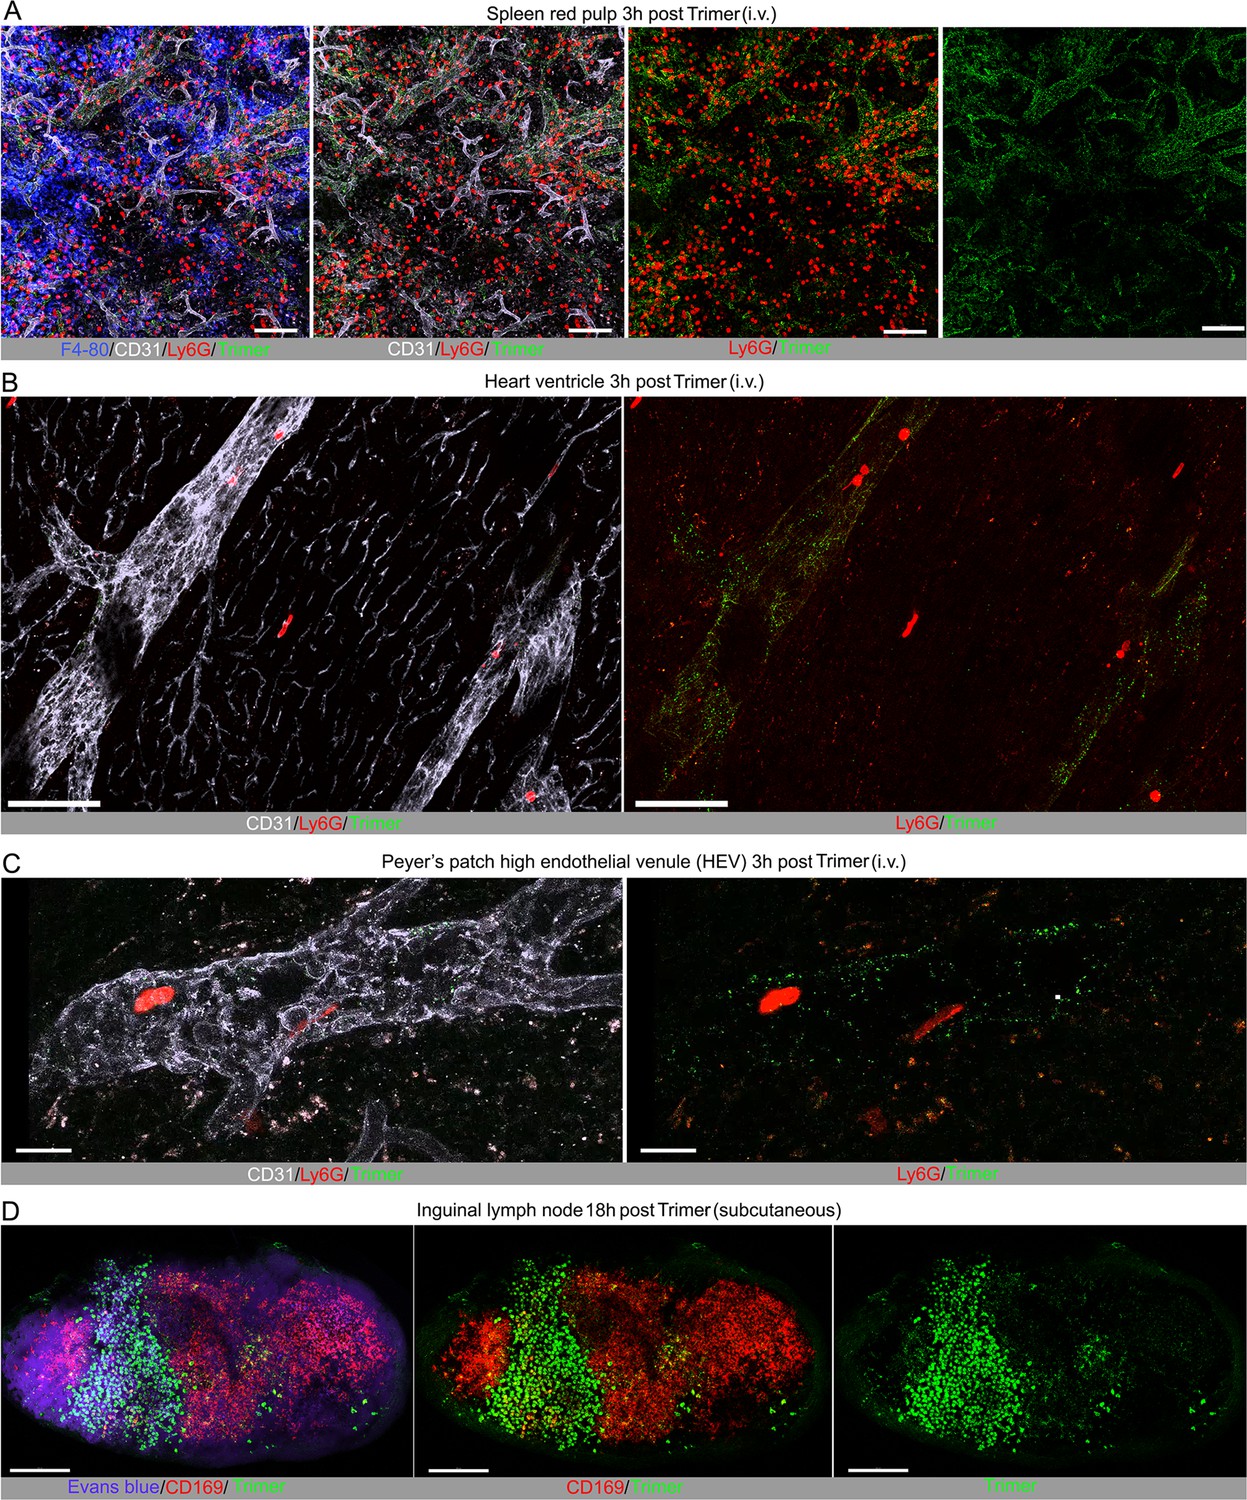
Localization of SARS-CoV-2 Spike protein at other sites following intravenous injection and subcutaneous injection near the inguinal lymph node.
(A) Confocal micrographs of mouse spleen imaged 3 hr post intravenous injection of SARS-CoV-2 Spike (Trimer) protein. Spike protein (green), red pulp macrophages (blue, F4/80), and neutrophils (red, Ly6G) visualized in spleen red pulp vasculature (cyan, CD31). Antibodies injected 1 hr before imaging. Scale bars, 100 μm. (B) Confocal micrographs of heart ventricle imaged 3 hr post intravenous injection of Spike protein. Spike protein (green) and neutrophils (red, Ly6G) localized in heart blood vessels (white, CD31). Antibodies injected 1 hr before imaging. Scale bars, 100 μm. (C) Confocal micrographs of Peyer’s patch high endothelial venules (HEV) imaged at 3 hr post i.v. injection of Spike protein. Spike protein (green) and neutrophils (red, Ly6G) shown in HEV (white, CD31). Antibodies injected 0.5 hr before imaging. Scale bars, 20 μm. (D) Confocal micrographs of inguinal lymph node imaged at 18 hr post tail base injection of Spike protein. Spike protein (green) and subscapular sinus macrophages (red, CD169) shown. Subcapsular sinus defined via Evans blue (purple) signal. Antibodies and Evans blue injected 1 hr before imaging. Scale bars, 200 μm.
Figure 5
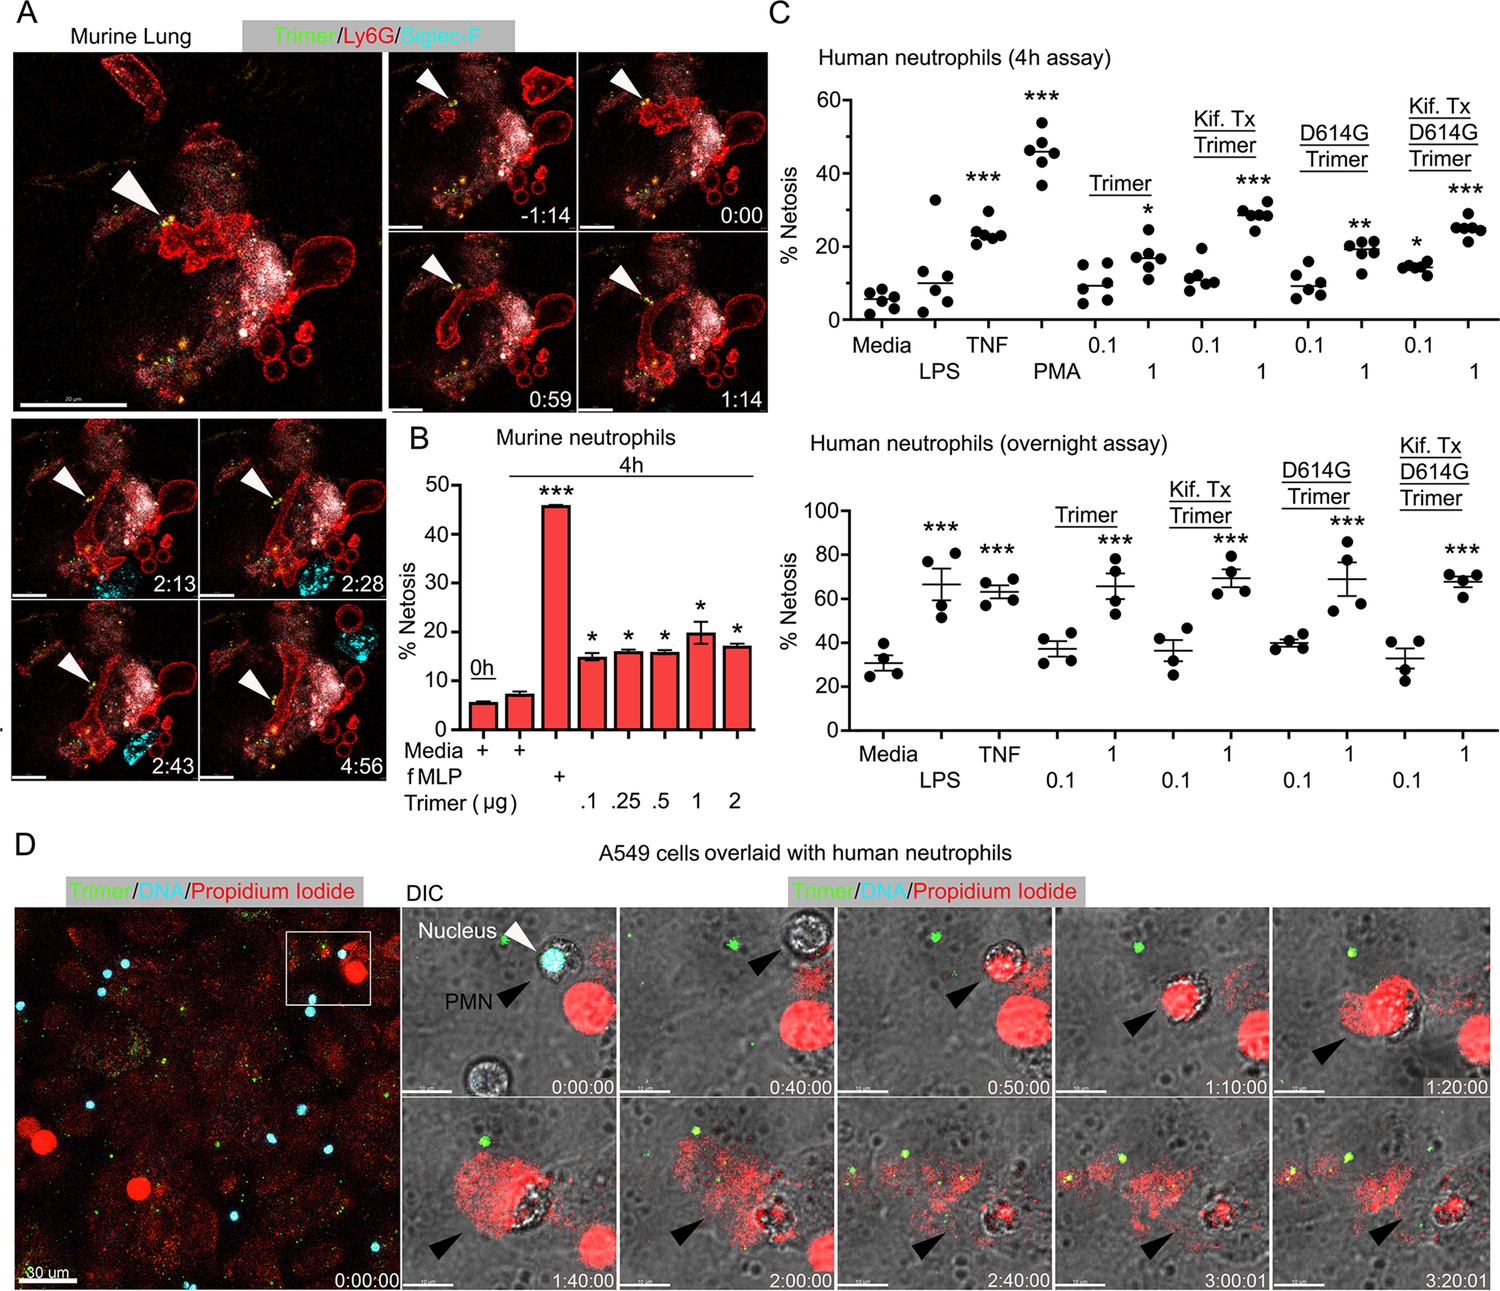
Neutrophil injury following exposure to SARS-CoV-2 Spike proteins.
(A) Time-lapse images of a freshly sliced lung section 3 hr after SARS-CoV-2 Spike protein instillation. Neutrophils (Ly6G) and alveolar macrophages (AMs) (Siglec-F) were visualized by injected fluorescently tagged antibodies. Serial images show neutrophil behavior on Spike protein (Trimer) bearing cells. Arrowheads indicate Spike protein deposition. The time banner is set to 0:00 as neutrophil contacts Spike protein. Scale bars, 100, 25, and 20 μm. (B) Purified murine bone marrow neutrophils were exposed to increasing concentrations of Spike protein or fMLP (N-formylmethionyl-leucyl-phenylalanine) for 4 hr or not. The percentage of neutrophils undergoing NETosis was measured by flow cytometry (n=2). (C) Purified human peripheral blood neutrophils were exposed to various Spike protein preparations, lipopolysaccharide (LPS), tumor necrosis factor-α (TNF), or phorbol myristate acetate (PMA). Graphs show the percentage of DAPI+Helix NP NIR+ cells after either 4 hr (n=6) or overnight culture (n=4). Each point represents a different donor. (D) A still image of in vitro time-lapse movie shows exposed neutrophil DNA (red, propidium iodide), neutrophil nucleus (cyan, Hoechst), and SARS-CoV-2 Spike protein (trimer, green) bearing A549 cells. Plated A549 cells were treated with Spike protein (0.5 μg/ml) 24 hr prior to Hoechst-stained human neutrophil seeding. Propidium iodide (1 μg/ml) was added to the culture media and time-lapse images acquired every 10 min for 5 hr. Sequential DIC images overlaid with fluorescent images show neutrophil NETosis. White arrowhead indicates a neutrophil’s intact nucleus (cyan, Hoechst). Black arrowheads delineate a neutrophil undergoing NETosis as detected by exposed DNA (red). Scale bars, 30 and 10 μm. *p<0.05; **p<0.01; ***p<0.005.
-
Figure 5—source data 1
Source data for Figure 5B.
- https://cdn.elifesciences.org/articles/86764/elife-86764-fig5-data1-v1.xlsx
-
Figure 5—source data 2
Source data for Figure 5C.
- https://cdn.elifesciences.org/articles/86764/elife-86764-fig5-data2-v1.xlsx
Figure 6
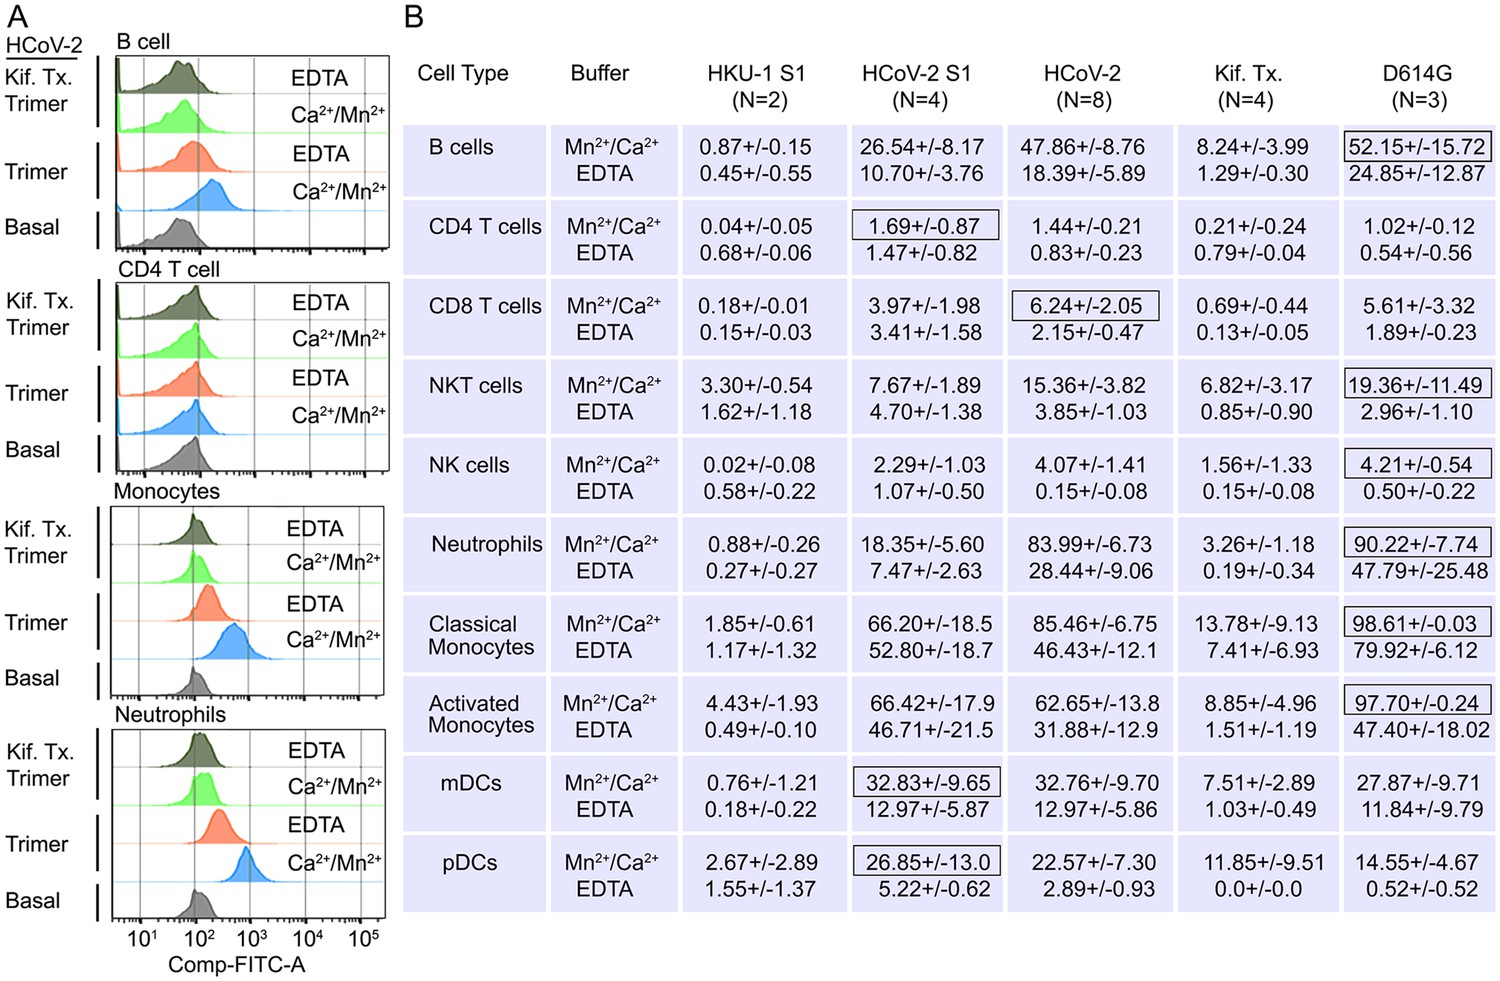
Binding of recombinant SARS-CoV Spike proteins to human peripheral blood leukocytes.
(A) Representative flow cytometry histograms of various cell populations prepared from whole blood incubated with labeled recombinant SARS-CoV-2 Spike protein (Trimer), or Spike protein from Kifunensine-treated cell (Kif. Tx. Trimer), binding done in the presence of Ca2+/Mn2+ or EDTA. (B) Percentage of various cell populations prepared from whole blood that bound labeled HKU1 S1 protein (HKU-1 S1), SARS-CoV-2 S1 protein (HCoV-2 S1), SARS-CoV-2 Spike protein (HCoV-2 Trimer), Spike protein purified from Kifunesine-treated cells (Kif. Tx. Trimer), or D614G Spike protein. Binding done in the presence of Ca2+/Mn2+ or EDTA and assessed by flow cytometry. Background fluorescent (unstained) subtracted from fluorescent signal. Data are from two to eight independent experiments. The recombinant protein that bound the highest % of cells of the different cell types is designated with black outline.
Figure 7
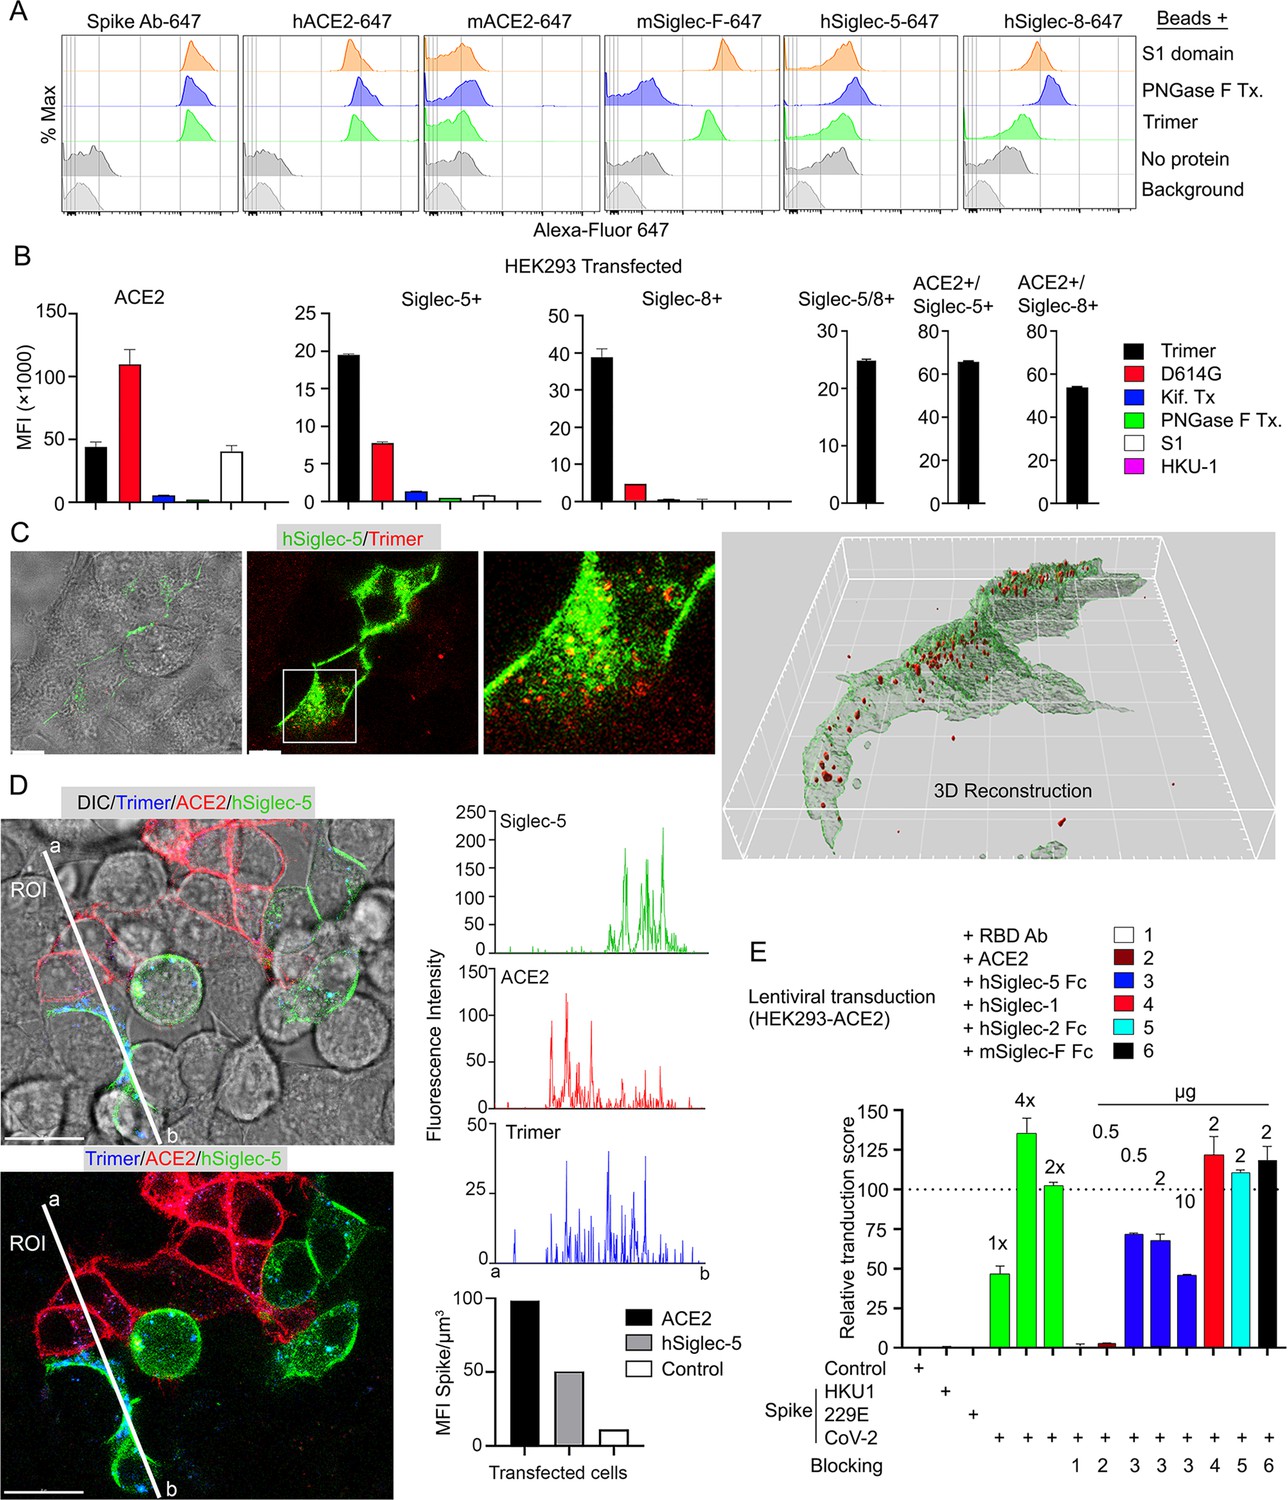
Role of Siglecs in SARS-CoV-2 Spike capture.
(A) Histograms show mean fluorescence of conjugated recombinant proteins and antibody on nanobeads that are coated with indicated SARS-CoV-2 Spike proteins. Background signal (weak gray) measured with uncoated beads. No protein (gray) means that uncoated beads were incubated with indicated labeled recombinant protein or antibody. (B) Flow cytometry assessment of indicated Spike proteins binding to HEK293 cell permanently transfected with angiotensin converting enzyme II (ACE2), various Siglecs, or a combination. Dual transfected HEK293 cells noted as Siglec-5/8+, ACE2/Siglec-5+, and ACE2/Siglec-8+. Labeled recombinant proteins were incubated with 5×10³ HEK293 cells on ice for 30 min. Data shown as mean fluorescent intensity. (C) DIC and confocal micrographs showing SARS-CoV-2 Spike (Trimer, red) protein acquisition by human Siglec-5-GFP transfected HEK293. ROI-1 in the middle panel is enlarged at the right panel. A 3D-reconstituted volume image of Siglec-5 transfected cell (far right) shows Siglec-5-mediated Spike protein acquisition. Scale bars, 30 and 10 μm. (D) DIC and confocal images show SARSCoV-2 Spike protein acquisition by human Siglec-5-GFP or ACE2-OFP transfected HEK293. Equal numbers of stable transfectants expressing Siglec-5-GFP or ACE2-OFP, and non-transfectant were seeded together. Spike protein (Trimer, blue) was added 1 hr prior to imaging. In a region of interest (ROI) line ab fluorescence intensity of Siglec-5-GFP, ACE2-OFP, and SARS-CoV-2 Spike trimer were analyzed. Fluorescent intensity graphs show fluorescence intensity of each signal in ROI. Amount of 3D-reconstructed volume of SARS-CoV-2 Spike protein in each stable cell and HEK293 cell were analyzed and plotted in graph. Graphs show quantity of mean fluorescence intensity of SARS-CoV-2 Spike protein in unit volume (µm3) of indicated cell types. Scale bars, 20 μm. (E) Transduction of Spike protein expressing lentiviruses into ACE2/HEK293 transfectants. Lentiviruses envelop proteins: control (none), human coronavirus HKU1 Spike protein (HKU1), human coronavirus 229E Spike protein (229E), and SARS-CoV-2 Spike protein (CoV-2) are indicated. The volume of virus concentrates used for transduction is denoted as 1×, 2×, and 4× on the graph (bright green bars). Transduction scores were normalized to 2× transduction efficiency. Various recombinant proteins or antibodies used for inhibition assay are indicated. Recombinant proteins or RBD neutralizing antibody were added 0.5 hr before lentivirus transduction. Three days later GFP expression was quantitated by flow cytometry. Results are from three separate experiments. Statistics, 2× vs 2×+hSiglec-5 Fc (10 µg), p<0.0005 (n=3). GFP, green fluorescent protein.
-
Figure 7—source data 1
Source data for Figure 7B.
- https://cdn.elifesciences.org/articles/86764/elife-86764-fig7-data1-v1.xlsx
-
Figure 7—source data 2
Source data for Figure 7D.
- https://cdn.elifesciences.org/articles/86764/elife-86764-fig7-data2-v1.xlsx
-
Figure 7—source data 3
Source data for Figure 7E.
- https://cdn.elifesciences.org/articles/86764/elife-86764-fig7-data3-v1.xlsx
Figure 8
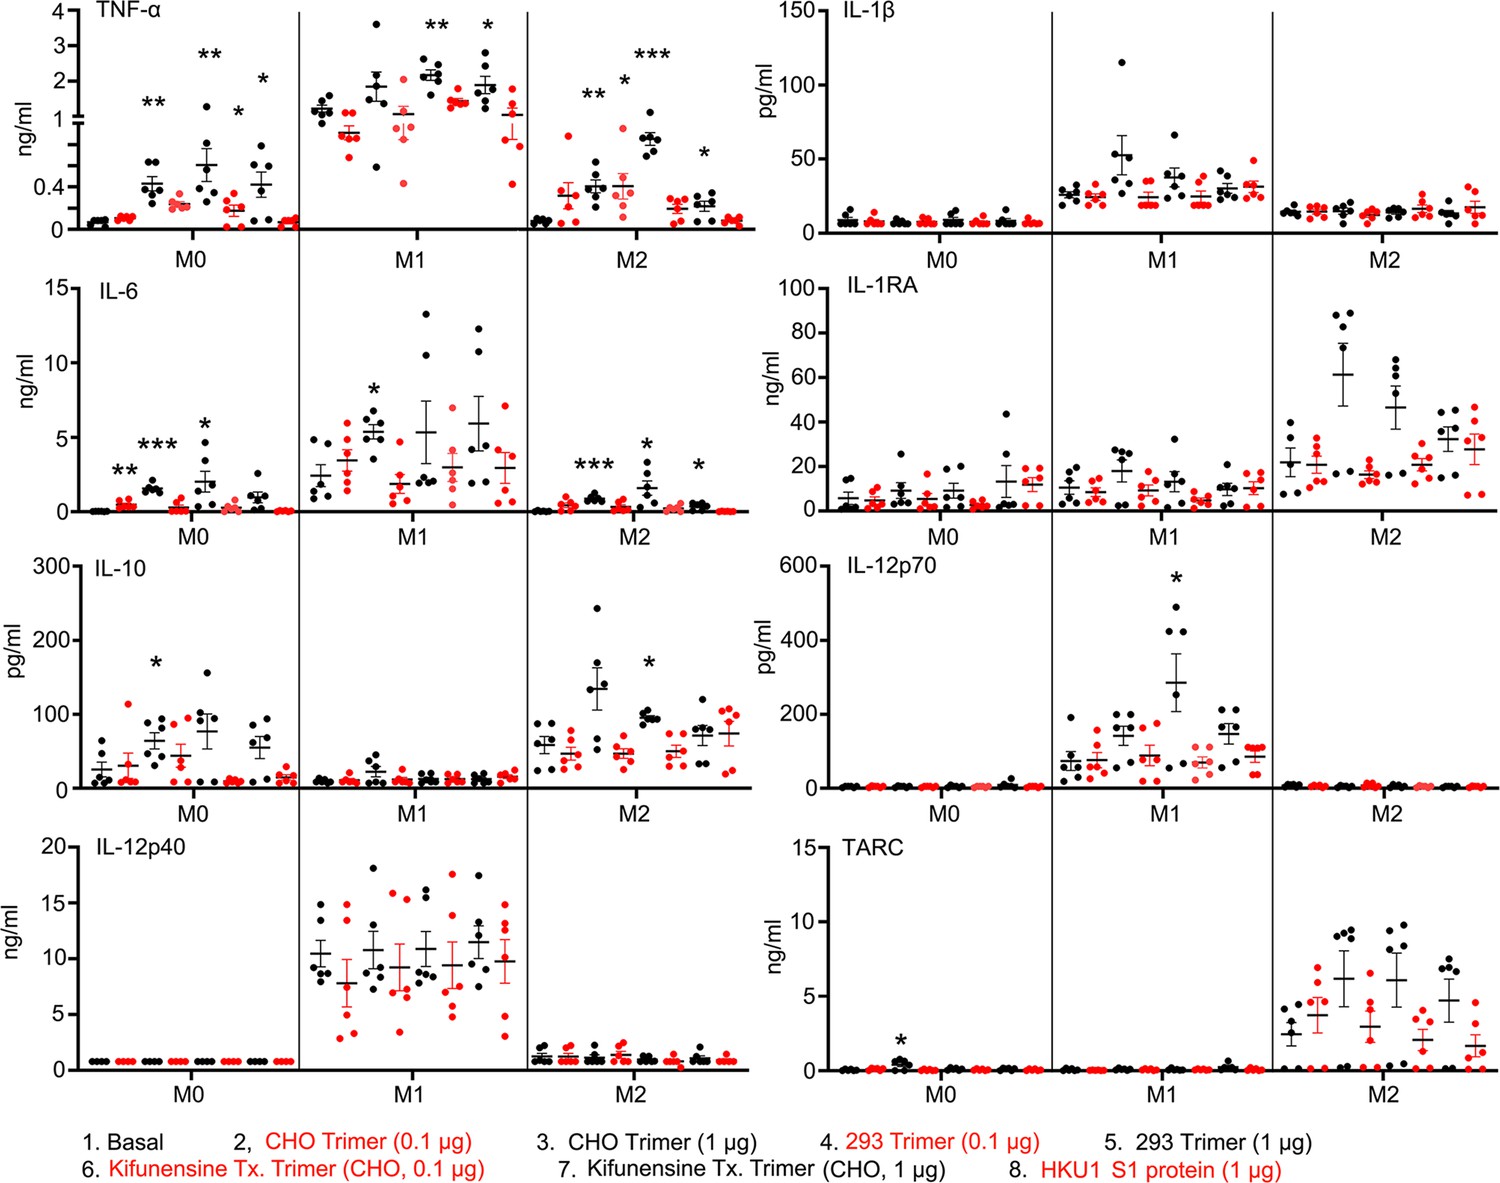
Macrophage cytokine profiles following exposure to different Spike proteins.
Quantification of macrophage-associated cytokines in response to indicated Spike proteins. The graph shows the tumor necrosis factor-α (TNF-α), IL1β, IL-6, IL-12p70, IL-12p40, and TARC quantification of M0, M1, or M2 macrophage cultures following stimulation, or not, with SARS-CoV-2 Spike proteins derived from CHO cells (CHO Trimer; 0.1 or 1 µg/ml), or 293F cells (293 Trimer; 0.1 or 1 µg/ml), or purified Spike protein from Kifunensine-treated CHO cells (Kifunensine Tx. Trimer; 0.1 or 1 µg/ml), or human coronavirus HKU1 S1 protein (HKU1 S1 protein; 1 µg/ml) for 48 hr. The error bars denote the mean ± SEM. Two-way ANOVA was used to compare treated samples to basal M0, M1, or M2 population (n=6, *p<0.05; **p<0.01; ***p<0.001).
-
Figure 8—source data 1
Source data for Figure 8.
- https://cdn.elifesciences.org/articles/86764/elife-86764-fig8-data1-v1.xlsx
Author response image 1

Spike protein-incorporated NL4.3 VLPs test with human ACE2-transfected HEK293 cells.
The wild-type spike protein-incorporated VLPs and delta envelope NL4.3 VLPs were analyzed using human ACE2-transfected HEK293 cells. The first plot shows ACE2 expression levels in HEK293 cells. The second plot displays the binding pattern of Delta Env NL4.3 VLPs on ACE2-expressing HEK293 cells. The third plot illustrates the binding pattern of wild-type spike protein-incorporated NL4.3 VLPs on ACE2expressing HEK293 cells. The histogram provides a comparison of VLP binding strength to ACE2expressing HEK293 cells.
Author response image 2

Size exclusion chromatography.
The peak lines represent the absorbance at 280 nm. PNGase F-treated spike proteins were loaded onto a Superdex 26/60 column, resolved at a flow rate of 1.0 ml/min, and collected in 1 ml fractions.
Author response image 3

FACS analysis of various spike protein-bound beads.
Protein bound beads were detected with labeled spike antibody, recombinant human ACE2, and recombinant mouse Siglec-F.
Videos
Video 1
Local Spike protein injection results in neutrophil recruitment in the cremaster muscle.
Confocal intravital microscopy movie shows neutrophils (green), platelets (red), endothelium (blue) immunostained with Alexa Fluor 488-Gr1, DyLight 649-GP1bβ, and Alexa Fluor 555-CD31 monoclonal antibodies, respectively. Intrascrotal injection of PBS or Spike protein (5 µg) 3–4 hr prior to imaging. The first sequence spans an ~60 min (PBS) while the second sequence spans an ~45 min (Spike) imaging period. Images were captured at ~1 frame per 30 s with ~×100 magnification. Time counter is hour:minute:second.
Video 2
Local injection of Spike proteins causes neutrophil fragmentation.
Confocal intravital microscopy movie shows neutrophils (green), platelets (red), endothelium (blue) immunostained with Alexa Fluor 488Gr1, Dylight 649-GP1bβ, and Alexa Fluor 555-CD31 monoclonal antibodies, respectively. Intrascrotal injection of Il-1β or Il-1β plus 5 µg Spike protein ~20 hr prior to imaging. Both sequences span a 20 min period. Images were captured at ~1 frame per 30 s with ~×100 magnification. Time counter is hour:minute:second.
Video 3
Intravenously injected Spike protein outlines liver sinusoids and accumulates on Kupffer cells.
The liver imaging was taken at three different time points; from 20 min to 1 hr, from 1 hr 10 min to 1 hr 15 min, and from 1 hr 25 min to 46 min after SARS-CoV-2 Spike protein (green, Alexa Fluor 488) injection. An image sequence of a 12 μm z-projection was acquired with 40× lens as scanning speed of 11.05 s between frames. Kupffer cells (magenta, F4/80) and neutrophils (red, Ly6G) in liver sinusoid vasculature (cyan, CD31) were visualized with antibody injection into tail vein at 30 min prior to imaging. The scale bar represents 20 μm. Time counter is hour:minute:second.
Video 4
Neutrophils undergo NETosis when plated on A549 cells in the presence of Spike protein.
A549 cells were plated on chamber slide 48 hr before trimer treatment. SARS-CoV-2 Spike trimer (green) was added to A549 cell culture 24 hr before neutrophil seeding. Purified human neutrophils stained with Hoechst (cyan) and were seeded on A549 cells in propidium iodide (PI, 1 μg/ml) containing culture media. NETosis of neutrophils were detected by exposed DNA (red, PI). An image sequence of a 20 μm z-projection was acquired with 40× lens at a scanning speed 1 frame/10 min over 5 hr. Regions of interest (Box A and Box B) demonstrate that a typical NETosis of neutrophil contacting on trimer bearing A549 cell was enlarged in second part of video. Scale bars, 30 and 10 μm. Time banner, hour:minute:second.
Video 5
hSiglec-5 expressing HEK293 cells bind and endocytosis Spike protein.
Individually established stable transfected cells expressing Siglec-5-GFP or ACE2-OFP were plated in the same chamber slide with non-transfection cells. After overnight culture SARS-CoV-2 Spike protein (1 μg/ml) was overlaid for 1 hr before imaging. An image sequence of a 3 μm z-projection was acquired with 40× lens at a scanning speed of 23 s between frames. Signals visualized as SARS-CoV-2 Spike trimer (blue), Siglec-5-GFP (green), ACE2-OFP (red), and non-transfected HEK293 cells (gray). The scale bar represents 20 μm. Time counter is hour:minute:second. ACE2, angiotensin converting enzyme II. GFP, green fluorescent protein.
Tables
Key resources table
| Reagent type (species) or resource | Designation | Source or reference | Identifiers | Additional information |
|---|---|---|---|---|
| Cell line (hamster, Chinese) | FreeStyle CHO-S Cells | Thermo Fisher Scientific | R80007 | |
| Cell line (Homo sapiens) | FreeStyle 293-F Cells | Thermo Fisher Scientific | R79007 | |
| Cell line (Homo sapiens) | 293T | ATCC | CRL-3216 | |
| Cell line (Homo sapiens) | 293 [HEK-293] | ATCC | CRL-1573 | |
| Cell line (Homo sapiens) | A549 | ATCC | CRM-CCL-185 | |
| Antibody | PerCP-Cy5.5 Anti-Mouse Ly6G (rat monoclonal) | BD Biosciences | RRID: AB_1727563 | FACS (1:800) |
| Antibody | PE Anti-Mouse I-A/I-E (rat monoclonal) | BD Biosciences | RRID: AB_396546 | FACS (1:300) |
| Antibody | PE/Cyanine7 anti-mouse CD24 (rat monoclonal) | BioLegend | RRID: AB_756048 | FACS (1:300) |
| Antibody | PerCP/Cy5.5 anti-mouse CD24 (rat monoclonal) | BioLegend | RRID: AB_1595491 | FACS (1:500) |
| Antibody | Alexa Fluor 647 anti-mouse CD64 (FcγRI) (rat monoclonal) | BioLegend | RRID: AB_2566561 | FACS (1:500) |
| Antibody | Alexa Fluor 488 anti-mouse CD31 (rat monoclonal) | BioLegend | RRID: AB_493408 | FACS (1:300) Intravital (10–20 μl per mouse, i.v.) |
| Antibody | APC-Cy7 Rat Anti-Mouse Siglec-F | BD Biosciences | RRID: AB_2732831 | FACS (1:300) |
| Antibody | PE anti-mouse CD170 (Siglec-F) (rat monoclonal) | BD Biosciences | RRID: AB_394341 | FACS (1:300) IF (1:200) |
| Antibody | Alexa Fluor 647 Anti-Mouse Siglec-F (rat monoclonal) | BD Biosciences | RRID: AB_2687570 | FACS (1:300) |
| Antibody | BV421Anti-Mouse Ly6C (rat monoclonal) | BD Biosciences | RRID: AB_2737748 | FACS (1:500) |
| Antibody | PE/Dazzle 594 anti-mouse CD19 (rat monoclonal) | BioLegend | RRID: AB_2564001 | FACS (1:300) |
| Antibody | Brilliant Violet 421 anti-mouse F4/80 (rat monoclonal) | BioLegend | RRID: AB_2563102 | FACS (1:500) |
| Antibody | PE anti-mouse CD169 (Siglec-1) (rat monoclonal) | BioLegend | RRID:AB_10915697 | FACS (1:500) |
| Antibody | PE anti-human CD16 (mouse monoclonal) | BioLegend | RRID: AB_2562749 | FACS (1:800) |
| Antibody | PE/Cyanine7 anti-human CD56 (NCAM) (mouse monoclonal) | BioLegend | RRID: AB_2563927 | FACS (1:600) |
| Antibody | APC Anti-Human CD4 (mouse monoclonal) | BD Bioscience | RRID: AB_398521 | FACS (1:500) |
| Antibody | APC/Cyanine7 anti-human CD8a Antibody | BioLegend | RRID: AB_314134 | FACS (1:500) |
| Antibody | Brilliant Violet 421 anti-human HLA-DR (mouse monoclonal) | BioLegend | RRID: AB_2561831 | FACS (1:1000) |
| Antibody | Brilliant Violet 650 anti-human CD14 (mouse monoclonal) | BioLegend | RRID: AB_2563799 | FACS (1:500) |
| Antibody | Brilliant Violet 711 anti-human CD20 Antibody | BioLegend | RRID: AB_2562602 | FACS (1:300) |
| Antibody | PE/Cyanine7 anti-human CD20 (mouse monoclonal) | BioLegend | RRID: AB_314260 | FACS (1:300) |
| Antibody | PE anti-human CD123 (mouse monoclonal) | BioLegend | RRID: AB_314580 | FACS (1:100) |
| Antibody | APC/Cyanine7 anti-human CD15 (SSEA-1) (mouse monoclonal) | BioLegend | RRID: AB_2750190 | FACS (1:400) |
| Antibody | APC anti-human CD66b (mouse monoclonal) | BioLegend | RRID: AB_2566607 | FACS (1:500) |
| Antibody | Brilliant Violet 421 anti-human CD11c (mouse monoclonal) | BioLegend | RRID: AB_2564485 | FACS (1:200) |
| Antibody | BD Pharmingen PerCP-Cy5.5 Anti-Human CD3 (mouse monoclonal) | BDBioscience | RRID: AB_394493 | FACS (1:300) |
| Antibody | PE Anti-Human CD22 (mouse monoclonal) | BD Bioscience | RRID: AB_2737845 | FACS (1:100) |
| Antibody | APC anti-human CD170 (Siglec-5) (mouse monoclonal) | BioLegend | RRID: AB_2564262 | FACS (1:200) |
| Antibody | APC anti-human Siglec-8 (mouse monoclonal) | BioLegend | RRID: AB_2561402 | FACS (1:200) |
| Antibody | Alexa Fluor 647 anti-mouse CD169 (Siglec-1) (rat monoclonal) | BioLegend | RRID: AB_2563621 | FACS (1:300) IF (1:500) |
| Antibody | Human Siglec-8 (mouse monoclonal) | R&D Systems | MAB7975 | FACS (1:200) |
| Antibody | PE-Human Siglec-8 (mouse monoclonal) | R&D Systems | RRID: AB_2905537 | FACS (1:200) |
| Antibody | Alexa Fluor 647-Human Siglec-1/CD169 (mouse monoclonal) | R&D Systems | RRID: AB_2905550 | FACS (1:300) IF (1:200) |
| Antibody | Alexa Fluor 647- Human ACE-2 (mouse monoclonal) | R&D Systems | FAB9332R100UG | FACS (1:300) |
| Antibody | Alexa Fluor 750-Human Siglec-8 (mouse monoclonal) | R&D Systems | FAB7975S- 100UG | FACS (1:300) |
| Antibody | Alexa Fluor 405-Human ACE-2 (mouse monoclonal) | R&D Systems | FAB9332V- 100UG | FACS (1:300) |
| Antibody | Human/Mouse/Rat/Hamster ACE-2 Antibody (goat polyclonal) | R&D Systems | RRID: AB_355722 | FACS (1:300) Blocking (0.5 μg per test) |
| Antibody | SARS-CoV-2 (2019-nCoV) Spike Neutralizing Antibody (rabbit monoclonal) | SinoBiological | RRID: AB_2857936 | FACS (1:300) Blocking (0.5 μg per test) |
| Antibody | Rat IgG derivative against the GPIbβ subunit of the murine platelet/megakaryocyte-specific GPIb-V- IX complex antibody (rat IgG derivative) | Emfret | RRID: AB_2861336 | Intravital imaging (2 μl per mouse, i.v.) |
| Antibody | Mouse LYVE-1 Antibody (rat monoclonal) | R&D Systems | RRID: AB_2138528 | IF (1:400) |
| Antibody | PE anti-mouse Podoplanin Antibody (Syrian Hamster monoclonal) | BioLegend | RRID: AB_2161928 | IF (1:200) |
| Commercial assay or kit | LIVE/DEAD Fixable Aqua Dead Cell Stain Kit | Thermo Fisher Scientific | L34966 | FACS (1:1000) |
| Commercial assay or kit | Lenti-X Concentrator | Takara Bio USA Inc | 631232 | |
| Chemical compound, drug | Evans blue | Sigma-Aldrich | E2129-10G | |
| Chemical compound, drug | Propidium iodide (PI) | Sigma-Aldrich | P4864-10ML | |
| Chemical compound, drug | FluoSpheres NeutrAvidin-Labeled Microspheres, 0.2 µm, yellow-green fluorescent (505/515), 1% solids | Thermo Fisher Scientific Inc | F8774 | |
| Recombinant DNA reagent | SIGLEC5 (NM_003830) Human Tagged ORF Clone | Origene | RC206610 | |
| Recombinant DNA reagent | SIGLEC5 (NM_003830) Human Tagged ORF Clone | Origene | RG206610 | |
| Recombinant DNA reagent | Human Siglec-8 (NP_055257) VersaClone cDNA | Origene | RDC1496 | |
| Recombinant DNA reagent | SARS-CoV-2 Spike-S | Addgene | Plasmid # 154754 | Hsieh et al., 2020 |
| Recombinant DNA reagent | HIV-1 NL4-3 Gag-iGFP ΔEnv | NIH AIDS Reagent Program | 12455 | |
| Recombinant DNA reagent | Human Coronavirus Spike glycoprotein Gene ORF cDNA clone expression plasmid (Codon Optimized) HCoV-HKU1 | SinoBiological | VG40021-UT | |
| Recombinant DNA reagent | Human coronavirus (HCoV-229E) Spike Gene ORF cDNA clone expression plasmid (Codon Optimized) HCoV-229E | SinoBiological | VG40605-UT | |
| Recombinant DNA reagent | ACE2 cDNA ORF Clone, Human, C-OFPSpark tag | SinoBiological | HG10108-ACR | |
| Recombinant DNA reagent | pCMV-dR8.2 dvpr | Addgene | 8455 | |
| Recombinant DNA reagent | pLentipuro3 TO V5-GW EGFP-Firefly Luciferase | Addgene | 119816 | |
| Peptide, recombinant protein | ACE2 Protein, Human, Recombinant (mFc Tag) | SinoBiological | 10108-H05H | |
| Peptide, recombinant protein | Human coronavirus HKU1 (isolate N5) (HCoV-HKU1) Spike/S1 Protein (S1 Subunit, His Tag) | SinoBiological | 40602-V08H | |
| Peptide, recombinant protein | Human coronavirus (HCoV-229E) Spike Protein (S1+S2 ECD, His Tag) | SinoBiological | 40605-V08B | |
| Peptide, recombinant protein | SIGLEC5 Protein, Human, Recombinant (hFc Tag) | SinoBiological | 11798-H02H | |
| Peptide, recombinant protein | Recombinant Mouse Siglec-F Fc Chimera Protein, CF | R&D Systems | 1706-SF-050 | |
| Peptide, recombinant protein | Recombinant Human Siglec-8 Fc Chimera Protein, CF | R&D Systems | 9045-SL-050 | |
| Strain, strain background (mouse) | C57BL/6J | Jackson Lab. | IMSR_JAX:000664 | Jax stock 000664 |
| Strain, strain background (mouse) | K18-hACE2 (B6.Cg- Tg(K18- ACE2) 2Prlmn/J) | Jackson Lab. | IMSR_JAX:034860 | Jax stock 034860 |
| Other | Liberase TL(Thermolysin Low) Research Grade | Roche Applied Science | 5401020001 | Enzyme |
| Other | Opti-MEM | Thermo Fisher Scientific Inc. | 31985070 | Cell culture media |
| Other | RPMI 1640 Media | Thermo Fisher Scientific Inc. | 11875093 | Cell culture media |
| Other | TransIT-293 Transfection Reagent | Mirus Bio LLC | MIR 2704 | Cell culture media |
| Other | FreeStyle 293 Expression Medium | Thermo Fisher Scientific Inc. | 12338018 | Cell culture media |
| Other | FreeStyle CHO Expression Medium | Thermo Fisher Scientific Inc. | 12651014 | Cell culture media |
Additional files
Download links
A two-part list of links to download the article, or parts of the article, in various formats.
Downloads (link to download the article as PDF)
Open citations (links to open the citations from this article in various online reference manager services)
Cite this article (links to download the citations from this article in formats compatible with various reference manager tools)
Murine alveolar macrophages rapidly accumulate intranasally administered SARS-CoV-2 Spike protein leading to neutrophil recruitment and damage
eLife 12:RP86764.
https://doi.org/10.7554/eLife.86764.3


