Antipsychotic drugs selectively decorrelate long-range interactions in deep cortical layers
- Friedrich Miescher Institute for Biomedical Research, Switzerland
- Faculty of Science, University of Basel, Switzerland
Figures
Figure 1 with 4 supplements
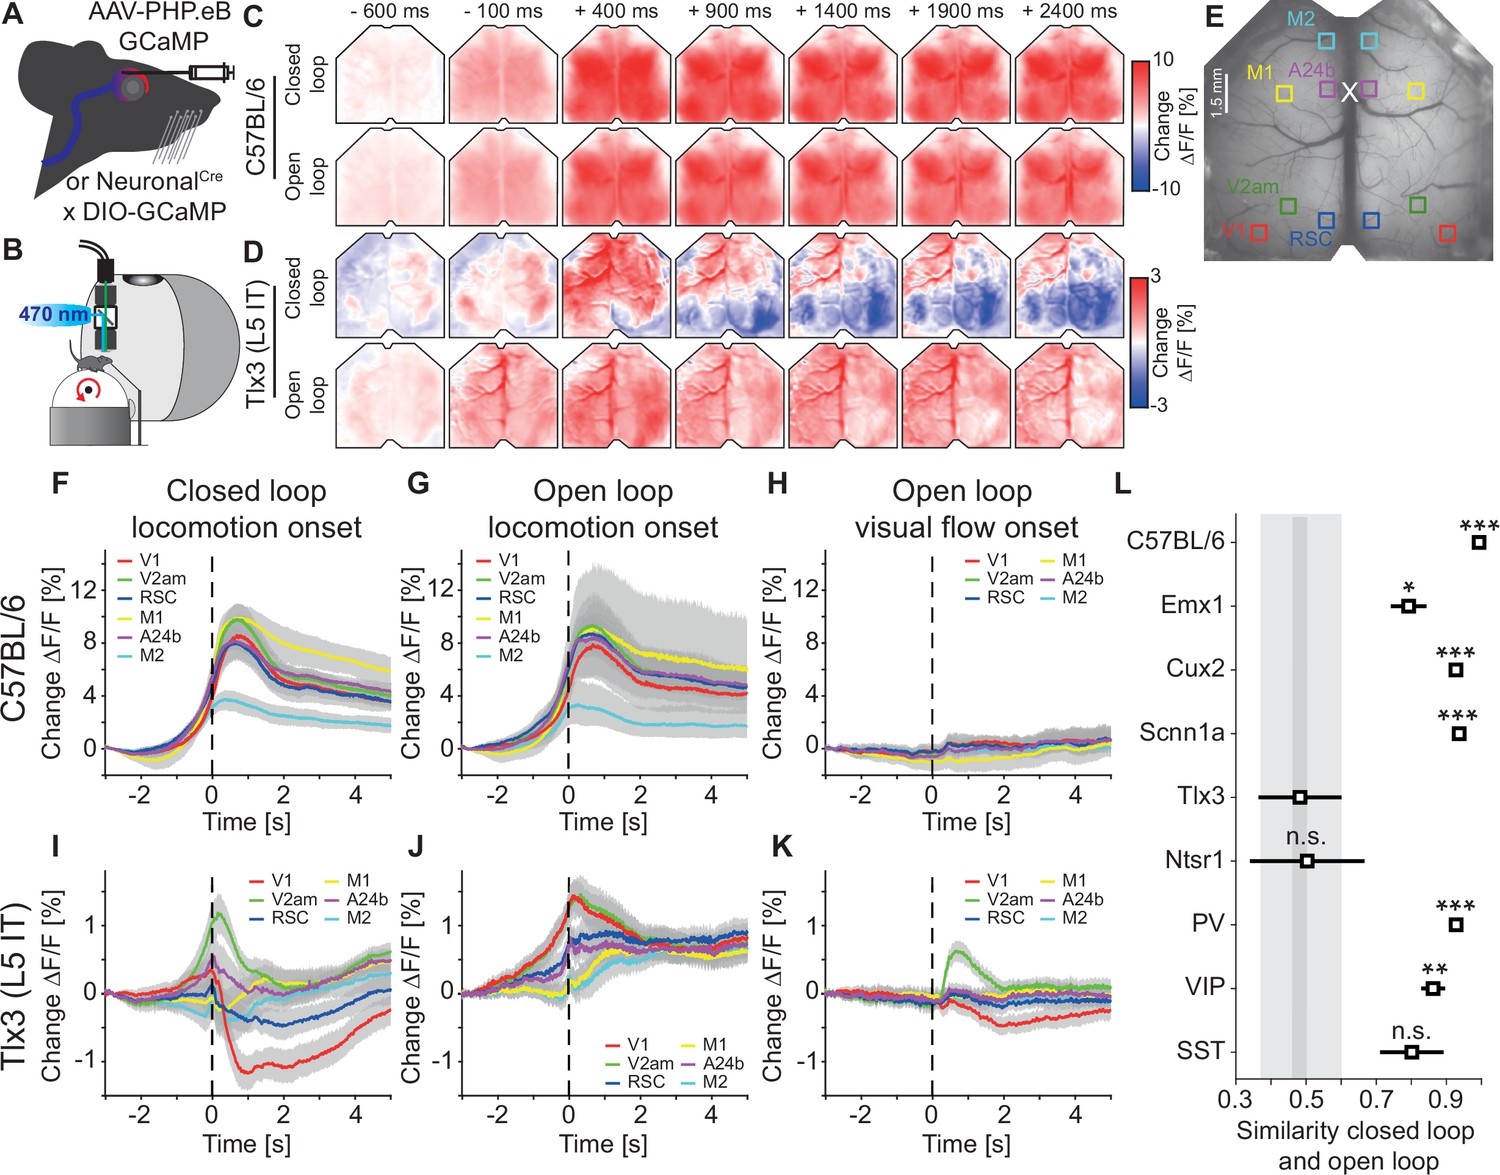
Activation patterns in deep cortical layers distinguished closed and open loop locomotion onsets more strongly than superficial layers.
(A) Schematic of GCaMP expression strategy. We either injected an AAV-PHP.eB virus retro-orbitally to express GCaMP brain wide (C57BL/6), in cortical excitatory neurons (Emx1-Cre) or in a subset of SST positive interneurons (see Methods and Supplementary file 2), or used the progeny of a cross of a cell type-specific Cre driver line (NeuronalCre: Cux2-CreERT2, Scnn1a-Cre, Tlx3-Cre, Ntsr1-Cre, PV-Cre, VIP-Cre, or SST-Cre) with the Ai148 GCaMP6 reporter line. All mice were then implanted with a crystal skull cranial window prior to imaging experiments. (B) Schematic of the experimental setup. We imaged GCaMP fluorescence under 470 nm LED illumination with an sCMOS camera through a macroscope. Mice were free to locomote on an air-supported spherical treadmill while coupled (closed loop), uncoupled (open loop), or no (dark) visual flow in the form of movement along a virtual corridor was displayed on a toroidal screen placed in front of the mouse. Walls of the virtual corridor were patterned with vertical sinusoidal gratings. In a separate condition, we then presented drifting grating stimuli (grating session, see Methods). (C) Average response in an example C57BL/6 mouse that expressed GCaMP6 brain wide during closed loop locomotion onsets (top row, 83 onsets) and open loop locomotion onsets (bottom row, 153 onsets). Locomotion onsets in both conditions activated dorsal cortex similarly. (D) As in C, but in an example Tlx3-Cre × Ai148 mouse that expressed GCaMP6 in layer 5 (L5) intratelencephalic (IT) neurons during closed loop locomotion onsets (top row, 88 onsets) and open loop locomotion onsets (bottom row, 83 onsets). Note that activity decreased in posterior regions of dorsal cortex during closed loop locomotion onsets. (E) Example crystal skull craniotomy marking the six regions of interest in each hemisphere we selected: primary visual cortex (V1, red), retrosplenial cortex (RSC, blue), antero-medial secondary visual cortex (V2am, green), primary motor cortex (M1, yellow), anterior cingulate cortex (A24b, purple), and secondary motor cortex (M2, cyan). The white cross marks bregma. (F) Average response during closed loop locomotion onsets in C57BL/6 mice that expressed GCaMP brain wide in the six regions of interest (activity was averaged across corresponding regions in both hemispheres). Mean (lines) and 90% confidence interval (shading) are calculated as a hierarchical bootstrap estimate for each time bin (see Methods and Supplementary file 1). (G) As in F, but for open loop locomotion onsets. (H) As in F, but for visual flow onsets in the open loop condition restricted to times when the mice were not locomoting. (I) Average response during closed loop locomotion onsets in Tlx3-Cre × Ai148 mice that expressed GCaMP6 in L5 IT neurons, activity was averaged across corresponding regions in both hemispheres. Mean (lines) and 90% confidence interval (shading) are calculated as a hierarchical bootstrap estimate for each time bin (see Methods and Supplementary file 1). (J) As in I, but for open loop locomotion onsets. (K) As in J, but for visual flow onsets during open loop sessions restricted to times when the mice were not locomoting. (L) Similarity of the average closed and open loop locomotion onset responses quantified as the correlation coefficient between the two in a window –5 s to +3 s around locomotion onset (see Methods). Error bars indicate SEM over the 12 (6 per hemisphere) cortical regions. Statistical comparisons are against the Tlx3 data and were corrected for family-wise error rate (see Methods and Supplementary file 1): adjusted significance thresholds, n.s.: not significant, *: p<0.05/9, **: p<0.01/9, ***: p<0.001/9.
Figure 1—figure supplement 1
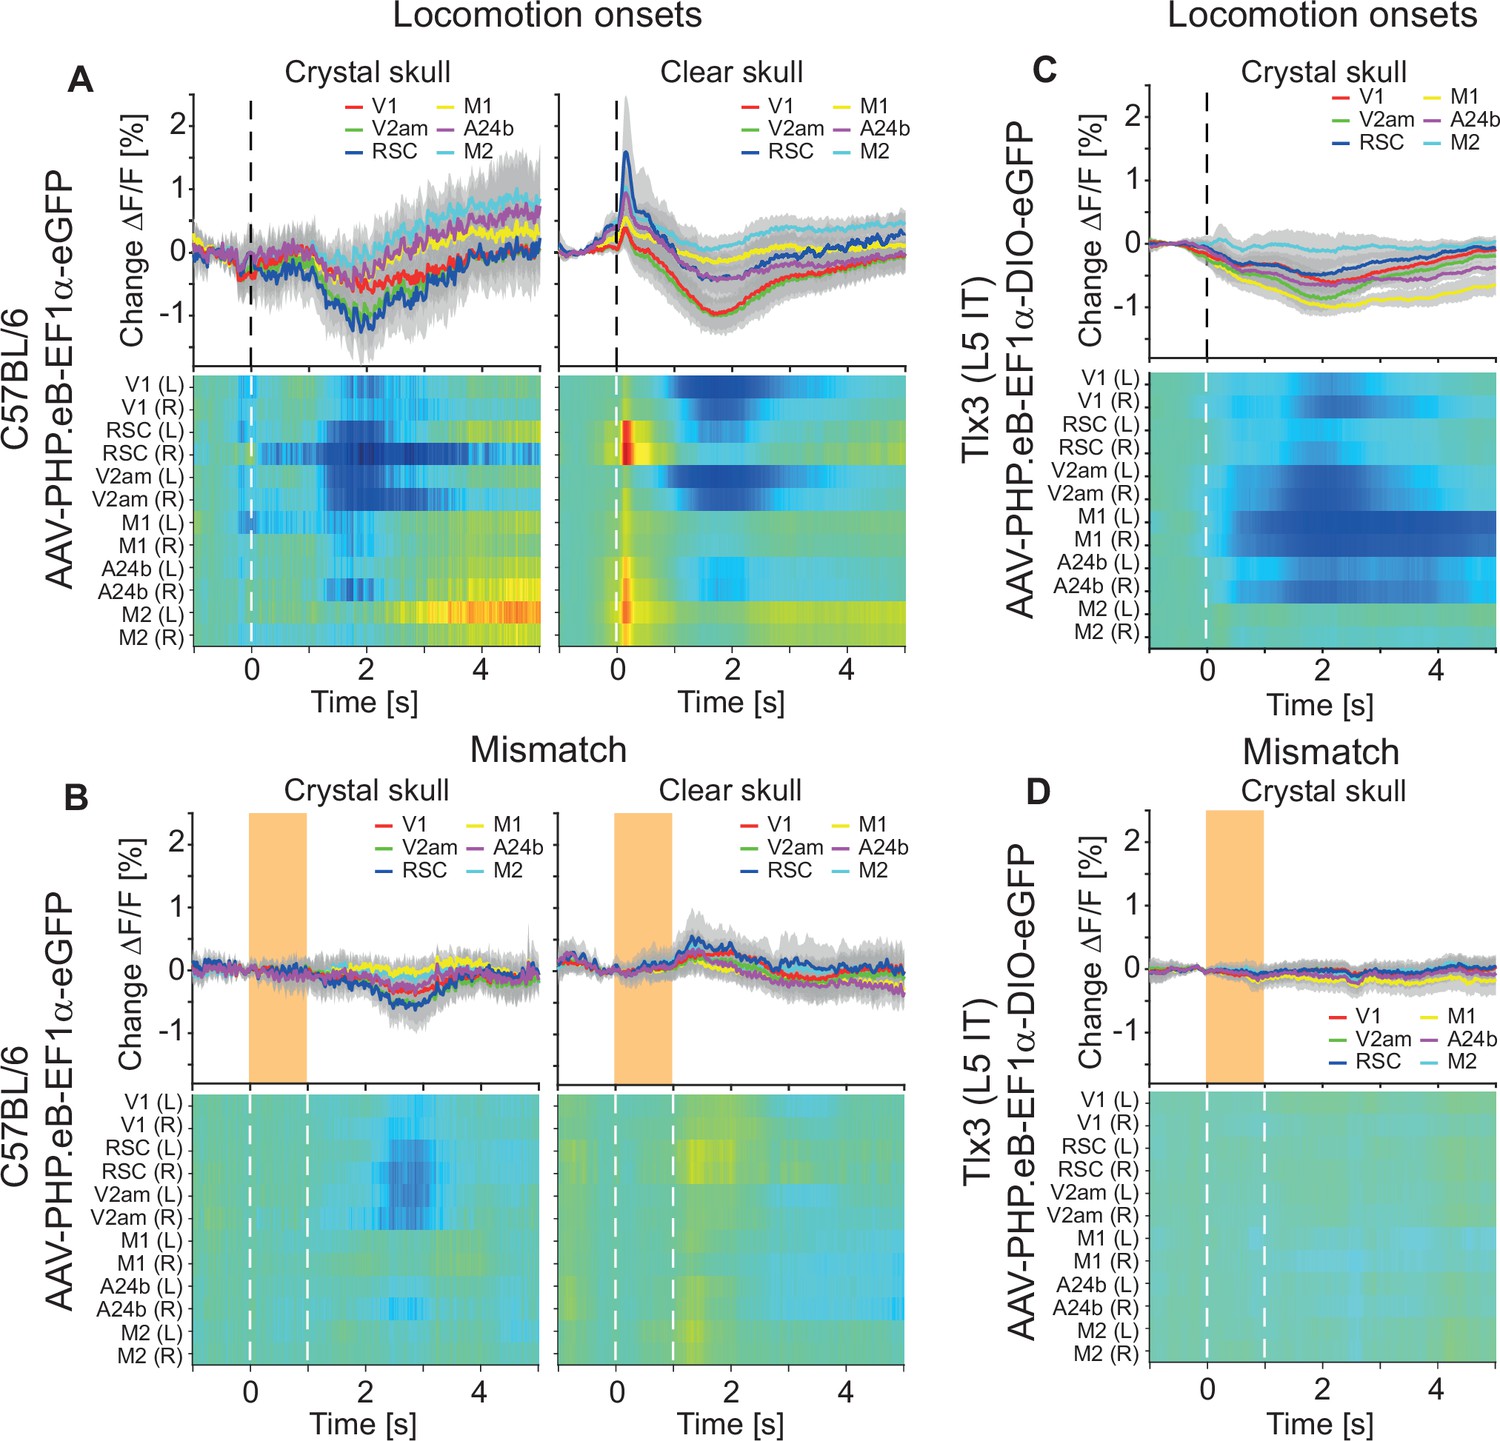
Fluorescence changes driven by hemodynamic occlusion.
(A) Average responses during locomotion onsets in C57BL/6 mice that expressed eGFP brain wide using a crystal skull preparation or in similarly transfected mice using a clear skull preparation (see Methods). Top row shows the average activity of corresponding regions in dorsal cortex. Mean (lines) and 90% confidence interval (shading) are calculated as a hierarchical bootstrap estimate for each time bin (see Methods and Supplementary file 1). The heatmaps in the bottom row show the responses for individual regions of interest. Heatmaps are scaled to the y-axis limits of the plot above (blue low, red high). Note, the fast onset transient apparent in the clear skull preparation was absent in the crystal skull preparation, while the slow decrease of activity was present in both. The increase in fluorescence at locomotion onset, which was primarily apparent in the clear skull preparation, is driven by hemodynamic occlusion. (B) As in A, but for mismatches. Orange shading (top) or white dashed lines (bottom) indicate the duration of the mismatch stimulus. (C) As in A, left, but for Tlx3-Cre that had been retro-orbitally injected with an AAV-PHP.eB-DIO-eGFP to express eGFP in layer 5 (L5) intratelencephalic (IT) neurons. (D) As in B, left, but for Tlx3-Cre that had been retro-orbitally injected with an AAV-PHP.eB-DIO-eGFP to express eGFP in L5 IT neurons.
Figure 1—figure supplement 2
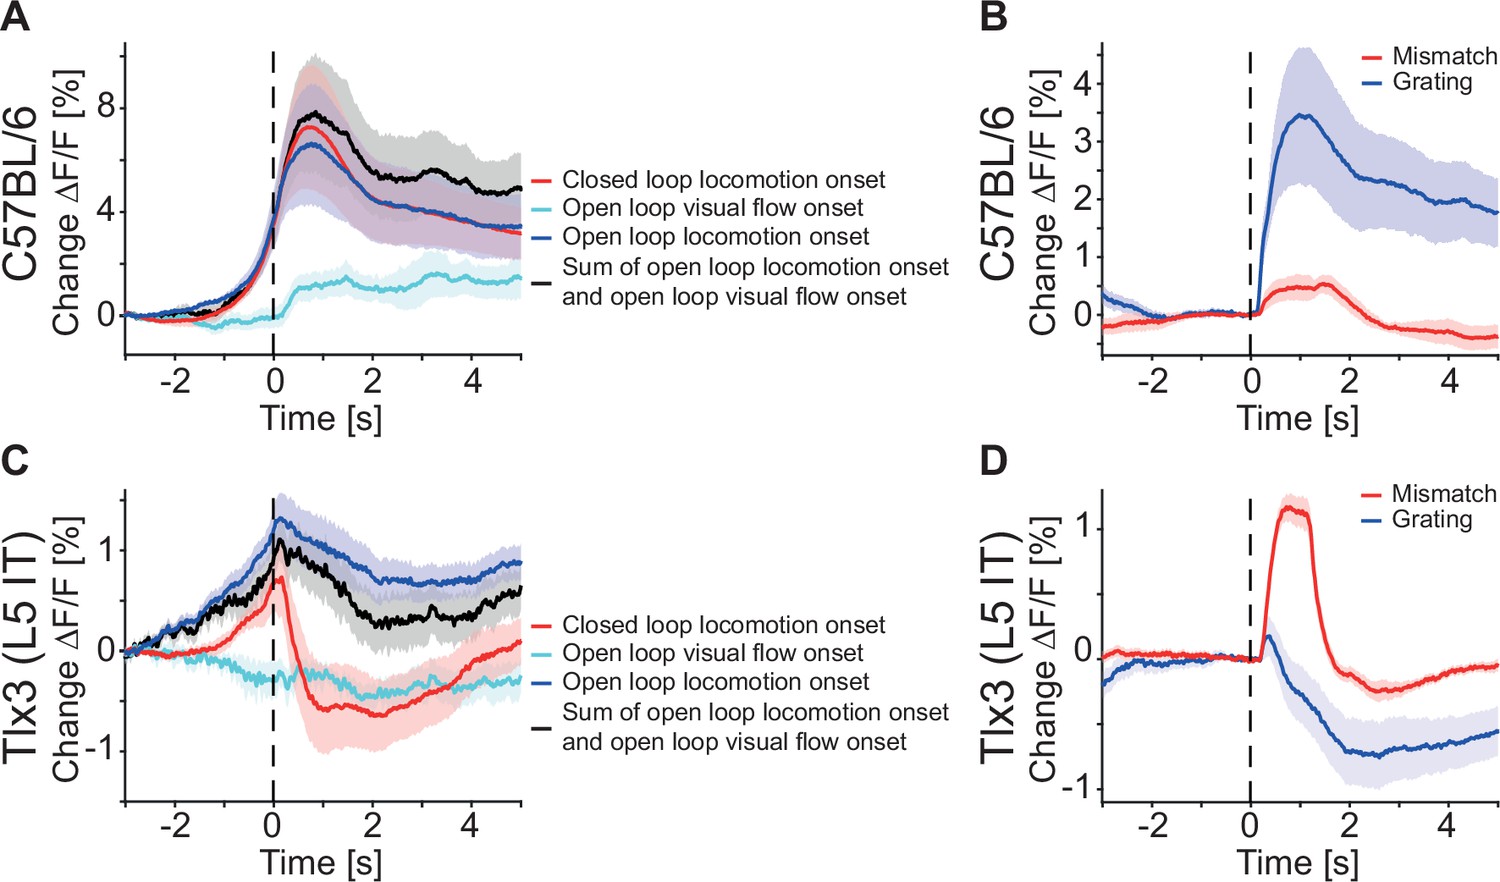
In primary visual cortex (V1), the sum of locomotion and visual flow onset could not explain the closed loop locomotion onset response of layer 5 (L5) intratelencephalic (IT) neurons.
(A) Average responses during closed (red) and open loop (blue) locomotion onsets, as well as open loop visual flow (turquoise) onsets, and the sum of open loop locomotion and open loop visual flow onsets (black) in C57BL/6 mice that expressed GCaMP brain wide (6 mice). Closed loop locomotion onset responses in V1 were larger than open loop locomotion onset responses, and part of this difference could be explained by the visual flow onset responses. Shading indicates SEM over mice. (B) Average response during mismatch (red) and full-field drifting grating onsets (blue) in six C57BL/6 mice that expressed GCaMP brain wide. Same data as in Figure 3B and C. Shading indicates SEM over mice. (C) As in A, but for Tlx3-Cre × Ai148 mice that expressed GCaMP6 in L5 IT neurons (15 mice). Closed loop locomotion onset responses in V1 could not be explained as the sum of open loop locomotion and visual flow onset responses. (D) As in B, but for Tlx3-Cre × Ai148 mice that expressed GCaMP6 in L5 IT neurons (15 mice). Same data as in Figure 3E and F.
Figure 1—figure supplement 3

Layer 5 (L5) intratelencephalic (IT) soma recorded in primary visual cortex (V1) with two-photon imaging show similar patterns of activity as the widefield signal recorded at the surface of the dorsal cortex.
(A) Average response of V1 recorded with the widefield macroscope during closed (solid) or open loop (dashed) locomotion onsets in Tlx3-Cre × Ai148 mice that expressed GCaMP6 in L5 IT neurons. Mean (lines) and 90% confidence interval (shading) are calculated as a hierarchical bootstrap estimate for each time bin (see Methods and Supplementary file 1). (B) Average response of L5 soma in V1, recorded with two-photon imaging in the same Tlx3-Cre × Ai148 mice that expressed GCaMP6 in L5 IT neurons as in A, during either closed loop (solid) or open loop (dashed) locomotion onsets. Shading indicates SEM over 8434 neurons. (C) As in A, but for responses to mismatches (solid), open loop halts (dashed) or drifting grating onsets (dotted). Mean (lines) and 90% confidence interval (shading) are calculated as a hierarchical bootstrap estimate for each time bin (see Methods and Supplementary file 1). (D) As in B, but for responses to mismatches (solid), open loop halts (dashed) or drifting grating onsets (dotted). Shading indicates SEM over 8434 neurons.
Figure 1—figure supplement 4
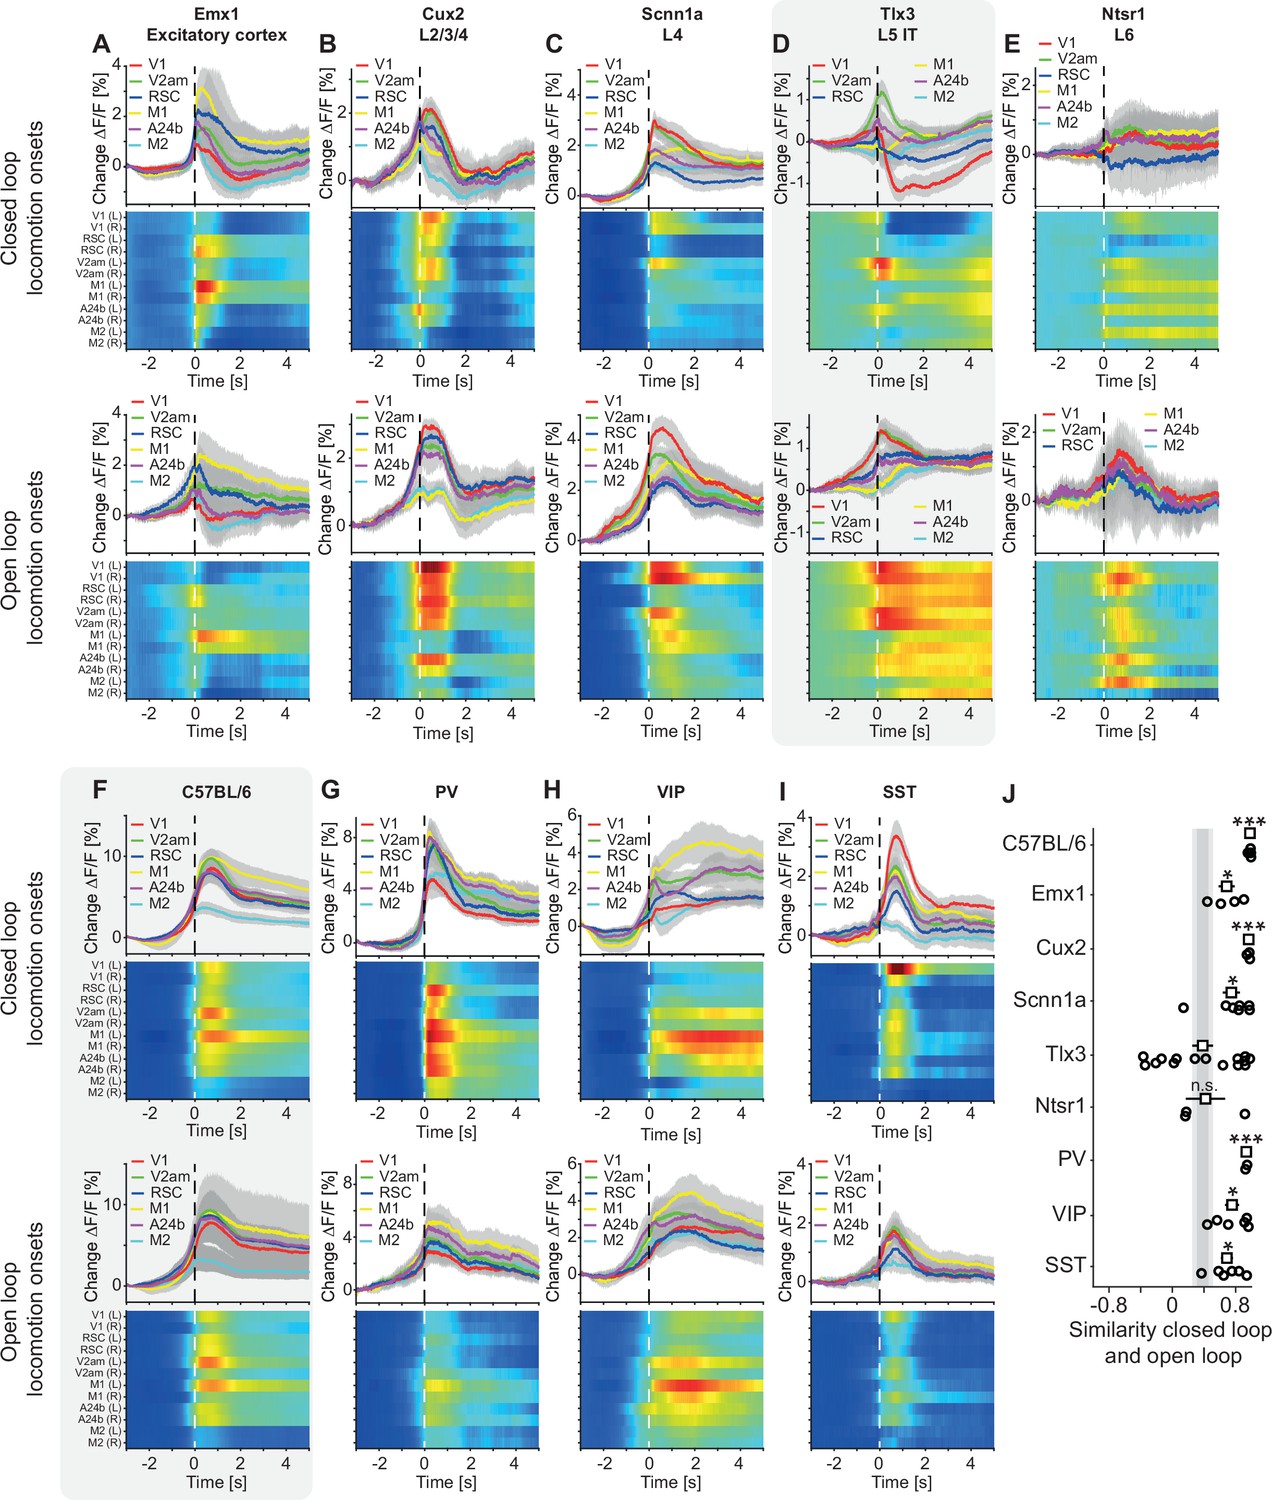
Layer 5 (L5) intratelencephalic (IT) neurons had strikingly different responses during closed and open loop locomotion onsets compared to other cortical neuron types.
(A) Average response during closed loop locomotion onsets (top) and open loop locomotion onsets (bottom) in Emx1-Cre mice that expressed GCaMP6 in excitatory cortical neurons. Mean (lines) and 90% confidence interval (shading) are calculated as a hierarchical bootstrap estimate for each time bin (see Methods and Supplementary file 1). Heatmaps are scaled to the y-axis limits of the plot above (blue low, red high). (B) As in A, but for Cux2-CreERT2 × Ai148 mice that expressed GCaMP6 in upper layer excitatory neurons. (C) As in A, but for Scnn1a-Cre × Ai148 mice that expressed GCaMP6 in L4 excitatory. (D) As in A, but for Tlx3-Cre × Ai148 mice that expressed GCaMP6 specifically in L5 IT neurons. Data are the same as in Figure 1I and K. (E) As in A, but for Ntsr1-Cre × Ai148 mice that expressed GCaMP6 in excitatory L6 neurons. (F) As in A, but for C57BL/6 mice that expressed GCaMP brain wide. Data are the same as in Figure 1F and G. (G) As in A, but for PV-Cre × Ai148 mice that expressed GCaMP6 in PV neurons. (H) As in A, but for VIP-Cre × Ai148 mice that expressed GCaMP6 in VIP neurons. (I) As in A, but for SST-Cre mice that expressed GCaMP6 in SST neurons. (J) Similarity of the average closed and open loop locomotion onset responses in V1 quantified as the correlation coefficient between the two in a window –5 s to +3 s around locomotion onset (left and right V1 were averaged, see Methods). Error bars indicate SEM over mice that had an average locomotion onset response of at least 1% ΔF/F in either the closed or the open loop condition (open circles: individual data points; 6 C57BL/6 mice, 4 Emx1-Cre mice, 7 Scnn1a-Cre mice, 14 Tlx3-Cre mice, 3 Ntsr1-Cre mice, 2 PV-Cre mice, 6 VIP-Cre mice, 6 SST-Cre mice, 3 Cux2-CreERT2 mice). Statistical comparisons are against the Tlx3 data and were corrected for family-wise error rate (see Methods and Supplementary file 1): adjusted significance thresholds, n.s.: not significant, *: p<0.05/9, **: p<0.01/9, ***: p<0.001/9.
Figure 2

Layer 5 (L5) intratelencephalic (IT) neurons were differentially activated by locomotion depending on the type of visual feedback.
(A) Correlation between calcium activity and locomotion speed in the closed loop (left) and open loop (right) conditions, calculated for each pixel in the image for one example C57BL/6 mouse that expressed GCaMP brain wide. The black cross marks bregma. Activity in most of dorsal cortex correlates positively with locomotion speed in both closed and open loop conditions. (B) Average correlation between calcium activity and locomotion speed in the six regions of interest in closed loop (red), open loop (blue), or dark (black) conditions in six C57BL/6 mice that expressed GCaMP brain wide (308, 316, and 68 five-min recording sessions, respectively). Error bars indicate SEM over recording sessions. Bars above the plot indicate significant differences between conditions (compared conditions are indicated by colored line segments to the left, black: p<0.05, gray: n.s., see Supplementary file 1 for all information on statistical testing). On average, the correlation was highest in posterior dorsal cortex and was not different between conditions. (C) As in A, but for an example Tlx3-Cre × Ai148 mouse that expressed GCaMP6 in L5 IT neurons. Correlations of calcium activity and locomotion speed were lower in the closed loop condition compared to the open loop condition, most prominently in posterior regions of dorsal cortex. (D) As in B, but for 15 Tlx3-Cre × Ai148 mice that expressed GCaMP6 in L5 IT neurons (data from 420 closed loop, 394 open loop, and 194 dark 5 min recording sessions). Error bars indicate SEM over recording sessions. Correlation differed significantly between the closed and the open loop condition and was lowest in posterior dorsal cortex during the closed loop condition.
Figure 3
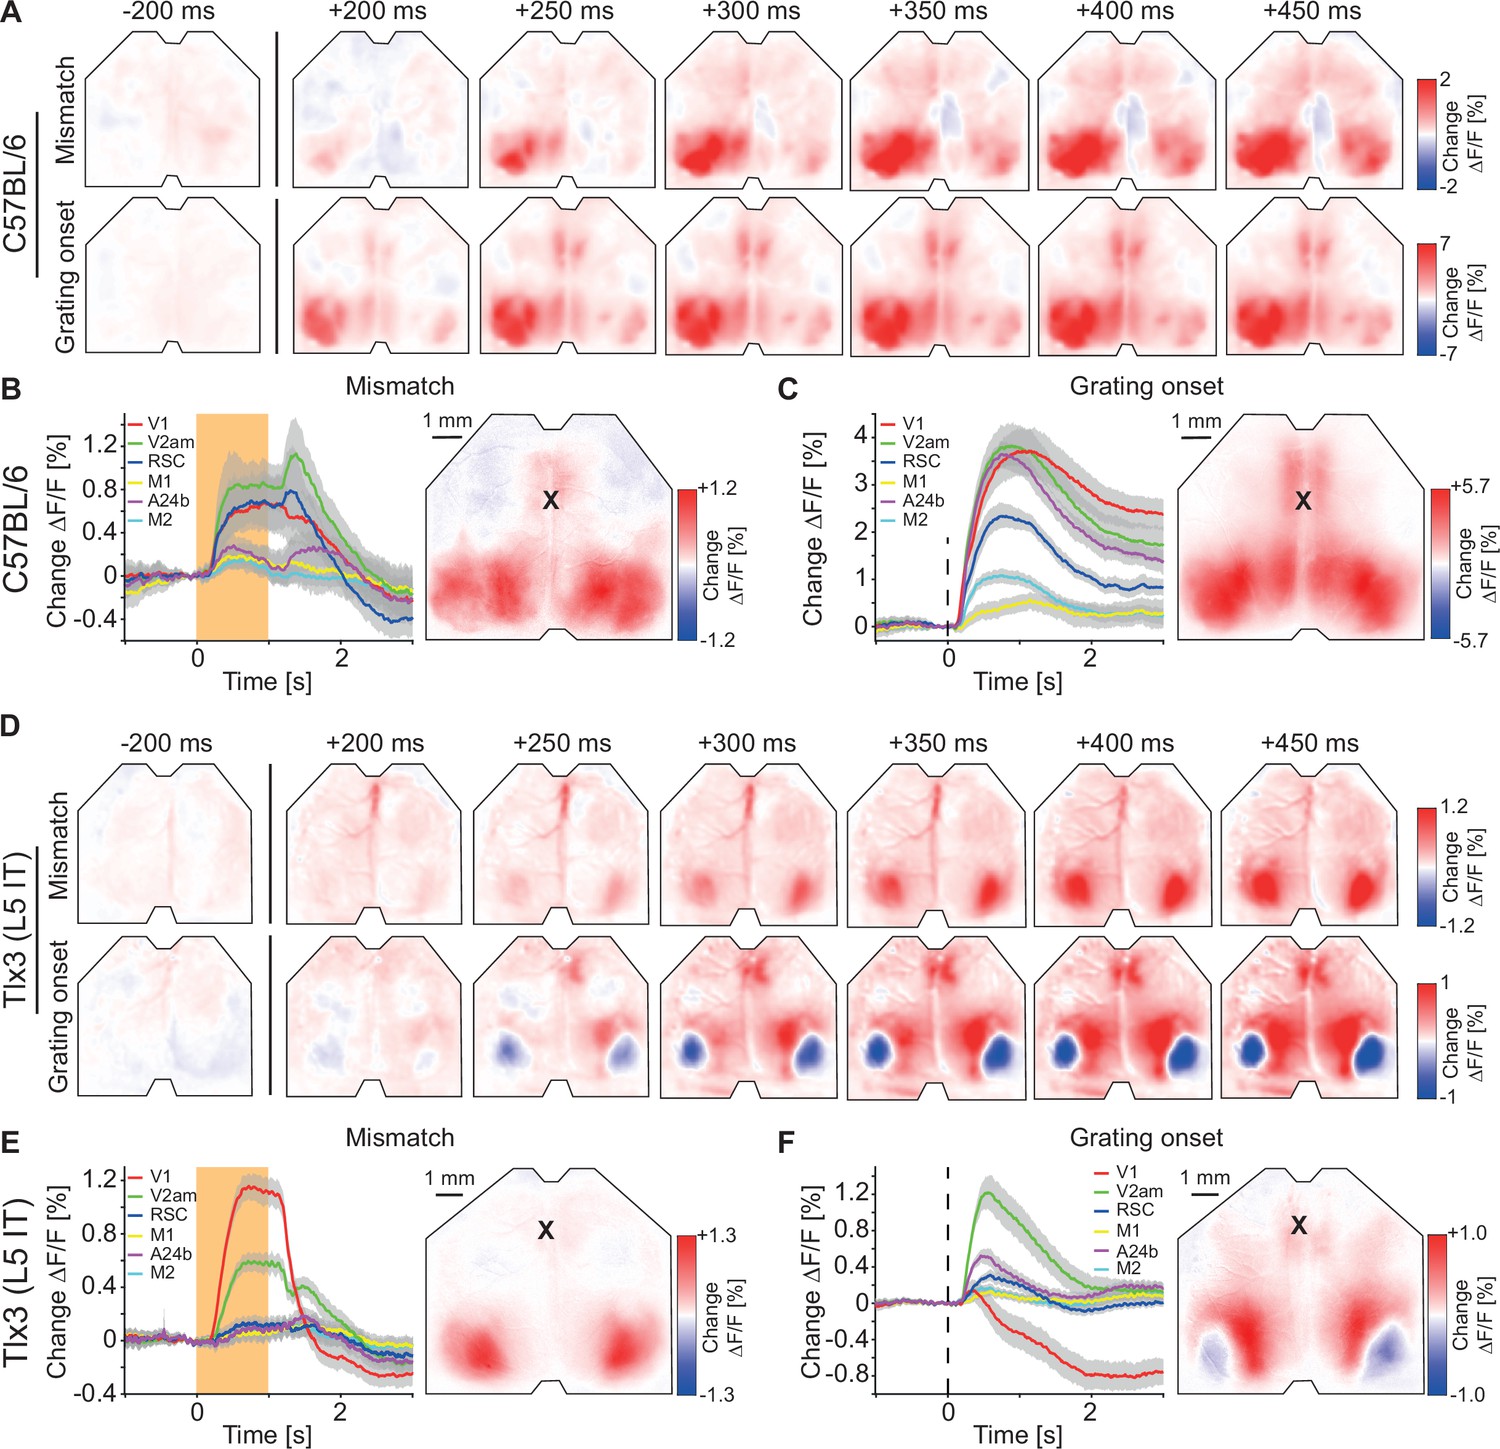
Visuomotor prediction error responses in dorsal cortex originated in primary visual cortex (V1) and activated layer 5 (L5) intratelencephalic (IT) neurons differentially.
(A) Average responses to mismatches (top row, 230 onsets) and drifting gratings (bottom row, 86 onsets) in an example C57BL/6 mouse that expressed GCaMP brain wide. (B) Left: Average response to mismatches in C57BL/6 mice that expressed GCaMP brain wide in six cortical regions (activity was averaged across corresponding regions in both hemispheres). Mean (lines) and 90% confidence interval (shading) are calculated as a hierarchical bootstrap estimate for each time bin (see Methods and Supplementary file 1). Orange shading indicates duration of mismatch event. Right: Average response map to mismatch in six C57BL/6 mice (see Methods). Black cross marks bregma. (C) As in B, but for drifting grating responses. (D) As in A, but in an example Tlx3-Cre × Ai148 mouse that expressed GCaMP6 in L5 IT neurons (top row: mismatch, 292 onsets; bottom row: drifting gratings, 171 onsets). (E) As in B, but for Tlx3-Cre × Ai148 mice that expressed GCaMP6 in L5 IT neurons. (F) As in C, but for Tlx3-Cre × Ai148 mice that expressed GCaMP6 in L5 IT neurons.
Figure 4 with 1 supplement

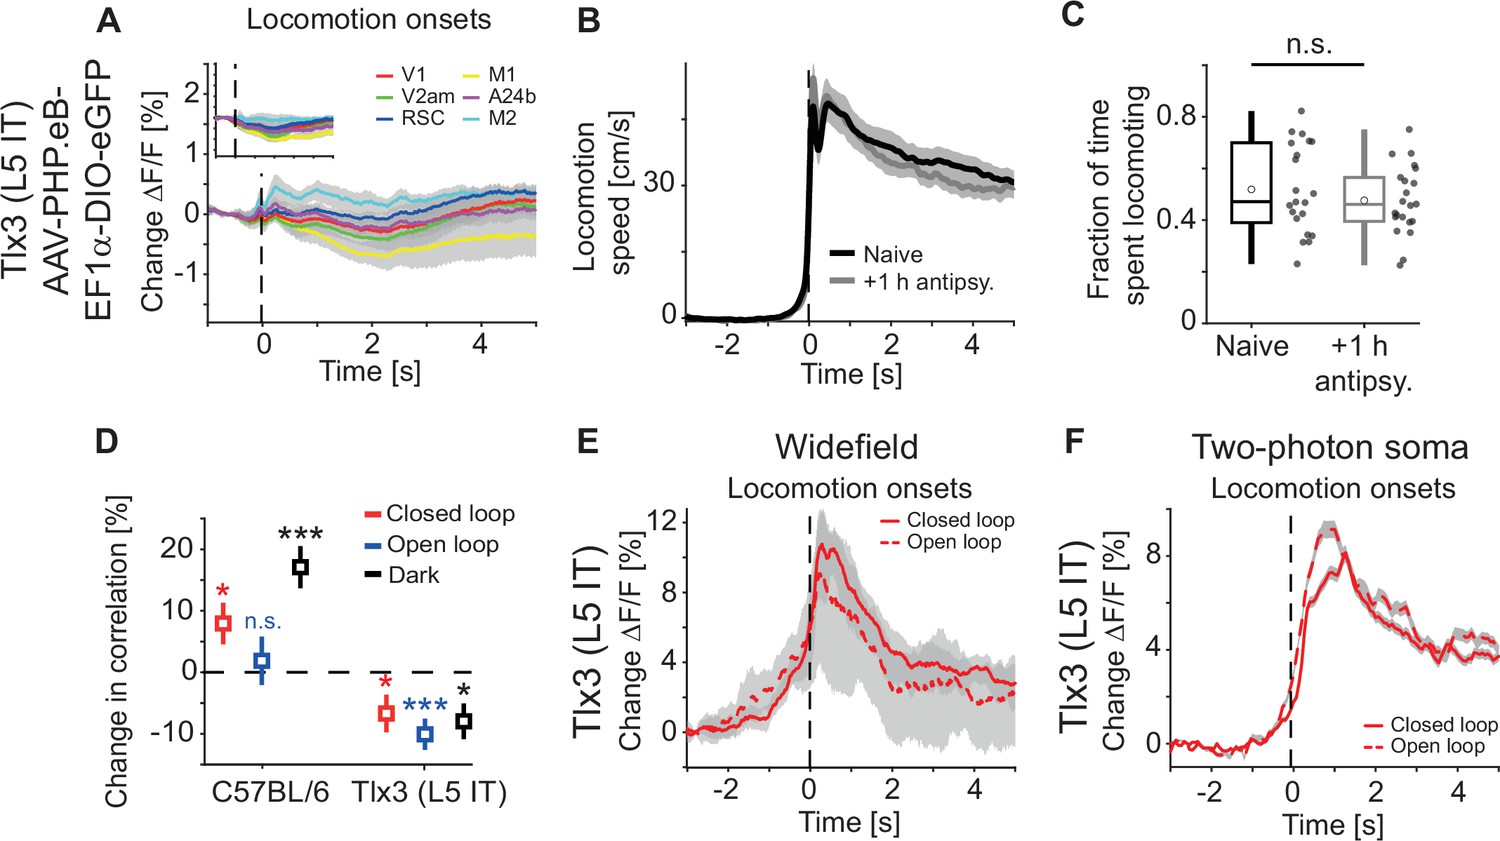
Clozapine increased locomotion-related responses in layer 5 (L5) intratelencephalic (IT) neurons in primary visual cortex (V1).
(A) Average response during closed loop locomotion onsets in C57BL/6 mice that expressed GCaMP brain wide (activity was averaged across corresponding regions in both hemispheres) after a single injection of the antipsychotic drug clozapine (see Methods). Mean (lines) and 90% confidence interval (shading) are calculated as a hierarchical bootstrap estimate for each time bin (see Methods and Supplementary file 1). Inset: Comparison of responses for V1 in naive C57BL/6 mice (dashed red) and the same mice after clozapine injection (dark red, same data as in main panel). (B) As in A, but for open loop locomotion onsets after a clozapine injection. (C) As in A, but for open loop visual flow onsets restricted to times when the mice were not locomoting. (D) Average response during closed loop locomotion onsets in Tlx3-Cre × Ai148 mice that expressed GCaMP6 in layer L5 IT neurons (activity was averaged across corresponding regions in both hemispheres) after a single injection of the antipsychotic drug clozapine (see Methods). Mean (lines) and 90% confidence interval (shading) are calculated as a hierarchical bootstrap estimate for each time bin (see Methods and Supplementary file 1). Inset: Comparison of responses for V1 in naive Tlx3-Cre × Ai148 mice (dashed red) and the same mice after clozapine injection (dark red, same data as in main panel). (E) As in D, but for open loop locomotion onsets. (F) As in D, but for open loop visual flow onsets restricted to times when the mice were not locomoting.
Figure 4—figure supplement 1
Additional information for antipsychotic drug data.
(A) Average hemodynamic response during locomotion onsets in Tlx3-Cre mice that had been retro-orbitally injected with an AAV-PHP.eB-DIO-eGFP to express eGFP in layer 5 (L5) intratelencephalic (IT) neurons (responses were averaged across corresponding regions in both hemispheres) after a single injection of the antipsychotic drug clozapine (see Methods). Mean (lines) and 90% confidence interval (shading) are calculated as a hierarchical bootstrap estimate for each time bin (see Methods and Supplementary file 1). Inset: Comparison of responses to locomotion onsets in the same mice before clozapine injection (same data as in Figure 1—figure supplement 1C, top panel). (B) Average locomotion speed in 21 naive mice (black) and 22 mice that had been injected with either of the antipsychotic drugs clozapine, aripiprazole, or haloperidol (gray), for the data acquisition timepoint +1 hr after injection. Shading indicates SEM over mice. (C) Fraction of time spent locomoting above threshold (see Methods) for the 21 naive mice (black) and 22 mice that had been injected with either of the antipsychotic drugs clozapine, aripiprazole, or haloperidol, for the data acquisition timepoint +1 hr after injection (gray). Boxes represent the median and the interquartile range. The open circles indicate the mean of the distributions. The whiskers mark 1.5 times the interquartile range. Dots are the individual data points. (D) Average correlation of activity and locomotion speed in dorsal cortex was increased after a single injection of the antipsychotic drug clozapine in four C57BL/6 mice that expressed GCaMP brain wide but decreased in five Tlx3-Cre × Ai148 mice that expressed GCaMP6 in L5 IT neurons, for all types of visual feedback. Error bars indicate SEM over mice and corresponding dorsal cortex regions (see Methods). n.s.: not significant, *: p<0.05, ***: p<0.001. See Supplementary file 1 for all information on statistical testing. (E) Average response of primary visual cortex (V1) recorded with the widefield microscope during locomotion onsets in closed loop (solid) or open loop (dashed) in Tlx3-Cre × Ai148 mice that expressed GCaMP6 in L5 IT neurons and that had received an injection of the antipsychotic drug clozapine. Mean (lines) and 90% confidence interval (shading) are calculated as a hierarchical bootstrap estimate for each time bin (see Methods and Supplementary file 1). (F) As in E, for the same three Tlx3-Cre × Ai148 mice, but for responses recorded at L5 IT soma with two-photon imaging. Shading indicates SEM over 5595 neurons.
Figure 5 with 1 supplement

Clozapine reduced activity correlations in dorsal cortex predominantly in layer 5 (L5) intratelencephalic (IT) neurons.
(A) Average correlation of activity between the 12 regions of interest in four C57BL/6 mice that expressed GCaMP brain wide. (B) As in A, but after a single injection of the antipsychotic drug clozapine in the same four C57BL/6 mice. (C) Average correlation of activity between the 12 regions of interest in five Tlx3-Cre × Ai148 mice that expressed GCaMP6 in layer L5 IT neurons. (D) As in C, but after a single injection of the antipsychotic drug clozapine in the same five Tlx3-Cre × Ai148 mice.
Figure 5—figure supplement 1
Calculation of the distance-correlation heatmaps.
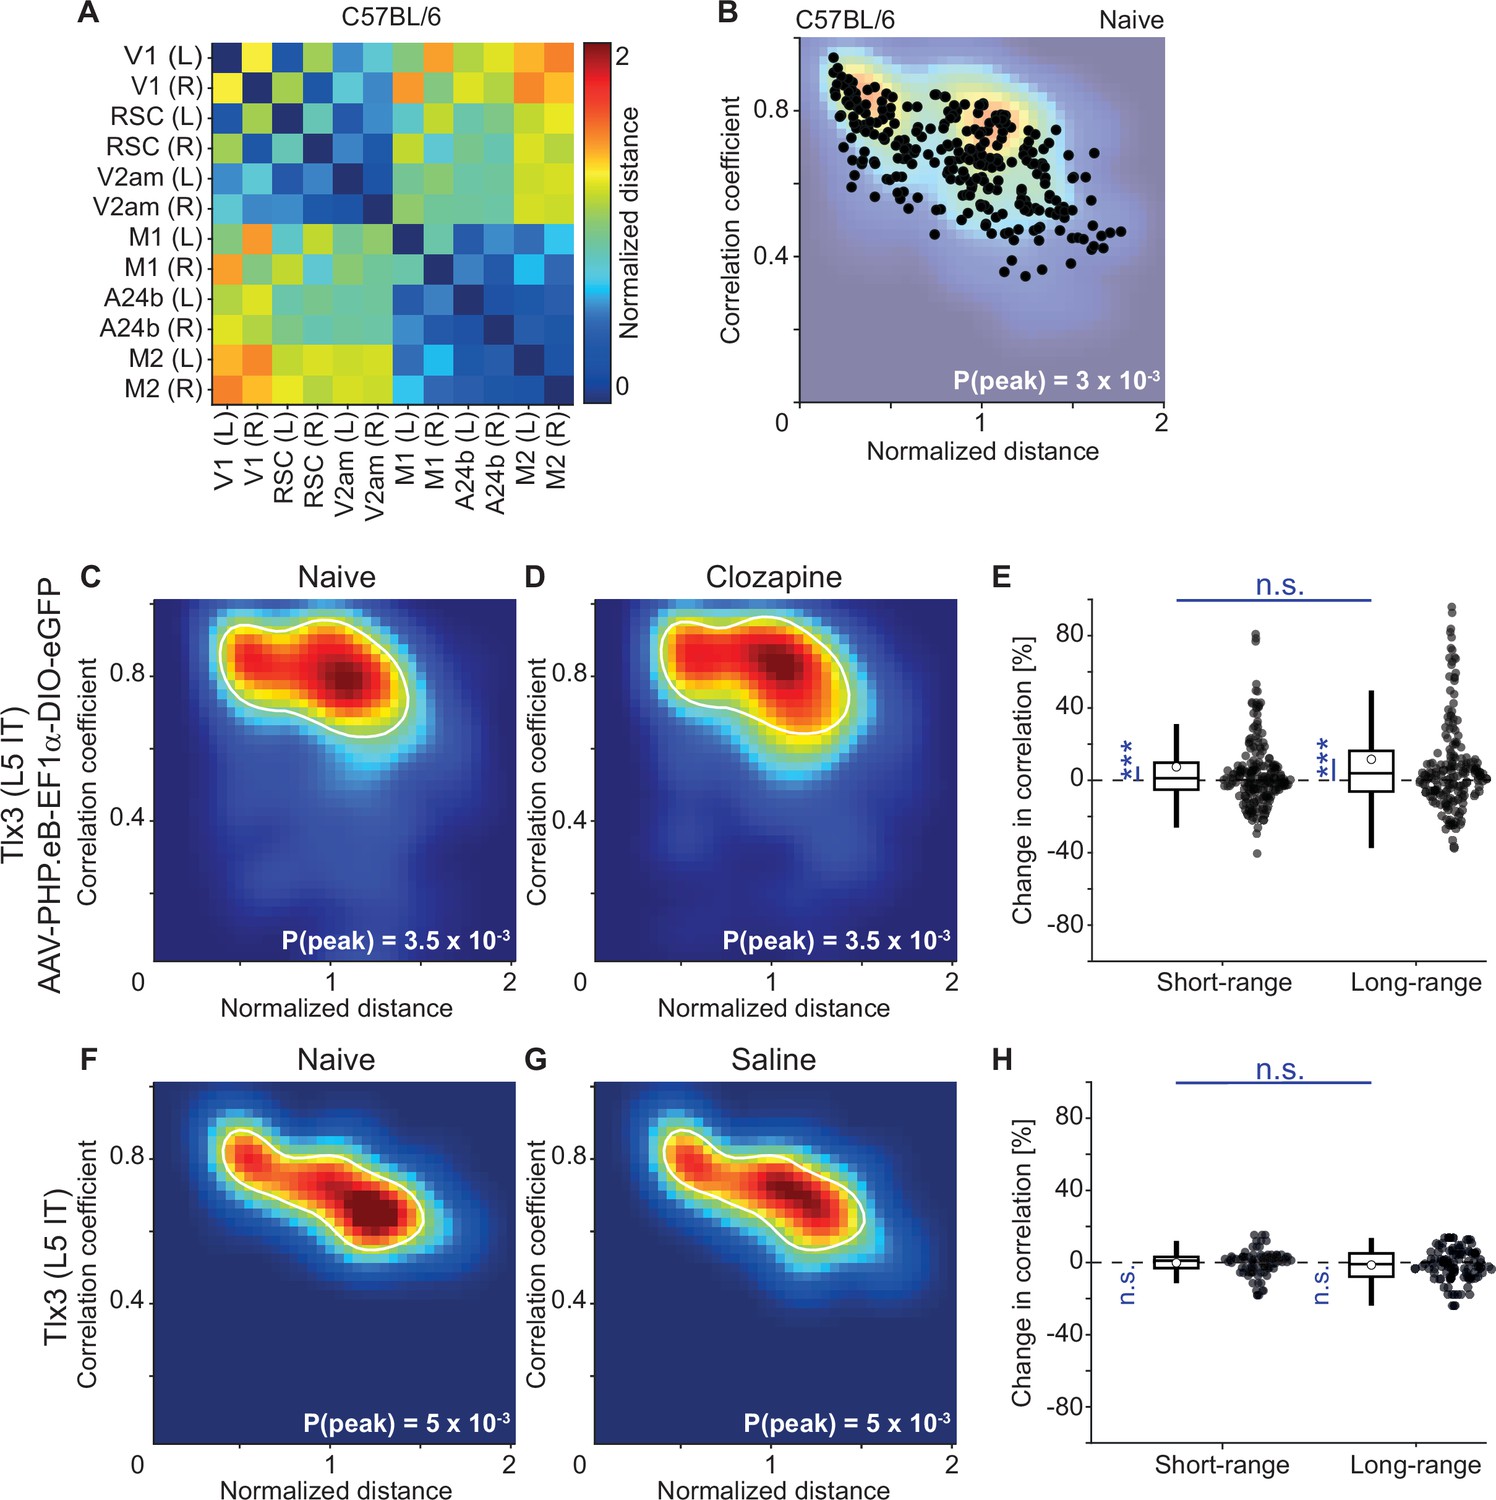
(A) For each pair of dorsal cortex regions, we calculated the distance between the regions in a top-down view of dorsal cortex, normalized by the distance between bregma and lambda for each mouse (data are from an example C57BL/6 mouse that expressed GCaMP6 brain wide). (B) For each pair, we then plotted the activity correlation against this distance as calculated in A (black dots). We then interpolated this distribution using a 40-by-40 2D grid to obtain the density plots (faded background), shown for all mice and pairs of regions in Figures 6 and 7, and Figure 5—figure supplement 1, Figure 6—figure supplements 1 and 2. (C) Density map of correlation coefficients as a function of distance between the regions, normalized across mice by the bregma-lambda distance (see panel B and Methods), for 6 Tlx3-Cre mice that had been retro-orbitally injected with an AAV-PHP.eB-DIO-eGFP to express eGFP in layer 5 (L5) intratelencephalic (IT) neurons. Peak density is indicated at the bottom right of the plot and corresponds to the maximum value of the color scale (dark red). The white line is a contour line drawn at 50% of peak value. (D) As in C, but for the same six Tlx3-Cre mice that expressed eGFP in L5 IT neurons after a single injection of the antipsychotic drug clozapine. The white line is the contour from panel C for comparison. (E) Clozapine-induced change in the fluorescence correlation between regions, normalized to the correlation coefficient in the naive state, in six Tlx3-Cre mice that expressed eGFP in L5 IT neurons. Data were split into short- and long-range activity correlations (see Methods). Boxes represent the median and the interquartile range. The open circle indicates the mean of the distribution. The whiskers mark 1.5 times the interquartile range. Dots are the individual data points (short-range: 204 pairs of regions, long-range: 192 pairs of regions). ***: p<0.001, n.s.: not significant. See Supplementary file 1 for all information on statistical testing. (F) As in C, but for three Tlx3-Cre × Ai148 mice that expressed GCaMP6 in L5 IT neurons. (G) As in F, but after a single injection of saline. The white line is the contour line from panel F for comparison. (H) Saline-induced change in the activity correlation between regions, normalized to the correlation coefficient in the naive state, in three Tlx3-Cre × Ai148 mice. Data were split into short- and long-range activity correlations (see Methods). Boxes represent the median and the interquartile range. The open circle indicates the mean of the distribution. The whiskers mark 1.5 times the interquartile range. Dots are the individual data points (short-range: 93 pairs of regions, long-range: 105 pairs of regions). n.s.: not significant. See Supplementary file 1 for all information on statistical testing.
Figure 6 with 2 supplements
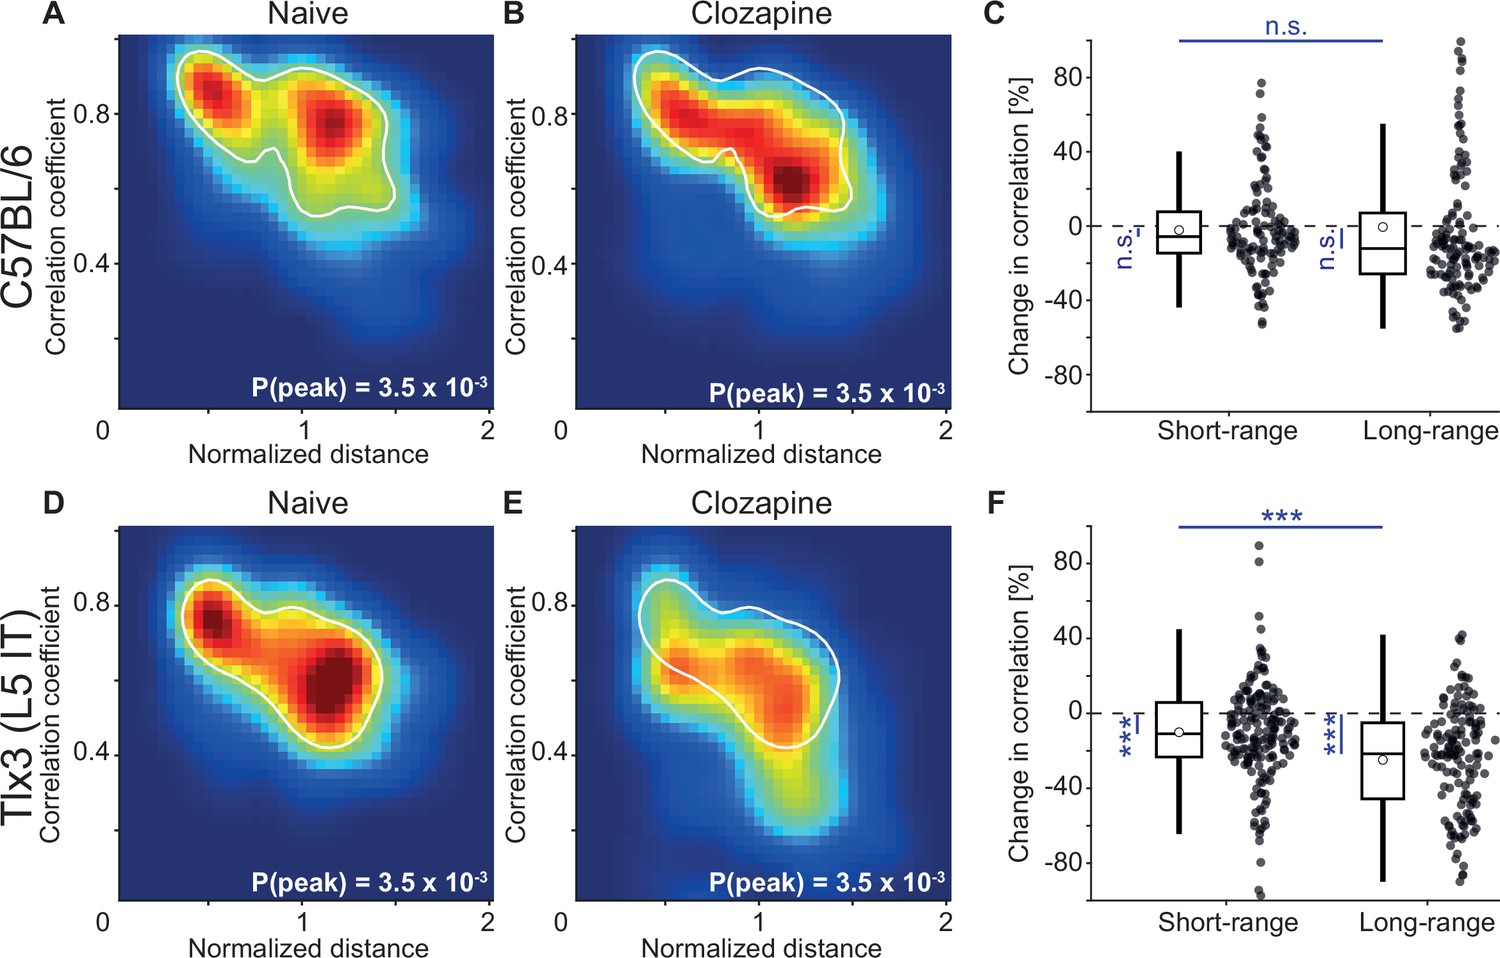
Layer 5 (L5) intratelencephalic (IT) neurons exhibited the strongest clozapine-induced reduction of long-range correlations.
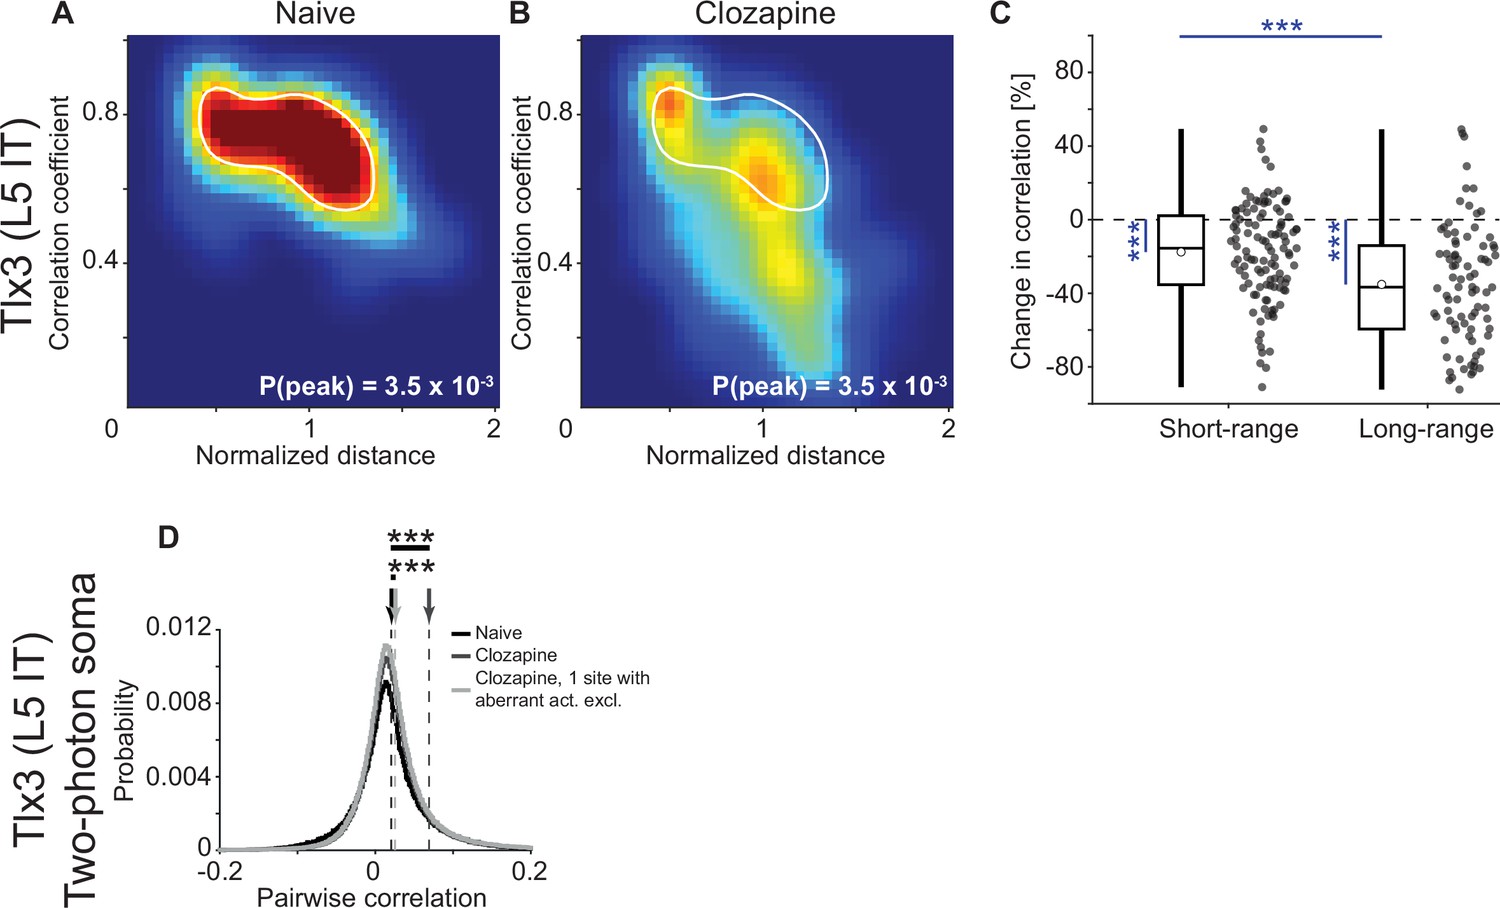
(A) Density map of correlation coefficients as a function of distance between the regions, normalized across mice by the bregma-lambda distance (see Figure 5—figure supplement 1A and B, and Methods), for four naive C57BL/6 mice that expressed GCaMP brain wide. Peak density is indicated at the bottom right of the plot and corresponds to the maximum value of the color scale (dark red). The white line is a contour line drawn at 50% of peak value. (B) As in A, but for the same four C57BL/6 mice after a single injection of the antipsychotic drug clozapine. The white line is the contour line from panel A for comparison. (C) Clozapine-induced change in the activity correlation between regions, normalized to the correlation coefficient in the naive state, in four C57BL/6 mice. Data were split into short- and long-range activity correlations (see Methods). Boxes represent the median and the interquartile range. The open circle indicates the mean of the distribution. The whiskers mark 1.5 times the interquartile range. Dots are the individual data points (short-range: 122 pairs of regions, long-range: 142 pairs of regions). n.s.: not significant. See Supplementary file 1 for all information on statistical testing. (D) As in A, but for five Tlx3-Cre × Ai148 mice that expressed GCaMP6 in L5 IT neurons. (E) As in B, but for five Tlx3-Cre × Ai148 mice that expressed GCaMP6 in L5 IT neurons. The white line is the contour line from panel D for comparison. (F) As in C, but for 5 Tlx3-Cre × Ai148 mice that expressed GCaMP6 in L5 IT neurons (short-range: 182 pairs of regions, long-range: 148 pairs of regions). ***: p<0.001.
Figure 6—figure supplement 1
The clozapine-induced decorrelation was not present in local somatic correlations.
(A) Density map of correlation coefficients as a function of distance between the regions, normalized across mice by the bregma-lambda distance (see Figure 5—figure supplement 1A and B, and Methods), for 3 Tlx3-Cre × Ai148 mice that expressed GCaMP6 in layer 5 (L5) intratelencephalic (IT) neurons. Peak density is indicated at the bottom right of the plot and corresponds to the maximum value of the color scale (dark red). The white line is a contour line drawn at 50% of peak value. (B) As in A, but for the same three Tlx3-Cre × Ai148 mice after a single injection of the antipsychotic drug clozapine. The white line is the contour line from panel A for comparison. (C) Clozapine-induced change in the activity correlation between regions, normalized to the correlation coefficient in the naive state, in three Tlx3-Cre × Ai148 mice. Data were split into short- and long-range activity correlations (see Methods). Boxes represent the median and the interquartile range. The open circle indicates the mean of the distribution. The whiskers mark 1.5 times the interquartile range. Dots are the individual data points (short-range: 114 pairs of regions, long-range: 84 pairs of regions). ***, p<0.001. See Supplementary file 1 for all information on statistical testing. (D) Distribution of pairwise neuronal activity correlations recorded with two-photon imaging at the L5 soma, in the same three Tlx3-Cre × Ai148 mice as in panels A–C, before (naive, black, 1991 neurons and 384,108 pairs of neurons) and after injection of the antipsychotic drug clozapine (dark gray, 7863 neurons and 885,596 pairs of neurons or pale gray, 1 field of view excluded, 7534 neurons and 831,640 pairs of neurons remaining). Dashed lines mark the mean of the respective distributions as indicated by the arrows on top. Note that after clozapine injection, we observed aberrantly high neuronal synchrony in 1 out of 25 recorded fields of view that substantially increased the average pairwise correlation as indicated by the two curves that compare the clozapine data. In either comparison, clozapine significantly increased local pairwise activity correlations.
Figure 6—figure supplement 2
The clozapine-induced decorrelation of dorsal cortex activity was weaker in superficial cortical layers than in layer 5 (L5).
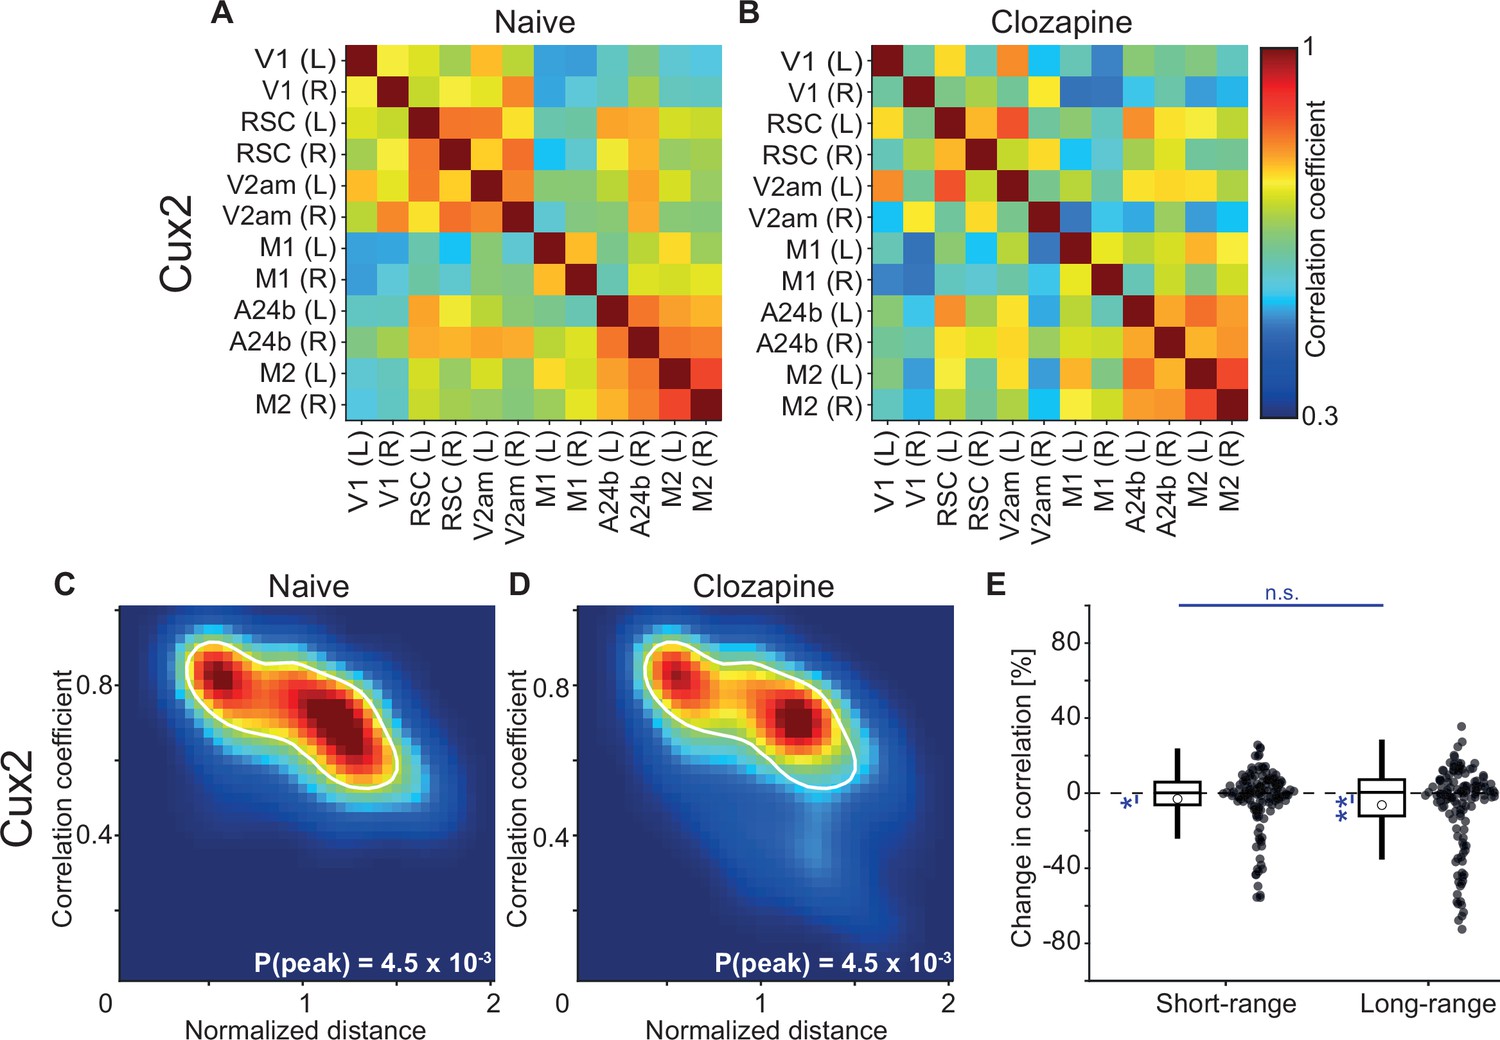
(A) Average correlation of activity between the 12 regions of interest in four Cux2-CreERT2 × Ai148 mice that expressed GCaMP6 in upper layer excitatory neurons. (B) As in A, but for the same four Cux2-CreERT2 × Ai148 mice after a single injection of the antipsychotic drug clozapine. (C) Density map of correlation coefficients as a function of distance between the regions, normalized across mice by the bregma-lambda distance (see Figure 5—figure supplement 1A and B, and Methods), for four naive Cux2-CreERT2 × Ai148 mice that expressed GCaMP6 in upper layer excitatory neurons. Peak density is indicated at the bottom right of the plot and corresponds to the maximum value of the color scale (dark red). The white line is a contour line drawn at 50% of peak value. (D) As in C, but for the same four Cux2-CreERT2 × Ai148 mice after a single injection of the antipsychotic drug clozapine. The white line is the contour line from panel C for comparison. (E) Clozapine-induced change in the activity correlation between regions, normalized to the correlation coefficient in the naive state, in four Cux2-CreERT2 × Ai148 mice. Data were split into short- and long-range activity correlations (see Methods). Boxes represent the median and the interquartile range. The open circle indicates the mean of the distribution. The whiskers mark 1.5 times the interquartile range. Dots are the individual data points (short-range: 137 pairs of regions, long-range: 127 pairs of regions). n.s.: not significant, *: p<0.05, **: p<0.01. See Supplementary file 1 for all information on statistical testing.
Figure 7
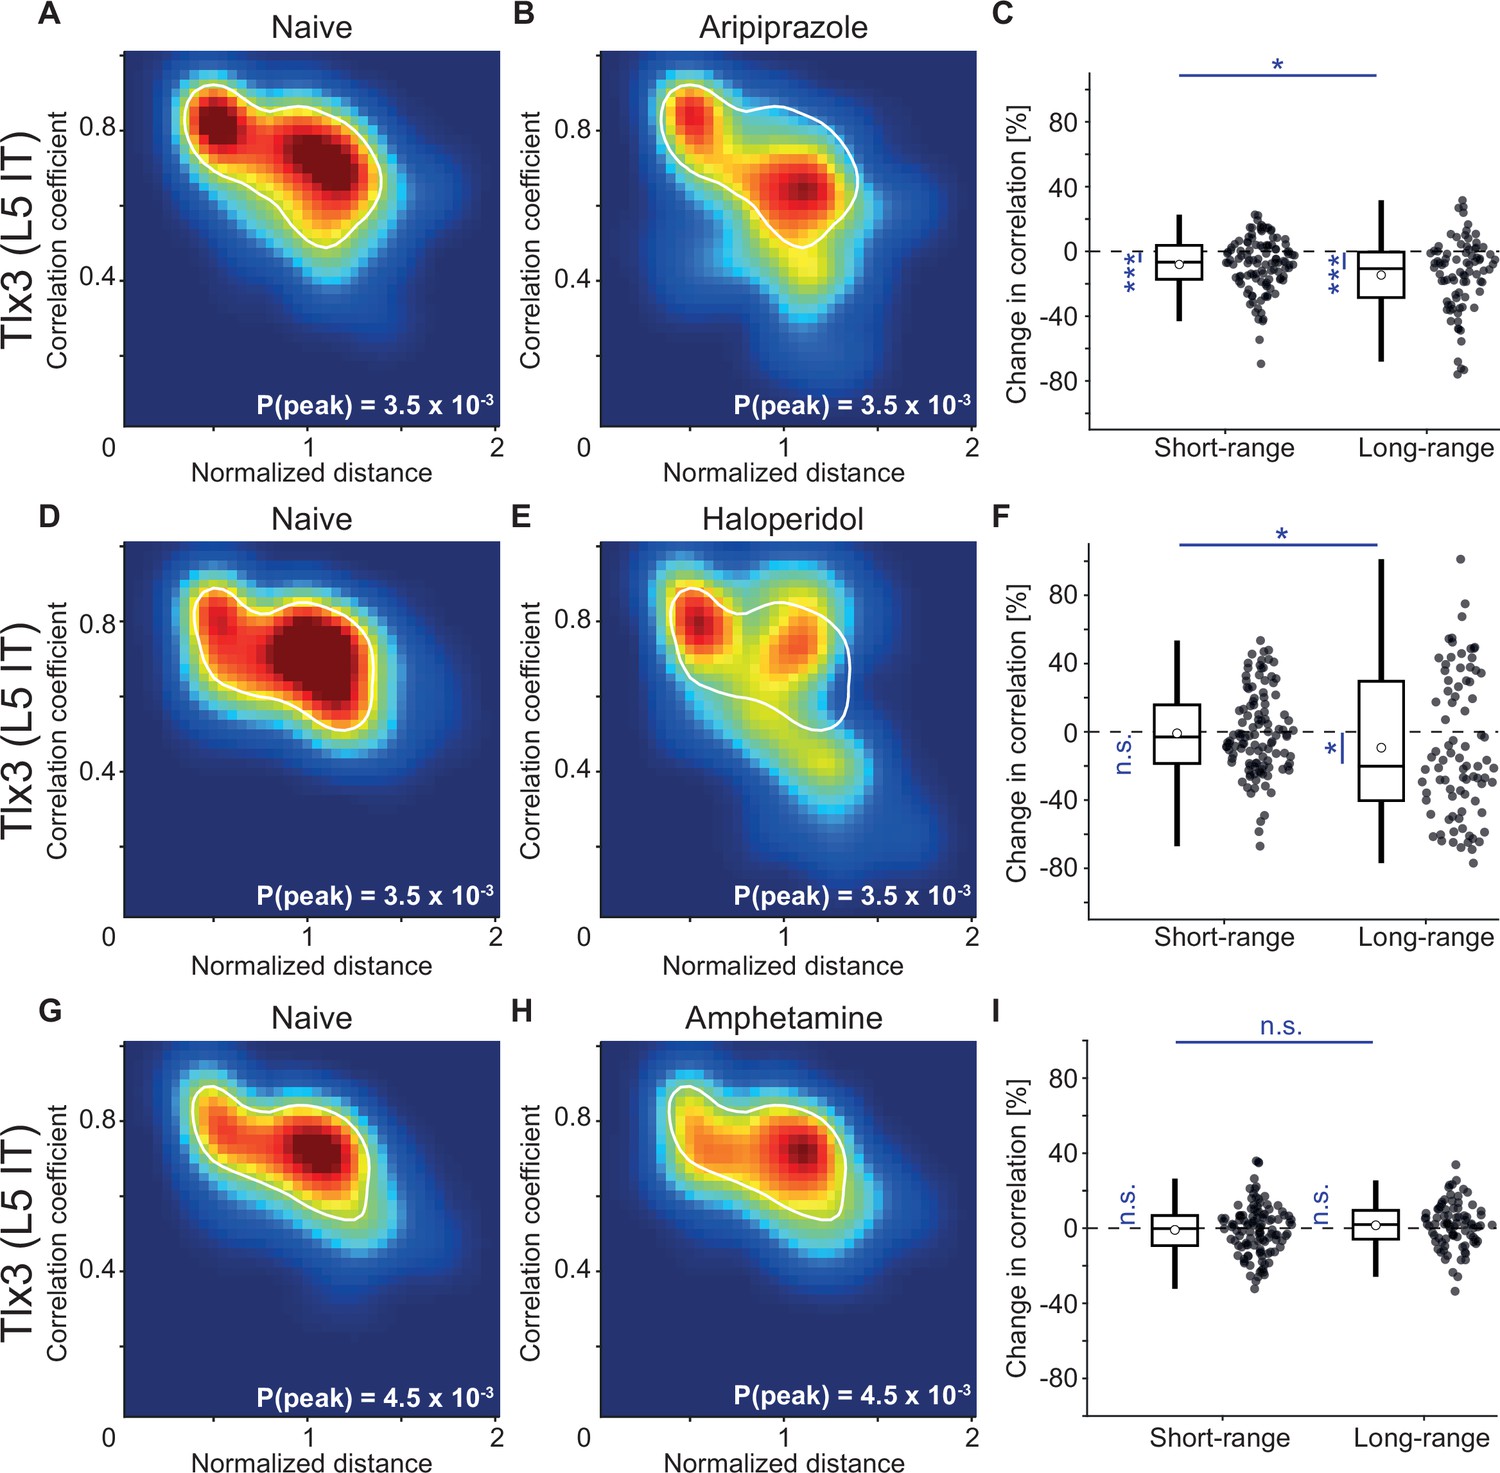
Antipsychotic drugs aripiprazole and haloperidol mimicked the decorrelation of layer 5 (L5) intratelencephalic (IT) activity observed with clozapine while psychostimulant amphetamine did not.
(A) Density map of correlation coefficients as a function of distance between the regions, normalized across mice by the bregma-lambda distance (see Figure 5—figure supplement 1A and B, and Methods), for three Tlx3-Cre × Ai148 mice that expressed GCaMP6 in L5 IT neurons. Peak density is indicated at the bottom right of the plot and corresponds to the maximum value of the color scale (dark red). The white line is a contour line drawn at 50% of peak value. (B) As in A, for the same three Tlx3-Cre × Ai148 mice, but after a single injection of the antipsychotic drug aripiprazole. The white line is the contour line from panel A for comparison. (C) Aripiprazole-induced change in the activity correlation between regions, normalized to the correlation coefficient in the naive state, in three Tlx3-Cre × Ai148 mice. Data were split into short- and long-range activity correlations (see Methods). Boxes represent the median and the interquartile range. The open circle indicates the mean of the distribution. The whiskers mark 1.5 times the interquartile range. Dots are the individual data points (short-range: 114 pairs of regions, long-range: 84 pairs of regions). *: p<0.05, ***: p<0.001. See Supplementary file 1 for all information on statistical testing. (D) As in A, but for three different Tlx3-Cre × Ai148 mice. (E) As in D, for the same three Tlx3-Cre × Ai148 mice, but after a single injection of the antipsychotic drug haloperidol. The white line is the contour line from panel D for comparison. (F) As in C, but for the three mice that had received a single injection of the antipsychotic drug haloperidol (short-range: 114 pairs of regions, long-range: 84 pairs of regions). *: p<0.05; n.s.: not significant. (G) As in A, but for three different Tlx3-Cre × Ai148 mice. (H) As in G, for the same three Tlx3-Cre × Ai148 mice, but after a single injection of the psychostimulant amphetamine. The white line is the contour line from panel G for comparison. (I) As in D, but for the three mice that had received a single injection of the psychostimulant amphetamine (short-range: 114 pairs of regions, long-range: 84 pairs of regions). n.s.: not significant.
Figure 8
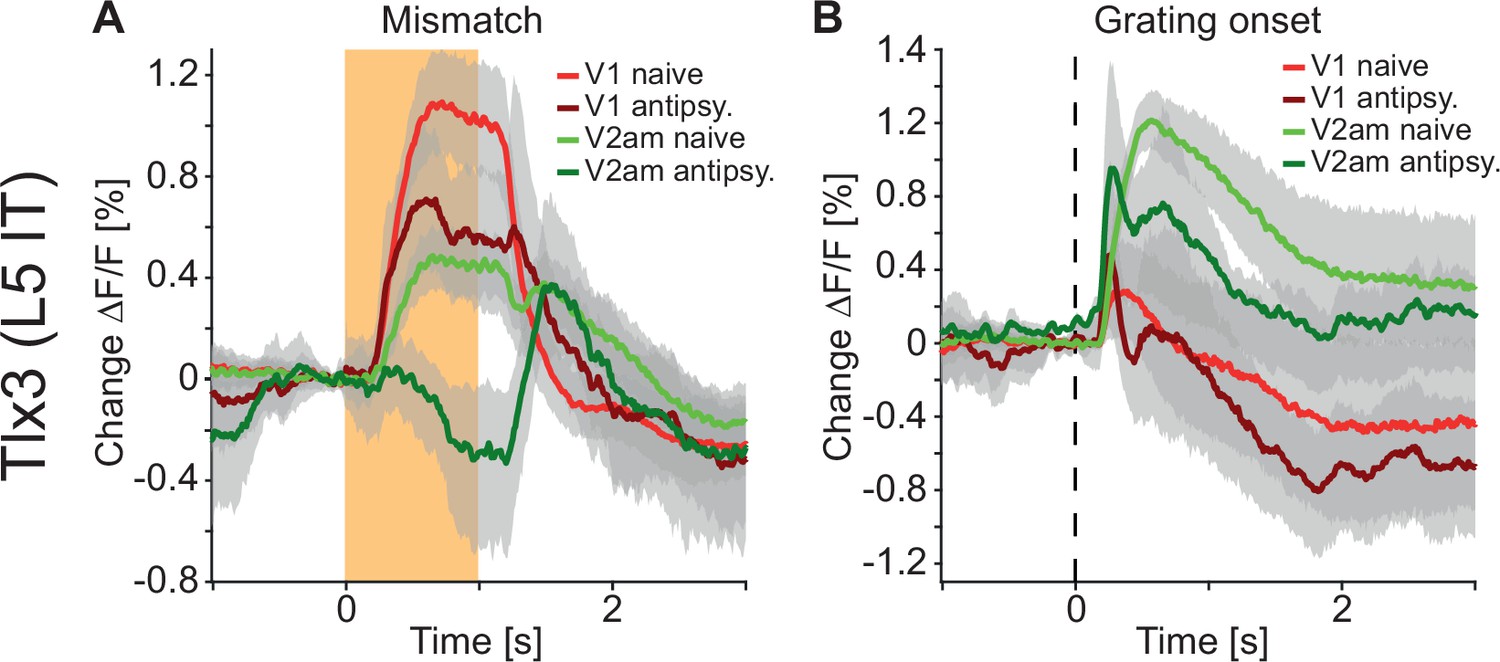
Antipsychotic drug treatment preferentially reduced responses to and propagation of negative prediction errors.
(A) Average responses to mismatches in Tlx3-Cre × Ai148 mice that expressed GCaMP6 in layer 5 (L5) intratelencephalic (IT) neurons before (red: primary visual cortex [V1] naive, green: antero-medial secondary visual cortex [V2am] naive, activity was averaged across corresponding regions in both hemispheres) and after (dark red: V1, dark green: V2am) injection of a single dose of an antipsychotic drug (data were averaged over all antipsychotics used: clozapine: five mice, aripiprazole: three mice, and haloperidol: three mice). Orange shading indicates duration of the mismatch event. Mean (lines) and 90% confidence interval (shading) are calculated as a hierarchical bootstrap estimate for each time bin (see Methods and Supplementary file 1). (B) As in A, but for drifting grating onsets.
Tables
Key resources table
| Reagent type (species) or resource | Designation | Source or reference | Identifiers | Additional information |
|---|---|---|---|---|
| Strain, strain background (adeno-associated virus) | AAV-PHP.eB-hSyn1-jGCaMP7f (1013 GC/ml) | FMI vector core | vector.fmi.ch | |
| Strain, strain background (adeno-associated virus) | AAV-PHP.eB-EF1α-GCaMP6s (1013 GC/ml) | FMI vector core | vector.fmi.ch | |
| Strain, strain background (adeno-associated virus) | AAV-PHP.eB-DIO-EF1α-GCaMP6s (1013 GC/ml) | FMI vector core | vector.fmi.ch | |
| Strain, strain background (adeno-associated virus) | AAV-PHP.eB-DIO-EF1α-jGCaMP7f (1012 GC/ml) | FMI vector core | vector.fmi.ch | |
| Strain, strain background (adeno-associated virus) | AAV-PHP.eB-EF1α-eGFP (1013 GC/ml) | FMI vector core | vector.fmi.ch | |
| Strain, strain background (adeno-associated virus) | AAV-PHP.eB-EF1α-DIO-eGFP (1015 GC/ml) | FMI vector core | vector.fmi.ch | |
| Chemical compound, drug | Fentanyl citrate | Actavis | CAS 990-73-8 | Anesthetic compound |
| Chemical compound, drug | Midazolam (Dormicum) | Roche | CAS 59467-96-8 | Anesthetic compound |
| Chemical compound, drug | Medetomidine (Domitor) | Orion Pharma | CAS 86347-14-0 | Anesthetic compound |
| Chemical compound, drug | Ropivacaine | Presenius Kabi | CAS 132112-35-7 | Analgesic compound |
| Chemical compound, drug | Lidocaine | Bichsel | CAS 137-58-6 | Analgesic compound |
| Chemical compound, drug | Buprenorphine | Reckitt Benckiser Healthcare | CAS 52485-79-7 | Analgesic compound |
| Chemical compound, drug | Ophthalmic gel (Humigel) | Virbac | N/A | |
| Chemical compound, drug | Flumazenil (Anexate) | Roche | CAS 78755-81-4 | Anesthetic antagonist |
| Chemical compound, drug | Atipamezole (Antisedan) | Orion Pharma | CAS 104054-27-5 | Anesthetic antagonist |
| Chemical compound, drug | N-Butyl-2-cyanoacrylate | Braun | CAS 6606-65-1 | Histoacryl |
| Chemical compound, drug | Dental cement | Heraeus Kulzer | CAS 9066-86-8 | |
| Chemical compound, drug | Metacam | Boehringer Ingelheim | CAS 71125-39-8 | Analgesic compound |
| Chemical compound, drug | Clozapine (powder) | Novartis | CAS 5786-21-0 | Antipsychotic drug |
| Chemical compound, drug | Aripiprazole (intramuscular injection solution 7.5 mg/ml) | Otsuka Pharmaceutical | CAS 129722-12-9 | Antipsychotic drug |
| Chemical compound, drug | Haloperidol (intramuscular injection solution 5 mg/ml) | Janssen | CAS 52-86-8 | Antipsychotic drug |
| Chemical compound, drug | Amphetamine (powder) | Hänseler | CAS 60-13-9 | Psychostimulant |
| Chemical compound, drug | Tamoxifen food | Envigo | CAS 10540-29-1 (TD.55125) | Compound to induce Cre expression in CreER mouse lines |
| Genetic reagent Mus musculus | C57BL/6 | Charles River | N/A | |
| Genetic reagent Mus musculus | Emx1tm1(cre)Krj Alias used here: Emx1-Cre | Jackson Laboratories | RRID:IMSR_JAX:005628 | Cre expression in excitatory forebrain neurons |
| Genetic reagent Mus musculus | B6(Cg)-Cux2tm3.1(cre/ERT2)Mull/Mmmh Alias used here: Cux2-CreERT2 | MMRRC | RRID:MMRRC_032779-MU | Cre expression in cortical L2/3/4 |
| Genetic reagent Mus musculus | Scnn1a-cre3Aibs/J Alias used here: Scnn1a-Cre | Jackson Laboratories | RRID:IMSR_JAX:009613 | Cre expression in cortical L4 |
| Genetic reagent Mus musculus | Tg(Tlx3-cre)PL56Gsat/Mmucd, Alias used here: Tlx3-Cre | MMRRC | RRID:MMRRC_041158-UCD | Cre expression in cortical L5 IT |
| Genetic reagent Mus musculus | Ntsr1GN220Gsat/Mmucd Alias used here: Ntsr1-Cre | MMRRC | RRID:MMRRC_017266-UCD | Cre expression in cortical L6 |
| Genetic reagent Mus musculus | Pvalbtm1(cre)Arbr Alias used here: PV-Cre | Jackson Laboratories | RRID:IMSR_JAX:008069 | Cre expression in PV interneurons |
| Genetic reagent Mus musculus | Viptm1(cre)Zjh Alias used here: VIP-Cre | Jackson Laboratories | RRID:IMSR_JAX:010908 | Cre expression in VIP interneurons |
| Genetic reagent Mus musculus | Ssttm2.1(cre)Zjh Alias used here: SST-Cre | Jackson Laboratories | RRID:IMSR_JAX:018973 | Cre expression in Sst interneurons |
| Genetic reagent Mus musculus | Igs7tm148.1(tetO-GCaMP6f,CAG-tTA2)Hze/J Alias used here: Ai148 | Jackson Laboratories | RRID:IMSR_JAX:030328 | GCaMP6f reporter line |
| Software, algorithm | MATLAB (2021a) | The MathWorks | RRID:SCR_001622 | Data analysis |
| Software, algorithm | LabVIEW | National Instruments | RRID:SCR_014325 | Hardware control |
| Software, algorithm | Python | python.org | RRID:SCR_008394 | Virtual reality |
| Software, algorithm | Panda3D | panda3d.org | N/A | Virtual reality |
Additional files
-
Supplementary file 1
A list of all statistical comparisons for bar and violin plots.
Note, for Figure 1L and Figure 1—figure supplement 4J, the significance thresholds were corrected for multiple comparisons (see Methods).
- https://cdn.elifesciences.org/articles/86805/elife-86805-supp1-v1.docx
-
Supplementary file 2
A list of number of mice used for each figure and the corresponding indicator expression strategy.
- https://cdn.elifesciences.org/articles/86805/elife-86805-supp2-v1.docx
-
MDAR checklist
- https://cdn.elifesciences.org/articles/86805/elife-86805-mdarchecklist1-v1.docx
Download links
A two-part list of links to download the article, or parts of the article, in various formats.
Downloads (link to download the article as PDF)
Open citations (links to open the citations from this article in various online reference manager services)
Cite this article (links to download the citations from this article in formats compatible with various reference manager tools)
Antipsychotic drugs selectively decorrelate long-range interactions in deep cortical layers
eLife 12:RP86805.
https://doi.org/10.7554/eLife.86805.4


