Structural and mechanistic insights into ribosomal ITS2 RNA processing by nuclease-kinase machinery
- State Key Laboratory of Cellular Stress Biology, School of Life Sciences, Faculty of Medicine and Life Sciences, Xiamen University, China
- MOE Key Laboratory for Cellular Dynamics and Division of Life Sciences and Medicine, University of Science and Technology of China, China
Figures
Figure 1 with 4 supplements
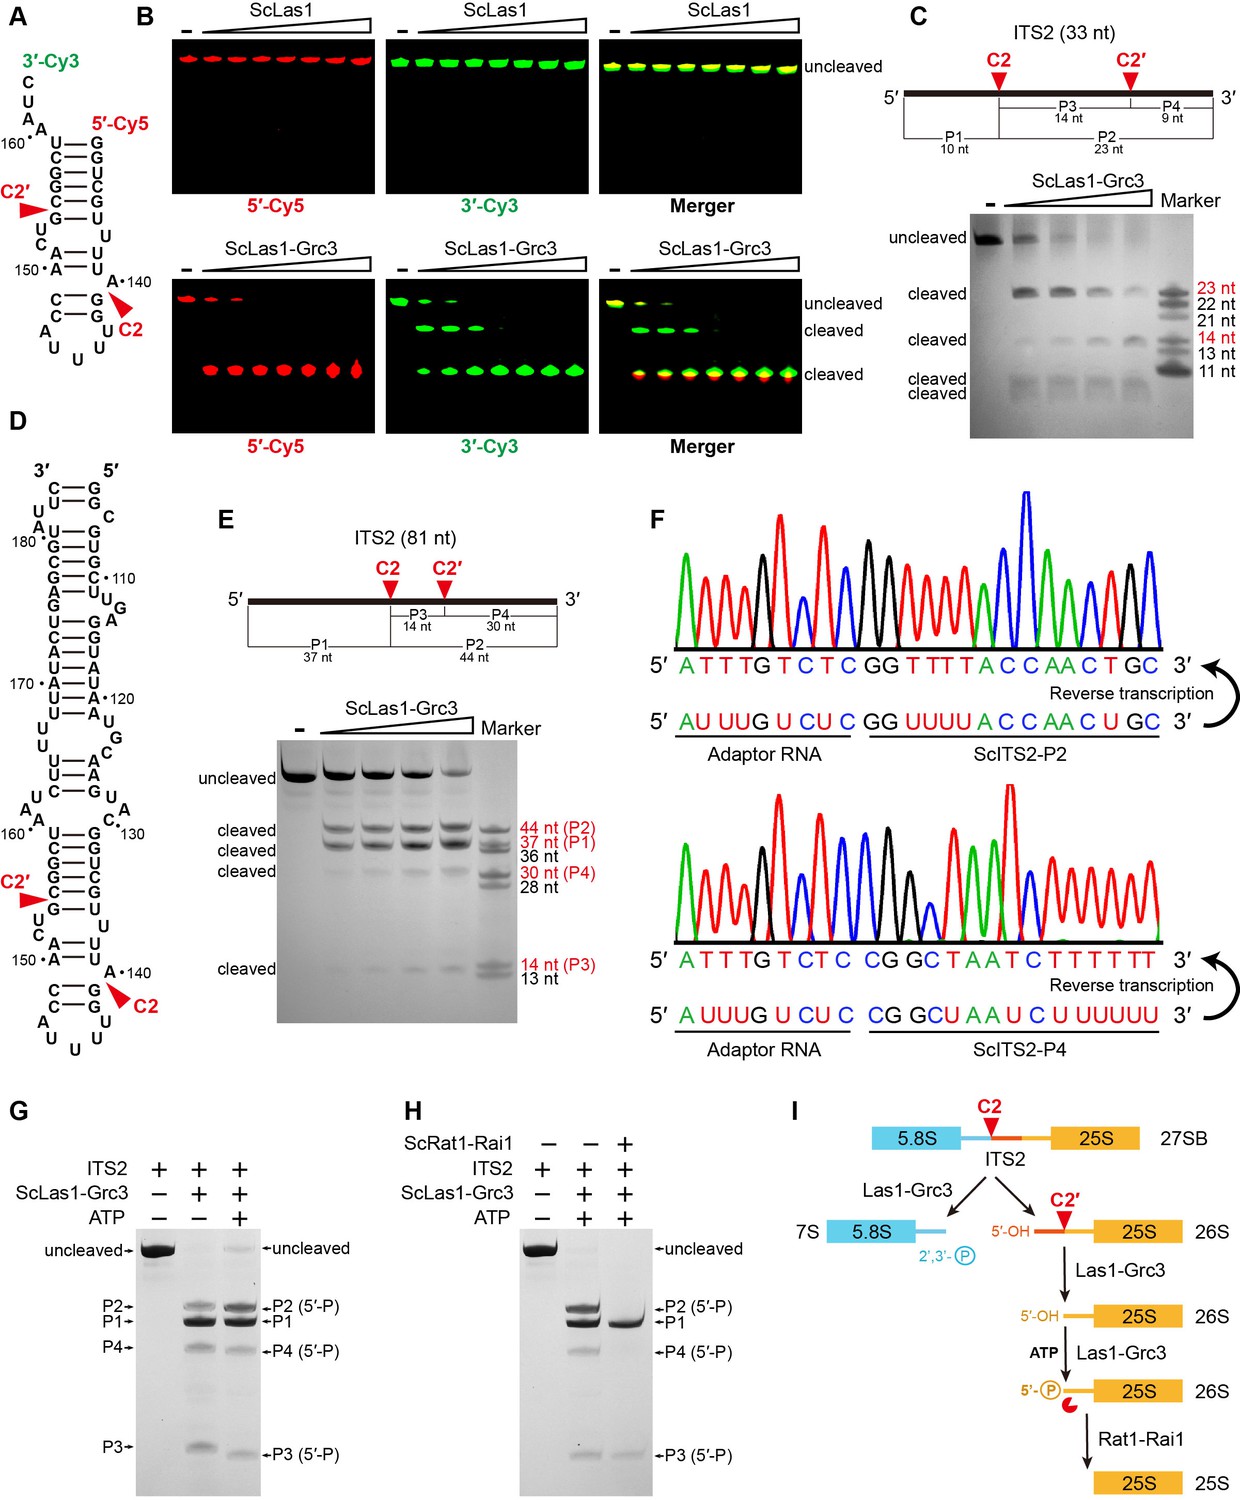
ScLas1 specifically cleaves ITS2 at the C2 and C2′ sites.
(A) 33-nt ITS2 RNA with 5′-Cy5 and 3′-Cy3 labels. (B) In vitro RNA cleavage assay using 5′-Cy5 and 3′-Cy3-labeled 33-nt RNA. (C) In vitro RNA cleavage assay of unlabeled 33-nt RNA. (D) 81-nt ITS2 RNA. (E) In vitro RNA cleavage assay of unlabeled 81-nt RNA. (F) RNA-sequencing traces from ScLas1-cleaved ITS2 products P2 and P4. (G) RNA phosphorylation assay with ScLas1-Grc3 complex. (H) RNA degradation assay with ScRat1-Rai1 complex. (I) The ITS2 pre-rRNA processing pathway. All cleavage experiments were repeated three times.
-
Figure 1—source data 1
Original files for the RNA cleavage analysis in Figure 1B (5′-Cy5, 3′-Cy3, Merger).
- https://cdn.elifesciences.org/articles/86847/elife-86847-fig1-data1-v1.zip
-
Figure 1—source data 2
Original scans of the relevant RNA cleavage analysis in Figure 1B (5′-Cy5, 3′-Cy3, Merger) with band and sample labels.
- https://cdn.elifesciences.org/articles/86847/elife-86847-fig1-data2-v1.zip
-
Figure 1—source data 3
Original file for the RNA cleavage analysis in Figure 1C.
- https://cdn.elifesciences.org/articles/86847/elife-86847-fig1-data3-v1.zip
-
Figure 1—source data 4
Original scan of the relevant RNA cleavage analysis in Figure 1C with band and sample labels.
- https://cdn.elifesciences.org/articles/86847/elife-86847-fig1-data4-v1.zip
-
Figure 1—source data 5
Original file for the RNA cleavage analysis in Figure 1E.
- https://cdn.elifesciences.org/articles/86847/elife-86847-fig1-data5-v1.zip
-
Figure 1—source data 6
Original scan of the relevant RNA cleavage analysis in Figure 1E with band and sample labels.
- https://cdn.elifesciences.org/articles/86847/elife-86847-fig1-data6-v1.zip
-
Figure 1—source data 7
Original file for the RNA cleavage analysis in Figure 1G and H.
- https://cdn.elifesciences.org/articles/86847/elife-86847-fig1-data7-v1.zip
-
Figure 1—source data 8
Original scan of the relevant RNA cleavage analysis in Figure 1G and H with band and sample labels.
- https://cdn.elifesciences.org/articles/86847/elife-86847-fig1-data8-v1.zip
Figure 1—figure supplement 1

CjGrc3-activated CjLas1-catalytic ITS2 pre-rRNA cleavage.
-
Figure 1—figure supplement 1—source data 1
Original files for the RNA cleavage analysis in Figure 1—figure supplement 1 (5′-Cy5, 3′-Cy3, Merger).
- https://cdn.elifesciences.org/articles/86847/elife-86847-fig1-figsupp1-data1-v1.zip
-
Figure 1—figure supplement 1—source data 2
Original scans of the relevant RNA cleavage analysis in Figure 1—figure supplement 1 (5′-Cy5, 3′-Cy3, Merger) with band and sample labels.
- https://cdn.elifesciences.org/articles/86847/elife-86847-fig1-figsupp1-data2-v1.zip
Figure 1—figure supplement 2

ScGrc3 has no ITS2 pre-rRNA cleavage activity.
-
Figure 1—figure supplement 2—source data 1
Original files for the RNA cleavage analysis in Figure 1—figure supplement 2 (5′-Cy5, 3′-Cy3, Merger).
- https://cdn.elifesciences.org/articles/86847/elife-86847-fig1-figsupp2-data1-v1.zip
-
Figure 1—figure supplement 2—source data 2
Original scans of the relevant RNA cleavage analysis in Figure 1—figure supplement 2 (5′-Cy5, 3′-Cy3, Merger) with band and sample labels.
- https://cdn.elifesciences.org/articles/86847/elife-86847-fig1-figsupp2-data2-v1.zip
Figure 1—figure supplement 3

Catalytic residues of Las1 HEPN domain are necessary for ITS2 pre-rRNA cleavage.
-
Figure 1—figure supplement 3—source data 1
Original files for the RNA cleavage analysis in Figure 1—figure supplement 3 (5′-Cy5, 3′-Cy3, Merger).
- https://cdn.elifesciences.org/articles/86847/elife-86847-fig1-figsupp3-data1-v1.zip
-
Figure 1—figure supplement 3—source data 2
Original scans of the relevant RNA cleavage analysis in Figure 1—figure supplement 3 (5′-Cy5, 3′-Cy3, Merger) with band and sample labels.
- https://cdn.elifesciences.org/articles/86847/elife-86847-fig1-figsupp3-data2-v1.zip
Figure 1—figure supplement 4

Characterization of the metal independence of ITS2 pre-rRNA cleavage.
-
Figure 1—figure supplement 4—source data 1
Original file for the metal-independent RNA cleavage analysis in Figure 1—figure supplement 4.
- https://cdn.elifesciences.org/articles/86847/elife-86847-fig1-figsupp4-data1-v1.zip
-
Figure 1—figure supplement 4—source data 2
Original scan of the relevant metal-independent RNA cleavage analysis in Figure 1—figure supplement 4 with band and sample labels.
- https://cdn.elifesciences.org/articles/86847/elife-86847-fig1-figsupp4-data2-v1.zip
Figure 2 with 1 supplement
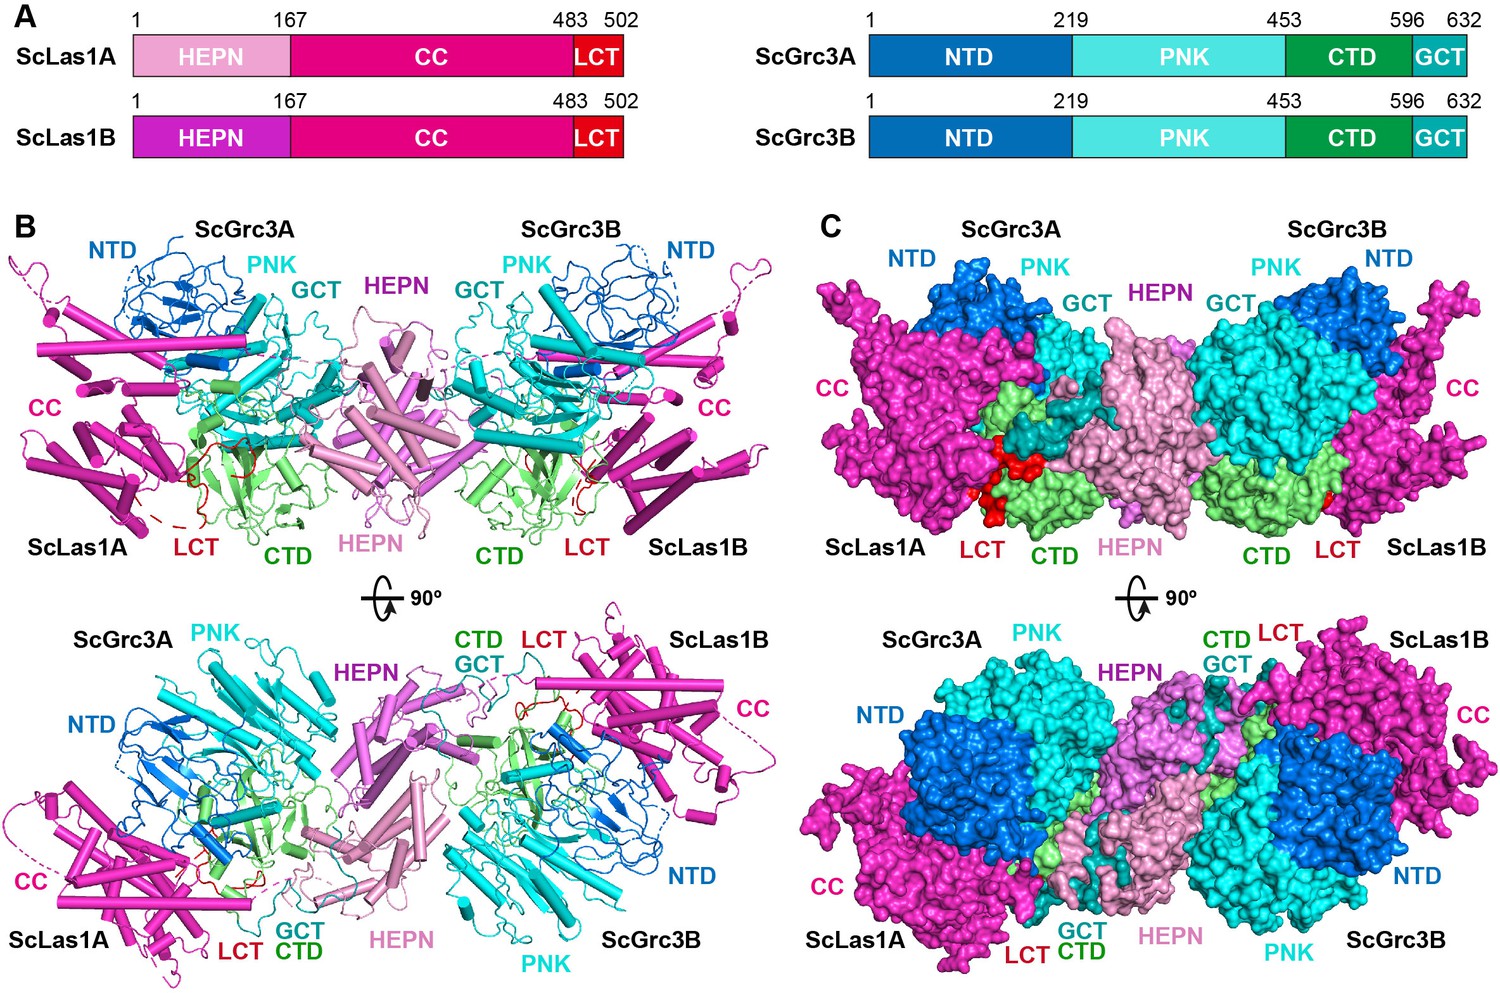
Overall structure of ScLas1-Grc3 complex.
(A) Domain organization of ScLas1 and ScGrc3. (B) Ribbon representations of ScLas1-Grc3 complex. Color coding used for Las1 and Grc3 is identical to that used in (A). (C) Surface representations of ScLas1-Grc3 complex. Color coding used for Las1 and Grc3 is identical to that used in (A).
Figure 2—figure supplement 1

Single-particle cryo-electron microscopy (cryo-EM) analysis of the ScLas1-Grc3 complex.
(A) Representative motion-corrected cryo-EM micrograph. (B) Reference-free 2D class averages. (C) Workflow of the data processing. (D) Euler angle distribution of the particle images. (E) Gold standard FSC plot for the 3D reconstruction with full particle set, calculated in cryoSPARC. (F) Resolution map for the final 3D reconstruction.
Figure 3 with 3 supplements
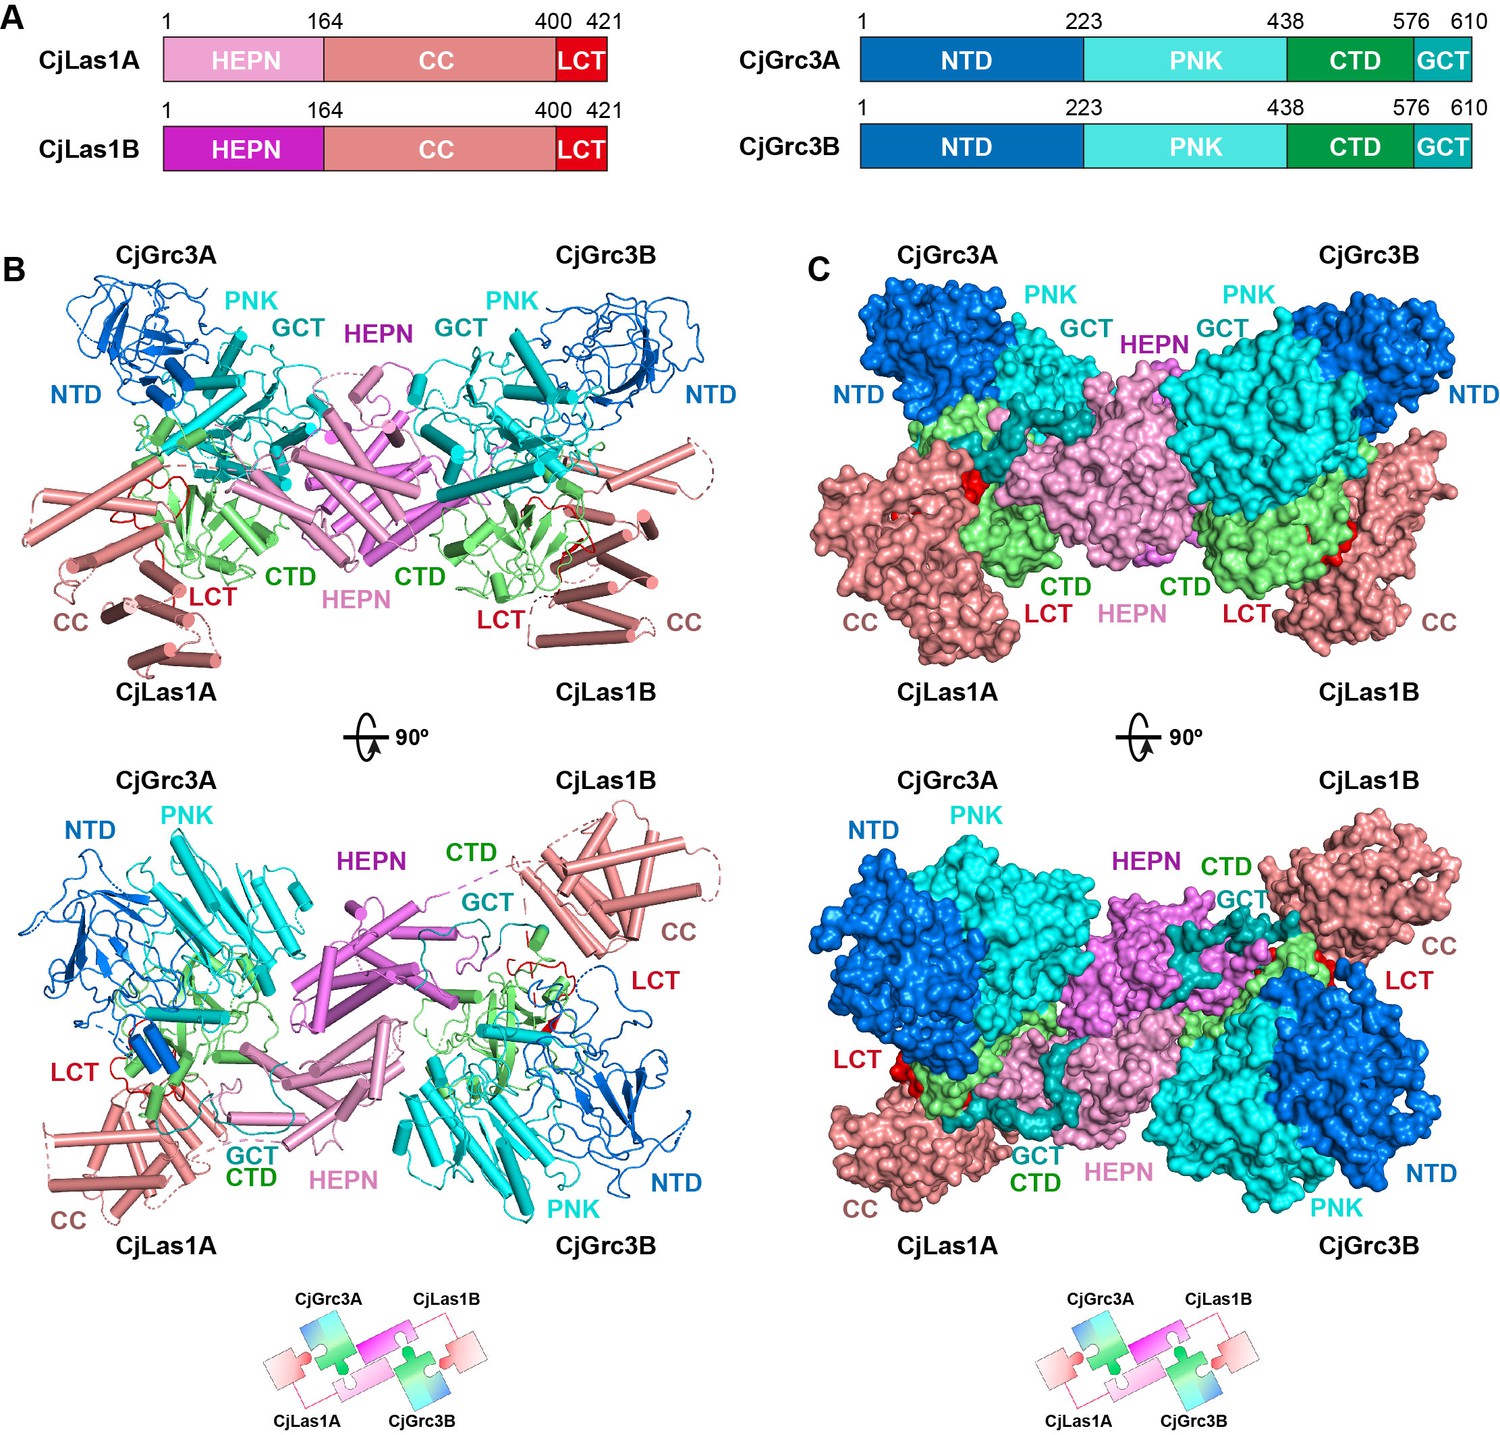
Overall structure of CjLas1-Grc3 complex.
(A) Domain organization of CjLas1 and CjGrc3. (B) Top: ribbon representations of CjLas1-Grc3 complex. Color coding used for Las1 and Grc3 is identical to that used in (A). Bottom: a diagram showing how the Las1-Grc3 tetramer is formed. (C) Top: surface representations of CjLas1-Grc3 complex. Color coding used for Las1 and Grc3 is identical to that used in (A). Bottom: a diagram showing how the Las1-Grc3 tetramer is formed.
Figure 3—figure supplement 1

Single-particle cryo-electron microscopy (cryo-EM) analysis of the CjLas1-Grc3 complex.
(A) Representative motion-corrected cryo-EM micrograph. (B) Reference-free 2D class averages. (C) Workflow of the data processing. (D) Euler angle distribution of the particle images. (E) Gold standard FSC plot for the 3D reconstruction with full particle set, calculated in cryoSPARC. (F) Resolution map for the final 3D reconstruction.
Figure 3—figure supplement 2

Comparison of cryo-electron microscopy (cryo-EM) and crystal structures of Las1-Grc3 complexes.
(A) Superposition of the ScLas1-Grc3 complex crystal structure with the cryo-EM structure. Color coding used for ScLas1 and ScGrc3 in crystal structure is identical to that used in Figure 2A. ScLas1 and ScGrc3 in cryo-EM structure are colored in gray. (B) Superposition of the CjLas1-Grc3 complex crystal structure with the cryo-EM structure. Color coding used for CjLas1 and CjGrc3 in crystal structure is identical to that used in Figure 3A. CjLas1 and CjGrc3 in cryo-EM structure are colored in gray.
Figure 3—figure supplement 3

Sequence alignment of Las1 proteins.
The ScLas1 protein was aligned with its respective homologs. Alignment was performed using the MUSCLE program. The secondary structures of ScLas1 and CjLas1 are shown above and below the sequences, respectively. Conserved residues are highlighted in yellow, and invariant residues are highlighted in red. Catalytic residues in Las1 HEPN domain are marked in violet triangles. The figure was prepared using ESPript3.
Figure 4
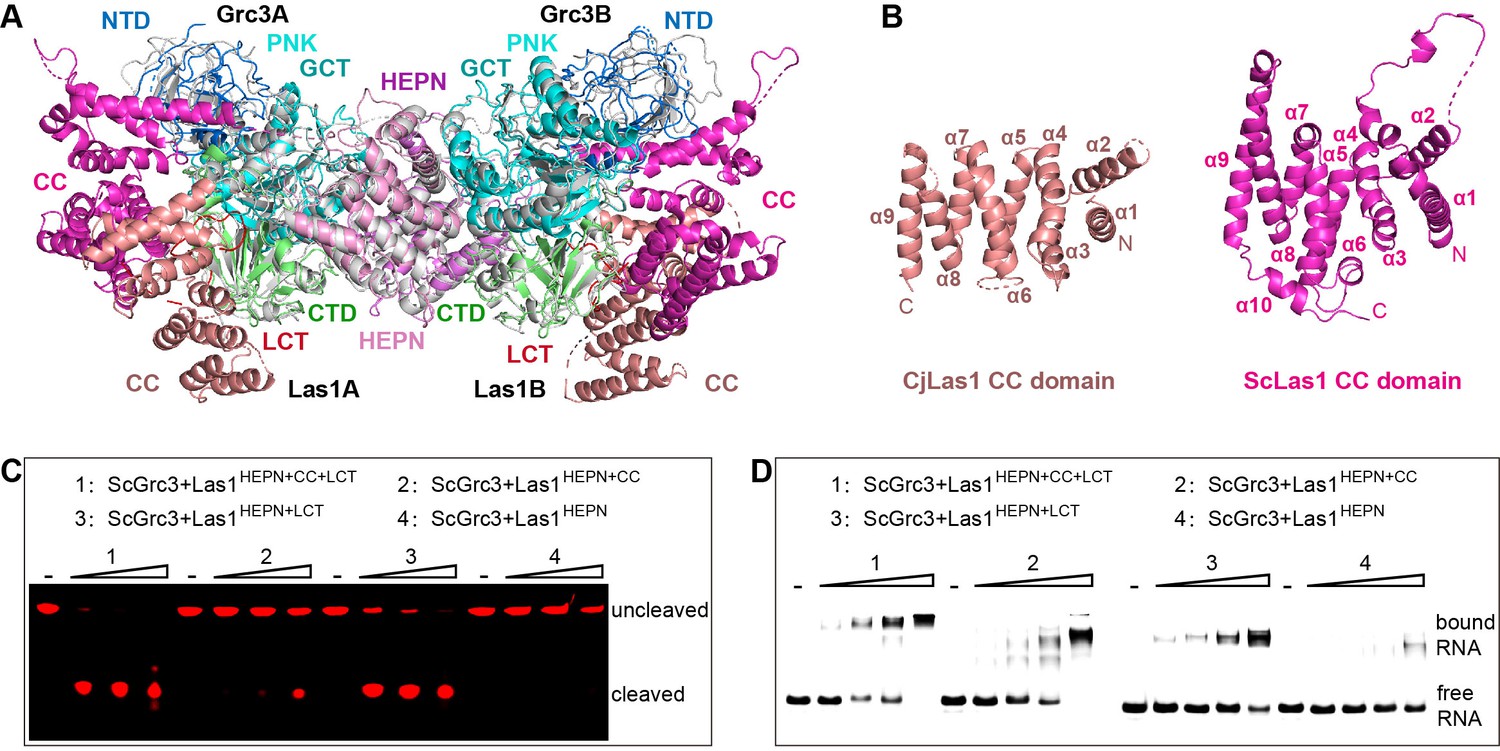
The coiled-coil (CC) domain contributes to ITS2 RNA binding and cleavage.
(A) Structural comparison between ScLas1-Grc3 complex and CjLas1-Grc3 complex. Color coding used for ScLas1 and ScGrc3 is identical to that used in Figure 2A. The CC domain of CjLas1 is colored in salmon, other domains of CjLas1 and all domains of CjGrc3 are colored in gray. (B) Structures of CjLas1 CC domain (in salmon) and ScLas1 CC domain (in light magenta). (C) In vitro RNA cleavage assay using indicated truncations of ScLas1. HEPN: residues 1–165; CC: residues 181–430; LCT: residues 430–502. (D) Electrophoretic mobility shift assay using indicated truncations of ScLas1. All experiments were repeated three times.
-
Figure 4—source data 1
Original files for the RNA cleavage and binding analysis in Figure 4C and D.
- https://cdn.elifesciences.org/articles/86847/elife-86847-fig4-data1-v1.zip
-
Figure 4—source data 2
Original scans of the relevant RNA cleavage and binding analysis in Figure 4C and D with band and sample labels.
- https://cdn.elifesciences.org/articles/86847/elife-86847-fig4-data2-v1.zip
Figure 5 with 4 supplements
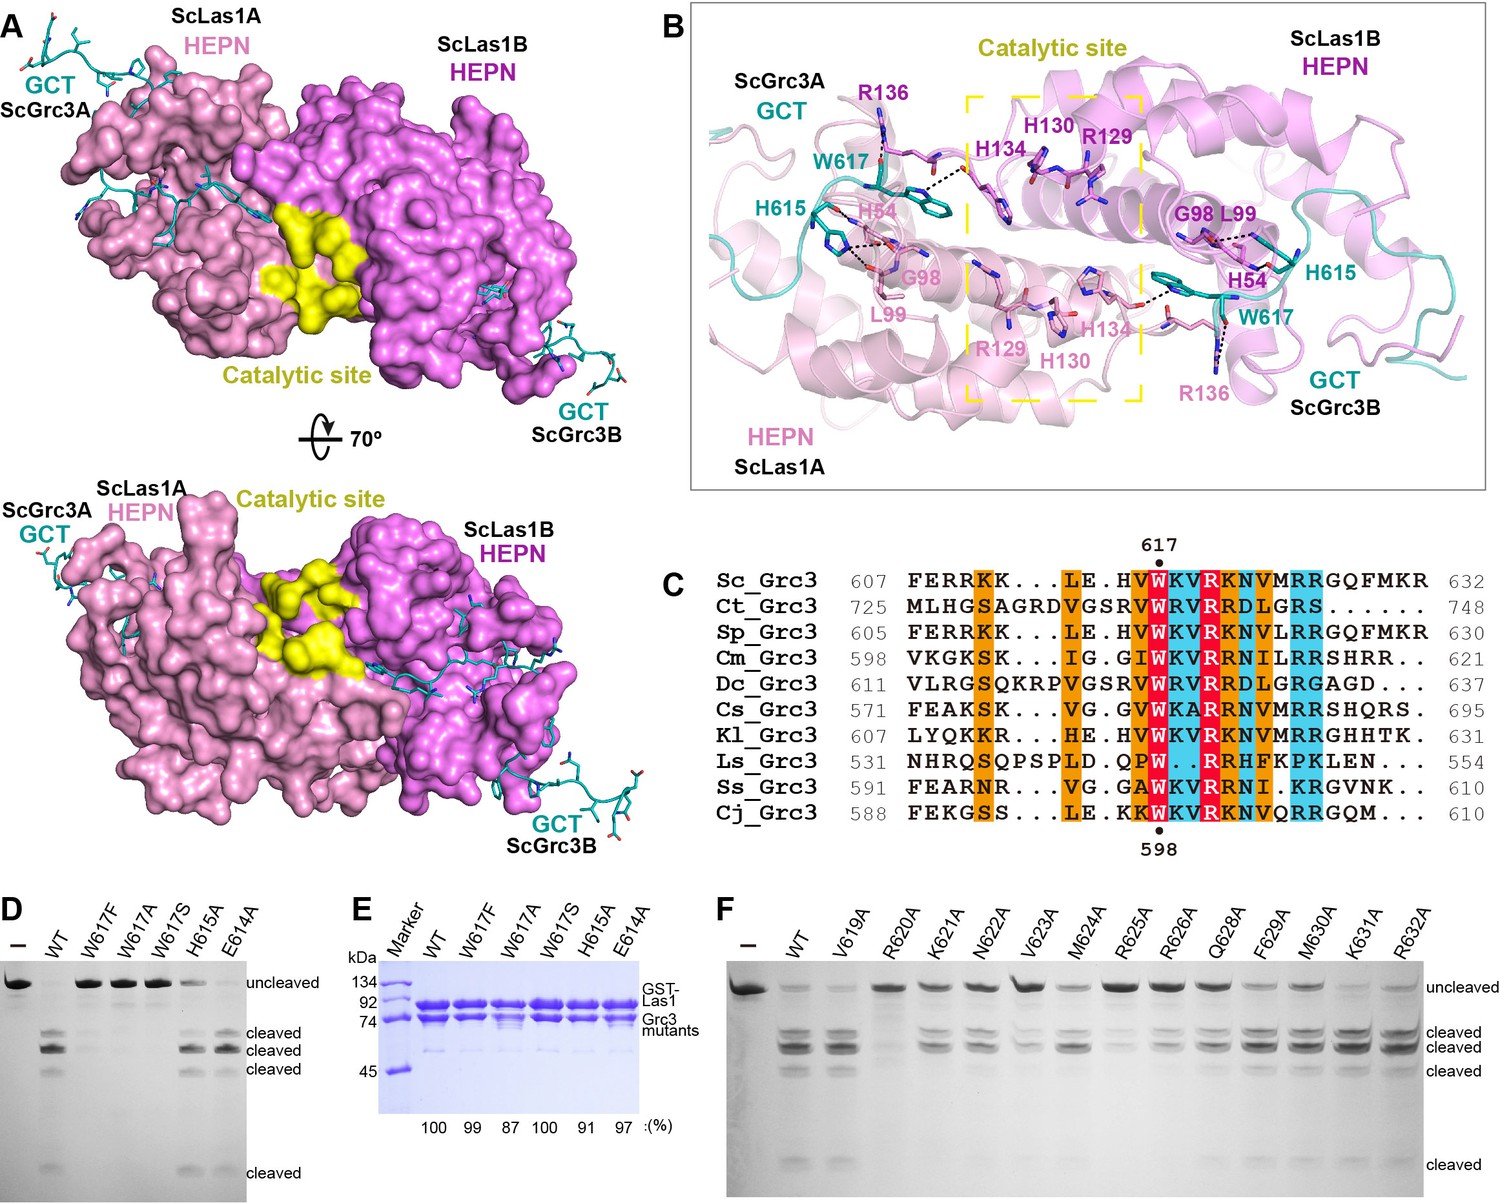
ScGrc3 GCT mediates the ITS2 cleavage activity of ScLas1.
(A) The crystal structure shows that ScGrc3 GCT binds at an active channel of ScLas1 HEPN dimer. Two HEPN domains of Las1 are colored in pink and violet, respectively. GCTs of Grc3 are colored in teal. The catalytic site is highlighted in yellow. HEPN domains are shown as surfaces, while GCTs are shown as sticks. (B) Detailed interactions between ScGrc3 GCT and ScLas1 HEPN domain. (C) Sequence alignments of Grc3 GCTs. Identical residues are highlighted in red. Basically constant residuals are shaded in blue. Conserved residues are shaded in orange. (D) In vitro enzymatic assay of mutations of ScGrc3 residues Glu614, His615, and Trp617. (E) GST pull-down experiment assaying the ability of ScGrc3 mutants to interact with ScLas1. (F) In vitro enzymatic assay of alanine mutations of ScGrc3 C-terminal residues. All experiments were repeated three times.
-
Figure 5—source data 1
Original files for enzymatic assay and GST pull-down analysis in Figure 5D–F.
- https://cdn.elifesciences.org/articles/86847/elife-86847-fig5-data1-v1.zip
-
Figure 5—source data 2
Original scans of the relevant enzymatic assay and GST pull-down analysis in Figure 5D–F with band and sample labels.
- https://cdn.elifesciences.org/articles/86847/elife-86847-fig5-data2-v1.zip
Figure 5—figure supplement 1

Cryo-electron microscopy (cryo-EM) data shows the interactions between ScGrc3 GCTs and ScLas1 HEPN domains.
Figure 5—figure supplement 2

Comparison of crystal structure and cryo-electron microscopy (cryo-EM) structure of HEPN domains and GCTs in ScLas1-Grc3 complex.
Figure 5—figure supplement 3

Cryo-electron microscopy (cryo-EM) data (top) and crystal data (bottom) show the electron density of the catalytic site of ScLas1 and the GCTs of ScGrc3.
Figure 5—figure supplement 4

In vitro enzymatic assay of alanine mutations of conserved CjGrc3 residues Trp618, Arg601, Arg606, and Arg607.
-
Figure 5—figure supplement 4—source data 1
Original files for the RNA cleavage analysis in Figure 5—figure supplement 4.
- https://cdn.elifesciences.org/articles/86847/elife-86847-fig5-figsupp4-data1-v1.zip
-
Figure 5—figure supplement 4—source data 2
Original scans of the relevant RNA cleavage analysis in Figure 5—figure supplement 4 with band and sample labels.
- https://cdn.elifesciences.org/articles/86847/elife-86847-fig5-figsupp4-data2-v1.zip
Figure 6 with 3 supplements
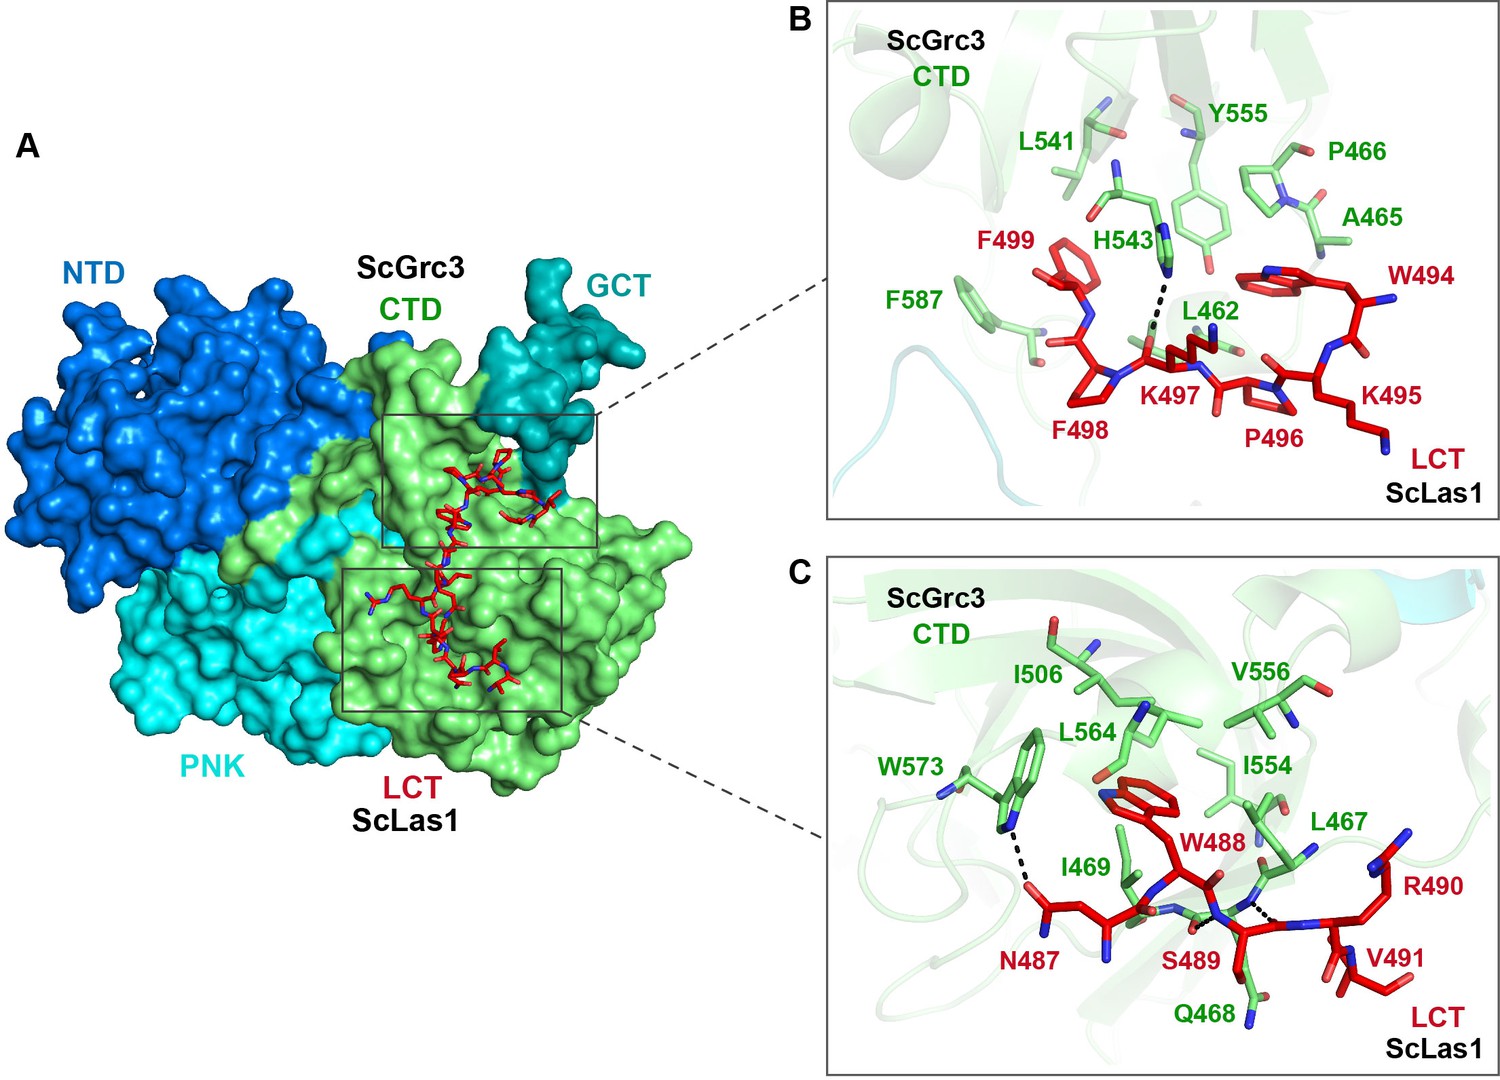
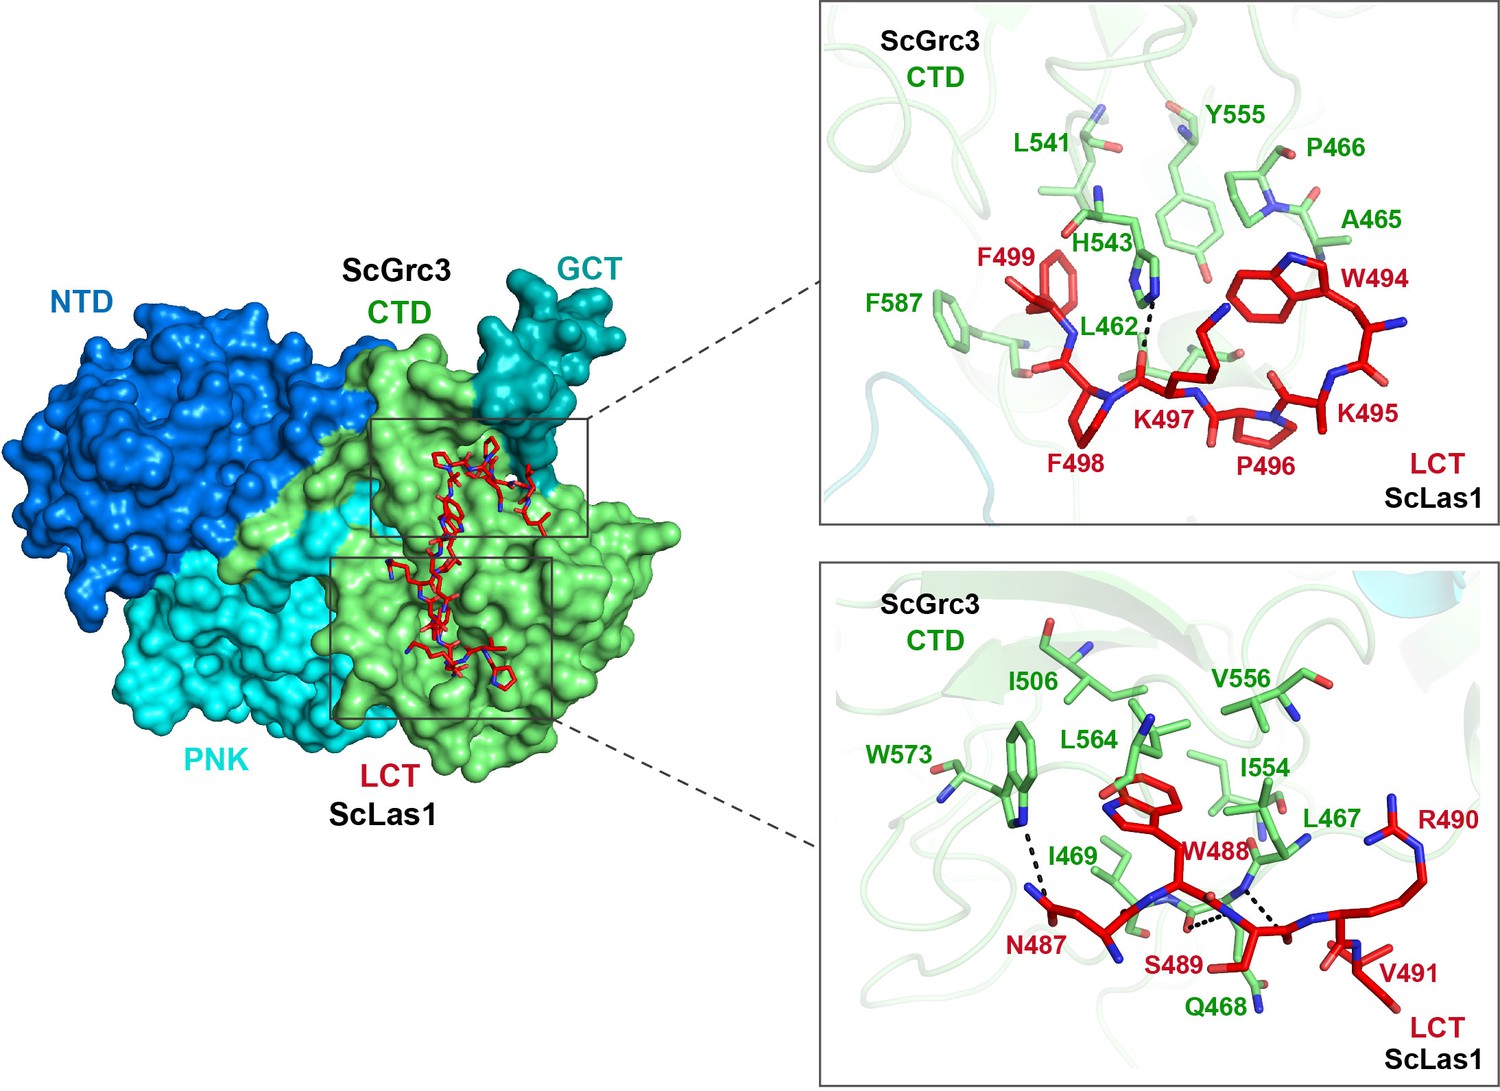
Las1 LCT drives Las1-Grc3 cross-talk.
(A) The crystal structure shows that ScLas1 LCT binds to the CTD domain of ScGrc3. ScGrc3 is shown as surface, ScLas1 LCT is shown as stick. (B) Detailed interactions between C-terminal residues of ScLas1 LCT and ScGrc3 CTD domain. (C) Detailed interactions between N-terminal residues of ScLas1 LCT and ScGrc3 CTD domain.
Figure 6—figure supplement 1
Cryo-electron microscopy (cryo-EM) data shows the interactions between ScLas1 LCT and ScGrc3 CTD domain.
Figure 6—figure supplement 2

Denaturing gel showing the ITS2 pre-RNA cleavage by mutation or deletion of the interacting residues of ScLas1 LCT.
All cleavage experiments were repeated three times.
-
Figure 6—figure supplement 2—source data 1
Original file for the RNA cleavage analysis in Figure 6—figure supplement 2.
- https://cdn.elifesciences.org/articles/86847/elife-86847-fig6-figsupp2-data1-v1.zip
-
Figure 6—figure supplement 2—source data 2
Original scan of the relevant RNA cleavage analysis in Figure 6—figure supplement 2 with band and sample labels.
- https://cdn.elifesciences.org/articles/86847/elife-86847-fig6-figsupp2-data2-v1.zip
Figure 6—figure supplement 3

GST pull-down experiment assaying the Grc3 binding ability by mutation or deletion of the interacting residues of ScLas1 LCT.
All experiments were repeated three times.
-
Figure 6—figure supplement 3—source data 1
Original file for the GST pull-down analysis in Figure 6—figure supplement 3.
- https://cdn.elifesciences.org/articles/86847/elife-86847-fig6-figsupp3-data1-v1.zip
-
Figure 6—figure supplement 3—source data 2
Original scan of the relevant GST pull-down analysis in Figure 6—figure supplement 3 with band and sample labels.
- https://cdn.elifesciences.org/articles/86847/elife-86847-fig6-figsupp3-data2-v1.zip
Figure 7 with 3 supplements
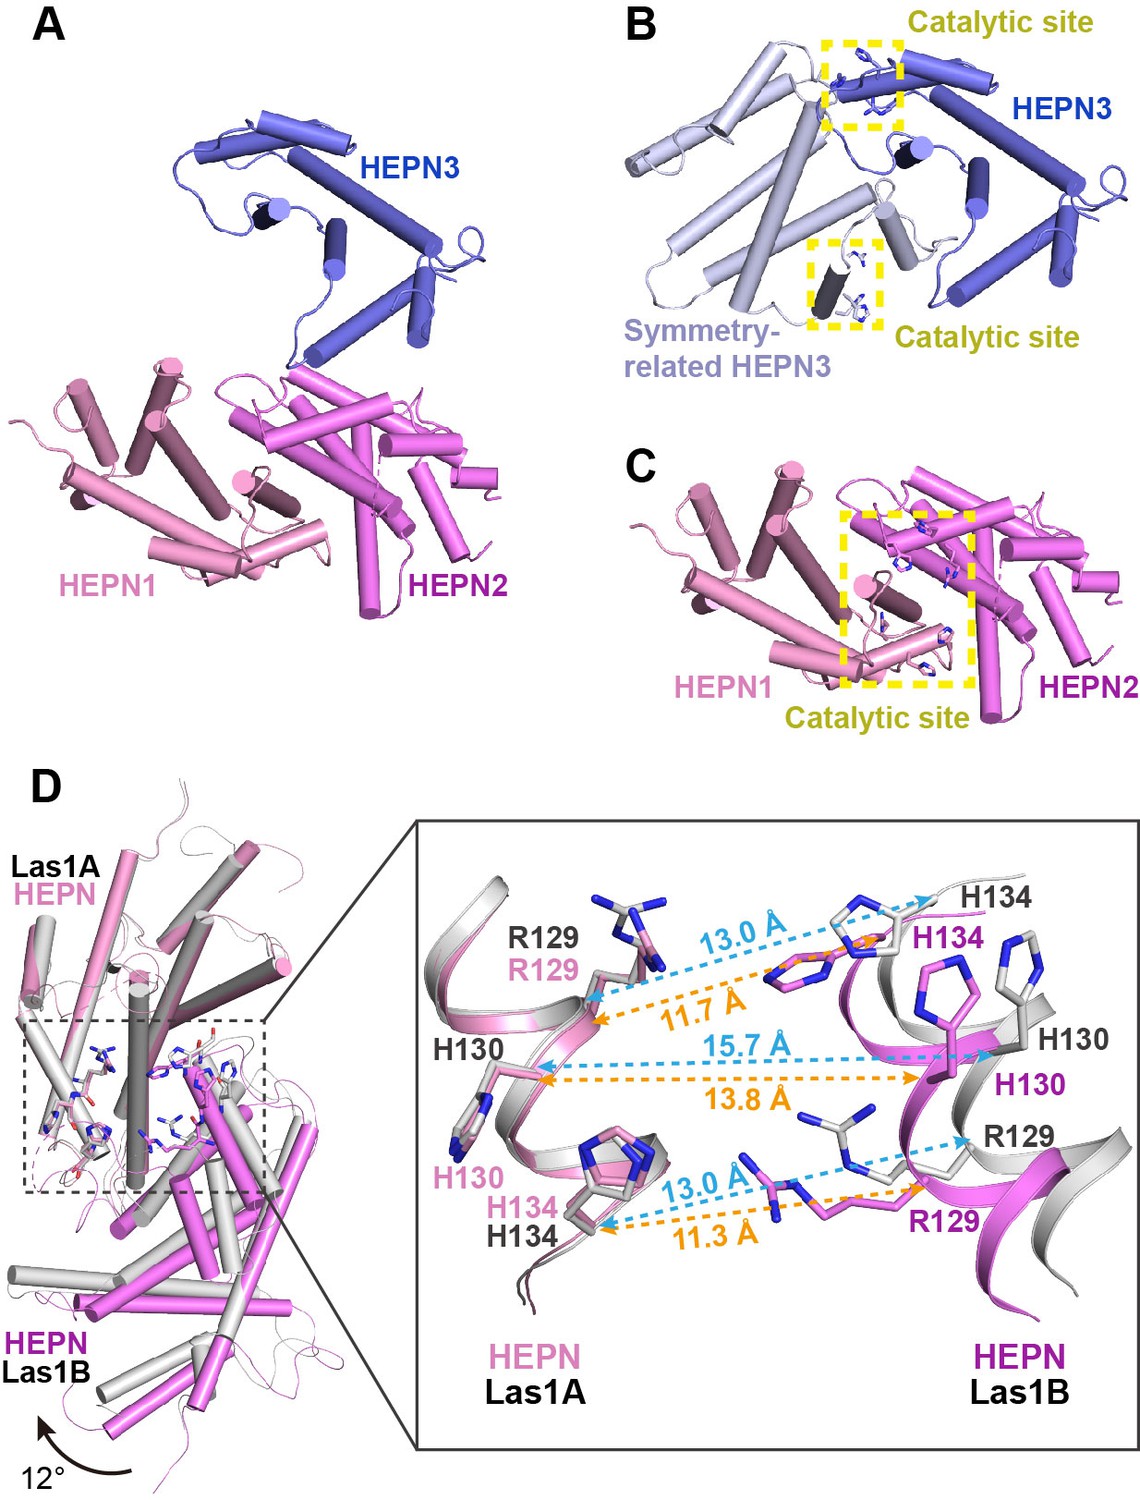
Activation mechanism of Las1 by Grc3.
(A) Crystal structure of CjLas1 HEPN domain. (B) The HEPN3 molecule (in slate) and its symmetry-related molecule (in blue white) in Las1 HEPN domain structure. (C) The HEPN1 (in pink) and HEPN2 (in violet) molecules in Las1 HEPN domain structure. (D) Structural comparison of HEPN dimers between CjLas1-Grc3 complex (Las1A HEPN in pink, Las1B HEPN in violet) and CjLas1 HEPN domain (in gray). Inset: a magnified view of the comparison of the catalytic site in the two structures.
Figure 7—figure supplement 1

Structural superposition of HEPN3 (in slate) and its symmetry-related molecule (in blue white) with the HEPN1(in pink)-HEPN2 (in violet) dimer.
Figure 7—figure supplement 2
Structural comparison of HEPN dimers between ScLas1-Grc3 complex (Las1A HEPN in pink, Las1B HEPN in violet) and CjLas1 HEPN domain (in gray).
Inset: a magnified view of the comparison of the catalytic site in the two structures.
Figure 7—figure supplement 3
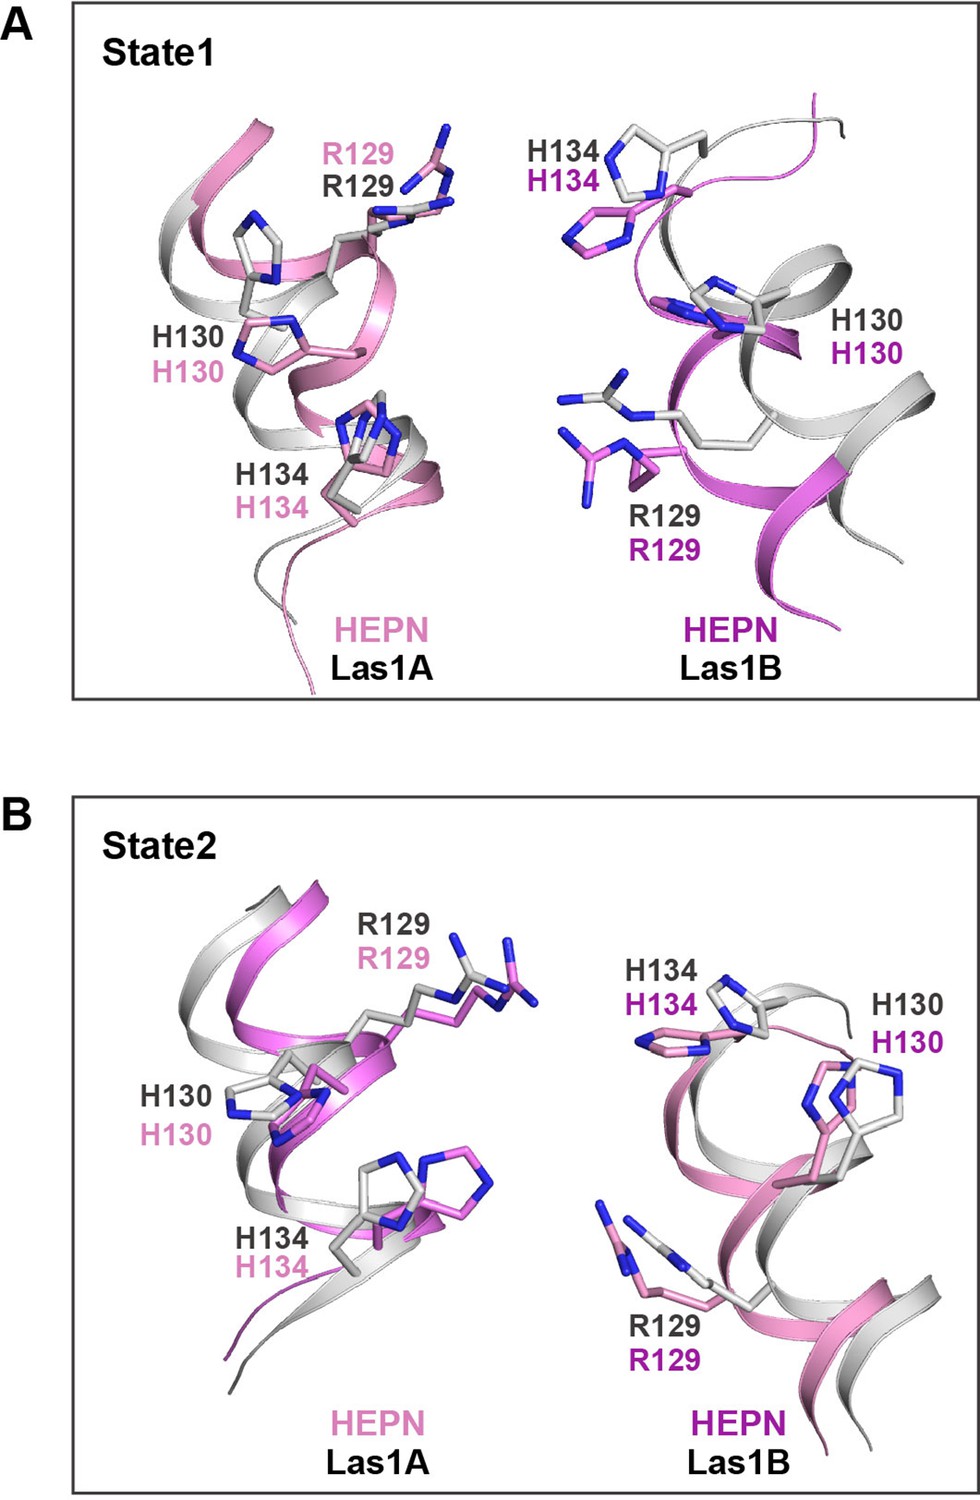
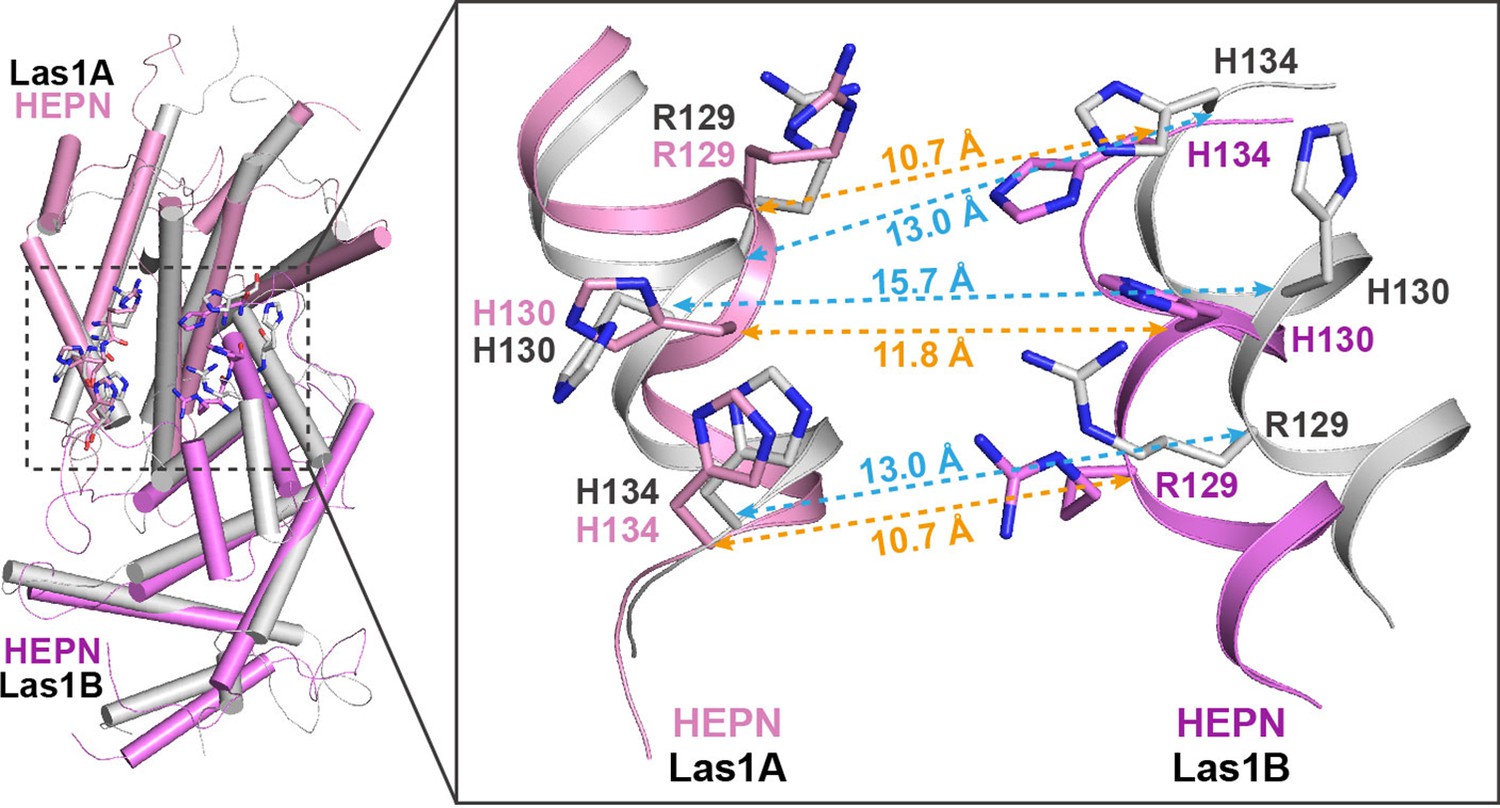
Structural comparison of catalytic sites between Las1-Grc3 complexes.
(A) Structural comparison of catalytic sites between ScLas1-Grc3 complex (Las1A HEPN in pink, Las1B HEPN in violet) and CtLas1-Grc3 complex in state 1 (in gray, PDB code: 6of3). (B) Structural comparison of catalytic sites between CjLas1-Grc3 complex (Las1A HEPN in pink, Las1B HEPN in violet) and CtLas1-Grc3 complex in state 2 (in gray, PDN code: 6of2).
Figure 8 with 1 supplement
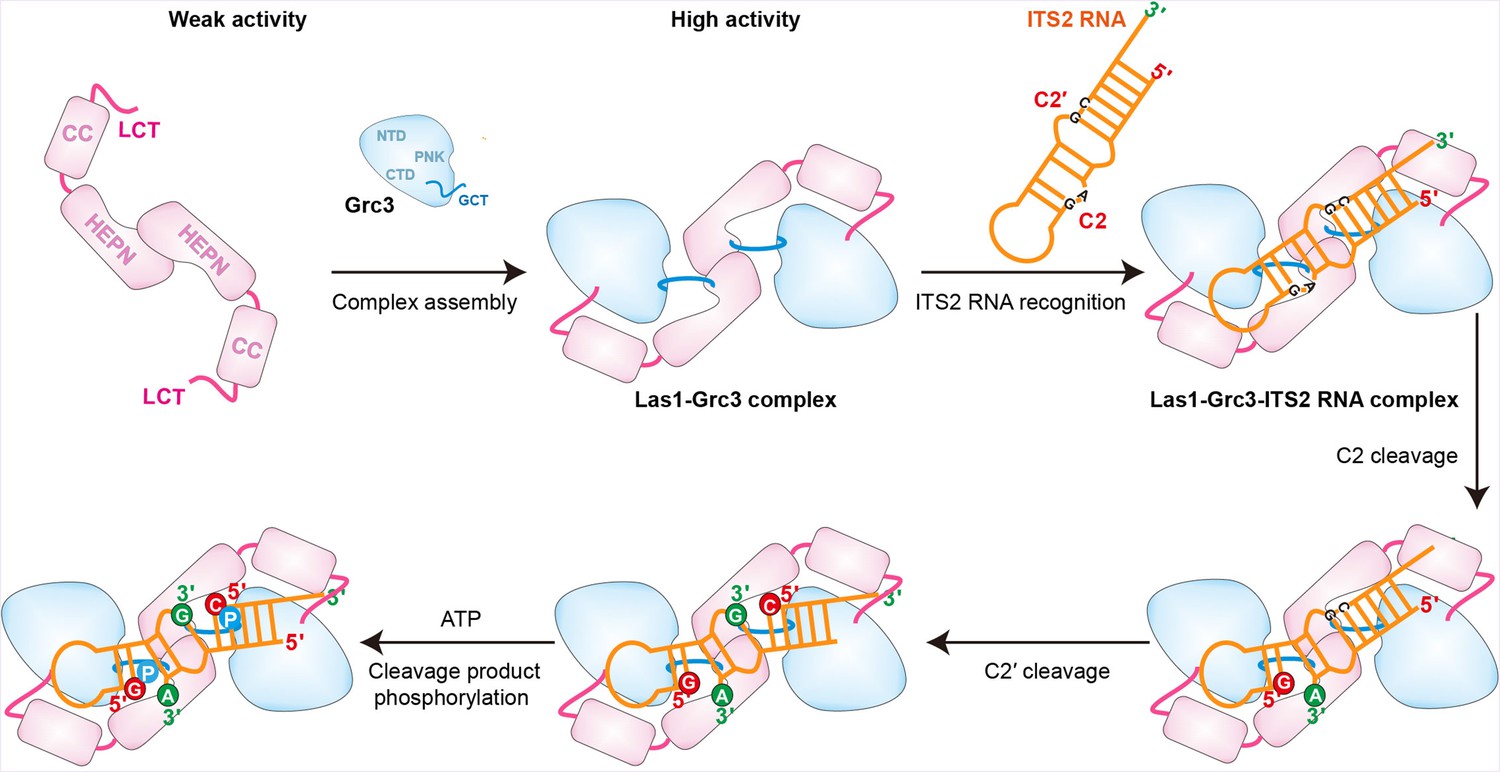
Model for Grc3-mediated Las1-catalyzed ITS2 pre-rRNA processing.
Prior to assembly with Grc3, Las1 shows weak processing activity for ITS2 precursor RNA. When combined with Grc3 to form a tetramer complex, Las1 shows high processing activity for ITS2 precursor RNA. Las1 specifically cleaves ITS2 at the C2 and C2′ sites to generate 5′-OH terminus products. The 5′-OH terminus products are further phosphorylated by Grc3 when in the presence of ATP.
Figure 8—figure supplement 1

Comparison of Las1-Grc3, Ire1, and RNase L.
Comparison of structural assembly, activation, and substrate recognition mechanisms of Las1-Grc3, Ire1, and RNase L. Two HEPN domains in Las1, Ire1, and RNase L are colored in pink and violet, respectively. Two PNK domains in Grc3, two kinase domains in Ire1, and two preudo-kinase domains in RNase L are colored in cyan and green cyan, respectively. The catalytic site is highlighted with a yellow box.
Tables
Table 1
Crystallographic data collection and refinement statistics.
| ScLas1-Grc3 | CjLas1-Grc3 | CjLas1 | |
|---|---|---|---|
| Data collection* | |||
| Space group | C2 | C2221 | P212121 |
| Cell dimensions | |||
| a, b, c (Å) | 233.6, 116.1, 159.3 | 152.6, 240.0, 237.0 | 51.5, 59.0, 158.7 |
| α,β,γ (°) | 90.0, 96.4, 90.0 | 90.0, 90.0, 90.0 | 90.0, 90.0, 90.0 |
| Resolution (Å) | 50.00–3.50 (3.56–3.50) | 50.00–3.23 (3.29–3.23) | 50.00–1.80 (1.83–1.80) |
| Rmerge | 0.298 (0.980) | 0.344 (0.958) | 0.103 (0.929) |
| I/σI | 4.8 (1.1) | 4.3 (1.6) | 22.0 (2.5) |
| Completeness (%) | 98.8 (96.5) | 99.9 (99.9) | 97.7 (95.8) |
| Redundancy | 4.5 (3.5) | 7.5 (6.4) | 10.1 (9.5) |
| Refinement | |||
| Resolution (Å) | 3.69 | 3.39 | 1.80 |
| No. reflections | 36,773 | 41,321 | 44,296 |
| Rwork/Rfree | 0.2798/0.3151 | 0.3041/0.3281 | 0.2120/0.2334 |
| No. atoms | |||
| Protein | 22,873 | 18,763 | 3657 |
| Water | 180 | 386 | 212 |
| B-factors (Å2) | |||
| Protein | 95.5 | 125.6 | 23.3 |
| Water | 33.2 | 55.9 | 28.5 |
| R.m.s. deviations | |||
| Bond length (Å) | 0.008 | 0.011 | 0.015 |
| Bond angles (°) | 1.516 | 1.785 | 1.500 |
| Ramachandran plot | |||
| Favored region | 94.96 | 95.72 | 97.98 |
| Allowed region | 4.86 | 4.28 | 2.02 |
| Outlier region | 0.18 | 0.00 | 0.00 |
-
*
Highest resolution shell is shown in parentheses.
Table 2
Cryo-electron microscopy (cryo-EM) data collection, refinement, and validation statistics.
| ScLas1-Grc3 | CjLas1-Grc3 | |
|---|---|---|
| Data collection and processing | ||
| Microscope | Titan Krios | Titan Krios |
| Voltage (kV) | 300 | 300 |
| Camera | Gatan K3 | Gatan K3 |
| Magnification | 105,000× | 105,000× |
| Pixel size (Å) | 0.82 | 0.82 |
| Total exposure (e-/Å2) | 50 | 50 |
| Exposure time (s) | 3 | 3 |
| Number of frames per exposure | 30 | 30 |
| Energy filter slit width (keV) | 20 | 20 |
| Data collection software | EPU | EPU |
| Defocus range (μm) | –1.3 to –2.7 | –1.2 to –3 |
| Number of micrographs | 2520 | 8616 |
| Number of initial particles | 525,213 | 2,215,555 |
| Symmetry | C2 | C2 |
| Number of final particles | 264,341 | 523,843 |
| Resolution (0.143 gold standard FSC, Å) | 3.07 | 3.39 |
| Local resolution range (Å) | 2.8–4.8 | 2.8–4.8 |
| Microscope | Titan Krios | Titan Krios |
| Refinement | ||
| Model composition | ||
| Nonhydrogen atoms | 11,212 | 10,013 |
| Protein residues | 1426 | 1339 |
| B-factors (Å2) | ||
| Protein | 92.58 | 85.58 |
| R.m.s. deviations | ||
| Bond length (Å) | 0.009 | 0.004 |
| Bond angles (°) | 1.055 | 0.849 |
| Validation | ||
| MolProbity score | 2.90 | 2.69 |
| Clashscore | 20.56 | 18.60 |
| Rotamer outliers (%) | 8.75 | 7.86 |
| Ramachandran plot | ||
| Favored region | 94.46 | 96.38 |
| Allowed region | 4.83 | 3.31 |
| Outlier region | 0.71 | 0.31 |
Additional files
Download links
A two-part list of links to download the article, or parts of the article, in various formats.
Downloads (link to download the article as PDF)
Open citations (links to open the citations from this article in various online reference manager services)
Cite this article (links to download the citations from this article in formats compatible with various reference manager tools)
Structural and mechanistic insights into ribosomal ITS2 RNA processing by nuclease-kinase machinery
eLife 12:RP86847.
https://doi.org/10.7554/eLife.86847.3


