Vitamin D induces SIRT1 activation through K610 deacetylation in colon cancer
- Area of Physiology, Faculty Health Sciences, University Rey Juan Carlos, Alcorcón, Spain
- Translational Oncology Division, OncoHealth Institute, Health Research Institute-University Hospital Fundación Jiménez Díaz-Universidad Autónoma de Madrid, Spain
- Department of Surgical Pathology, Hospital Clínico San Carlos, Spain
- Department of Surgery, University Hospital Fundación Alcorcón-Universidad Rey Juan Carlos, Alcorcón, Spain
- Unidad de Tumores Endocrinos (UFIEC), Instituto de Salud Carlos III, Majadahonda, Spain
- CIBER de Cáncer, Instituto de Salud Carlos III, Spain
- Instituto de Investigaciones Biomédicas "Alberto Sols", Consejo Superior de Investigaciones Científicas, Universidad Autónoma de Madrid, Spain
- Instituto de Investigación Sanitaria del Hospital Universitario La Paz, Spain
Figures
Figure 1
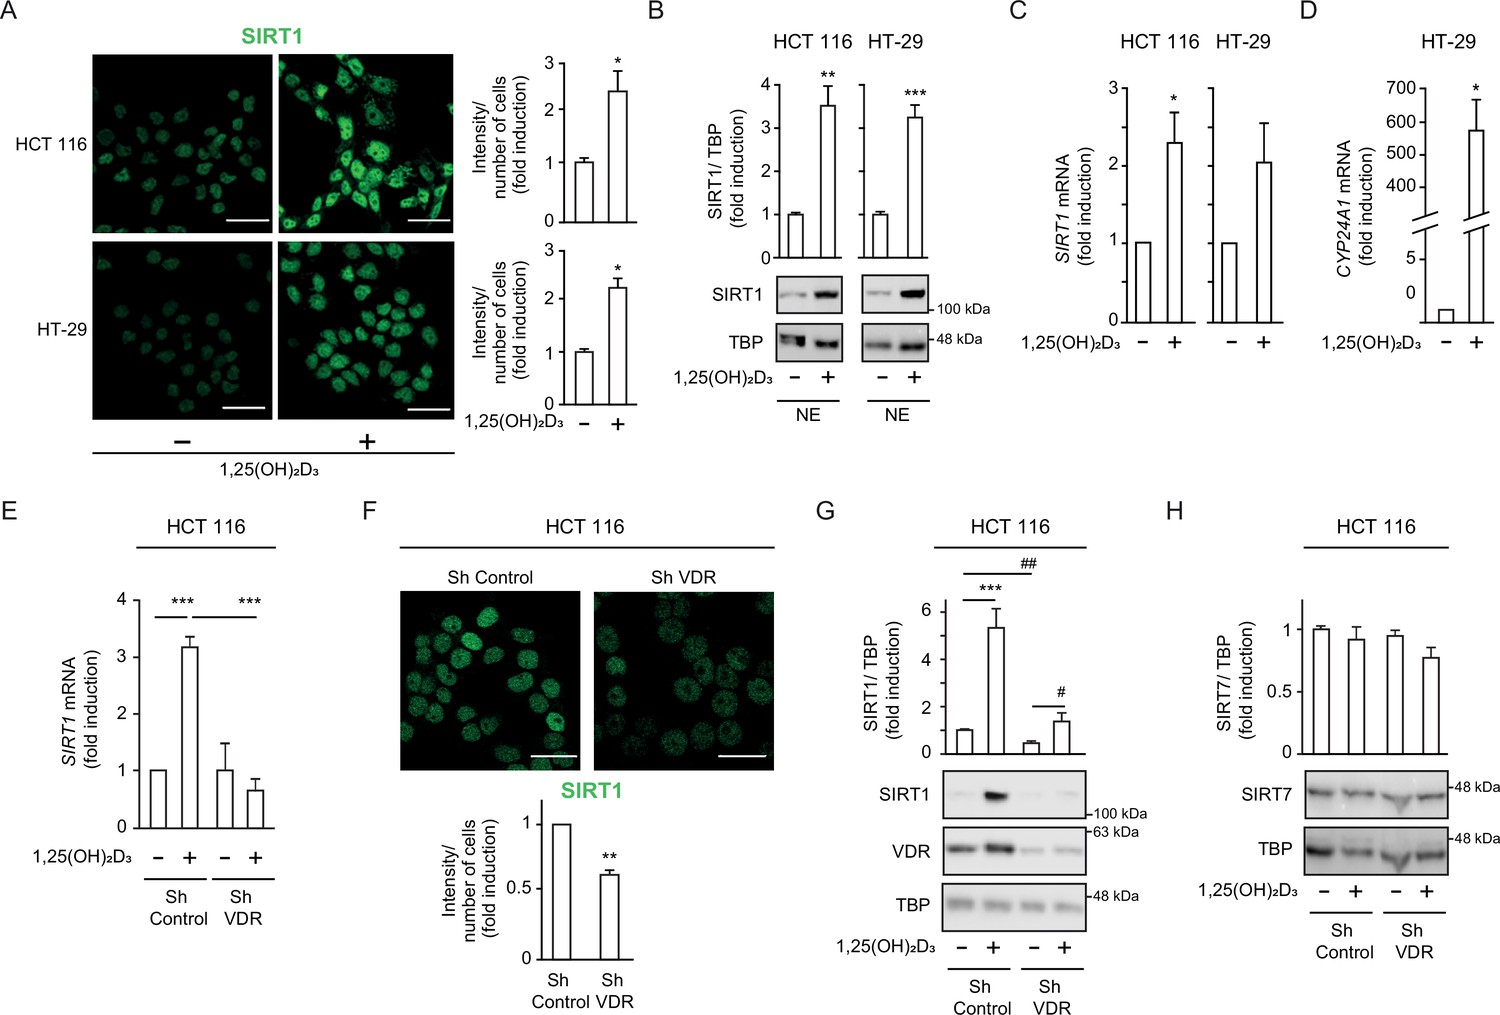
1,25(OH)2D3 increases SIRT1 levels in CRC cells and VDR is required to ensure basal levels.
(A)-(D) HCT 116 or HT-29 CRC cells cultured under standard conditions and where indicated, treated with 1α,25-dihydroxyvitamin D3 (1,25(OH)2D3), 100 nM, added 24 hr before harvesting. (E)-(H) ShVDR cells were derived from HCT 116 by stable and specific knock-down of vitamin D receptor (VDR) using specific shRNA and are compared to ShControl cells that contain normal VDR levels (Larriba et al., 2011). Cell extracts were fractionated in all cases. (A) Confocal imaging of SIRT1 (green) in CRC (HCT 116 and HT-29) cells and fluorescence intensity quantification of 3 independent experiments using ImageJ software. For each experiment, three different fields were evaluated per slide. Scale bars:25 µm. (B) Western-blot analysis of 1,25(OH)2D3 effects on levels of SIRT1 in nuclear extracts (NE) from indicated CRC cells. Representative blots and statistical analysis using TBP as loading controls. (C)-(E) RT-qPCR analysis of the effect of 1,25 (OH)2D3 in indicated colon cancer cells. Values normalized with endogenous control (18 S RNA) are referred as fold induction over cells without 1,25(OH)2D3. (C) Effect of 1,25 (OH)2D3 on SIRT1 gene expression. (D) validation of 1,25 (OH)2D3 activity on the canonical target gene cytochrome P450 family 24 subfamily A member 1, CYP24A1, in HT-29 colon cancer cells. (E) Requirement of vitamin D receptor (VDR) for 1,25 (OH)2D3 induction of SIRT1 gene expression. (F) Effect of VDR knock-down on SIRT1 protein content evaluated by confocal imaging of ShControl and ShVDR HCT 116 colon cancer cells to detect SIRT1 (green). Scale bars represent 25 μm. On the right, quantification of fluorescence intensity using ImageJ software; for each experiment, three different fields were evaluated per slide. (G) Western blot analysis of the effect of 1,25 (OH)2D3 on nuclear accumulation of SIRT1 in cells depleted (ShVDR) or not (ShControl) of VDR. (H) Specificity of 1,25 (OH)2D3 effects on SIRT1 by western blot analysis of the alternative nuclear sirtuin, SIRT7. Statistical analysis of three independent experiments in each panel was performed by Student t-test (A) to (D) and (H) or by One-Way ANOVA (E)-(F). For (G), statistical analysis of the four groups by ANOVA is represented by * and comparison of the two indicated groups by Students t test, by #. In all panels, values represent mean ± SEM of triplicates corresponding to biological replicates; * or # p<0.05; ** p<0.01; *** p<0.001. Raw data are available in Figure 1—source data 1.
-
Figure 1—source data 1
Presents results summarized in Figure 1 (triplicates).
- https://cdn.elifesciences.org/articles/86913/elife-86913-fig1-data1-v1.zip
Figure 2
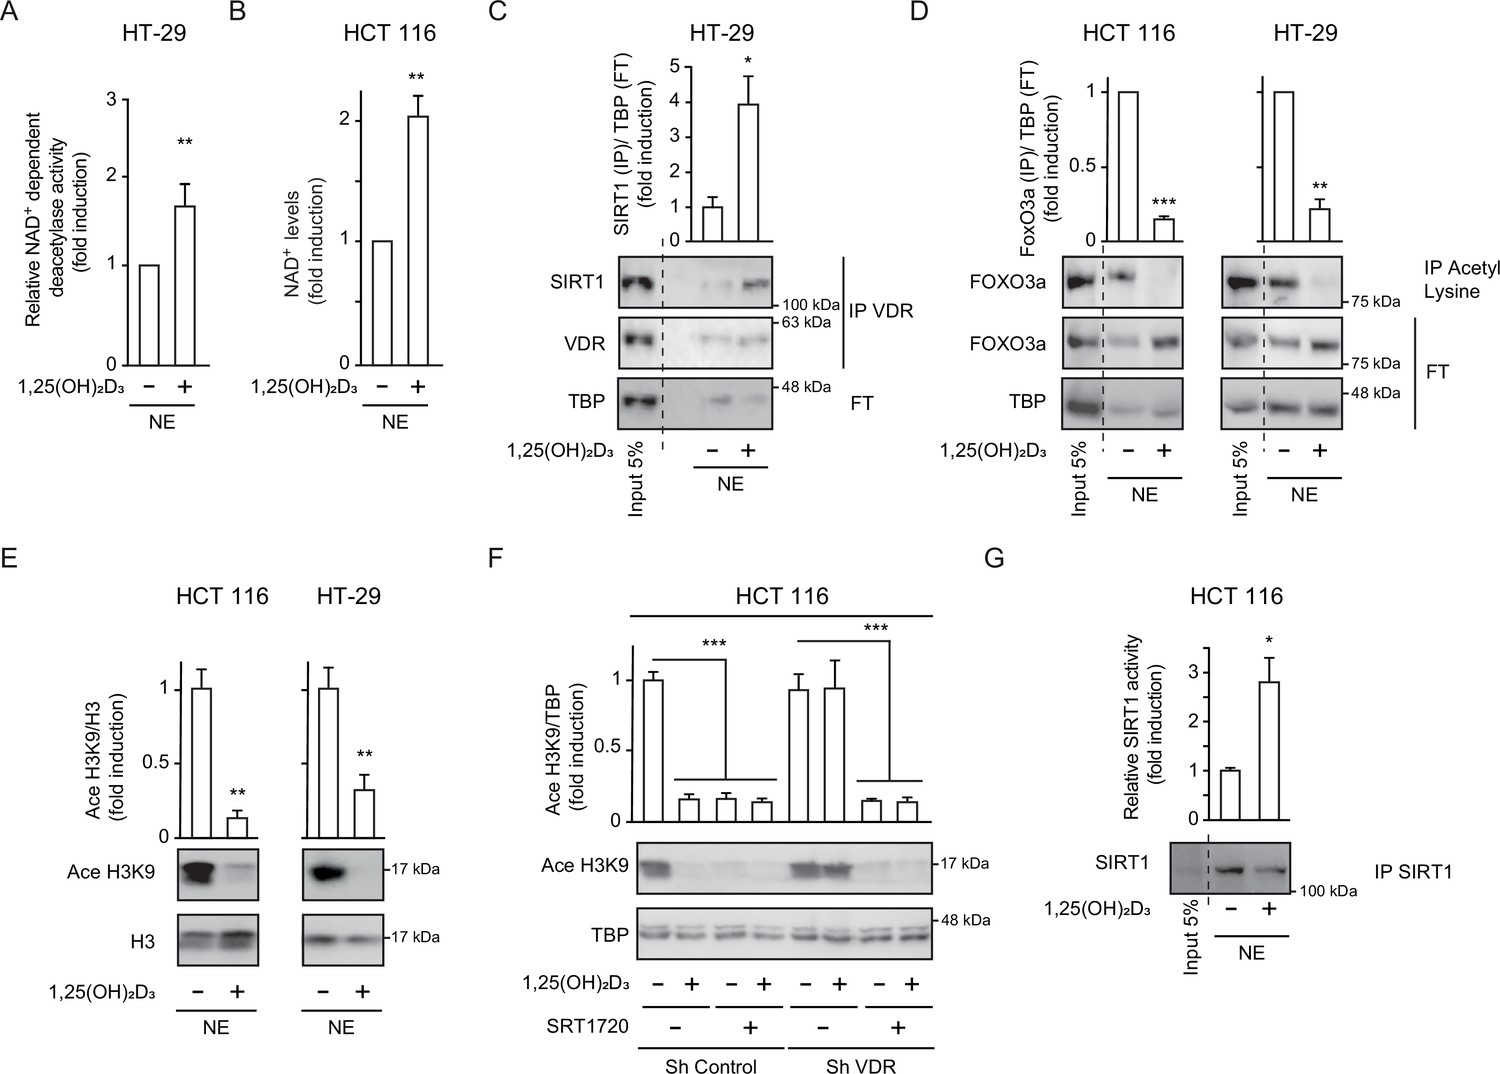
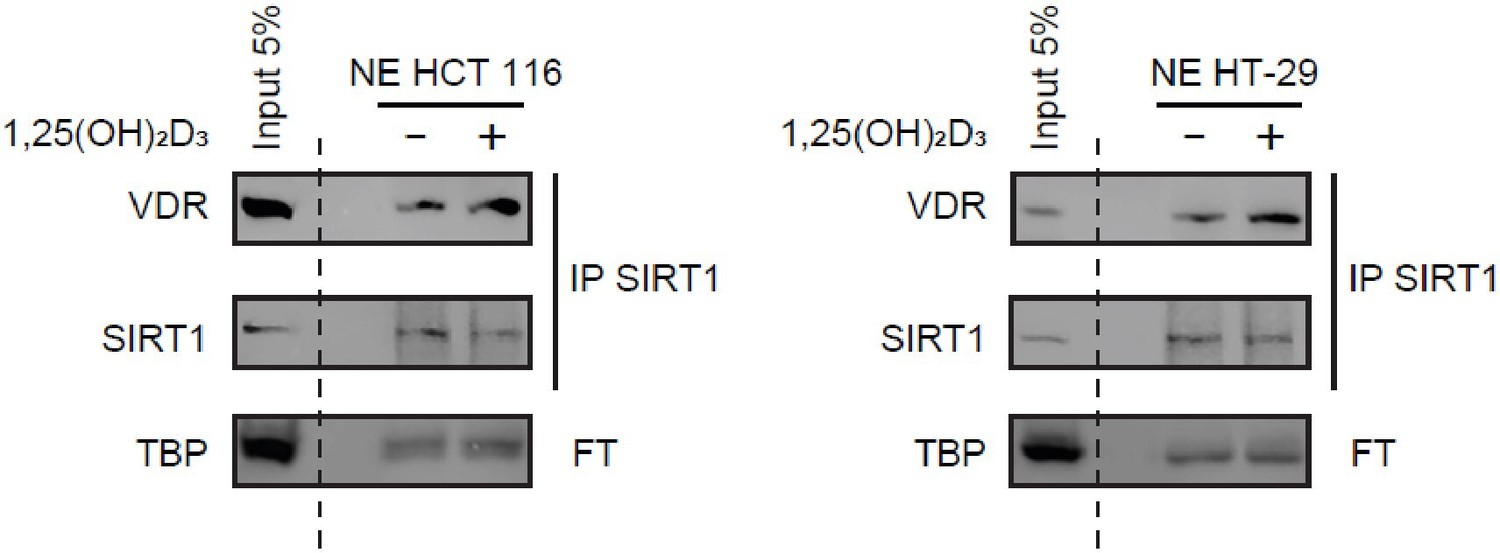
1,25(OH)2D3 induces specific SIRT1 deacetylase activity independently of levels, in CRC cells.
Cells were cultured as in Figure 1. (A) and (G) NAD+-dependent deacetylase activity, (B) Evaluation of nuclear NAD+ levels. (C) to (F) Western blot analysis using TBP or H3 as loading controls. Representative western blots and statistical analysis of 3 independent experiments. (A) NAD+-dependent deacetylase activity measured on nuclear extracts of HT-29 cells. Relative luciferase units (RLU) were calculated as fold induction relative to the corresponding control. (B) Evaluation of nuclear NAD+ levels in HT-29 CRC cells in response to 1,25(OH)2D3, with data expressed as fold induction over the control, untreated cells. (C) 1,25(OH)2D3 effects on the interaction between vitamin D receptor (VDR) and SIRT1. Input (5%) and flow through (FT) are shown (D) 1,25(OH)2D3 effects on the acetylation status of the SIRT1 substrate FoxO3a in nuclear extracts immunoprecipitated with anti-acetyl lysine antibodies. Input (5%) and flow through (FT) are shown. (E) 1,25(OH)2D3 effects on the nuclear acetylation of the SIRT1 substrate H3K9 (Ace H3K9). (F) Requirement of VDR for deacetylation of Ace H3K9 in response to 1,25(OH)2D3 (G) Quantification of NAD+-dependent deacetylase activity on SIRT1 immunoprecipitates from nuclear extracts (NE) of HCT 116 CRC cells treated or not with 1,25(OH)2D3. Values represent mean ± SEM of n=3 independent experiments. Statistical analysis by Student t test, n≥3 biological replicates and values represent mean ± SEM; *p<0.05; **p<0.01; *** p<0.001. Raw data are available in Figure 2—source data 1.
-
Figure 2—source data 1
Contains all original data summarized in this figure.
- https://cdn.elifesciences.org/articles/86913/elife-86913-fig2-data1-v1.zip
Figure 3
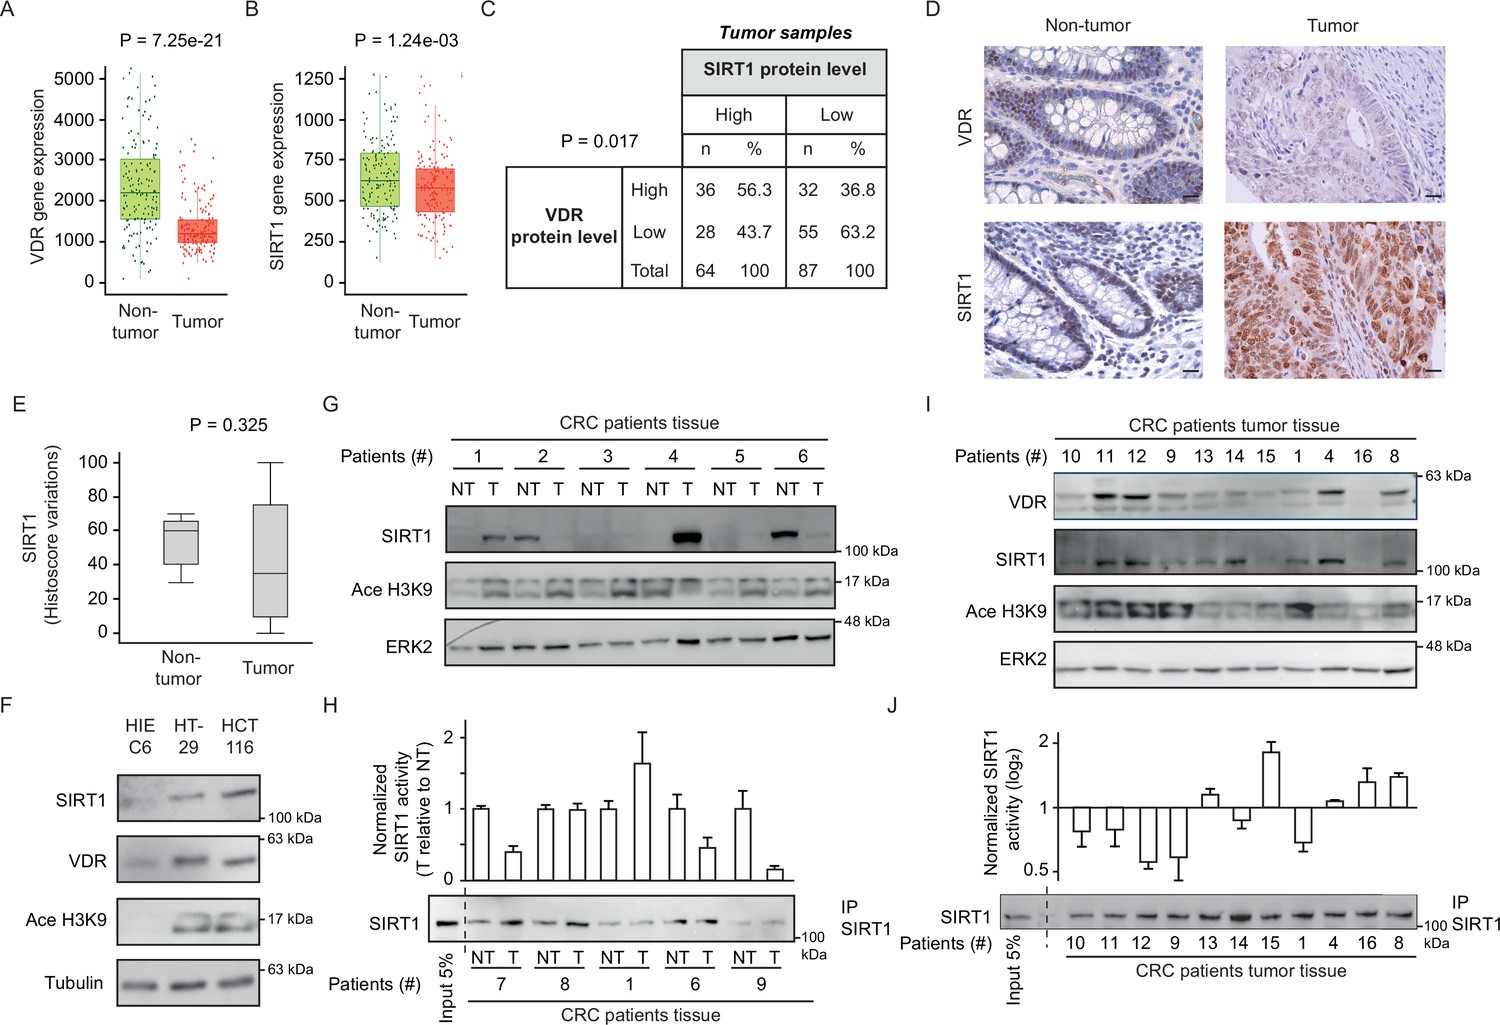
CRC biopsies exhibit discrepancies between SIRT1 protein levels and deacetylase activity.
(A)-(B) TNM plot analysis of VDR (A) or SIRT1 (B) gene expression in 160 paired samples of non-cancer adjacent tissue (normal) versus adenocarcinoma tissue (tumour). Data was collected from TCGA-COAD database. SIRT1 or VDR expression is shown as transcripts per million (TPM) in log2. Tumour and control samples were compared with Mann-Whitney U test. The statistical significance cut off was set at p<0.01. (C) Association analysis between VDR and SIRT1 protein levels in human colon cancer samples, stage 2 and 4. Cut-off points to separate proteins between high- or low- expression levels were for SIRT1 expression median of Histoscore, and negative versus positive staining for VDR expression. Statistical analysis was performed with Chi-square test. (D) Representative micrographs at ×40 from immunostaining for vitamin D receptor (VDR) or SIRT1 on human samples of healthy colon or CRC patients. Scale bars: 20 µm. Immunostainings were revealed with DAB (diaminebenzidine) and thus, positiveness is highlighted by light or dark brown according to their low or high protein expression. Counterstaining with hematoxilin stains nuclei in dark blue and cytoplasm in light blue. (E) Profile for SIRT1 content from healthy to colon cancer human samples. The profile was obtained from Histoscore variations. Tumour and control samples were compared with Mann-Whitney U test. The statistical significance cut off was set at p<0.01. (F) Western-blot analysis of the levels of SIRT1 and its substrate Ace H3K9 in total lysates from intestinal healthy (HIEC6) or CRC cells. Representative western blot with ERK as loading control. (G) Western-blot analysis from human patient samples, with patient number indicated at the top. CRC samples (T) and adjacent nontumor tissue (NT) were probed for SIRT1 and its substrate Ace H3K9 (as in F). Frozen samples were obtained from HUFA patients. (H) NAD+-dependent deacetylase activity on immunoprecipitated SIRT1 from patient lysates. Values for T and NT samples were corrected according to immunoprecipitated SIRT1 levels shown on the western underneath the graph. Values for T samples were referred to values of NT and data (duplicates) are expressed as fold induction. Patient number is indicated at the bottom. (I) Western-blot analysis for SIRT1 and its substrate Ace H3K9 levels in total lysates from alternative human CRC samples (as in G). Patient number is indicated at the top. (J) NAD+-dependent deacetylase activity on immunoprecipitated SIRT1 from patient lysates presented in (I). Levels of immunoprecipitated SIRT1 are presented in the bottom panel. SIRT1 deacetylase activity in patients is presented as fold induction, referred to the first patient sample (patient #10). Patient number is indicated at the bottom. Raw data are available in Figure 3—source data 1.
-
Figure 3—source data 1
Contains all original data summarized in this figure.
- https://cdn.elifesciences.org/articles/86913/elife-86913-fig3-data1-v1.zip
Figure 4
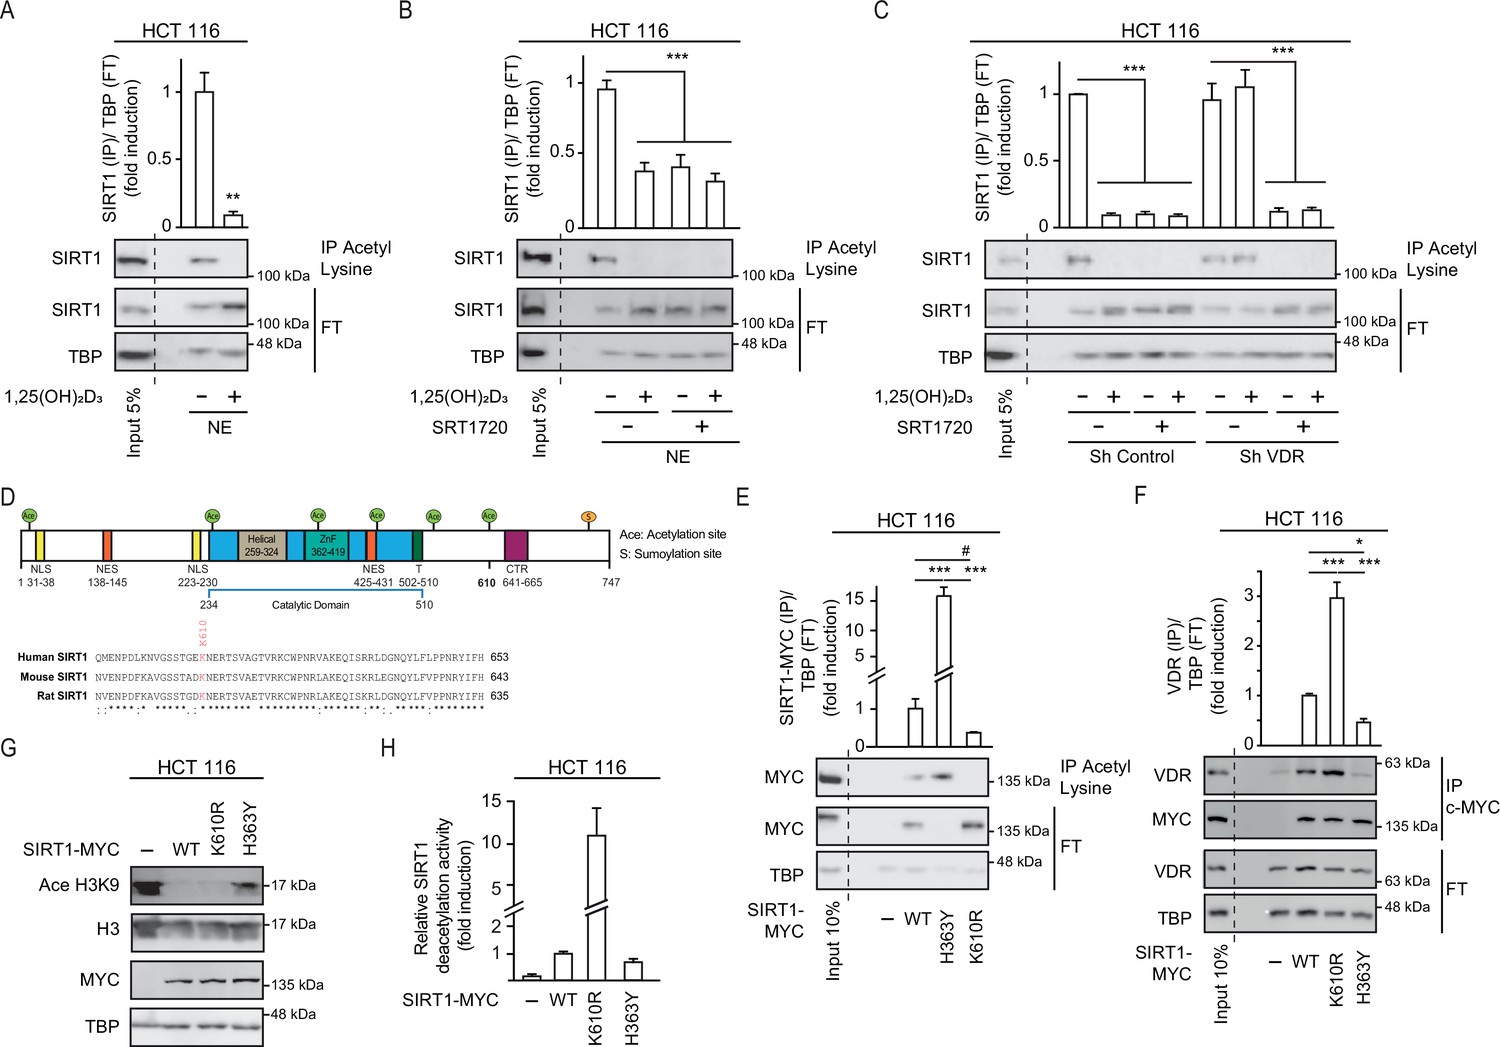
1,25(OH)2D3 induces SIRT1 activity through auto deacetylation.
HCT 116 CRC cells were cultured under standard conditions in DMEM containing LiCl (40 mM) to mimic Wnt signalling before addition of 1,25(OH)2D3, 100 nM or SRT1720 (20 μM) for the last 24 hr; after fractionation nuclear extracts (NE) were used. (A)-(C) and (E)-(F) Immunoprecipitation (IP) using anti-acetyl lysine antibody from nuclear extracts (NE) of indicated cells and western-blot analysis to evaluate changes in acetylation of SIRT1; TBP was used in the Flow Through (FT) as loading control. Representative western-blots and statistical analysis are shown in all panels. (A) Effect of 1,25(OH)2D3 on acetylation of SIRT1. (B) Effect of SRT1720 on acetylation of SIRT1. (C) Requirement of VDR for 1,25(OH)2D3 or SRT1720 effects on acetylation of SIRT1 in Sh Control and ShVDR HCT 116 cells. (D) SIRT1 scheme with functional domains and putative acetylation sites (top) and sequence alignment. Conserved putative acetylation targets for activation/inactivation of SIRT1 shown at the bottom. (E) Acetylation status of exogenous SIRT1 wild type (WT) or mutants (H363Y or K610R). HCT 116 were transiently transfected with pcDNA expression vectors: empty (-), myc-tagged SIRT1 wild type (WT) or mutants: H363Y inactive or K610R, 48 hr before harvesting. Immunoprecipitation using anti-acetyl-lysine antibodies and western blot detection using myc antibodies. Representative western-blot and statistical analysis; MYC and TBP in the flow through (FT) serve as loading controls. (F) Western-blot analysis of the interaction of SIRT1 wild type and mutants, with vitamin D receptor (VDR). Expression and analysis as in (E). (G) Western-blot analysis of the effect of SIRT1 mutant expression on Ace H3K9. (H) In vitro NAD+-dependent deacetylase activity assays on equivalent amounts of exogenous SIRT1 wild type (WT), K610R and inactive H363Y mutants immunoprecipitated using anti-myc antibodies. Statistical analysis in all panels except (D) and (G) by One Way ANOVA of n>3 independent experiments. Values represent mean ± SEM; *p<0.05; **p<0.01; *** p<0.001. Raw data are available in Figure 4—source data 1.
-
Figure 4—source data 1
Contains all original data summarized in this figure.
- https://cdn.elifesciences.org/articles/86913/elife-86913-fig4-data1-v1.zip
Figure 5

SIRT1 activation rescues antiproliferative effects of 1,25(OH)2D3in unresponsive CRC cells.
Cells were cultured as in previous figures and treatments with NAA (300 uM), SRT1720 (20 μM) and 1,25 (OH)2D3 (100 nM) also were for the last 24 hr. (A) Flow cytometry analysis of cell cycle from indicated cells treated (+) or not (-) with 1,25(OH)2D3. Numbers correspond to the percentage of cells in the indicated phases expressed as mean ± SEM. (B) Effect of NAA on the 1,25(OH)2D3-driven blockades of HCT 116 CRC cell proliferation. (C) Effects of SRT1720 on cell cycle of HCT 116 CRC cells by flow cytometry analysis. Numbers correspond to the percentage of cells in the indicated phases expressed as mean ± SEM. (D) Flow cytometry analysis of cell cycle response to 1,25 (OH)2D3 in ShControl and ShVDR HCT 116 cells. Numbers correspond to the percentage of cells in the indicated phases expressed as mean ± SEM. (E) Proliferation curves of ShControl or ShVDR HCT 116 colon cancer cells in response to 1,25 (OH)2D3 (100 nM) (grey), compared to control with vehicle (green) or SRT1720 (red). Statistical analysis by One-Way ANOVA of three independent experiments; values represent mean ± SEM of triplicates; * p<0.05; ** p<0.01; *** p<0.001.
Author response image 1

Vitamin D requires the presence of VDR to increase SIRT1 protein levels.
SW480 and SW620 cell lines derive from the same patient, from primary tumor and lung metastasis respectively and differ in their VDR content. 1α,25-dihydroxyvitamin D3 (1,25(OH)2D3) was added at 100 nM for 24 h. Representative western-blot, where TBP was used as a loading control, of four biological replicates. Statistical analysis by ANOVA and values represent mean ± SEM; *p<0.05; *** p<0.001.
Author response image 2
Immunoprecipitation of endogenous SIRT1 to show interaction with VDR.
1α,25-dihydroxyvitamin D3 (1,25(OH)2D3) was added at 100 nM for 24 h. Representative western-blots, where TBP was used as a loading control.
Author response image 3

Immunoprecipitation of exogenous myc-tagged SIRT1 to show interaction with VDR of wild type (WT) or mutants.
1α,25-dihydroxyvitamin D3 (1,25(OH)2D3) was added at 100 nM for 24 h. FT: Flow Through. TBP as a loading control.
Tables
Key resources table
| Reagent type (species) or resource | Designation | Source or reference | Identifiers | Additional information |
|---|---|---|---|---|
| Strain, (Escherichia coli) | E. coli 5α | New England Biolabs | NEB5α | |
| Cell line (Homo-sapiens) | HCT 116 | ATCC | Cat# CCL-247, RRID:CVCL_0291 | Male. Colorectal adenocarcinoma |
| Cell line (Homo-sapiens) | HT-29 | ATCC | Cat# HTΒ−38, RRID:CVCL_0320 | Female. Rectosigmoid adenocarcinoma |
| Cell line (Homo-sapiens) | HIEC6 | ATCC | Cat# CRL-3266 RRID:CVCL_6C21 | Epithelial. Intestinal. |
| Cell line (Homo-sapiens) | HCT 116 ShControl | In house; Larriba et al., 2011 | Male. Colorectal adenocarcinoma | |
| Cell line (Homo-sapiens) | HCT 116 ShVDR | In house; Larriba et al., 2011 | Male. Colorectal adenocarcinoma | |
| Antibody | anti-Acetylated-lysine Rabbit Polyclonal | Cell Signaling | Cat# 9441 | 1:1000 |
| Antibody | anti-Histone H3K9-Ace. Rabbit monoclonal | Cell Signaling | (C5B11) Cat # 9649 | 1:1000 |
| Antibody | anti-Histone H3 Rabbit Polyclonal | Cell Signaling | Cat # 9715 | 1:1000 |
| Antibody | anti-Vitamin D3 receptor (D2K6W) Rabbit Polyclonal | Cell Signaling | Cat #12550 | 1:1000 |
| Antibody | anti-FoxO3a (75D8) Rabbit Polyclonal | Cell Signaling | Cat# 2497 | 1:1000 |
| Antibody | anti-SIRT1 (D1D7) Rabbit Polyclonal | Cell Signaling | Cat# 9475 | 1:1000 |
| Antibody | anti-SIRT1. Rabbit Polyclonal | Santa Cruz Biotechnology | Cat#SC-15404 | 1:1000 |
| Antibody | anti-TFIID-TBP (N12). Rabbit Polyclonal | Santa Cruz Biotechnology | Cat# SC-204 | 1:1000 |
| Antibody | anti-SIRT7. Rabbit Polyclonal | Santa Cruz Biotechnology | Cat#SC365344 | 1:1000 |
| Antibody | anti-ERK (C14). Rabbit Polyclonal | Santa Cruz Biotechnology | Cat# SC-154 | 1:1000 |
| Antibody | anti-MYC (9E10). Mouse monoclonal | Santa Cruz Biotechnology | Cat# SC-40 | 1:1000 |
| Antibody | Anti-Rabbit- AlexaFluor488. Donkey Polyclonal. | Invitrogen | Cat# A21206 | 1:500 |
| Antibody | anti-TBP (51841). Mouse monoclonal | Invitrogen | Cat# MA514739 | 1:1000 |
| Antibody | Anti-Rabbit IgG (H+L) HRPO. Goat Polyclonal | BIO-RAD | Cat #170–6515 | 1:5000 |
| Antibody | Anti-Mouse IgG (H+L) HRPO. Goat Polyclonal | BIO-RAD | Cat #170–6516 | 1:5000 |
| Antibody | anti-Tubulin Clone B-5-1-2. Mouse monoclonal | Sigma-Aldrich | Cat# T5168 | 1:5000 |
| Recombinant DNA reagent | pcDNA3.1-SIRT1-Myc-His (plasmid) | Gift from Prof. Colin Goding. Oxford. UK | N/A | human |
| Recombinant DNA reagent | pcDNA3.1-SIRT1H363Y- Myc-His | Gift from Prof. Colin Goding. Oxford. UK | N/A | human |
| Recombinant DNA reagent | pcDNA3.1-SIRT1 K601R- Myc-His | This study | N/A | human |
| Sequence-based reagent | Human SIRT1 (F 5′–3′) | Sigma | K610R mutagenesis primers | GGTTCTAGTACTGGGGAGAGGAATGAAAGAACTTCAGTGG |
| Sequence-based reagent | Human SIRT1 (R 5′–3′) | Sigma | K610R mutagenesis primers | CCAGCCACTGAAGTTCTTTCATTCCTCTCCCCAGTACTAG |
| Sequence-based reagent | Human CYCLIN D1 (CCND1). F 5′–3′: | Sigma | qPCR primers | AAGATCGTCGCCACCTGG |
| Sequence-based reagent | Human CYCLIN D1 (CCND1). R 5′–3′: | Sigma | qPCR primers | GGAAGACCTCCTCCTCGCAC |
| Sequence-based reagent | Human c-MYC F 5′–3′: | Sigma | qPCR primers | CTTCTCTCCGTCCTCGGATTCT |
| Sequence-based reagent | Human c-MYC R 5′–3′: | Sigma | qPCR primers | GAAGGTGATCCAGACTCTGACCTT |
| Sequence-based reagent | Human 18 s | Sigma | qPCR primers | AGTCCCTGCCCTTTGTACACA |
| Sequence-based reagent | Human 18 s | Sigma | qPCR primers | GCCTCACTAAACCATCCAATCG |
| Sequence-based reagent | CYP24A1 | Applied Biosystems | TaqMan probe | Hs00167999_m1 |
| Commercial assay or kit | EnVision +Dual Link System-HRP (DAB+) | Dako (Agilent) | Cat#K4065 | |
| Commercial assay or kit | SIRT-Glo Assay kit | Promega | G6450 | |
| Commercial assay or kit | NAD/NADH-Glo Assay Kit | Promega | G9071 | |
| Commercial assay or kit | QuickChange Site-Directed Mutagenesis Kit | Stratagene | Cat #200523 | |
| Peptide, recombinant protein | DYNAbeads Protein A | Invitrogen | Ref 10002D | |
| Peptide, recombinant protein | DYNAbeads Protein G | Invitrogen | Ref 10004D | |
| Chemical compound, drug | JetPEI PolyPlus reagent | Genycell Biotech | Cat# 101–10 N | |
| Chemical compound, drug | JetPRIME PolyPlus reagent | Genycell Biotech | Cat # 114–01 | |
| Chemical compound, drug | DMEM media | Lonza | Cat# 12–604 F | |
| Chemical compound, drug | Bovine Fetal Serum | Sigma | Cat# F7524 | |
| Chemical compound, drug | 7-AAD | Santa Cruz Biotechnology | SC-221210 | |
| Chemical compound, drug | 3-(4,5-dimetiltiazol-2-il)–2,5-difeniltetrazol (MTT) | Sigma-Aldrich | Cat# M5655 | |
| Chemical compound, drug | BSA | Sigma-Aldrich | A7906 | |
| Chemical compound, drug | Nicotinamide (NAA) | Sigma-Aldrich | N3376 | |
| Chemical compound, drug | SRT1720 | Selleckchem | S1129 | |
| Chemical compound, drug | TRIzol reagent | Invitrogen | Cat#15596026 | |
| Chemical compound, drug | Protease inhibitor Cocktail | Roche | Cat#04693132001 | |
| Chemical compound, drug | 1α,25-DihydroxyVD3 | Sigma-Aldrich | 17936 | |
| Chemical compound, drug | Lithium Chloride | Sigma-Aldrich | Cat# L9650 | |
| Software, algorithm | LAS AF software | Leica | SP5 | |
| Software, algorithm | 3730xl Analyzer | Applied Biosystem | ABI 3730XL | |
| Software, algorithm | GraphPad Prism software | GraphPad Software | https://www.graphpad.com | |
| Software, algorithm | ImageLab | Bio-Rad | ChemiDoc XRS +System | |
| Software, algorithm | CXP software | Becton-Dickinson | FACSCalibur | |
| Software, algorithm | ImageJ software | https://imagej.nih.gov/ij/download.html | N/A | |
| Software, algorithm | SPSS Statistics version 26 | IBM | N/A |
Table 1
Clinicopathological characteristics of CRC included in the study.
| a. Patients from HCSC | |||
|---|---|---|---|
| Patients Characteristic | N (%) | ||
| Stage II | Stage IV | ||
| Gender | |||
| Male | 57 (60%) | 27 (48%) | |
| Female | 38 (40%) | 23 (41%) | |
| N/A | 0 | 6 (11%) | |
| Tumor Location | |||
| Cecum | 13 (14%) | 3 (5%) | |
| Right | 25 (26%) | 10 (18%) | |
| Transverse | 7 (8%) | 3 (5%) | |
| Left | 5 (5%) | 2 (4%) | |
| Sigma | 24 (25%) | 21 (38%) | |
| Rectum | 21 (21%) | 12 (21%) | |
| N/A | 0 | 5 (9%) | |
| Grade Primary Tumor | |||
| Well differentiated | 18 (19%) | 15 (27%) | |
| Moderately differentiated | 69 (73%) | 27 (48%) | |
| Poorly differentiated | 8 (8%) | 5 (9%) | |
| N/A | 0 | 9 (16%) | |
| Paired Liver Metastasis | 54 (96%) | ||
| N/A | 2 (4%) | ||
| Grade Metastasis Tumor | |||
| Well differentiated | 12 (21%) | ||
| Moderately differentiated | 29 (52%) | ||
| Poorly differentiated | 4 (7%) | ||
| N/A | 11 (20%) | ||
| Metastasis at diagnosis | |||
| Synchronous | 35 (62%) | ||
| Metachronous | 21 (38%) | ||
| Pt | |||
| T1 | 3 (3%) | 2 (4%) | |
| T2 | 30 (32%) | 5 (9%) | |
| T3 | 61 (64%) | 42 (75%) | |
| T4 | 1 (1%) | 4 (7%) | |
| N/A | 3 (5%) | ||
| pN | |||
| N0 | 95 (100%) | 27 (48%) | |
| N1 | 16 (29%) | ||
| N2 | 9 (16%) | ||
| N3 | 1 (2%) | ||
| N/A | 3 (5%) | ||
| b. Patients from HUFA | |||
| Patients Characteristic | N (%) | ||
| Stage I | Stage II | Stage III | |
| Gender | |||
| Male | 5 (31%) | 1 (6 %) | 6 (38%) |
| Female | 0 | 3 (19%) | 1 (6 %) |
| N/A | 0 | 0 | 0 |
| Tumor Location | |||
| Cecum | 0 | 0 | 0 |
| Right | 2 (40%) | 1 (25%) | 2 (29%) |
| Transverse | 0 | 0 | |
| Left | 1 (20%) | 1 (25%) | |
| Sigma | 2 (40%) | 2 (50%) | 3 (43%) |
| Rectum | 0 | 0 | 2 (29%) |
| N/A | 0 | 0 | |
| Grade Primary Tumor | |||
| Well differentiated | 2 (40%) | 1 (25%) | 1 (14%) |
| Moderately differentiated | 3 (60%) | 5 (50%) | 4 (57%) |
| Poorly differentiated | 0 | 1 (25%) | 1 (14%) |
| Mucinous | 0 | 0 | 1 (14%) |
| N/A | 0 | 0 | 0 |
| pT | |||
| T1 | 1 (20%) | 0 | 1 (14%) |
| T2 | 1 (20%) | 0 | 0 |
| T3 | 3 (60%) | 3 (75%) | 3 (43%) |
| T4 | 0 | 1 (25%) | 3 (43%) |
| N/A | 0 | 0 | 0 |
| pN | |||
| N0 | 5 (100%) | 4 (100%) | 0 |
| N1 | 0 | 0 | 6 (86%) |
| N2 | 0 | 0 | 1 (14%) |
| N3 | 0 | 0 | 0 |
| N/A | 0 | 0 | 0 |
Additional files
Download links
A two-part list of links to download the article, or parts of the article, in various formats.
Downloads (link to download the article as PDF)
Open citations (links to open the citations from this article in various online reference manager services)
Cite this article (links to download the citations from this article in formats compatible with various reference manager tools)
Vitamin D induces SIRT1 activation through K610 deacetylation in colon cancer
eLife 12:RP86913.
https://doi.org/10.7554/eLife.86913.3


