Loss of Ptpmt1 limits mitochondrial utilization of carbohydrates and leads to muscle atrophy and heart failure in tissue-specific knockout mice
- Department of Pediatrics, Children Healthcare of Atlanta, Emory University School of Medicine, United States
- Department of Medicine, Case Western Reserve University, United States
- College of Nursing & Health Innovation, University of Texas-Arlington, United States
- Department of Medicine, Emory University School of Medicine, United States
- Case Cardiovascular Research Institute, Department of Medicine, Case Western Reserve University, United States
- Case Mouse Metabolic Phenotyping Center, Case Western Reserve University, United States
- Department of Biochemistry and Molecular Genetics, University of Alabama at Birmingham, United States
Figures
Figure 1 with 2 supplements
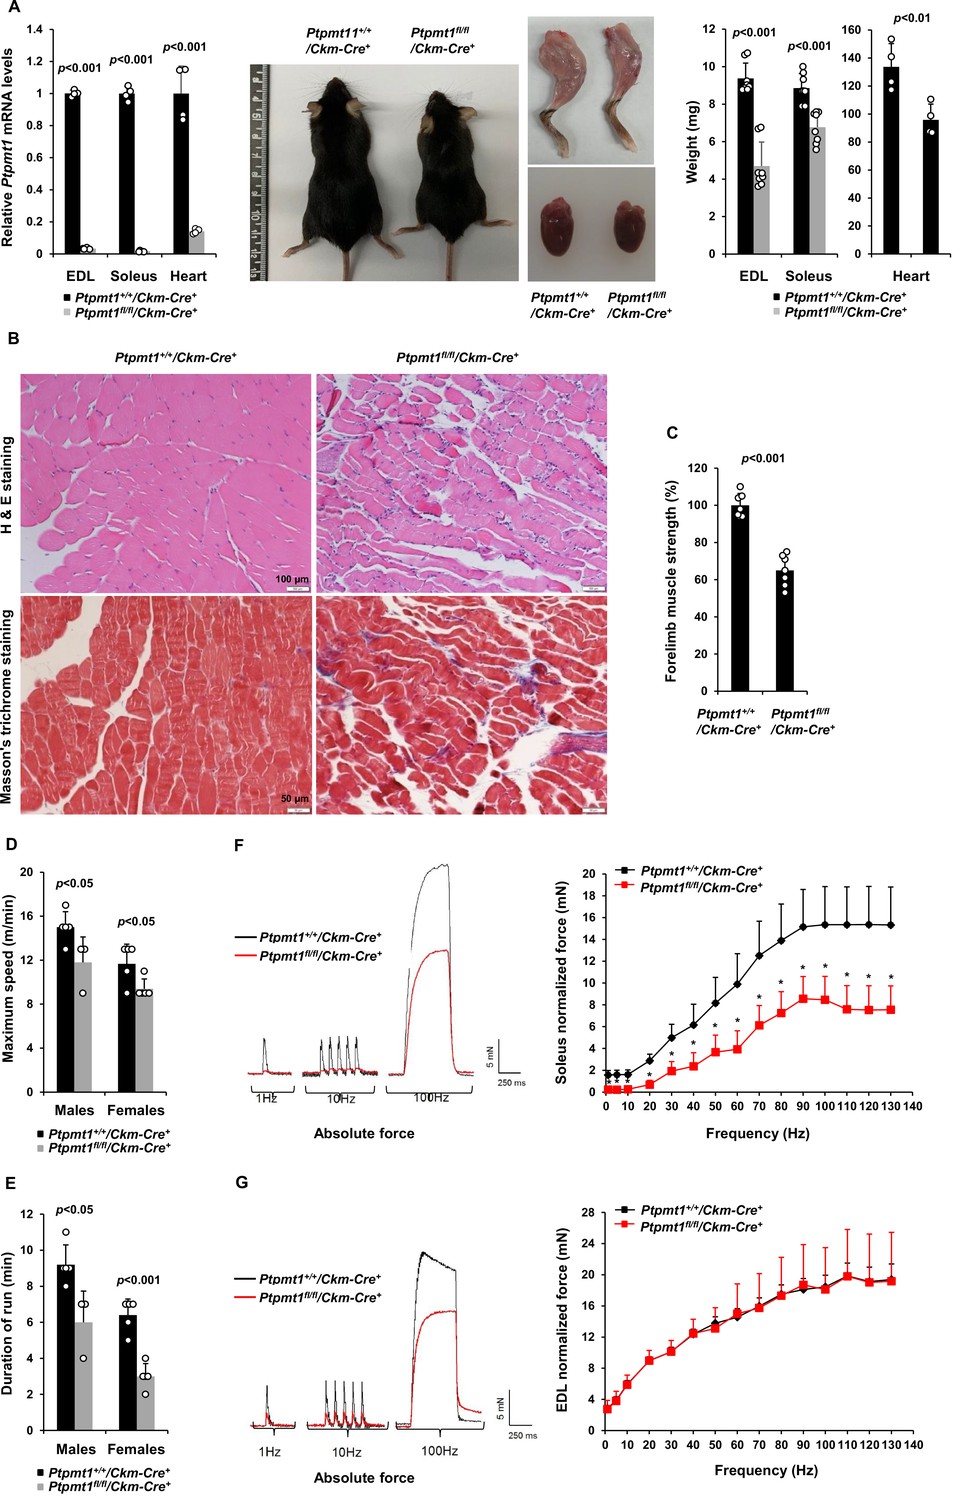
Deletion of Ptpmt1 from skeletal muscles results in defective contractility and progressive muscle atrophy.
(A) Representative 8-month-old of Ptpmt1fl/fl/Ckm-Cre+ and Ptpmt1+/+/Ckm-Cre+ mice, and hind limbs and hearts dissected from these mice were photographed. Extensor Digitorum Longus (EDL) and Soleus (n = 8 mice/genotype), and heart (n = 4 mice/genotype) weights were measured. Ptpmt1 mRNA levels in EDL, Soleus, and heart tissues were determined by quantitative reverse transcription PCR (qRT-PCR) (n = 4 mice/genotype). (B) Skeletal muscle sections prepared from 8-month-old Ptpmt1+/+/Ckm-Cre+ and Ptpmt1fl/fl/Ckm-Cre+ mice were processed for Hematoxylin and Eosin (H&E) staining and Masson’s Trichrome staining. One representative image from 3 mice/genotype is shown. (C) Six-month-old Ptpmt1+/+/Ckm-Cre+ and Ptpmt1fl/fl/Ckm-Cre+ mice (n = 7/genotype) were subjected to wire hang tests. Relative forelimb muscle strength was determined. (D, E) Seven- to eight-month-old Ptpmt1+/+/Ckm-Cre+ (n = 5 males and 5 females) and Ptpmt1fl/fl/Ckm-Cre+ (n = 3 males and 5 females) mice were assessed by treadmill exercise tests as described in Materials and methods. Maximum speed (D) and duration of the run (E) were recorded. Soleus (F) and EDL (G) dissected from 7- to 8-month-old Ptpmt1+/+/Ckm-Cre+ and Ptpmt1fl/fl/Ckm-Cre+ mice (n = 3 mice, 6 muscles/genotype) were subjected to ex vivo isometric force measurements. Specific contractile forces produced at the indicated frequencies of stimulation were normalized to the physiological cross-sectional area. Shown on the left are representative absolute forces produced at 1, 10, and 100 Hz. *p <0.05.
Figure 1—figure supplement 1
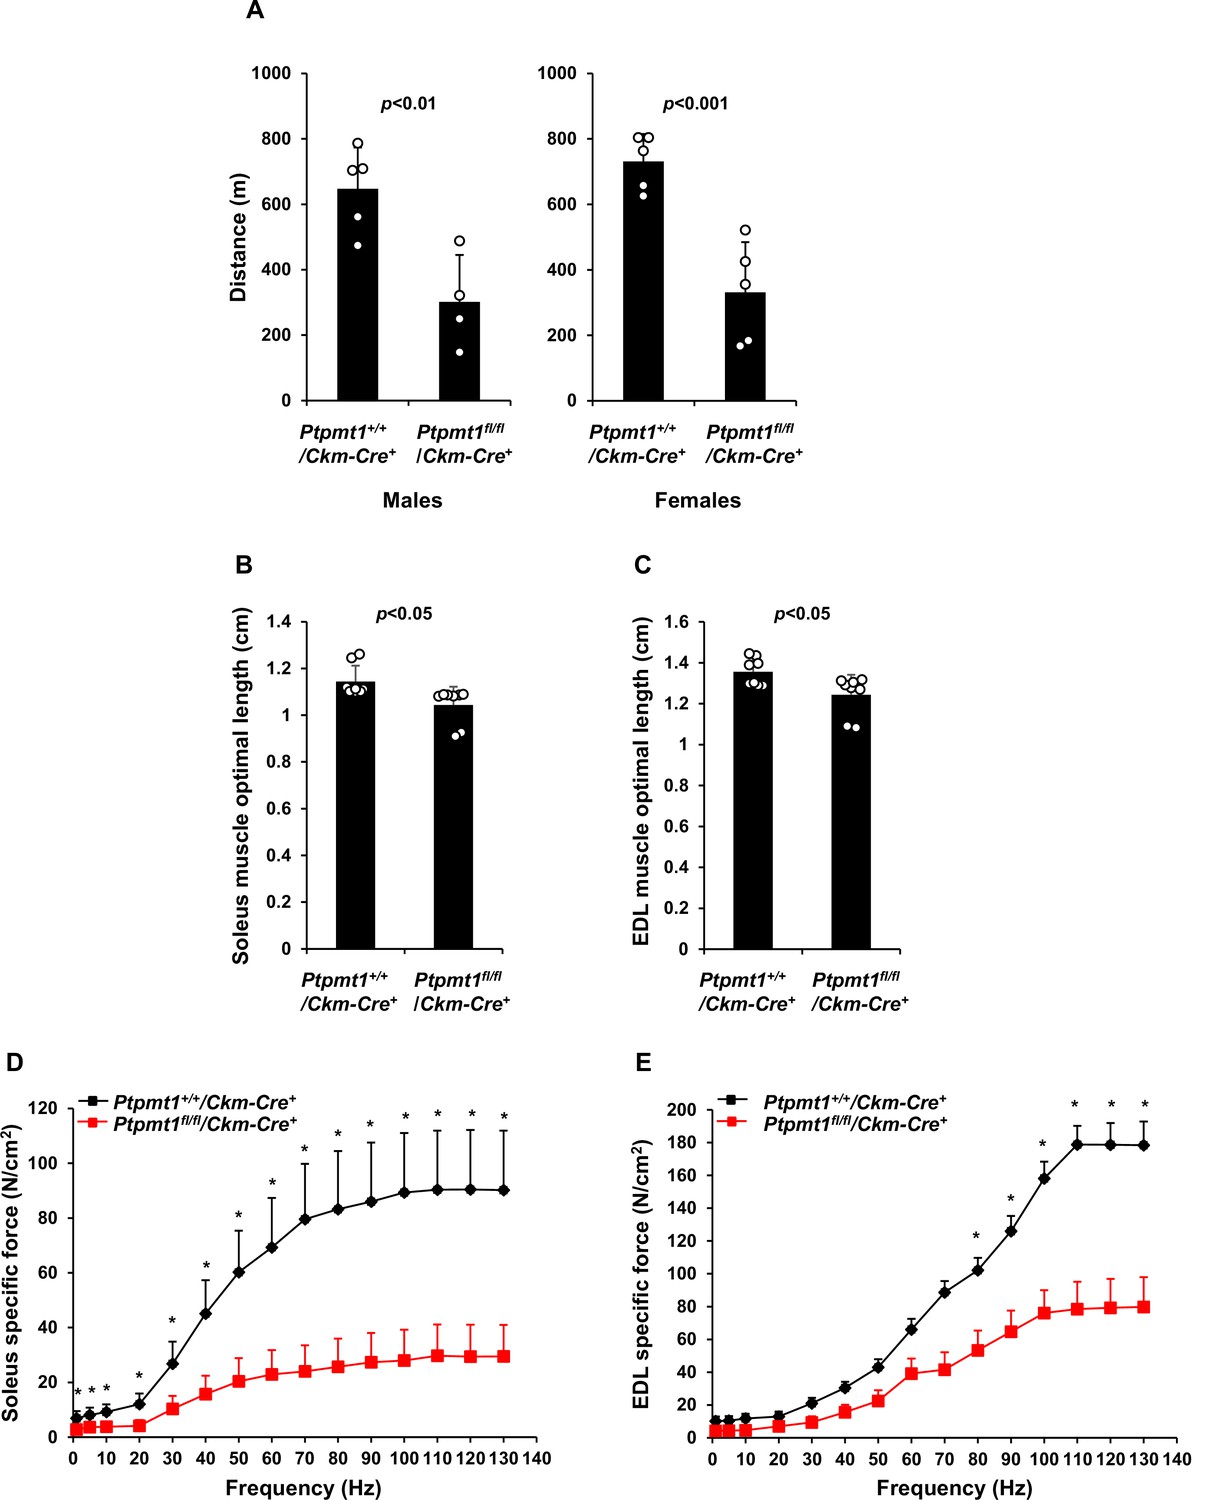
Specific force production is decreased in Soleus and Extensor Digitorum Longus (EDL) isolated from Ptpmt1fl/fl/Ckm-Cre+ mice.
(A) Seven- to eight-month-old Ptpmt1+/+/Ckm-Cre+ (n = 5 males and 5 females) and Ptpmt1fl/fl/Ckm-Cre+ (n = 4 males and 5 females) mice were assessed by treadmill exercise tests as described in Materials and methods. The distance of the run was recorded. Soleus (B) and EDL (C) dissected from 7- to 8-month-old Ptpmt1fl/fl/Ckm-Cre+ and Ptpmt1+/+/Ckm-Cre+ mice (n = 4, 8 muscles/genotype) were subjected to length–force relationship tests to determine optimal lengths at which maximal forces were achieved. Soleus (D) and EDL (E) dissected from 7- to 8-month-old Ptpmt1fl/fl/Ckm-Cre+ and Ptpmt1+/+/Ckm-Cre+ mice (n = 3, 6 muscles/genotype) were examined by ex vivo isometric force measurements. Absolute contractile forces (specific forces) produced at the indicated frequencies of stimulation were documented. *p < 0.05.
Figure 1—figure supplement 2
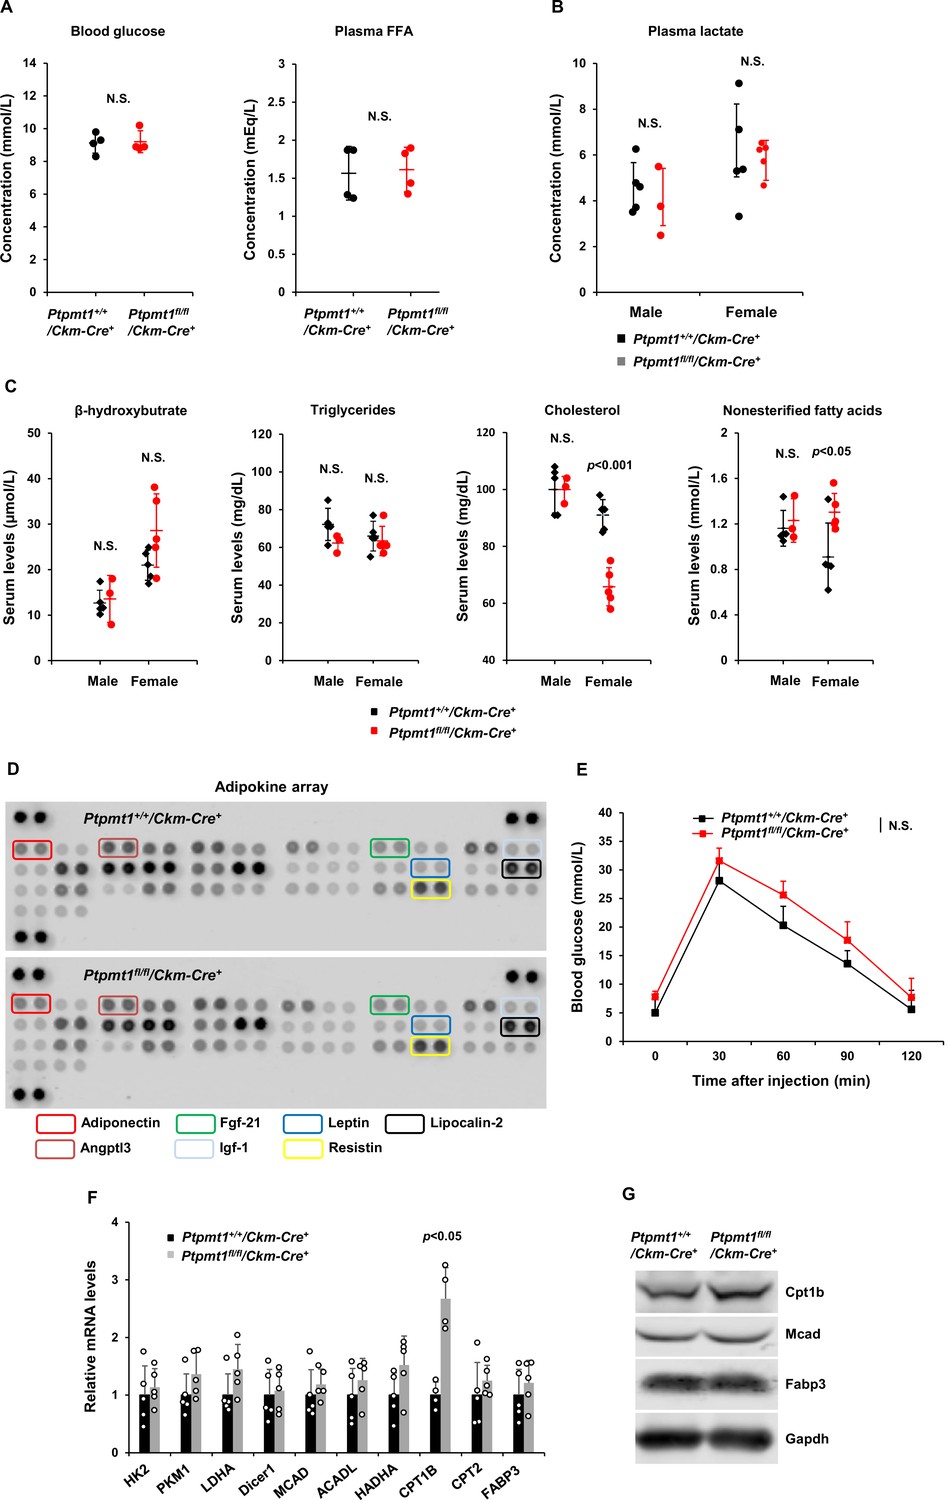
Plasma levels of glucose and lipids are comparable in Ptpmt1fl/fl/Ckm-Cre+ mice and Ptpmt1+/+/Ckm-Cre+ littermates.
(A) Blood glucose and free fatty acid (FFA) levels were measured in 6- to 7-month-old male Ptpmt1fl/fl/Ckm-Cre+ and Ptpmt1+/+/Ckm-Cre+ mice (n = 4/genotype). (B) Plasma lactate levels were measured in 6- to 7-month-old Ptpmt1fl/fl/Ckm-Cre+ and Ptpmt1+/+/Ckm-Cre+ mice (n = 3–5/genotype). (C) Serum levels of cholesterol, triglycerides, beta hydroxybutrate, and nonesterified fatty acids in 6- to 7-month-old Ptpmt1fl/fl/Ckm-Cre+ and Ptpmt1+/+/Ckm-Cre+ mice (n = 5/genotype) were determined. (D) Five- to seven-month-old Ptpmt1fl/fl/Ckm-Cre+ and Ptpmt1+/+/Ckm-Cre+ mice (n = 4/genotype) were fasted overnight. Blood samples were collected and 100 µl serum from each mouse was used for the adipokine array assay to determine the relative levels of 38 mouse adipokines with a kit (R&D Systems) following the manufacturer’s instructions. Representative images are shown. (E) Six- to seven-month-old male Ptpmt1fl/fl/Ckm-Cre+ and Ptpmt1+/+/Ckm-Cre+ mice (n = 8–10/genotype) were deprived of food overnight and then injected intraperitoneally with glucose (2 g/kg). Tail vein blood was sampled for glucose measurements at the indicated time points. Skeletal muscles (Soleus) dissected from 3-month-old Ptpmt1fl/fl/Ckm-Cre+ and Ptpmt1+/+/Ckm-Cre+ mice were processed for quantitative reverse transcription PCR (qRT-PCR) (F, n = 5/genotype) and immunoblotting (G, n = 3/genotype) assays to determine expression levels of the indicated genes. Representative images are shown.
-
Figure 1—figure supplement 2—source data 1
Uncropped immunoblotting images of Figure 1—figure supplement 2G.
- https://cdn.elifesciences.org/articles/86944/elife-86944-fig1-figsupp2-data1-v1.pdf
Figure 2 with 1 supplement
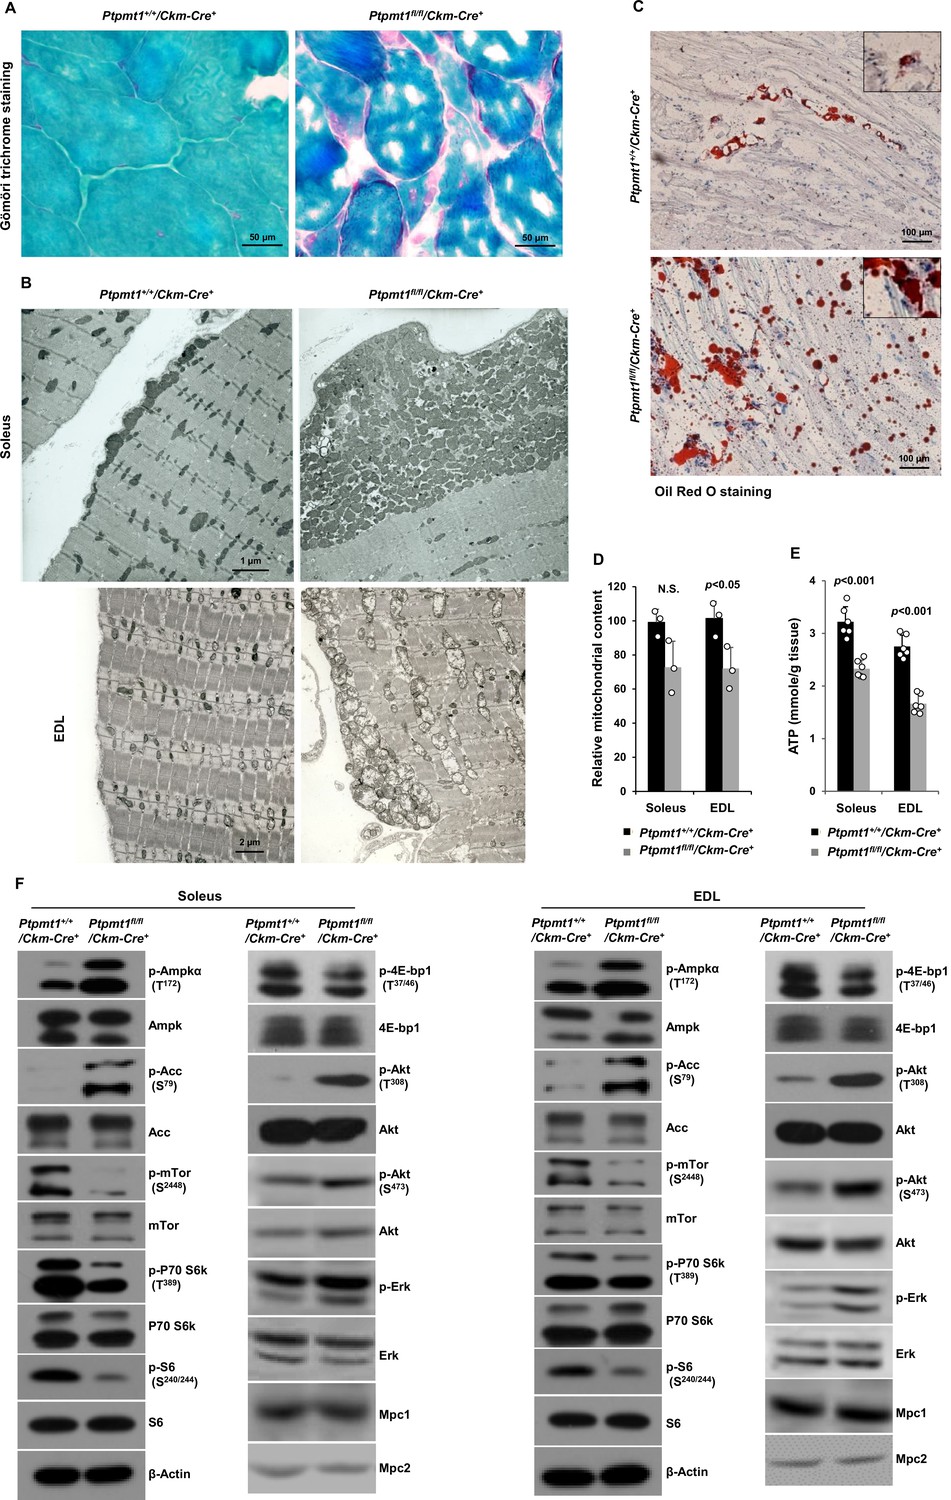
Ptpmt1 loss ultimately leads to abnormal mitochondrial distribution, structural damage, and bioenergetic stress in skeletal muscles.
(A) Skeletal muscle sections prepared from 6-month-old Ptpmt1+/+/Ckm-Cre+ and Ptpmt1fl/fl/Ckm-Cre+ mice were processed for Gömöri trichrome staining. One representative image from 3 mice/genotype is shown. (B) Soleus and Extensor Digitorum Longus (EDL) dissected from 8-month-old Ptpmt1fl/fl/Ckm-Cre+ and Ptpmt1+/+/Ckm-Cre+ mice were processed for transmission electron microscopic examination. One representative image from 3 mice/genotype is shown. (C) Skeletal muscle sections prepared from 6-month-old Ptpmt1+/+/Ckm-Cre+ and Ptpmt1fl/fl/Ckm-Cre+ mice were processed for Oil Red O staining to visualize lipids. One representative picture from 3 mice/genotype is shown. (D) Total DNA was extracted from Soleus and EDL dissected from 8-month-old Ptpmt1fl/fl/Ckm-Cre+ and Ptpmt1+/+/Ckm-Cre+ mice (n = 3/genotype). Mitochondrial content was estimated by comparing the mitochondrial gene cytochrome B DNA levels to the nuclear gene 18S DNA levels by qPCR. (E) Total ATP levels in Soleus and EDL dissected from 8-month-old Ptpmt1fl/fl/Ckm-Cre+ and Ptpmt1+/+/Ckm-Cre+ mice (n = 6/genotype) were determined. (F) Whole cell lysates prepared from the Soleus and EDL isolated from 7-month-old Ptpmt1fl/fl/Ckm-Cre+ and their control mice were examined by immunoblotting with the indicated antibodies. Representative results from 3 mice/genotype are shown.
-
Figure 2—source data 1
Uncropped immunoblotting images of Figure 2F.
- https://cdn.elifesciences.org/articles/86944/elife-86944-fig2-data1-v1.pdf
Figure 2—figure supplement 1
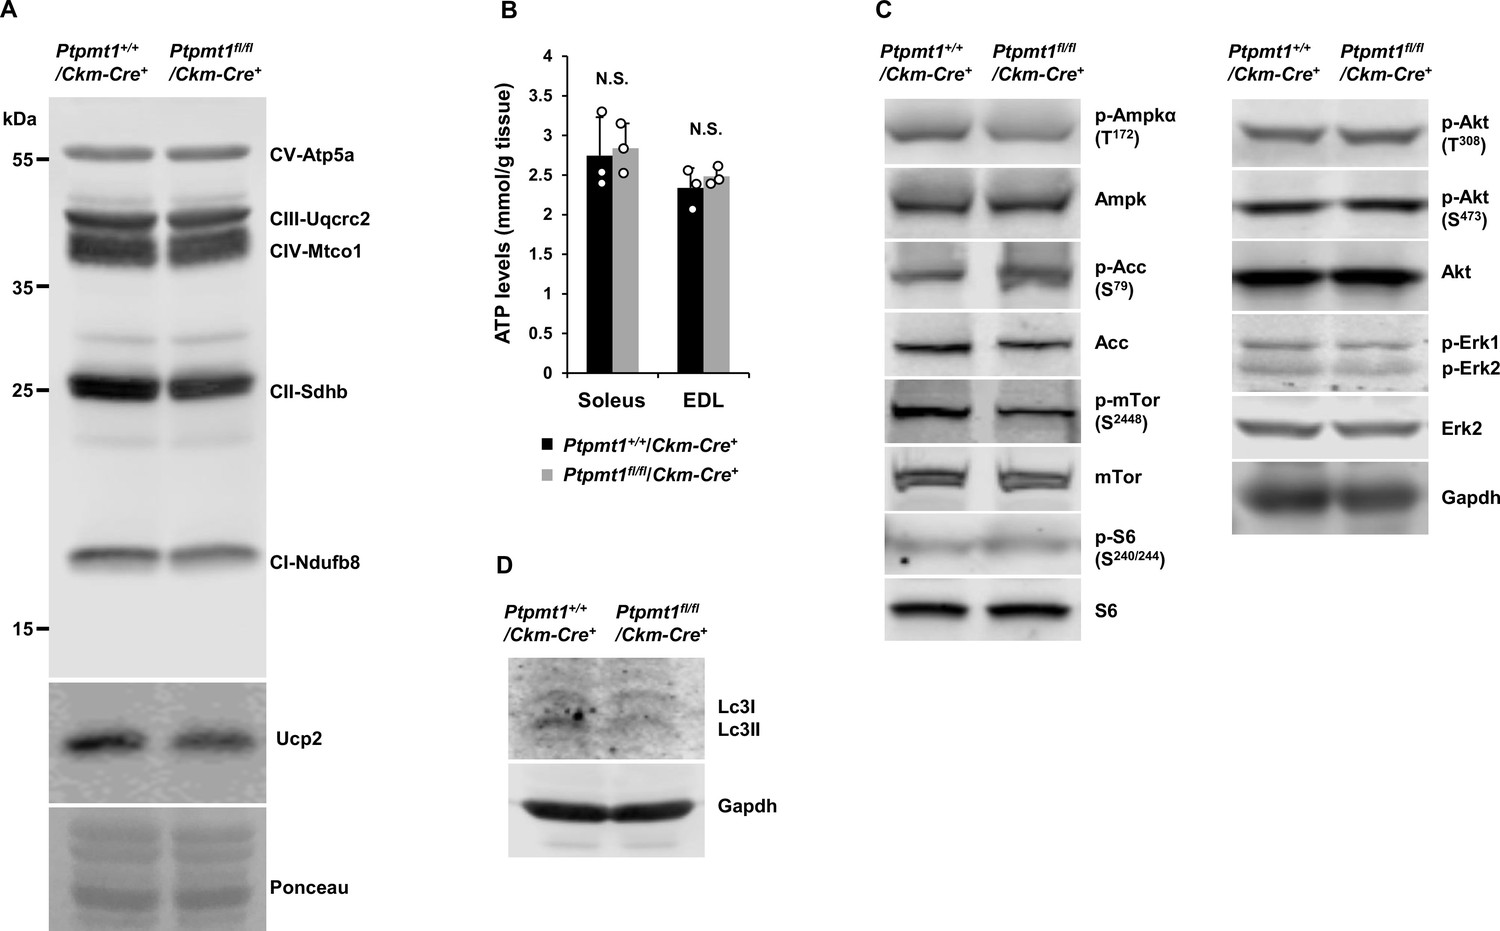
Energy homeostasis is initially maintained in young Ptpmt1fl/fl/Ckm-Cre+ skeletal muscles.
(A) Mitochondria were isolated from the skeletal muscles dissected from Ptpmt1fl/fl/Ckm-Cre+ and Ptpmt1+/+/Ckm-Cre+ mice (n = 3/genotype) at 3 months of age. Expression levels of mitochondrial electron transport chain complexes were determined by immunoblotting. Representative images are shown. (B) Total ATP levels in Soleus and Extensor Digitorum Longus (EDL) dissected from 3-month-old Ptpmt1fl/fl/Ckm-Cre+ and Ptpmt1+/+/Ckm-Cre+ mice (n = 3/genotype) were determined. (C, D) Whole cell lysates prepared from Soleus isolated from 3-month-old Ptpmt1fl/fl/Ckm-Cre+ and control mice were examined by immunoblotting with the indicated antibodies. Representative results (3 mice/genotype) are shown.
-
Figure 2—figure supplement 1—source data 1
Uncropped immunoblotting images of Figure 2—figure supplement 1C, D.
- https://cdn.elifesciences.org/articles/86944/elife-86944-fig2-figsupp1-data1-v1.pdf
Figure 3
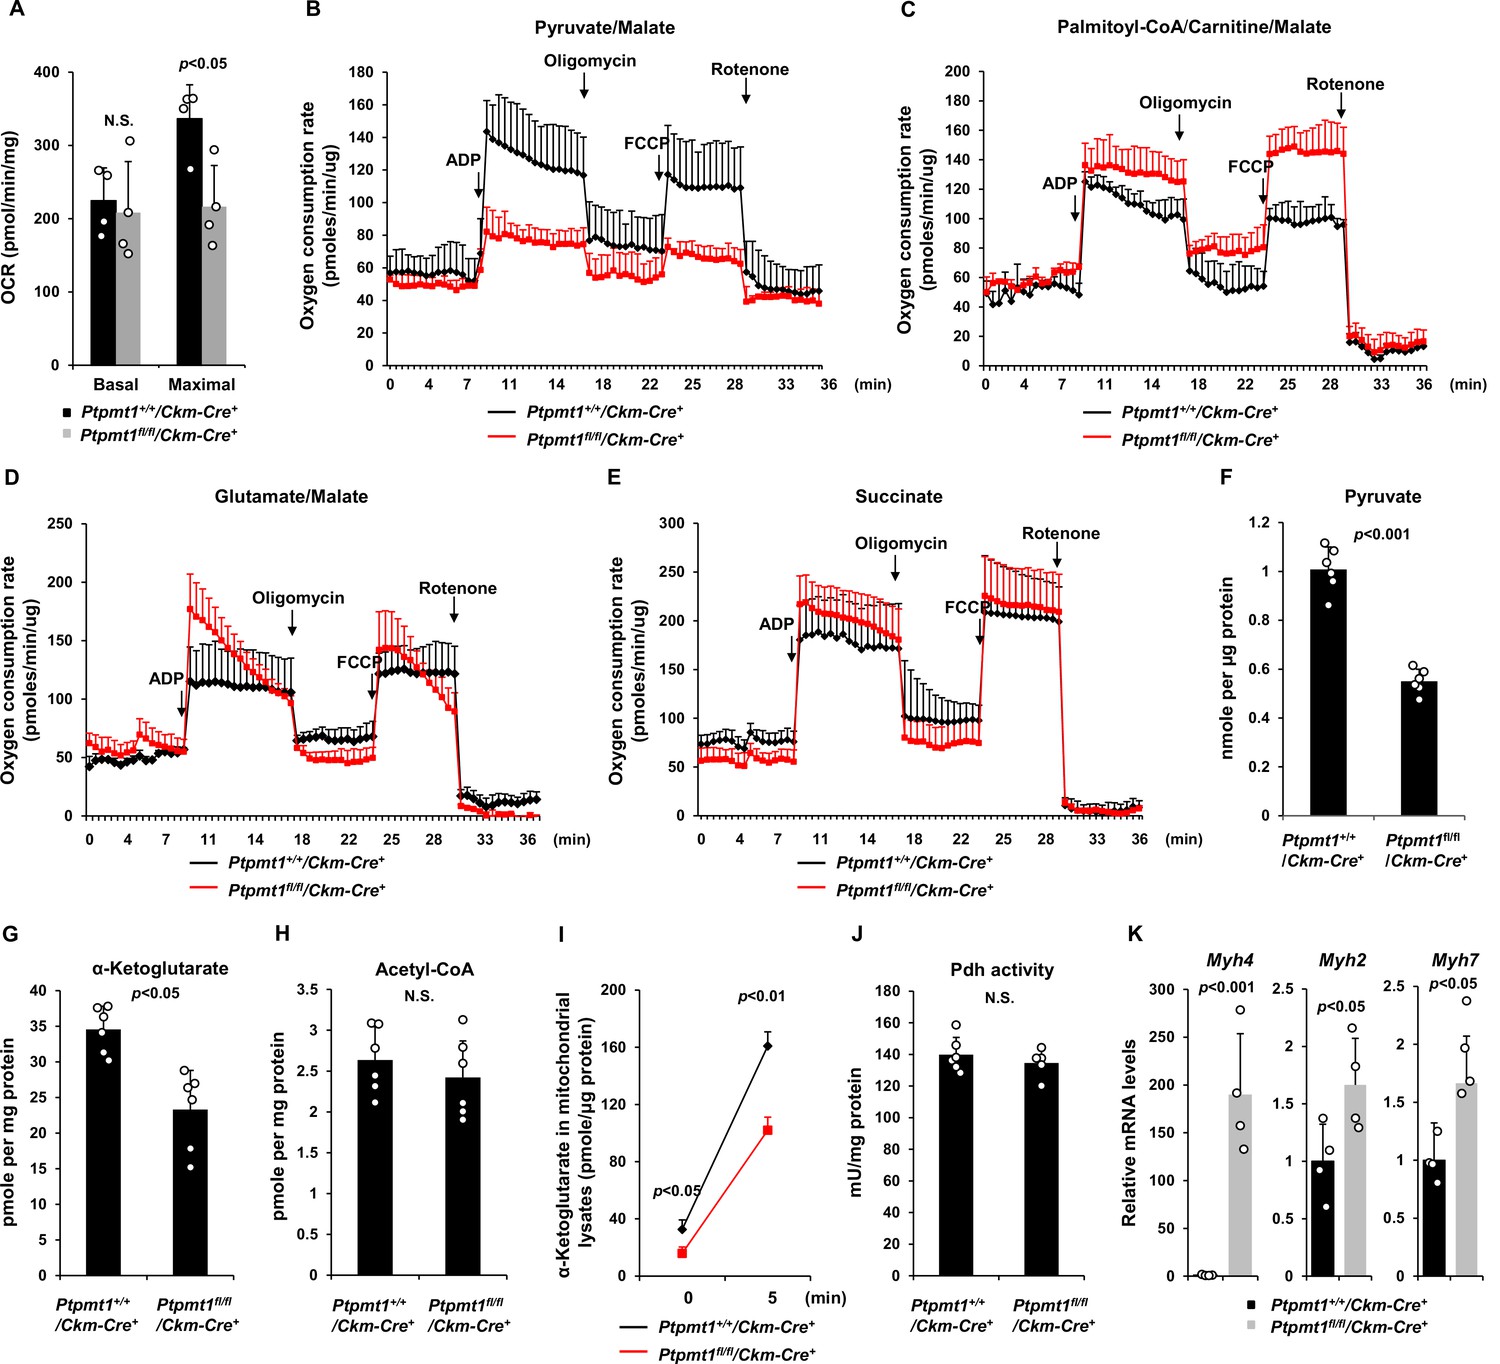
Ptpmt1 ablation impairs mitochondrial utilization of pyruvate, whereas the fatty acid utilization is enhanced.
(A) Muscle cross-sections prepared with biopsy punches from Ptpmt1fl/fl/Ckm-Cre+ and Ptpmt1+/+/Ckm-Cre+ mice (n = 4/genotype) at 4 months of age were measured for oxygen consumption rates (OCRs) at the basal level and following the addition of oligomycin (8 μM), FCCP (4 μM), and antimycin A/rotenone (1 μM). (B–E) Mitochondria were isolated from the skeletal muscles dissected from Ptpmt1fl/fl/Ckm-Cre+ and Ptpmt1+/+/Ckm-Cre+ mice (n = 3/genotype) at 3 months of age. Mitochondrial oxygen consumption (10 μg of mitochondrial protein) was measured in the presence of pyruvate (5 mM)/malate (5 mM) (B), palmitoyl-CoA (40 μM)/carnitine (40 μM)/malate (5 mM) (C), glutamate (5 mM)/malate (5 mM) (D), or succinate (10 mM) (E), following the addition of ADP (4 mM), oligomycin (1.5 μM), FCCP (4 μM), and antimycin A/rotenone (1 μM). Experiments were repeated three times with three independent pairs of mice. Similar results were obtained in each experiment. Levels of pyruvate (F), α-ketoglutarate (α-KG) (G), and acetyl-CoA (H) in the lysates of the mitochondria isolated from the above skeletal muscles were measured (n = 6/genotype). (I) Mitochondria freshly isolated from the skeletal muscles of Ptpmt1fl/fl/Ckm-Cre+ and Ptpmt1+/+/Ckm-Cre+ mice (n = 4/genotype) were washed three times in Mitochondrial Assay Solution (MAS) buffer. The mitochondria were then incubated with pyruvate (5 mM)/malate (5 mM) and ADP (4 mM) at 37°C. Five min later, mitochondria were collected, washed, and lysed. α-KG levels in the mitochondrial lysates were measured. (J) Pyruvate dehydrogenase (Pdh) activities in the mitochondrial lysates were determined (n = 5–6 mice/genotype). (K) Myh4, Myh2, and Myh7 mRNA levels in the skeletal muscles dissected from 3-month-old Ptpmt1+/+/Ckm-Cre+ and Ptpmt1fl/fl/Ckm-Cre+ mice (n = 4/genotype) were determined by quantitative reverse transcription PCR (qRT-PCR).
Figure 4 with 3 supplements
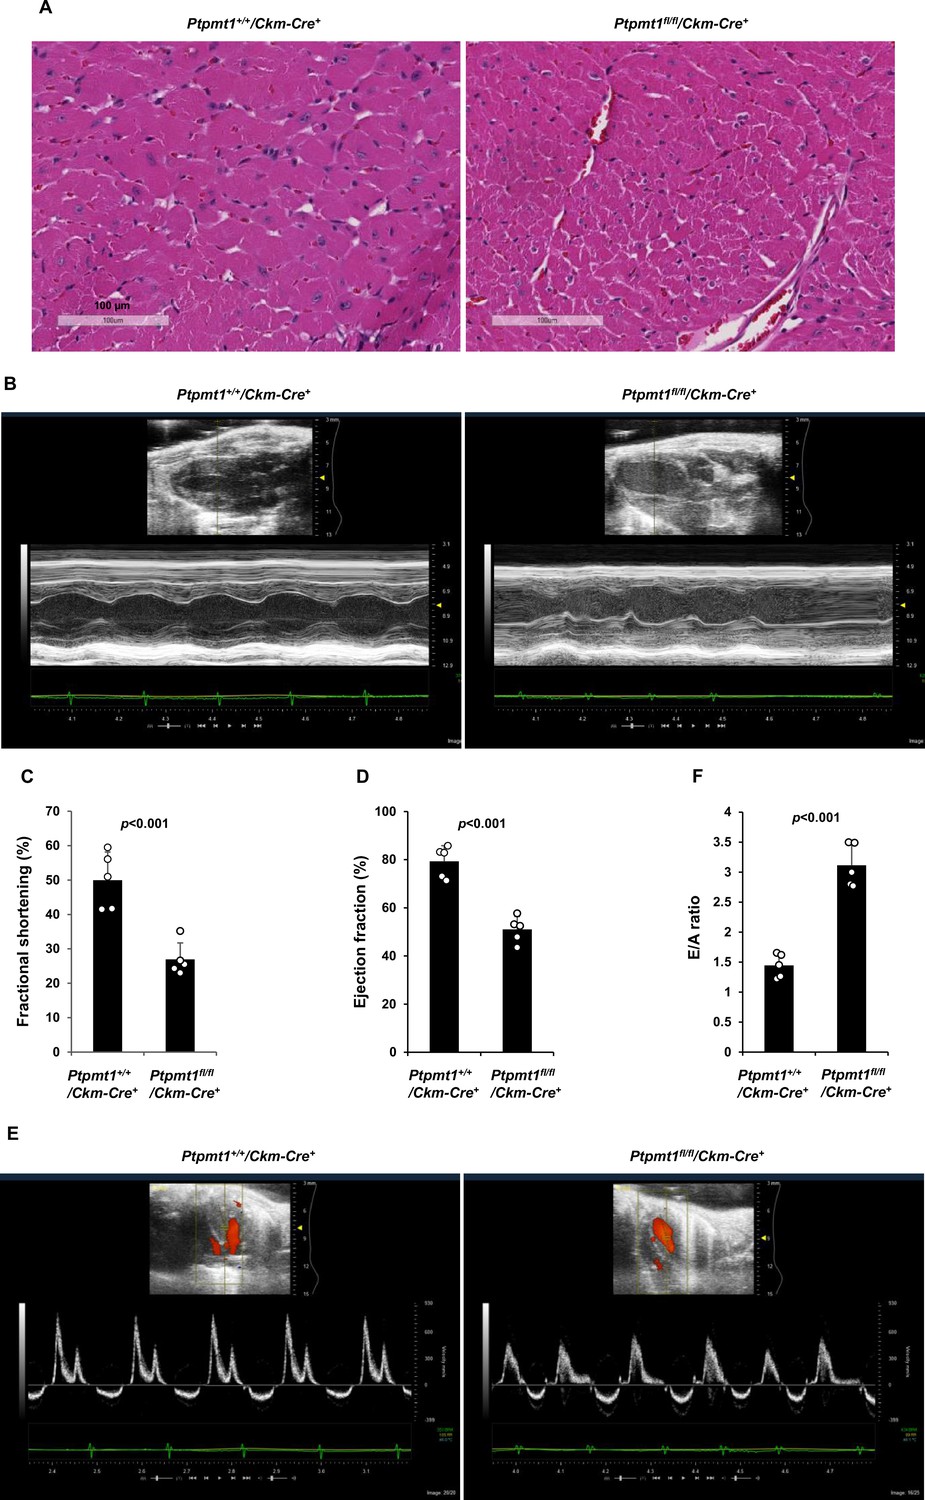
Ptpmt1fl/fl/Ckm-Cre+ mice manifest late-onset cardiac dysfunction.
(A) Heart tissue sections prepared from 12-month-old Ptpmt1+/+/Ckm-Cre+ and Ptpmt1fl/fl/Ckm-Cre+ mice were processed for Hematoxylin and Eosin (H&E) staining. One representative image from 3 mice/genotype is shown. (B–F) Cardiac morphology and function of 12-month-old Ptpmt1+/+/Ckm-Cre+ and Ptpmt1fl/fl/Ckm-Cre+ mice (n = 5/genotype) were examined by echocardiography. Representative long-axis views in M-mode echocardiographic tracing of left ventricle (LV) are shown (B). LV fractional shortening (FS) (C) and LV ejection fraction (EF) (D) were determined. Representative pulsed-wave Doppler recordings of mitral valve inflow are shown (E). Ratios of peak velocity of early to late filling of mitral inflow (E/A) were determined (F).
Figure 4—figure supplement 1
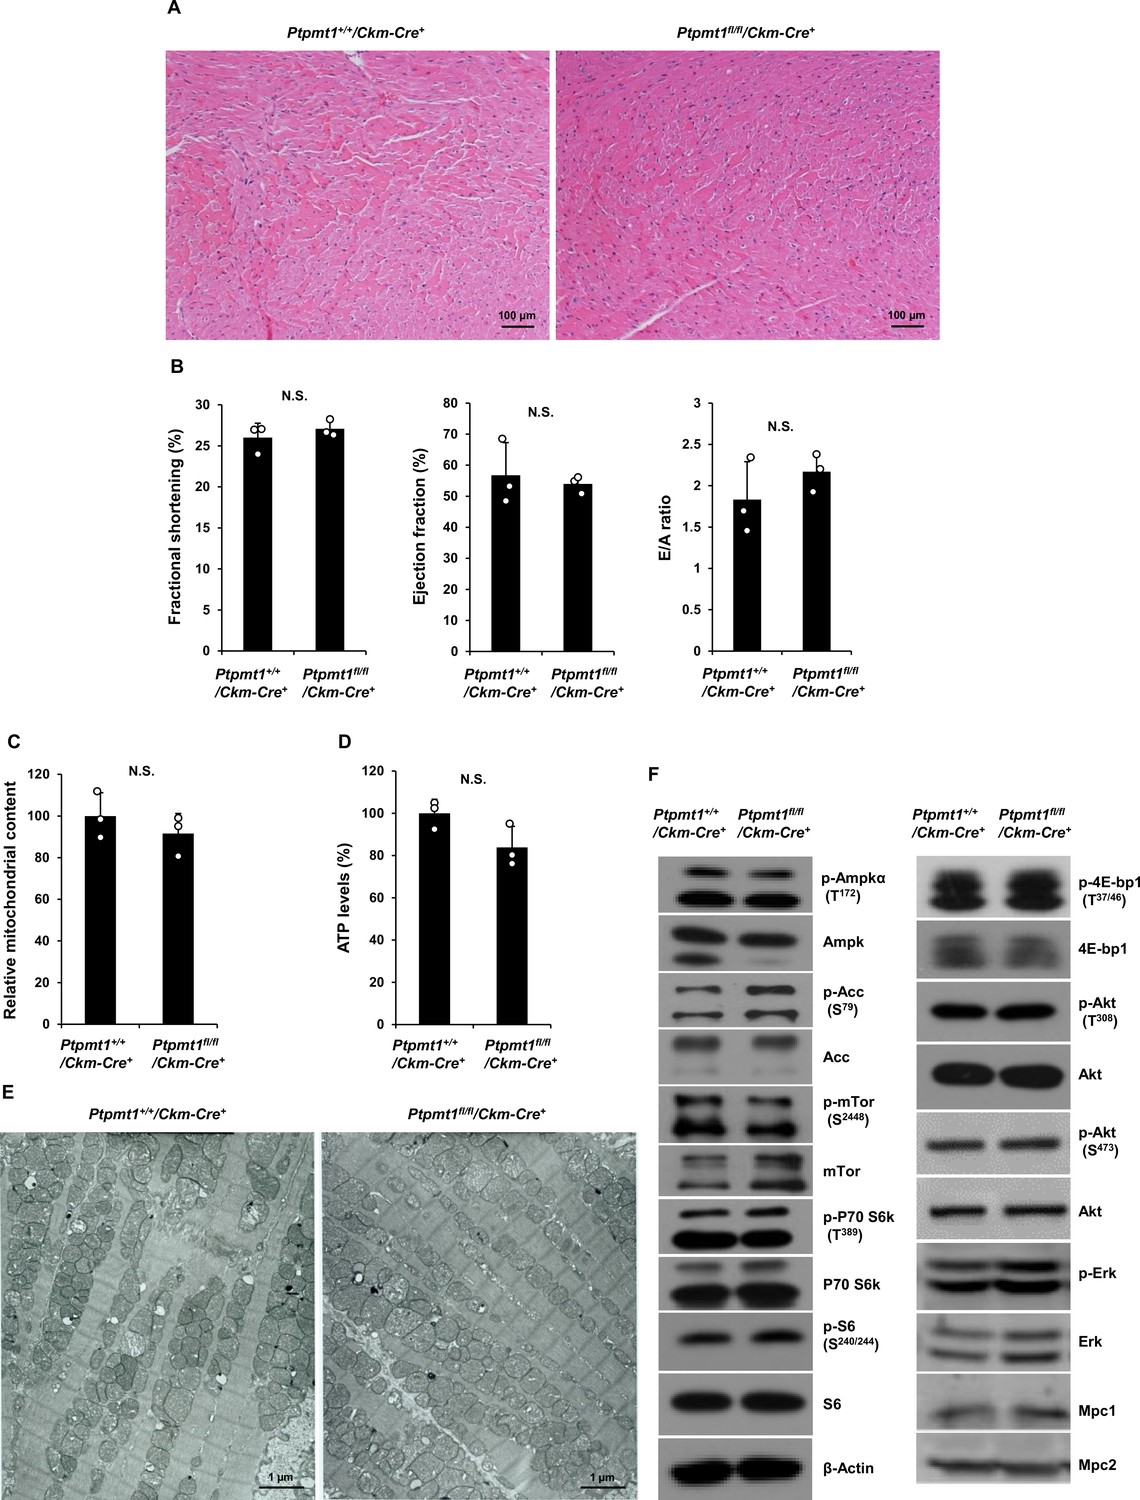
Heart functions are normal in Ptpmt1fl/fl/Ckm-Cre+ mice at 7 months.
(A) Heart tissue sections prepared from 7-month-old Ptpmt1+/+/Ckm-Cre+ and Ptpmt1fl/fl/Ckm-Cre+ mice were processed for Hematoxylin and Eosin (H&E) staining. Representative images (3 mice/genotype) are shown. (B) Cardiac functions of 5-month-old Ptpmt1+/+/Ckm-Cre+ and Ptpmt1fl/fl/Ckm-Cre+ mice (n = 3/genotype) were examined by echocardiography. Left ventricle (LV) fractional shortening (FS), ejection fraction (EF), and ratios of peak velocity of early to late filling of mitral inflow (E/A) were determined. (C) Total DNA was extracted from the heart tissues isolated from Ptpmt1fl/fl/Ckm-Cre+ and Ptpmt1+/+/Ckm-Cre+ mice (n = 3/genotype). Mitochondrial content was estimated by comparing mtDNA (Cytochrome B) levels to genomic DNA levels by quantitative PCR. (D) Total ATP levels in the heart tissues isolated from 8-month-old Ptpmt1fl/fl/Ckm-Cre+ and Ptpmt1+/+/Ckm-Cre+ mice (n = 3/genotype) were determined. (E) Heart tissues dissected from 7-month-old Ptpmt1fl/fl/Ckm-Cre+ and Ptpmt1+/+/Ckm-Cre+ mice were processed for transmission electron microscopic examination. Representative images (3 mice/genotype) are shown. (F) Whole cell lysates prepared from the heart tissues dissected from 7-month-old Ptpmt1fl/fl/Ckm-Cre+ and Ptpmt1+/+/Ckm-Cre+ mice were examined by immunoblotting with the indicated antibodies. Representative results (3 mice/genotype) are shown.
-
Figure 4—figure supplement 1—source data 1
Uncropped immunoblotting images of Figure 4—figure supplement 1F.
- https://cdn.elifesciences.org/articles/86944/elife-86944-fig4-figsupp1-data1-v1.pdf
Figure 4—video 1
Normal heart function in Ptpmt1+/+/Ckm-Cre+ mice.
Twelve-month-old Ptpmt1+/+/Ckm-Cre+ (Figure 4—video 1) and Ptpmt1fl/fl/Ckm-Cre+ (Figure 4—video 2) mice (n = 5/genotype) were anesthetized with 2% isoflurane and 2D echocardiography was performed using the Vevo 2100 system and MS400 transducer. Representative 2D (B-mode) long-axis recordings of left ventricular function are shown.
Figure 4—video 2
Cardiac dysfunction in Ptpmt1fl/fl/Ckm-Cre+ mice.
Figure 5 with 4 supplements
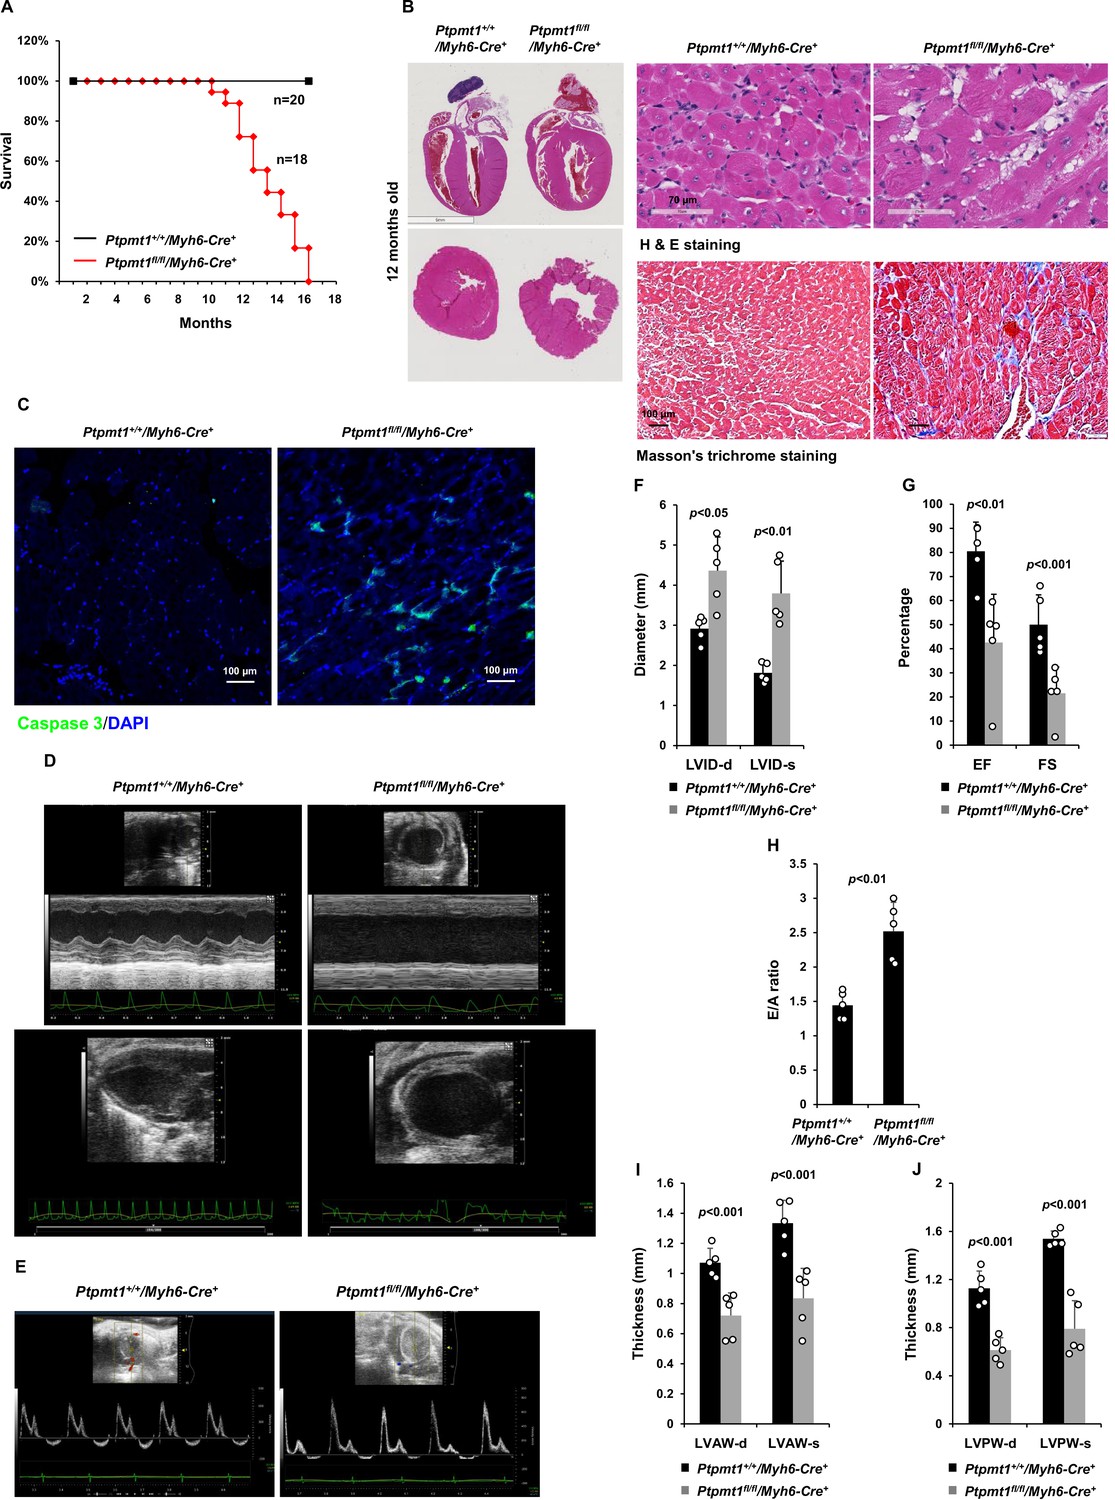
Deletion of Ptpmt1 from the heart ultimately leads to dilated cardiomyopathy and heart failure.
(A) Kaplan–Meier survival curves of Ptpmt1fl/fl/Myh6-Cre+ (n = 18) and Ptpmt1+/+/Myh6-Cre+ mice (n = 20). (B) Heart tissue sections prepared from 10- to 12-month-old Ptpmt1fl/fl/Myh6-Cre+ and Ptpmt1+/+/Myh6-Cre+ mice (n = 4/genotype) were processed for Hematoxylin and Eosin (H&E) staining and Masson’s Trichrome staining. Representative images are shown. (C) Heart tissue sections prepared from 11-month-old Ptpmt1fl/fl/Myh6-Cre+ and Ptpmt1+/+/Myh6-Cre+ mice were processed for immunofluorescence staining for cleaved caspase 3 followed by DAPI counterstaining. One representative image from 3 mice/genotype is shown. (D–J) Eleven- to twelve-month-old Ptpmt1fl/fl/Myh6-Cre+ and Ptpmt1+/+/Myh6 -Cre+ mice (n = 5/genotype) were examined by echocardiographic evaluation of ventricular function. Representative long- (upper panel) and short- (lower panel) axis views in M-mode echocardiographic tracing of left ventricle (LV) (D), and pulsed-wave Doppler recordings of mitral valve inflow (E) are shown. Left ventricular internal diameters at diastole (LVID-d) and systole (LVID-s) were measured (F). LV ejection fraction (EF) and fractional shortening (FS) (G), ratios of peak velocity of early to late filling of mitral inflow (E/A) (H), the thickness of LV anterior wall at the end of diastole (LVAW-d) and the end of systole (LVAW-s) (I), and thickness of LV posterior wall at the end of diastole (LVPW-d) and at the end of systole (LVPW-s) (J) were determined.
Figure 5—figure supplement 1
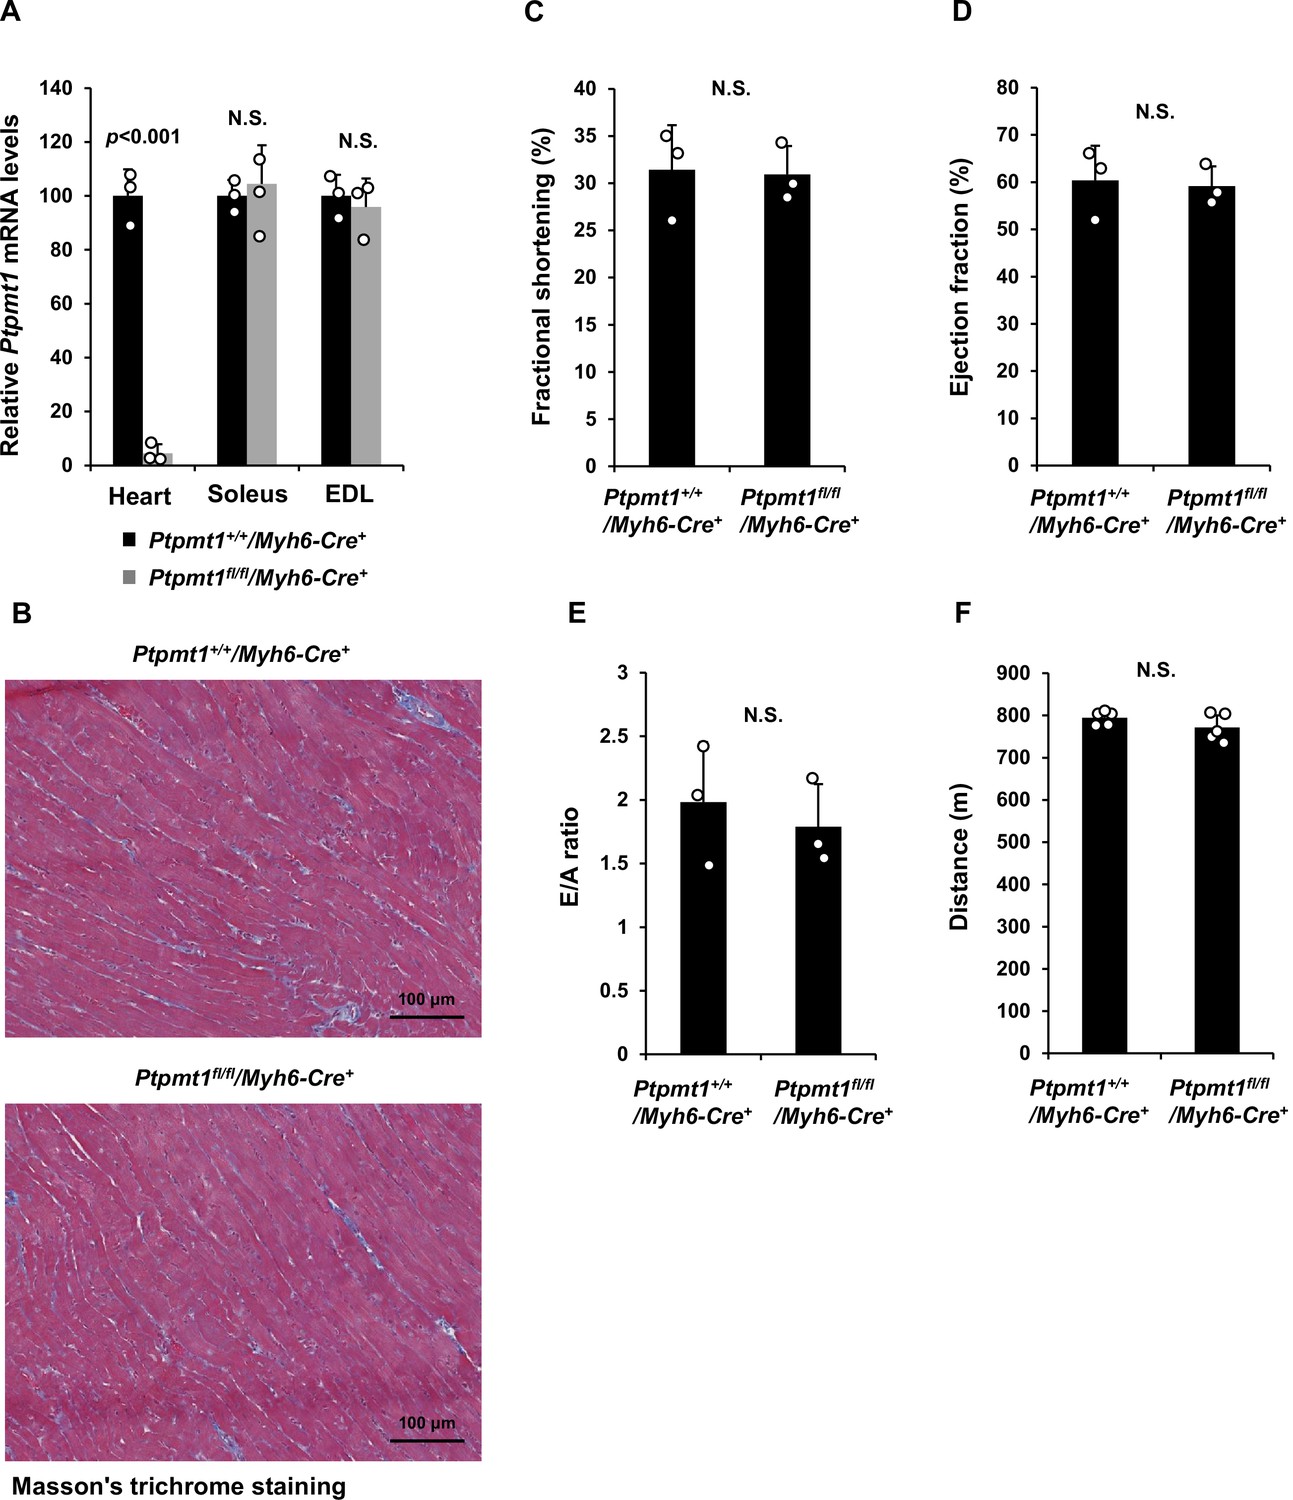
Cardiac functions are normal in middle-aged or younger heart-specific Ptpmt1 knockout mice.
(A) Ptpmt1 mRNA levels in the heart, Soleus, and Extensor Digitorum Longus (EDL) dissected from Ptpmt1+/+/Myh6-Cre+ and Ptpmt1fl/fl/Myh6-Cre+ mice (n = 3/genotype) were determined by quantitative reverse transcription PCR (qRT-PCR). (B) Heart tissue sections prepared from 3-month-old Ptpmt1fl/fl/Myh6-Cre+ and Ptpmt1+/+/Myh6-Cre+ mice were processed for Masson’s Trichrome staining. Representative images (3 mice/genotype) are shown. (C–E) Echocardiographic analyses were performed for 3-month-old Ptpmt1fl/fl/Myh6-Cre+ and Ptpmt1+/+/Myh6-Cre+ mice (n = 3/genotype). Left ventricle (LV) fractional shortening (FS) (C), ejection fraction (EF) (D), and E/A ratios (E) were determined. (F) Six-month-old Ptpmt1fl/fl/Myh6-Cre+ and Ptpmt1+/+/Myh6-Cre+ male mice (n = 5/genotype) were subjected to treadmill exercise tests. Total distances traveled before the mice collapsed were recorded.
Figure 5—figure supplement 2
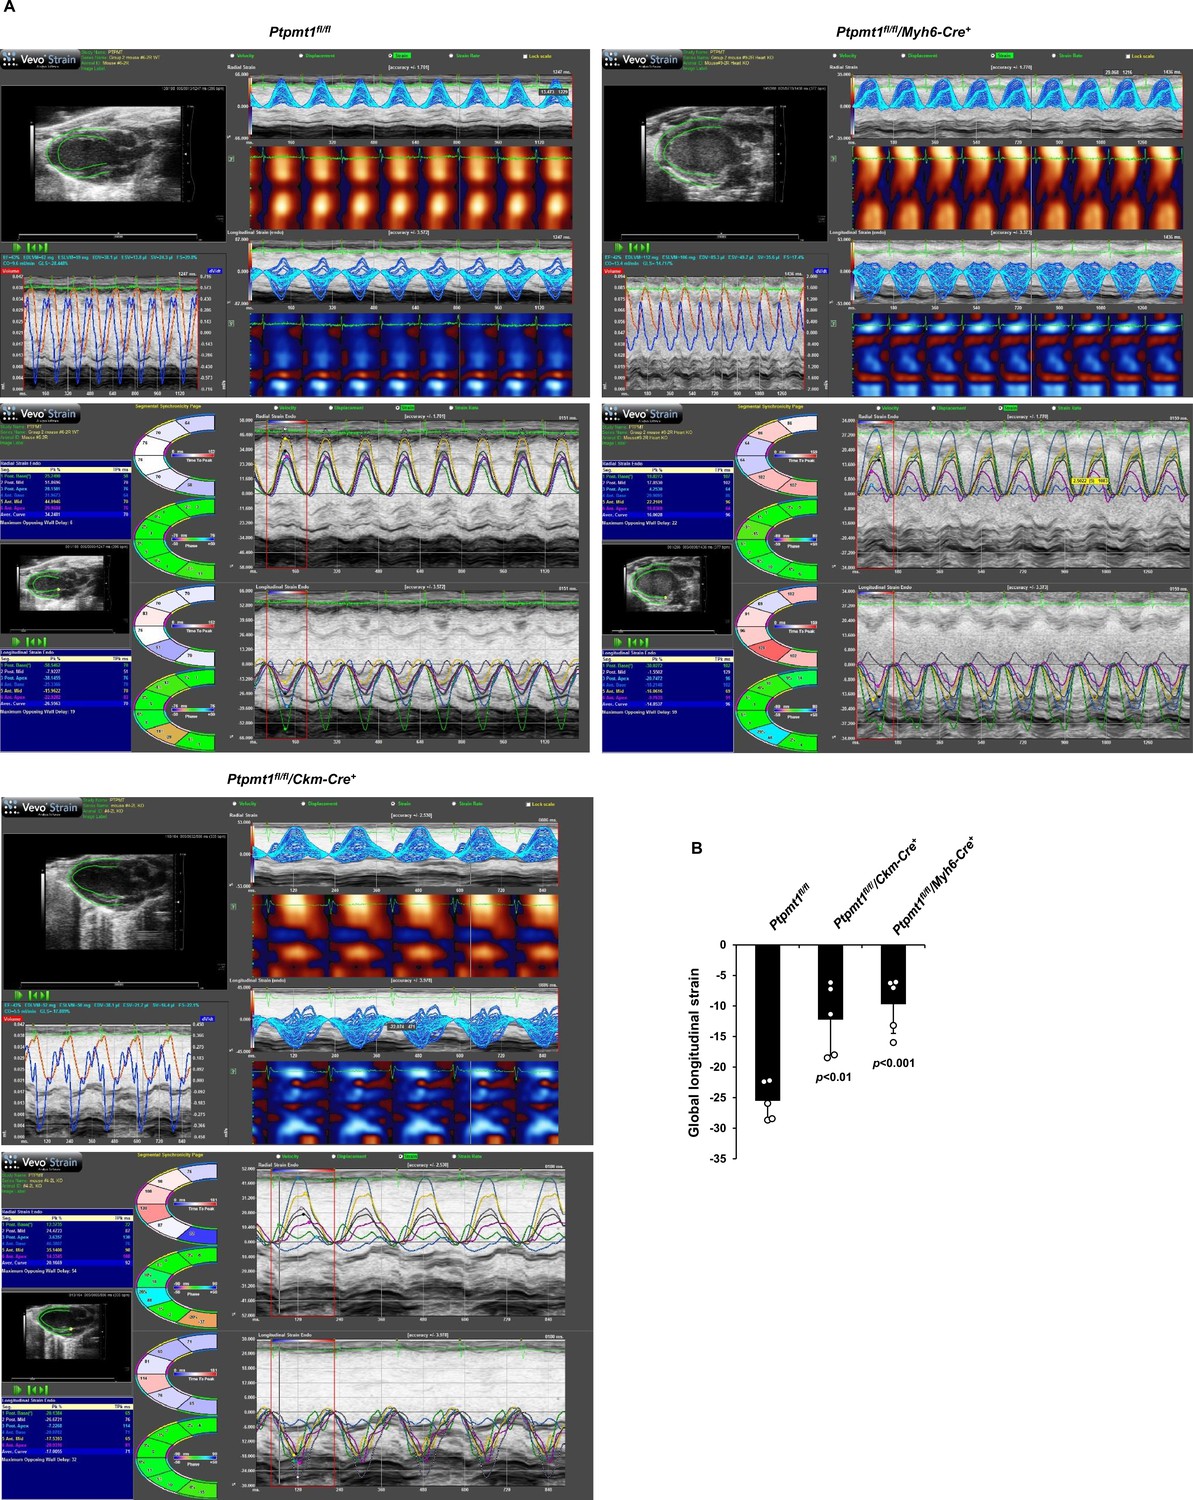
Cardiac dysfunction in 12-month-old Ptpmt1fl/fl/Myh6-Cre+ and Ptpmt1fl/fl/Ckm-Cre+ mice.
(A, B) Echocardiographic speckle-tracking-based strain measurements were conducted for 12-month-old Ptpmt1fl/fl, Ptpmt1fl/fl/Myh6-Cre+, and Ptpmt1fl/fl/Ckm-Cre+ mice (n = 5/genotype). Representative strain images are shown (A). Left ventricle (LV) global longitudinal strain (GLS) was determined (B).
Figure 5—video 1
Normal heart function in Ptpmt1+/+/Myh6-Cre+ mice.
Eleven- to twelve-month-old PtpmtT1+/+/Myh6-Cre+ (Figure 5—video 1) and Ptpmt1fl/fl/Myh6-Cre+ (Figure 5—video 2) mice (n = 5/genotype) were anesthetized with 2% isoflurane and 2D echocardiography was performed using the Vevo 2100 system and MS400 transducer. Representative 2D (B-mode) long-axis recordings of left ventricular function are shown.
Figure 5—video 2
Heart failure in Ptpmt1fl/fl/Myh6-Cre+ mice.
Figure 6 with 3 supplements
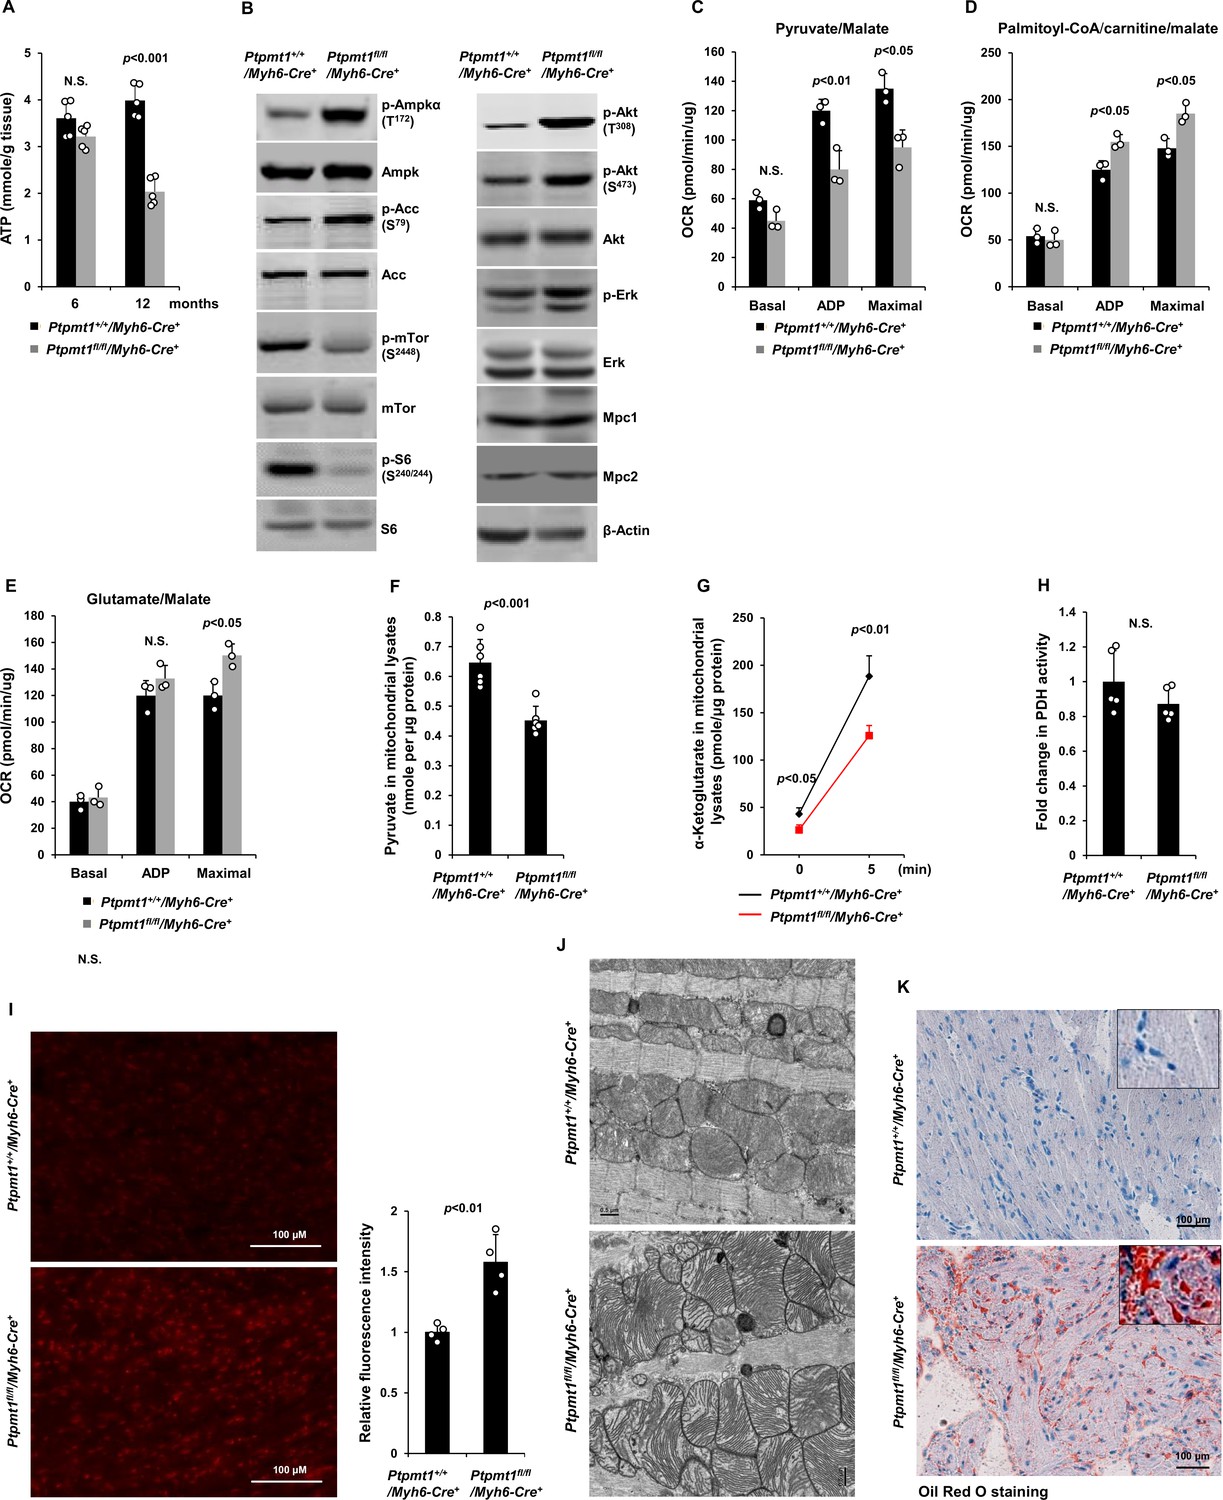
Ptpmt1 deficiency causes mitochondrial substrate shift and oxidative stress, leading to mitochondrial damage and lipid accumulation in Ptpmt1 knockout cardiomyocytes.
(A) Total ATP levels in the heart tissues dissected from Ptpmt1fl/fl/Myh6-Cre+ and Ptpmt1+/+/Myh6-Cre+ mice at the indicated ages (n = 5 mice/genotype). (B) Whole cell lysates prepared from the heart tissues of 10- to 12-month-old Ptpmt1fl/fl/Myh6-Cre+ and Ptpmt1+/+/Myh6-Cre+ mice were examined by immunoblotting with the indicated antibodies. Representative results from 3 mice/genotype are shown. Oxygen consumption of the mitochondria isolated from the heart tissues of 2- to 3-month-old Ptpmt1fl/fl/Myh6-Cre+ and Ptpmt1+/+/Myh6-Cre+ mice (n = 3/genotype) was measured in the presence of pyruvate (5 mM)/malate (5 mM) (C), palmitoyl-CoA (40 μM)/carnitine (40 μM)/malate (5 mM) (D), or glutamate (5 mM)/malate (5 mM) (E), following the addition of ADP (4 mM), oligomycin (1.5 μM), FCCP (4 μM), and antimycin A/rotenone (1 μM). OCRs at basal levels, in response to ADP addition, and maximal reserve capabilities were determined. (F) Levels of pyruvate in the lysates of the cardiac mitochondria isolated from 2- to 3-month-old Ptpmt1fl/fl/Myh6-Cre+ and Ptpmt1+/+/Myh6-Cre+ mice (n = 6/genotype) were determined. (G, H) Mitochondria isolated above were washed three times in Mitochondrial Assay Solution (MAS) buffer and then incubated with pyruvate (5 mM)/malate (5 mM) and ADP (4 mM) at 37°C. Five minutes later, the mitochondria were collected, washed, and lysed. α-Ketoglutarate (α-KG) levels in the mitochondrial lysates were measured (n = 4 mice/genotype) (G). Pyruvate dehydrogenase (Pdh) activities in the mitochondrial lysates were determined (n = 5 mice/genotype) (H). (I) Heart tissue sections prepared from 3-month-old Ptpmt1fl/fl/Myh6-Cre+ and Ptpmt1+/+/Myh6-Cre+ mice (4 mice/genotype) were processed for reactive oxygen species (ROS) staining. One representative picture from 4 mice/genotype is shown. (J) Heart tissues dissected from 6- to 8-month-old Ptpmt1fl/fl/Myh6-Cre+ and Ptpmt1+/+/ Myh6-Cre+ mice were processed for transmission electron microscopic (TEM) examination. One representative image from 4 mice/genotype is shown. (K) Heart tissue sections prepared from 10- to 12-month-old Ptpmt1fl/fl/Myh6-Cre+ and Ptpmt1+/+/Myh6-Cre+ mice were processed for Oil Red O staining to visualize lipids. One representative picture from 3 mice/genotype is shown.
-
Figure 6—source data 1
Uncropped immunoblotting images of Figure 6B.
- https://cdn.elifesciences.org/articles/86944/elife-86944-fig6-data1-v1.pdf
Figure 6—figure supplement 1
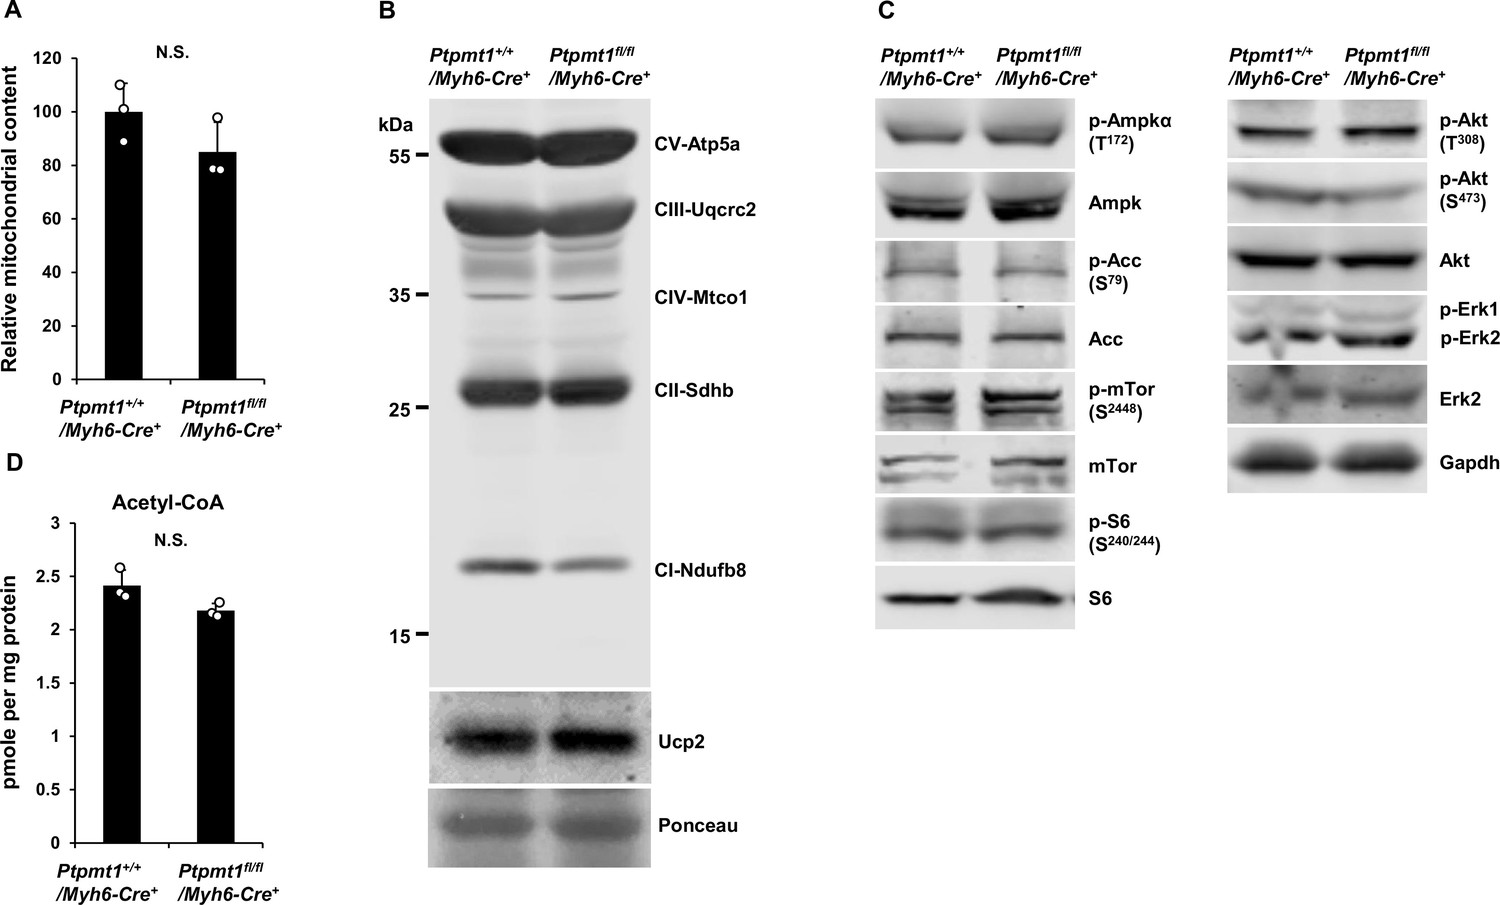
There is no bioenergetic stress in young Ptpmt1 knockout cardiomyocytes.
(A) Total DNA was extracted from the heart tissues isolated from Ptpmt1fl/fl/Myh6-Cre+ and Ptpmt1+/+/Myh6-Cre+ mice (n = 3/genotype). Mitochondrial content was estimated by comparing mtDNA (Cytochrome B) levels to genomic DNA levels by quantitative PCR. (B) Mitochondria were isolated from the heart tissues freshly dissected from 3-month-old Ptpmt1fl/fl/Myh6-Cre+ and Ptpmt1+/+/Myh6-Cre+ mice (n = 3/genotype). Expression levels of mitochondrial electron transport chain complexes were determined by immunoblotting. Representative images are shown. (C) Whole cell lysates prepared from the heart tissues dissected from 3-month-old Ptpmt1fl/fl/Myh6-Cre+ and Ptpmt1+/+/Myh6-Cre+ mice were examined by immunoblotting with the indicated antibodies. Representative results (3 mice/genotype) are shown. (D) Mitochondria were isolated from the heart tissues dissected from 2- to 3-month-old Ptpmt1fl/fl/Myh6-Cre+ and Ptpmt1+/+/Myh6-Cre+ mice (n = 3 mice/genotype). Acetyl-CoA levels in the mitochondrial lysates were determined using an acetyl-CoA assay kit following the manufacturer’s instructions.
-
Figure 6—figure supplement 1—source data 1
Uncropped immunoblotting images of Figure 6—figure supplement 1C.
- https://cdn.elifesciences.org/articles/86944/elife-86944-fig6-figsupp1-data1-v1.pdf
Figure 6—figure supplement 2
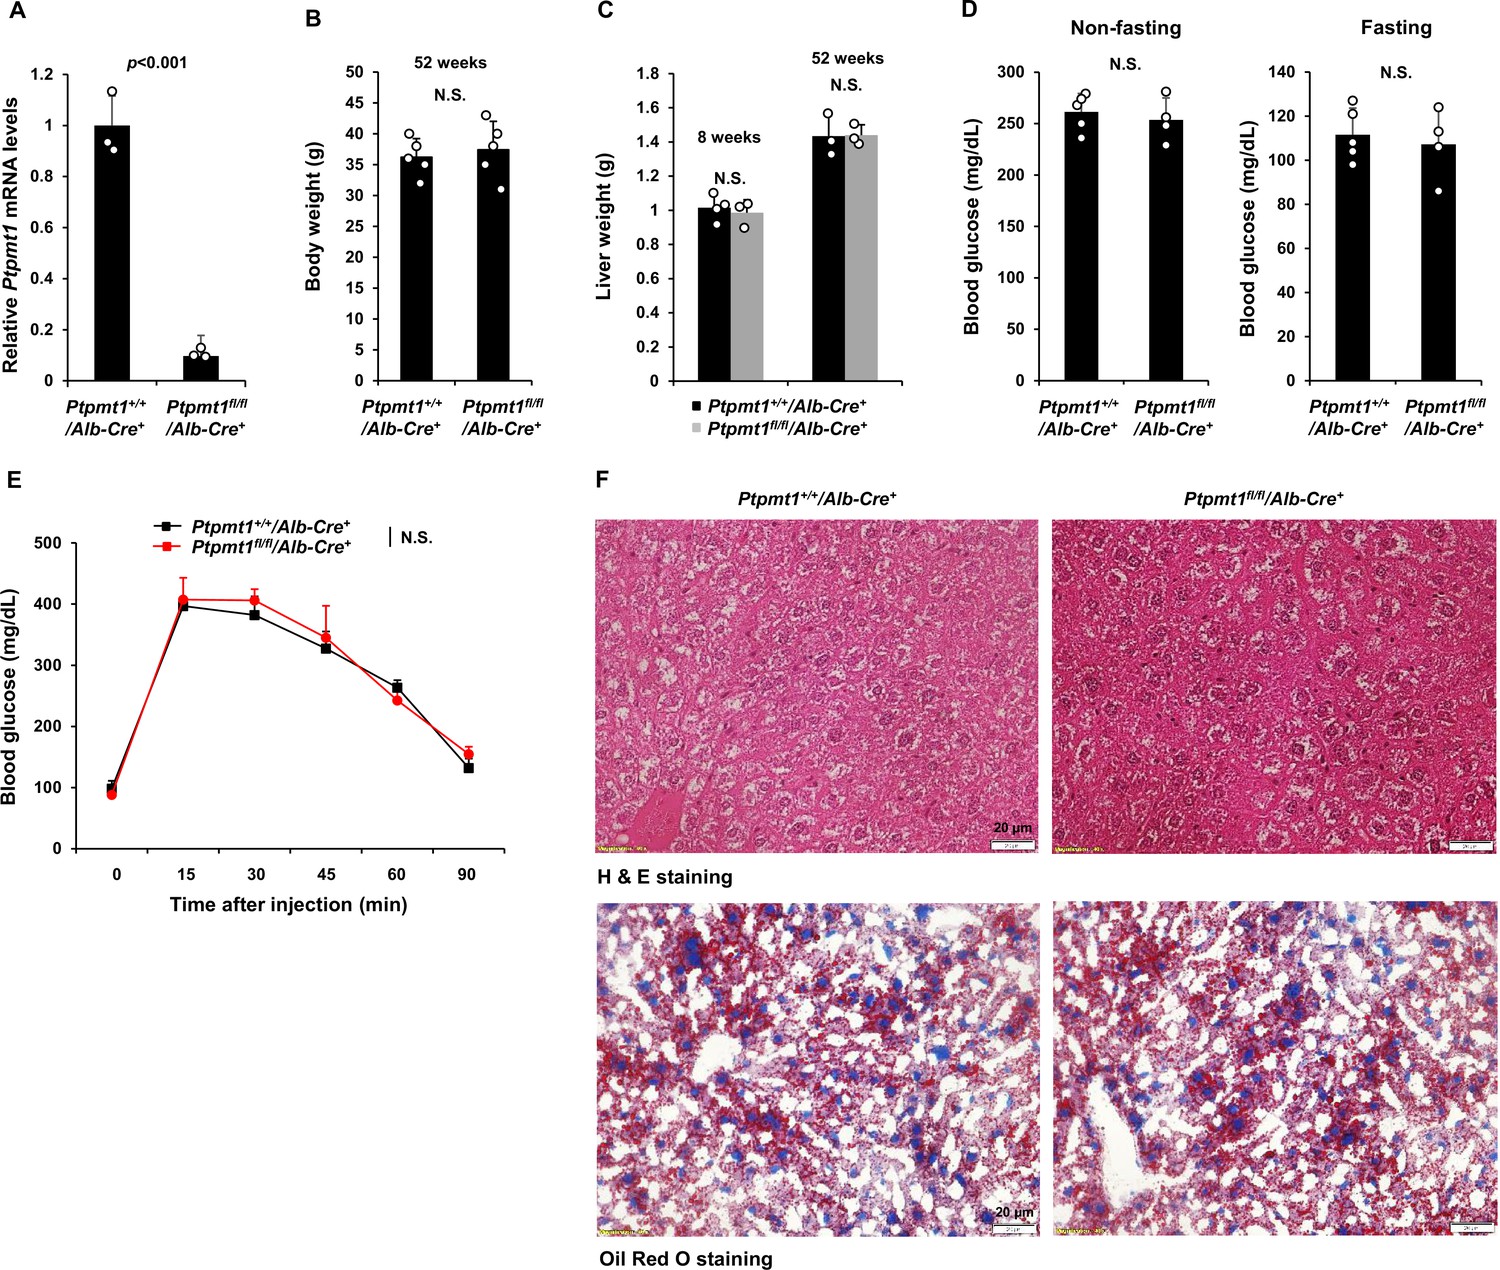
The impact of Ptpmt1 deletion from the liver is minimal.
(A) Ptpmt1 mRNA levels in the livers dissected from Ptpmt1+/+/Alb-Cre+ and Ptpmt1fl/fl/Alb-Cre+ mice (n = 3/genotype) were determined by quantitative reverse transcription PCR (qRT-PCR). Body weights (n = 5 mice/genotype) (B) and liver weights (n = 3–4 mice/genotype) (C) of Ptpmt1+/+/Alb-Cre+ and Ptpmt1fl/fl/Alb-Cre+ male mice at the indicated ages were determined. (D) Blood glucose levels were measured in 8-week-old Ptpmt1fl/fl/Alb-Cre+ and Ptpmt1+/+/Alb-Cre+ male mice (n = 4–5/genotype) under feeding and overnight-fasting conditions. (E) Eight-week-old Ptpmt1fl/fl/Alb-Cre+ and Ptpmt1+/+/Alb-Cre+ mice (n = 5/genotype) were deprived of food overnight and then injected intraperitoneally with glucose (2 g/kg). Tail vein blood was sampled for glucose measurements at the indicated time points. (F) Liver sections prepared from 12-month-old Ptpmt1fl/fl/Alb-Cre+ and Ptpmt1+/+/Alb-Cre+ mice were processed for Hematoxylin and Eosin (H&E) and Oil Red O staining. Representative pictures (3 mice/genotype) are shown.
Figure 6—figure supplement 3
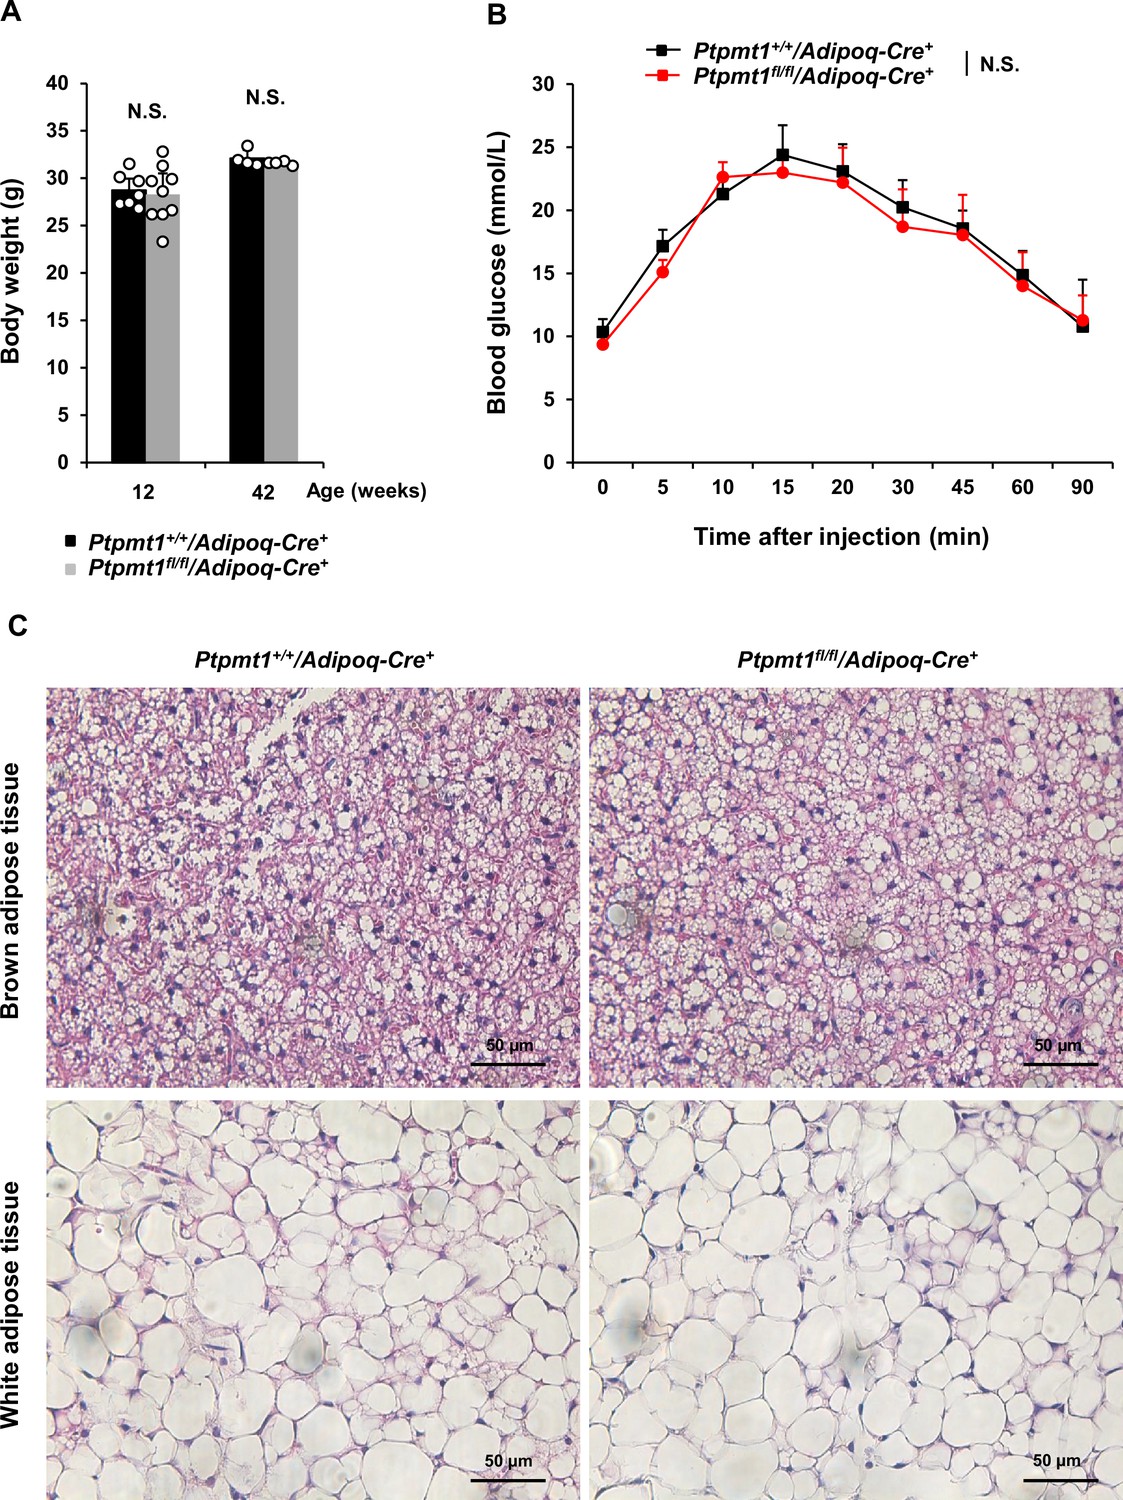
No defects are observed in adipocyte-specific Ptpmt1 knockout mice.
(A) Body weights of Ptpmt1fl/fl/Adipoq-Cre+ and Ptpmt1+/+/Adipoq-Cre+ mice of 12 weeks (n = 7–9/genotype) and 42 weeks (n = 4/genotype) were determined. (B) Eight-week-old Ptpmt1fl/fl/Adipoq-Cre+ (n = 5) and Ptpmt1+/+/Adipoq-Cre+ (n = 4) mice were deprived of food overnight and then injected intraperitoneally with glucose (2 g/kg). Tail vein blood was sampled for glucose measurements at the indicated time points. (C) Brown adipose and white adipose tissue sections prepared from 6-week-old Ptpmt1fl/fl/Adipoq-Cre+ and Ptpmt1+/+/Adipoq-Cre+ mice were processed for Hematoxylin and Eosin (H&E) staining. Representative pictures (3 mice/genotype) are shown.
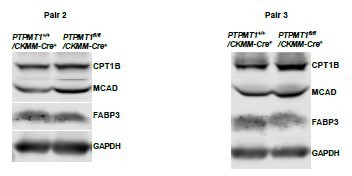
Author response image 1
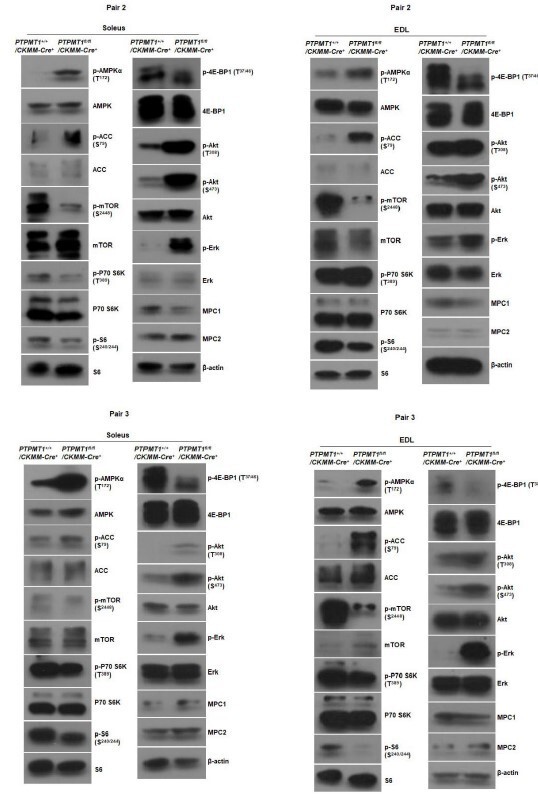
Western blotting data from additional two pairs of mice in Fig.2F.
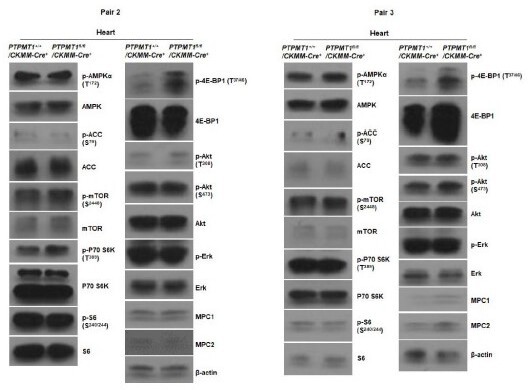
Author response image 2
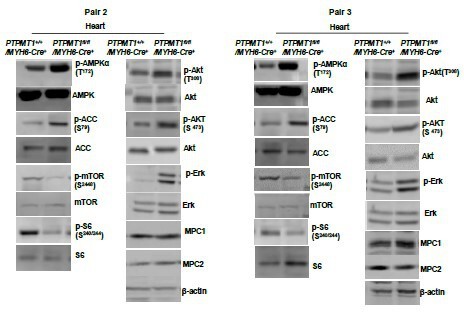
Western blotting data from additional two pairs of mice in Fig.6B.
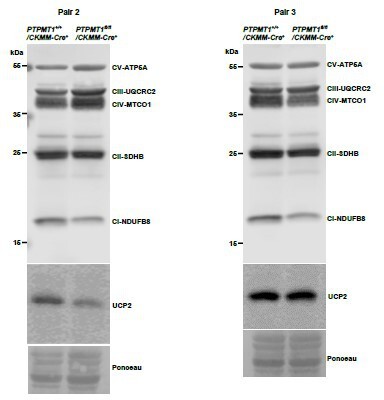
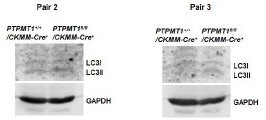
Author response image 3
Western blotting data from additional two pairs of mice in Supplementary Fig.2G.
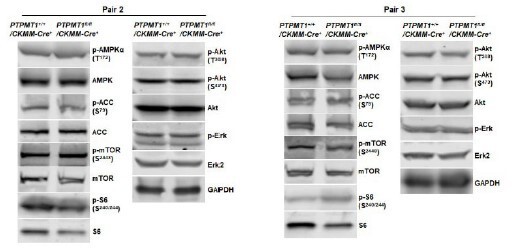
Author response image 4
Western blotting data from additional two pairs of mice in Supplementary Fig.3A.
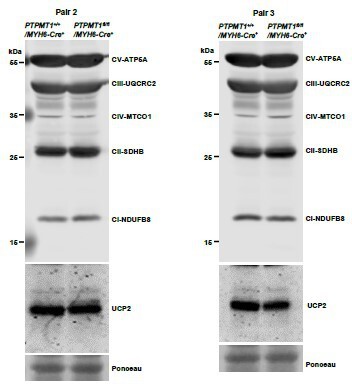
Author response image 5
Western blotting data from additional two pairs of mice in Supplementary Fig.3C.
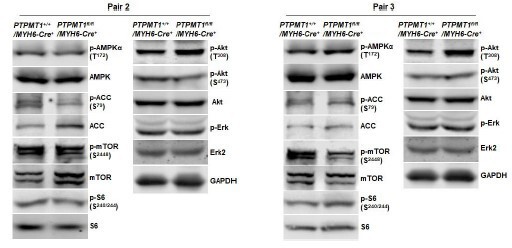
Author response image 6
Western blotting data from additional two pairs of mice in Supplementary Fig.3D.
Author response image 7
Western blotting data from additional two pairs of mice in Supplementary Fig.4F.
Author response image 8
Western blotting data from additional two pairs of mice in.
Author response image 9
Western blotting data from additional two pairs of mice in Supplementary Fig.7C.
Tables
Key resources table
| Reagent type (species) or resource | Designation | Source or reference | Identifiers | Additional information |
|---|---|---|---|---|
| Antibody | anti-phospho-Ampkα (Thr172) (40H9) (Rabbit monoclonal) | Cell Signaling Technology | Cat# 2535 | WB (1:1000) |
| Antibody | anti-Ampkα (D5A2) (Rabbit monoclonal) | Cell Signaling Technology | Cat# 5831 | WB (1:1000) |
| Antibody | anti-phospho-acetyl-CoA carboxylase (Ser79) (D7D11) (Rabbit monoclonal) | Cell Signaling Technology | Cat# 11818 | WB (1:1000) |
| Antibody | anti-acetyl-CoA carboxylase (C83B10) (Rabbit monoclonal) | Cell Signaling Technology | Cat# 3676 | WB (1:1000) |
| Antibody | anti-phospho-mTor (Ser2448) (D9C2) (Rabbit monoclonal) | Cell Signaling Technology | Cat# 5536 | WB (1:1000) |
| Antibody | anti-mTor (7C10) (Rabbit monoclonal) | Cell Signaling Technology | Cat# 2983 | WB (1:1000) |
| Antibody | anti-phospho-p70 S6 kinase (Thr389) (108D2) (Rabbit monoclonal) | Cell Signaling Technology | Cat# 9234 | WB (1:1000) |
| Antibody | anti-p70 S6 kinase (49D7) (Rabbit monoclonal) | Cell Signaling Technology | Cat# 2708 | WB (1:1000) |
| Antibody | anti-phospho-S6 ribosomal protein (Ser240/244) (D68F8) (Rabbit monoclonal) | Cell Signaling Technology | Cat# 5364 | WB (1:1000) |
| Antibody | anti-S6 ribosomal protein (5G10) (Rabbit monoclonal) | Cell Signaling Technology | Cat# 2217 | WB (1:1000) |
| Antibody | anti-β-actin (C-4) (Mouse monoclonal) | Santa Cruz Biotechnology | Cat# SC47778 | WB (1:1000) |
| Antibody | anti-phospho-4E-bp1 (Thr37/46) (236B4) (Rabbit monoclonal) | Cell Signaling Technology | Cat# 2855 | WB (1:1000) |
| Antibody | anti-phospho-Akt (Thr308) (D25E6) (Rabbit monoclonal) | Cell Signaling Technology | Cat# 13038 | WB (1:1000) |
| Antibody | anti-phospho-Akt (Ser473) (D9E) (Rabbit monoclonal) | Cell Signaling Technology | Cat# 4060 | WB (1:1000) |
| Antibody | anti-Akt (pan) (C67E7) (Rabbit monoclonal) | Cell Signaling Technology | Cat# 4691 | WB (1:1000) |
| Antibody | anti-phospho-Erk (E-4) (Mouse monoclonal) | Santa Cruz Biotechnology | Cat# SC7383 | WB (1:1000) |
| Antibody | anti-p44/42 Mapk (Erk1/2) (Rabbit monoclonal) | Cell Signaling Technology | Cat# 9102 | WB (1:1000) |
| Antibody | anti-Mpc1 (D2L9I) (Rabbit monoclonal) | Cell Signaling Technology | Cat# 14462 | WB (1:1000) |
| Antibody | anti-Mpc2 (D4I7G) (Rabbit monoclonal) | Cell Signaling Technology | Cat# 46141 | WB (1:1000) |
| Antibody | anti-total OXPHOS rodent WB antibody cocktail (Mouse monoclonal): anti-NDUFB8 (20E9DH10C12), anti-SDHB (21A11AE7), anti-UQCRC2 (13G12AF12BB11), anti-MTCO1 (1D6E1A8), and anti-ATP5A (15H4C4) | Abcam | Cat# ab110413 | WB (1:1000) |
| Antibody | anti-Ucp2 Rabbit Ab (C-20) | Santa Cruz Biotechnology | Cat# SC6525 | WB (1:1000) |
| Antibody | anti-Lc3a (Rabbit monoclonal) | Novus Biologicals | Cat# NB100-2331 | WB (1:500) |
| Antibody | anti-cleaved caspase-3 (Asp175) (Rabbit monoclonal) | Cell Signaling Technology | Cat# 9661 | IF (1:400) |
Additional files
Download links
A two-part list of links to download the article, or parts of the article, in various formats.
Downloads (link to download the article as PDF)
Open citations (links to open the citations from this article in various online reference manager services)
Cite this article (links to download the citations from this article in formats compatible with various reference manager tools)
Loss of Ptpmt1 limits mitochondrial utilization of carbohydrates and leads to muscle atrophy and heart failure in tissue-specific knockout mice
eLife 12:RP86944.
https://doi.org/10.7554/eLife.86944.3


