Importance of glutamine in synaptic vesicles revealed by functional studies of SLC6A17 and its mutations pathogenic for intellectual disability
- Chinese Institute for Brain Research, China
- Changping Laboratory, China
- Research Unit of Medical Neurobiology, Chinese Academy of Medical Sciences, China
- Laboratory of Neurochemical Biology, PKU-IDG/McGovern Institute for Brain Research, Peking-Tsinghua Center for Life Sciences, School of Life Sciences, Department of Molecular and Cellular Pharmacology, School of Pharmaceutical Sciences, School of Chemistry and Chemical Engineering, Peking University, China
- Institute of Molecular Physiology, Shenzhen Bay Laboratory, China
- Capital Medical University, China
Figures
Figure 1 with 1 supplement
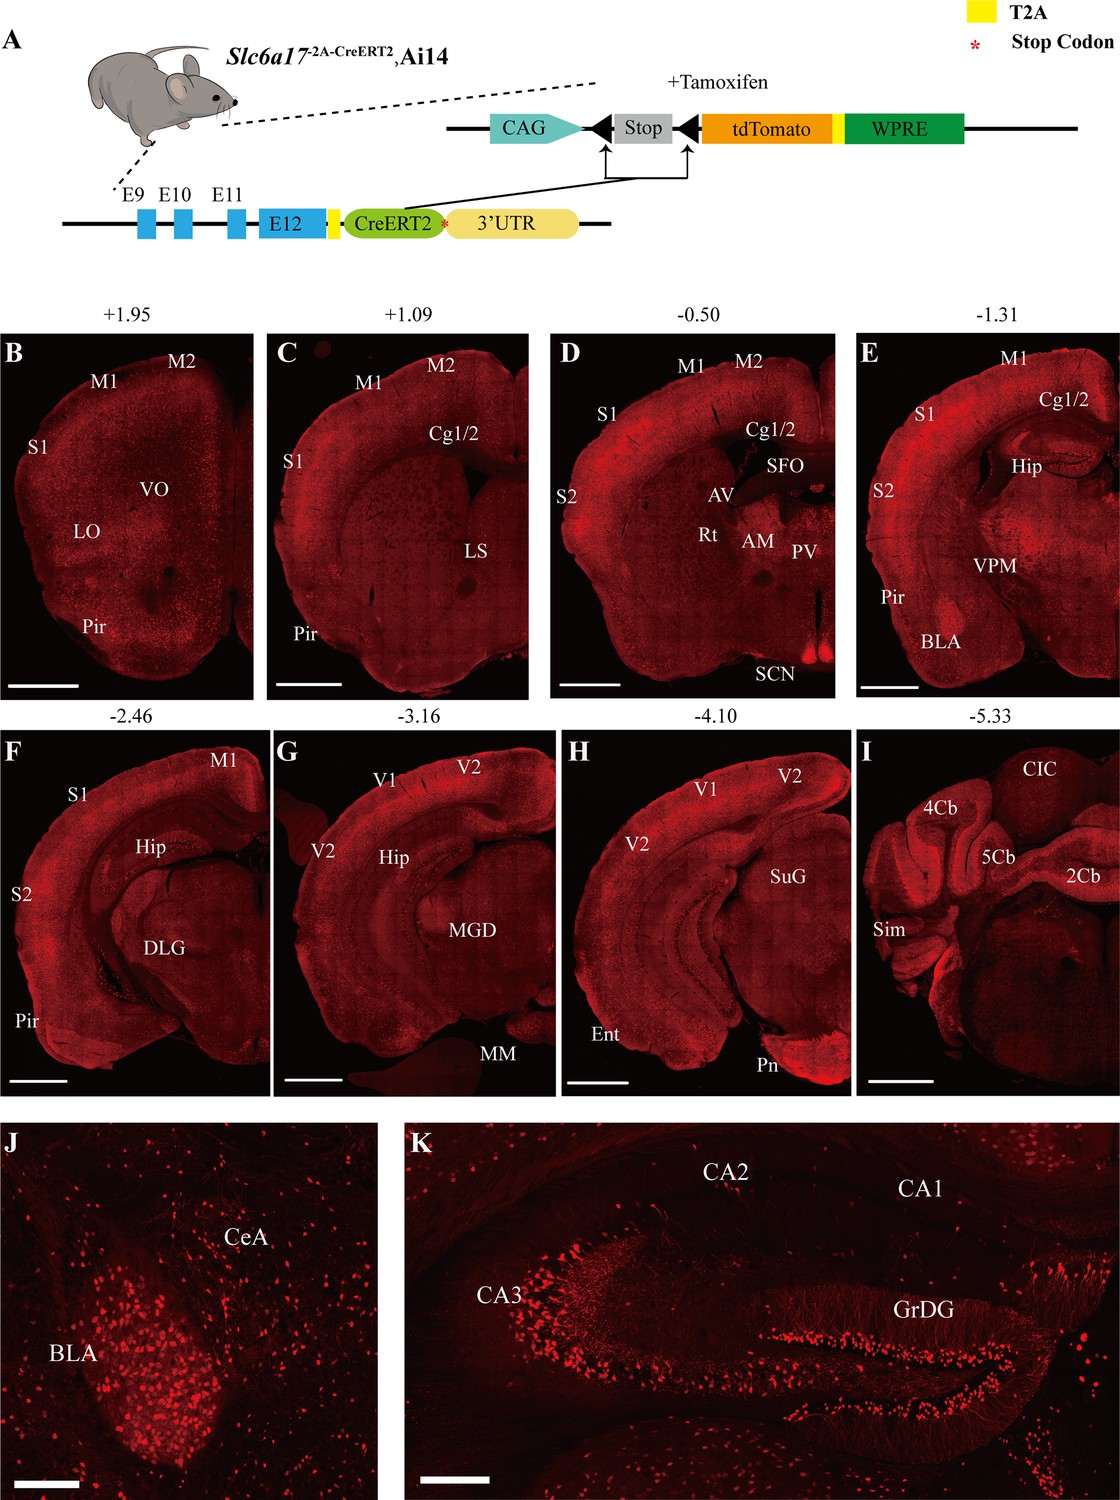
Slc6a17 expression in the mouse brain.
(A) A schematic diagram illustrating the strategy for the generation of Slc6a17-2A-CreERT2 mice. Crossing of Slc6a17-2A-CreERT2 mice with Ai14 (LSL-tdTomato) mice allowed specific labeling of Slc6a17-expressing neuron after tamoxifen injection. More details in Figure 1—figure supplement 1A. (B–I) Representative coronal sections of Slc6a17-2A-CreERT2::Ai14 mice. Numbers above images indicate the anteroposterior position of the section from Bregma in millimeters (mm), based on Paxinos and Franklin, 2019. Scale bars = 1 mm. (J) Slc6a17-positive neurons in the basolateral amygdaloid nucleus (BLA) and the central amygdaloid nucleus (CeA). Scale bars = 100 μm. (K) Hippocampal expression of Slc6a17. Slc6a17-positive neurons are densely distributed in the granule cell layer of the dentate gyrus (GrDG), and CA3, with little expression in the CA1 and the CA2. Scale bars = 200 μm. Abbreviations: 2Cb, lobule 2 of the cerebellar vermis; 3Cb, lobule 3 of the cerebellar vermis; 4/5Cb, lobule 4 and 5 of the cerebellar vermis; AON, accessory olfactory nucleus; AM, anteromedial thalamic nucleus; AV, anteroventral thalamic nucleus; BLA, basolateral amygdaloid nucleus; Ent, entorhinal cortex; CB, cerebellum; Cg1/2, cingulate ccortex; CIC, central nucleus of the inferior colliculus; Ctx, cortex; Hip, hippocampus; LO, lateral orbital cortex; LS, lateral septal nucleus; M1, primary motor cortex; M2, secondary motor cortex; OB, main olfactory bulb; Pir, piriform cortex; Pn, pontine nuclei; Rt, reticular thalamic nucleus; S1, primary somatosensory cortex; S2, secondary somatosensory cortex; SCN, suprachiasmatic nucleus; SFO, subfornical organ; SuG, superficial gray layer of superior colliculus; Sim, simple lobule; Th, thalamus; V1, primary visual cortex; V2, secondary visual cortex; VPM, ventral posteromedial nucleus.
Figure 1—figure supplement 1
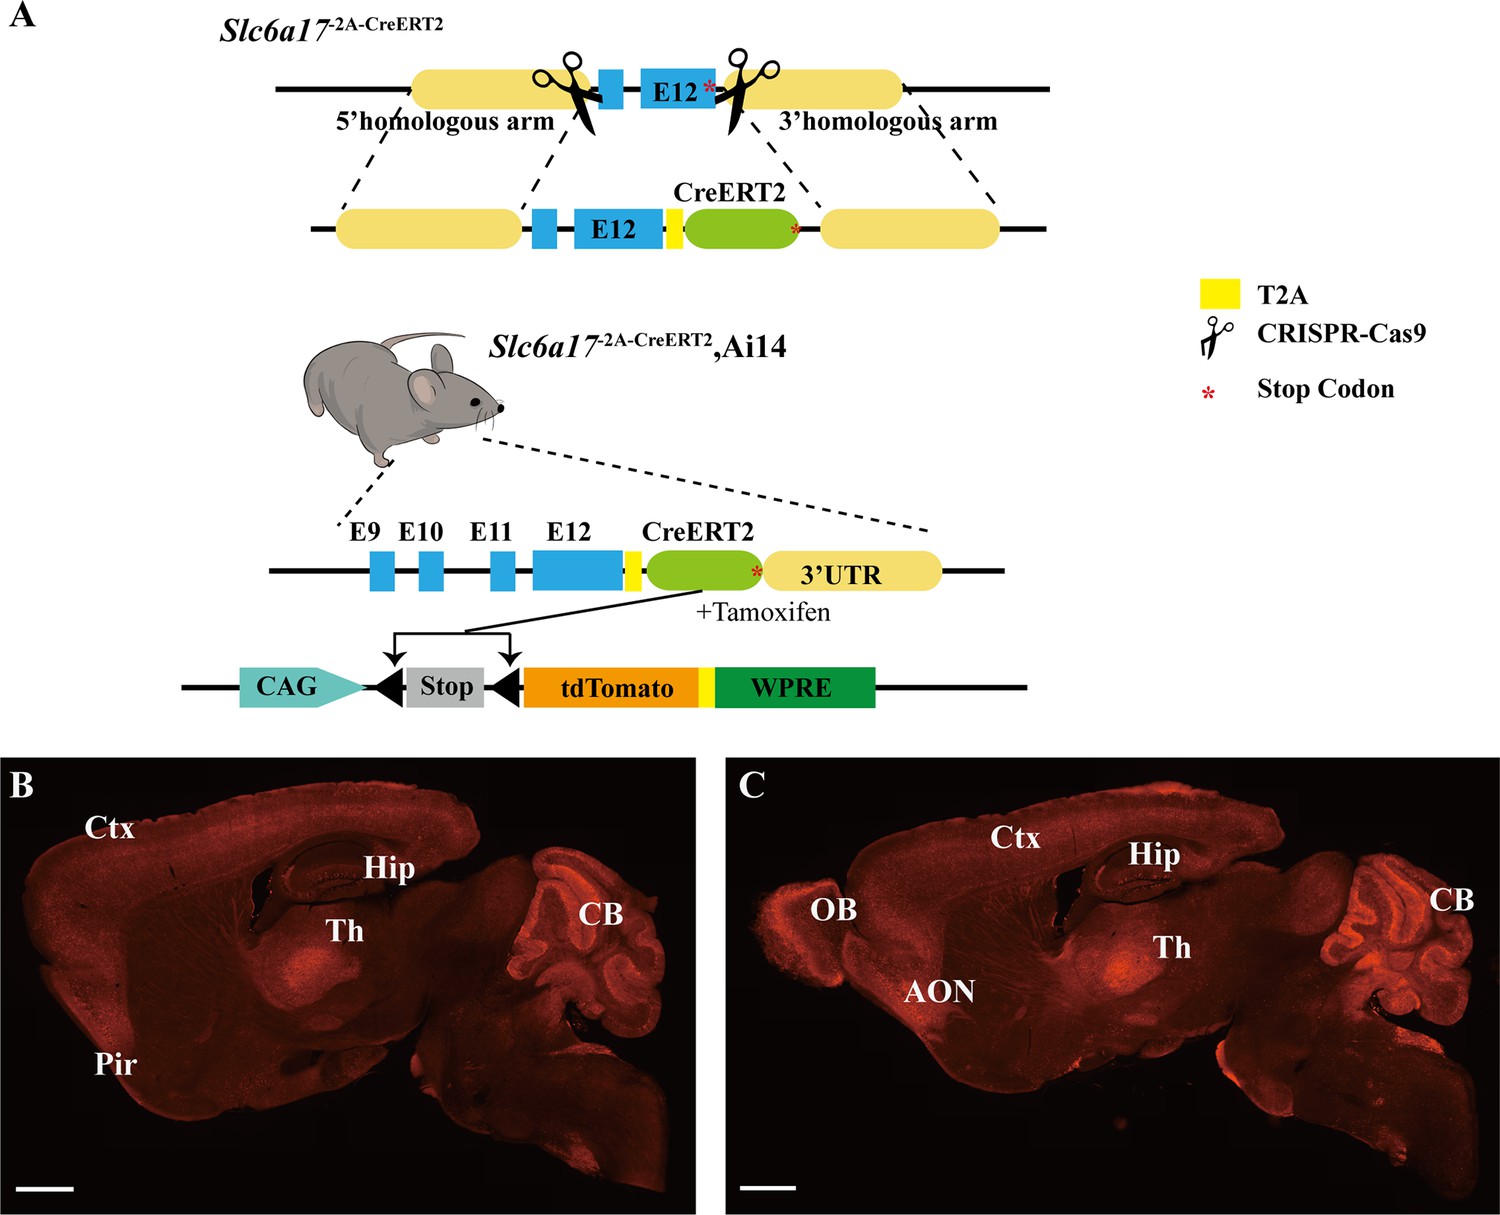
Generation of Slc6a17 knock-in mice.
(A) A schematic diagram illustrating the knock-in strategy for generating Slc6a17-2A-CreERT2 KI mice. This CRISPR/Cas9-mediated strategy allowed CreERT2 to be co-expressed with SLC6A17 protein fused in frame with a T2A sequence. Crossing Slc6a17-2A-CreERT2 mice with Ai14 (LSL-tdTomato) mice specifically labeled Slc6a17-expressing cells after tamoxifen injection. (B, C) Representative sagittal sections of Slc6a17-2A-CreERT2::Ai14 mouse brains at postnatal day 56. Scale bars = 1 mm. (D) A schematic diagram illustrating the knock-in strategy for generating Slc6a17-HA-2A-iCre KI mice. Slc6a17 was fused in-frame with 3 repeats of the HA tag, T2A, and iCre.
Figure 2 with 2 supplements

Slc6a17-KO mice exhibited impaired memory formation.
(A) A schematic diagram illustrating the knock-out strategy for generating Slc6a17-KO mice by CRISPR/Cas9. Exon 2 encoding the first 99 amino acids of Slc6a17 was deleted. More details in Figure 3—figure supplement 1A. (B) A diagram of experiments for contextual and cued fear conditioning (n = 16, 23, and 18 for Slc6a17+/+, Slc6a17+/-, and Slc6a17-/-, respectively). Detailed description in ‘Experimental procedures.’ (C) Slc6a17-/- mice exhibited a significant decrease in freezing behavior in both cued and contextual fear conditioning (day 2 context a, p=0.0062 for Slc6a17+/+ vs. Slc6a17-/-, p<0.0001 for Slc6a17+/- vs. Slc6a17-/-; Day 3 tone, p=0.0093 for Slc6a17+/+ vs. Slc6a17-/-, p=0.0012 for Slc6a17+/- vs. Slc6a17-/-). (D) A diagram of experiments for modified Morris water maze task (n = 15, 18, and 16 for Slc6a17+/+, Slc6a17+/-, and Slc6a17-/-, respectively). Detailed description in ‘Experimental procedures.’ (E) Latency to find the hidden platform during the training session. Slc6a17-/- mice differed significantly from Slc6a17+/+ and Slc6a17+/- mice (two-way ANOVA; main effect of training day: F (4.681, 210.7) = 46.55, p<0.0001; main effect of genotype: F (2, 45) = 21.53, p<0.0001; main effect of training day × genotype: F (12, 270) = 3.762, p<0.0001; Tukey’s multiple comparisons test: day 2, p=0.0004 for Slc6a17+/+ vs. Slc6a17-/-, p=0.0002 for Slc6a17+/- vs. Slc6a17-/-; day 5, p=0.0002 for Slc6a17+/+ vs. Slc6a17-/-, p=0.008 for Slc6a17+/- vs. Slc6a17-/-; day 6, p=0.0002 for Slc6a17+/+ vs. Slc6a17-/-, p=0.0027 for Slc6a17+/- vs. Slc6a17-/-; day 7, p<0.0001 for Slc6a17+/+ vs. Slc6a17-/-, p=0.0005 for Slc6a17+/- vs. Slc6a17-/-). (F) Representative swimming traces of each genotype. (G) Percentage of time spent in the target quadrant was significantly different (p=0.0004 for Slc6a17+/+ vs. Slc6a17-/-, p<0.0001 for Slc6a17+/- vs. Slc6a17-/-). (H) Number of crossings through the platform area was significantly different (p=0.0194 for Slc6a17+/+ vs. Slc6a17-/-, p=0.0054 for Slc6a17+/- vs. Slc6a17-/-). Here and hereafter, data in the figure are presented as the mean ± SEM, with * indicating p<0.05, ** indicating p<0.01, *** indicating p<0.001, and **** indicating p<0.0001.
-
Figure 2—source data 1
Data points for Figure 2C, E, G, and H.
- https://cdn.elifesciences.org/articles/86972/elife-86972-fig2-data1-v1.xlsx
Figure 2—figure supplement 1
Phenotypical analysis of Slc6a17-KO mice.
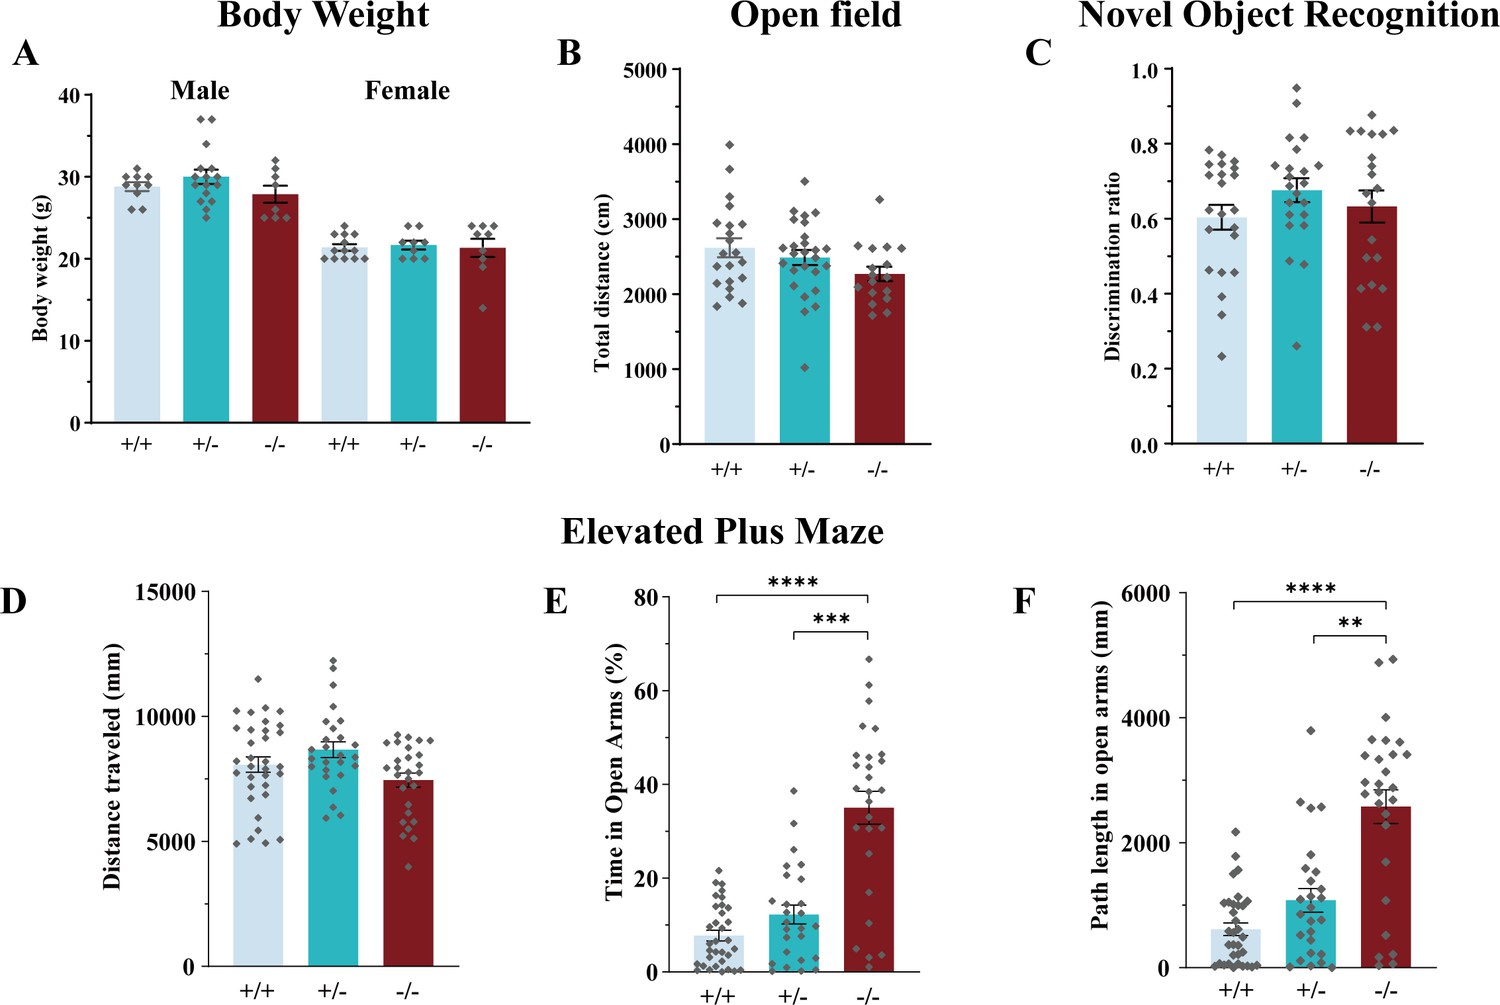
(A) Slc6a17-KO mice were not significantly different from the WT in body weight at the age of 10 wk, regardless of sex (male: n = 10, 16, and 8 for Slc6a17+/+, Slc6a17+/-, and Slc6a17-/-, respectively, p=0.8147 for Slc6a17+/+ vs. Slc6a17-/-, p=0.3456 for Slc6a17+/- vs. Slc6a17-/-; female: n = 13, 9, and 9 for Slc6a17+/+, Slc6a17+/-, and Slc6a17-/-, respectively, p>0.9999 for Slc6a17+/+ vs. Slc6a17-/-, p=0.9896 for Slc6a17+/- vs. Slc6a17-/-). (B) Locomotor activities in the open field test were not significantly different among the three genotypes (n = 21, 26, and 17 for Slc6a17+/+, Slc6a17+/-, and Slc6a17-/-, respectively, p=0.0987 for Slc6a17+/+ vs. Slc6a17-/-, p=0.3233 for Slc6a17+/- vs. Slc6a17-/-). (C) Novel object recognition (NOR) was not significantly different among the three genotypes (n = 22, 22, and 20 for Slc6a17+/+, Slc6a17+/-, and Slc6a17-/-, respectively, p=0.9318 for Slc6a17+/+ vs. Slc6a17-/-, p=0.7978 for Slc6a17+/- vs. Slc6a17-/-). (D–F) Slc6a17 KO mutants had lower levels of anxiety in elevated plus maze test (n = 33, 26, and 27 for Slc6a17+/+, Slc6a17+/-, and Slc6a17-/-, respectively): overall locomotion was not significantly different (D, p=0.3639 for Slc6a17+/+ vs. Slc6a17-/-, p=0.053 for Slc6a17+/- vs. Slc6a17-/-); percentage of time spend in open arms was significantly increased in Slc6a17-/- mice (E, p<0.0001 for Slc6a17+/+ vs. Slc6a17-/-, p<0.0001 for Slc6a17+/- vs. Slc6a17-/-); the travel distance in open arms was significantly increased in Slc6a17-/- mice (p<0.0001 for Slc6a17+/+ vs. Slc6a17-/-, p=0.0001 for Slc6a17+/- vs. Slc6a17-/-).
-
Figure 2—figure supplement 1—source data 1
Data points for Figure 2—figure supplement 1A–F.
- https://cdn.elifesciences.org/articles/86972/elife-86972-fig2-figsupp1-data1-v1.xlsx
Figure 2—figure supplement 2
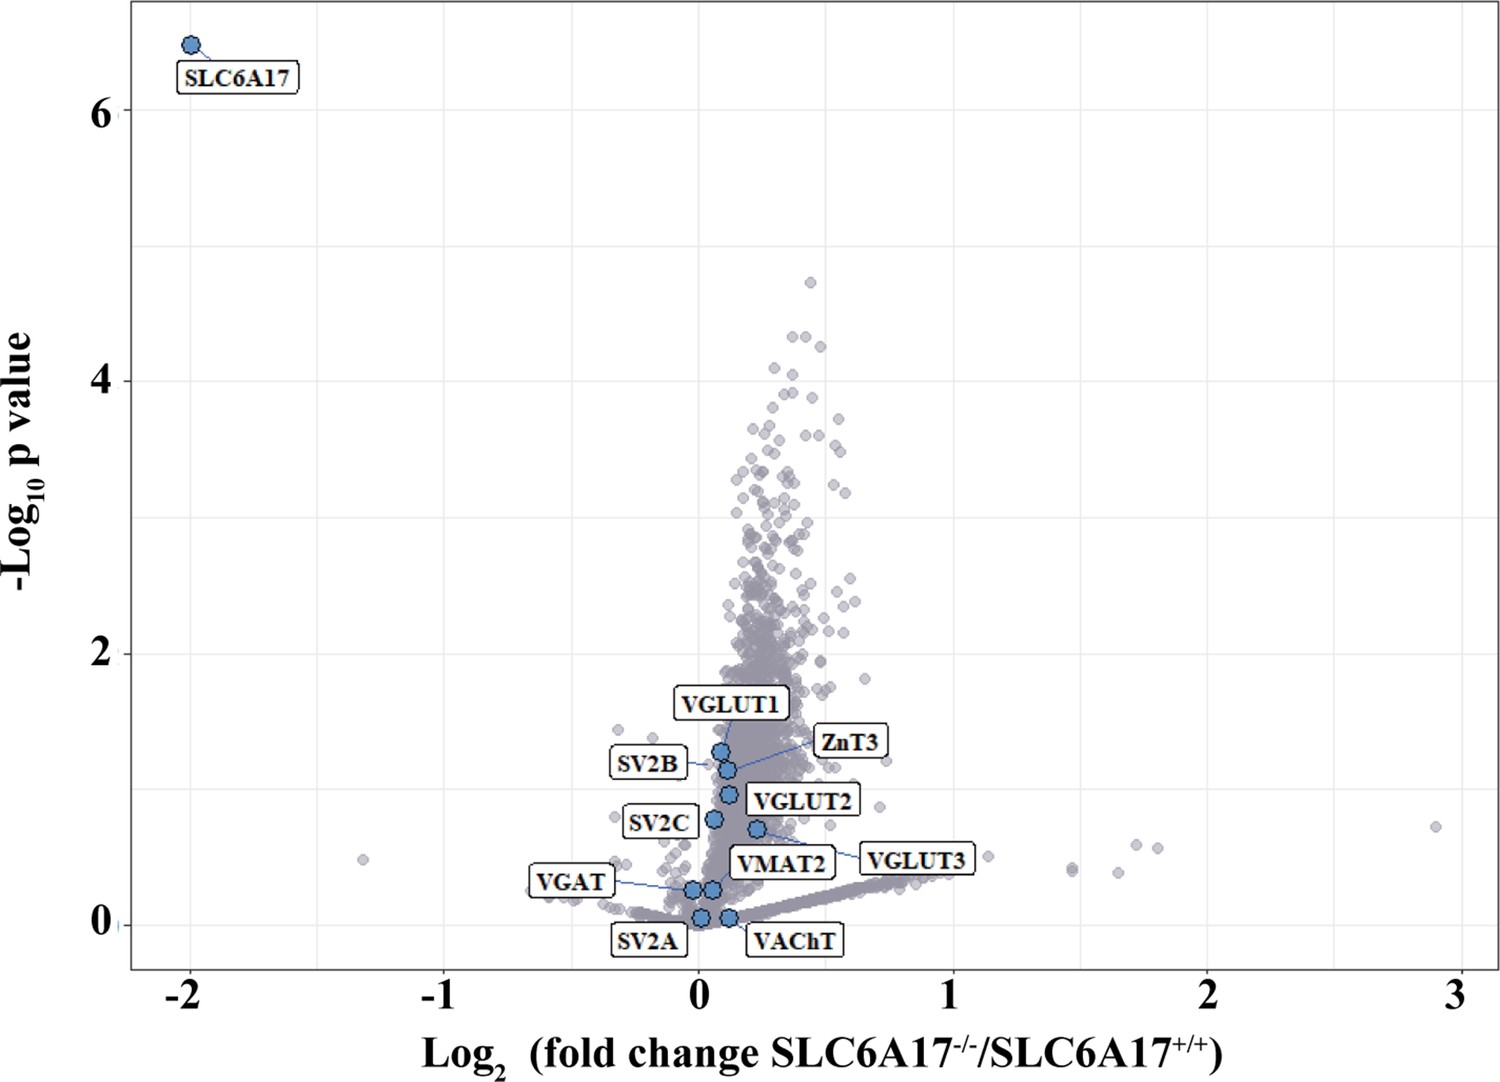
Mass spectrometry (MS) analysis of Slc6a17 KO mice.
TMT-labeled quantitative synaptic vesicle (SV) proteomics was performed in Slc6a17-KO mice. Briefly, SVs were immunoisolated from LP2 fraction of WT and Slc6a17-KO mice by anti-Syp. SV proteins from different samples were digested and then labeled separately by TMT regents (detailed description in ‘Experimental procedures’). Volcano plot showing SV proteins different between Slc6a17-/- mice and Slc6a17+/+ mice. The y axis shows p-values in log10 and the x axis shows the log2 of the ratio of the level of a protein immunoisolated by anti-Syp from Slc6a17-/- mice vs. that from Slc6a17+/+ mice. SLC6A17 was the only transporter significantly decreased in Slc6a17-KO mice. Known vesicular transporters are highlighted by blue cycles.
-
Figure 2—figure supplement 2—source data 1
Data points for Figure 2—figure supplement 2.
- https://cdn.elifesciences.org/articles/86972/elife-86972-fig2-figsupp2-data1-v1.xlsx
Figure 3 with 2 supplements
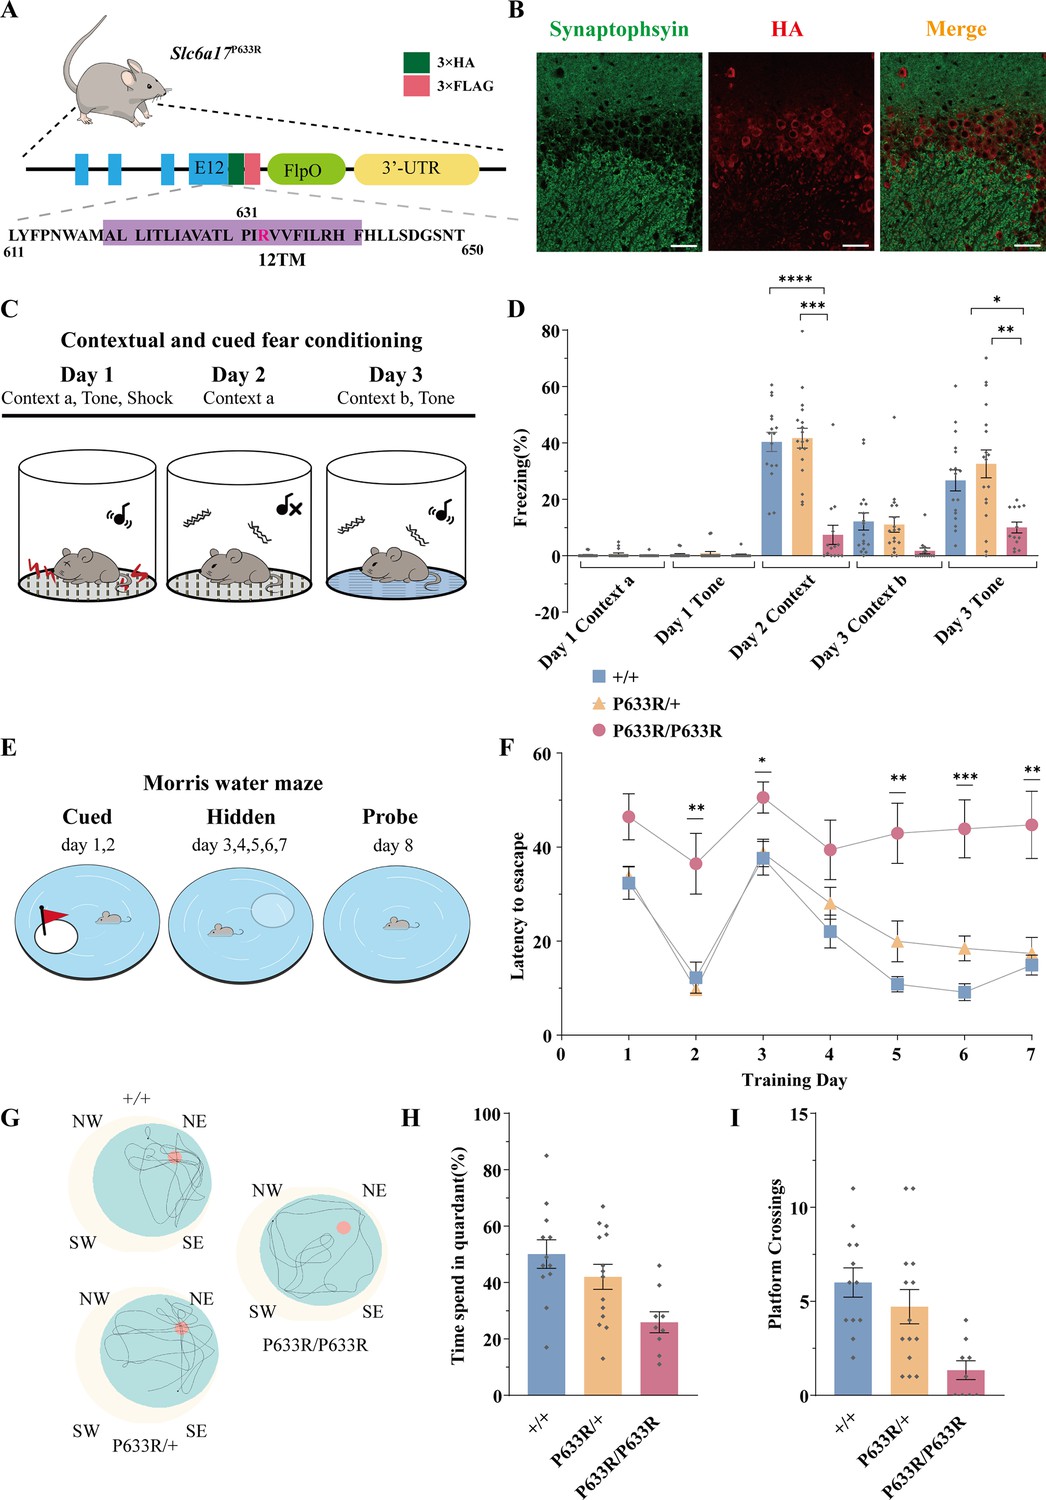
Deficient memory in Slc6a17P633R mice.
(A) A diagram illustrating the knock-in strategy for Slc6a17 with a pathogenic point mutation (Slc6a17P633R). It was tagged with three repeats of the HA epitope and three repeats of the FLAG epitope. More details in Figure 3—figure supplement 1B. (B) Immunocytochemistry of Slc6a17P633R mouse brains with the anti-HA antibody showed that the subcellular localization of SLC6A17P633R-HA did not co-localized with synaptophysin. It was present in the cytoplasm. Representative view of CA3 is shown. Scale bar = 50 μm. (C) Experiments for contextual and cued fear conditioning (n = 17, 18, and 14 for Slc6a17+/+, Slc6a17P633R/+, and Slc6a17P633R/P633R, respectively). Detailed description in ‘Experimental procedures.’ (D) Slc6a17P633R homozygous mutants exhibited significant decrease of freezing behavior in both cued and contextual fear conditioning (day 2 context A, p<0.0001 for Slc6a17+/+ vs. Slc6a17P633R/P633R, p<0.0001 for Slc6a17P633R/+ vs. Slc6a17P633R/P633R; Day 3 tone, p=0.0017 for Slc6a17+/+ vs. Slc6a17P633R/P633R, p=0.0009 for Slc6a17P633R/+ vs. Slc6a17P633R/P633R). (E) Cartoon figure of experiments for Morris water maze task (n = 12, 15, and 9 for Slc6a17+/+, Slc6a17P633R/+, and Slc6a17P633R/P633R, respectively). Detailed description in ‘Experimental procedures.’ (F) Latency to find the hidden platform during the training session. Slc6a17P633R/P633R mice showed significantly different learning curve from Slc6a17+/+ and Slc6a17P633R/+ mice (two-way ANOVA; main effect of training day: F (4.381, 144.6) = 20.02, p<0.0001; main effect of genotype: F (2, 33) = 22.65, p<0.0001; main effect of training day × genotype: F (12, 198) = 2.389, p=0.0067; Tukey’s multiple-comparisons test: day 2, p=0.0150 for Slc6a17+/+ vs. Slc6a17P633R/P633R, p=0.0078 for Slc6a17P633R/+ vs. Slc6a17P633R/P633R; day 3, p=0.0403 for Slc6a17+/+ vs. Slc6a17P633R/P633R, p=0.0388 for Slc6a17P633R/+ vs. Slc6a17P633R/P633R; day 5, p=0.0023 for Slc6a17+/+ vs. Slc6a17P633R/P633R, p=0.0243 for Slc6a17P633R/+ vs. Slc6a17P633R/P633R; day 6, p=0.0199 for Slc6a17+/+ vs. Slc6a17P633R/+,p=0.0010 for Slc6a17+/+ vs. Slc6a17P633R/P633R, p=0.0077 for Slc6a17P633R/+ vs. Slc6a17P633R/P633R; day 7, p=0.0074 for Slc6a17+/+ vs. Slc6a17P633R/P633R, p=0.0129 for Slc6a17P633R/+ vs. Slc6a17P633R/P633R). (G) Representative swimming traces of each genotype. (H) Percentage of time spent in the target quadrant was significantly different (p=0.0031 for Slc6a17+/+ vs. Slc6a17P633R/P633R, p=0.0325 for Slc6a17P633R/+ vs. Slc6a17P633R/P633R). (I) Number of crossings through the platform area was significantly different (p=0.0003 for Slc6a17+/+ vs. Slc6a17P633R/P633R, p=0.0123 for Slc6a17P633R/+ vs. Slc6a17P633R/P633R). Data in the figure are presented as the mean ± SEM, with * indicating p<0.05, ** indicating p<0.01, *** indicating p<0.001, and **** indicating p<0.0001.
-
Figure 3—source data 1
Data points for Figure 3D, H, and I.
- https://cdn.elifesciences.org/articles/86972/elife-86972-fig3-data1-v1.zip
Figure 3—figure supplement 1
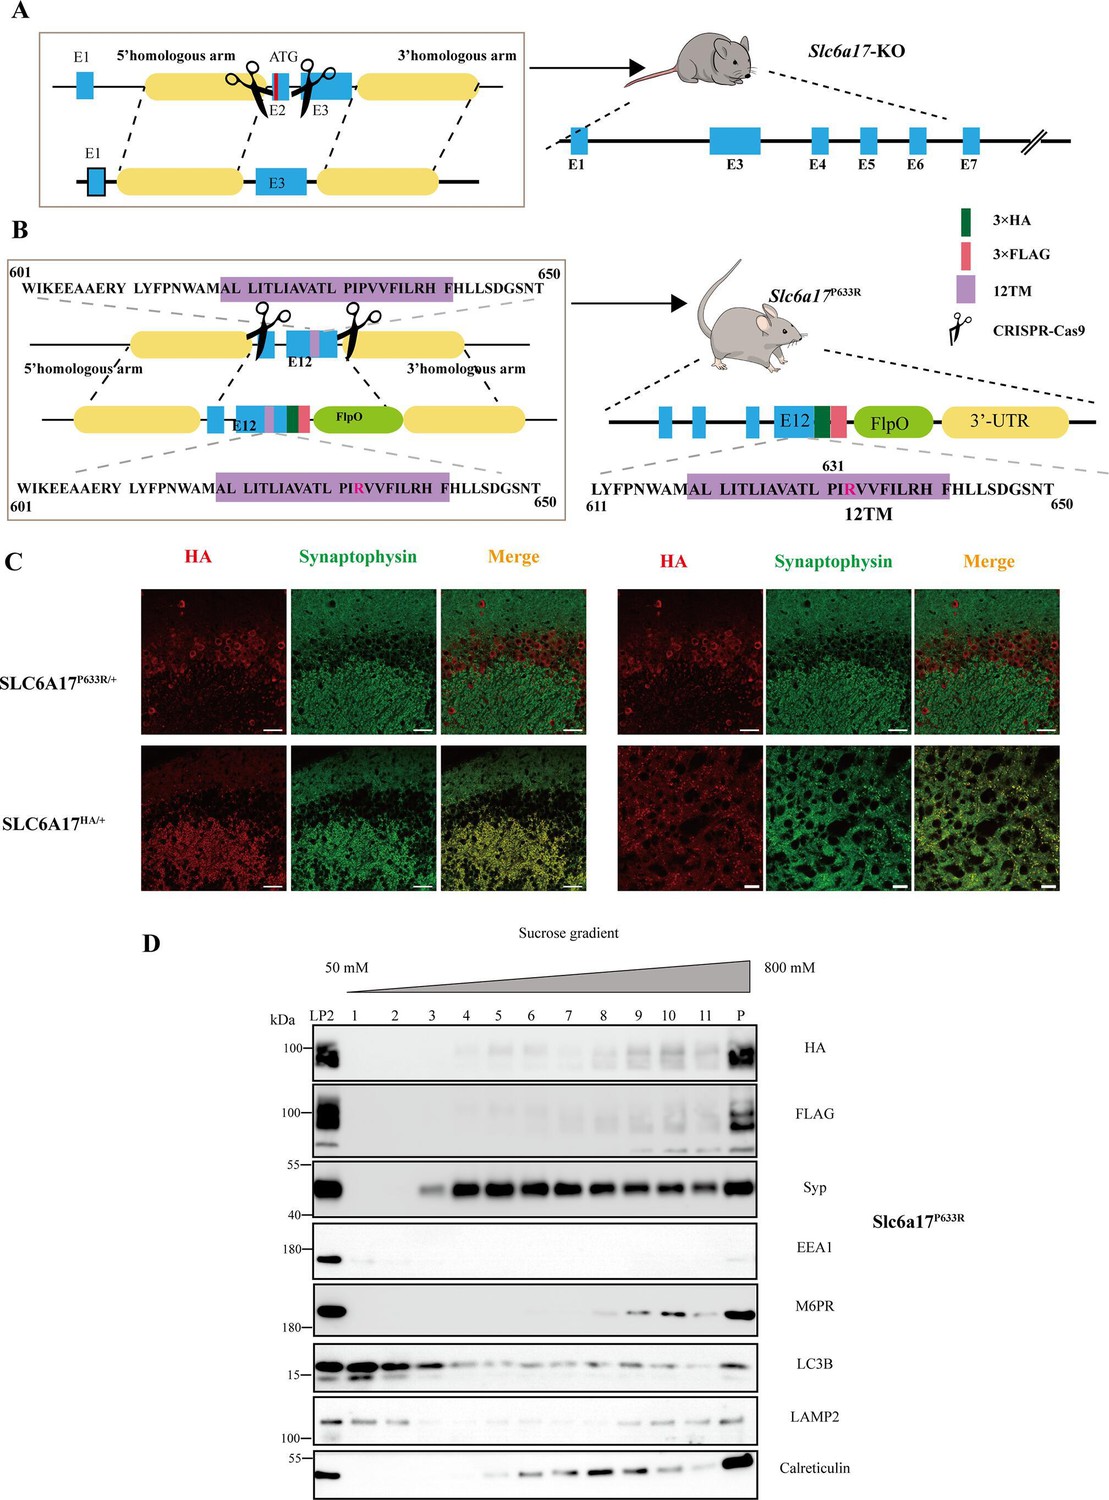
Generation of Slc6a17 mutant mice.
(A) A schematic diagram illustrating the strategy for the generation of Slc6a17-KO mice by CRISPR/Cas9. Exon 2 encoding the first 99 amino acids of Slc6a17 was deleted. (B) A schematic diagram illustrating the knock-in strategy of generating Slc6a17P633R point mutation mice by CRISPR/Cas9. The mutated exon 12 was exchanged with endogenous exon 12, while both the HA- and the FLAG- tags were fused in-frame to the C terminus of the mutated Slc6a17. (C) Confocal images of the hippocampal CA3 region (left) and anterior thalamus (right) in both Slc6a17HA/+ and Slc6a17P633R/+ mice after immunocytochemistry with anti-Syp and anti-HA antibodies. Scale bar = 10 μm. (D) Sucrose gradient analysis of Slc6a17P633R-HA LP2 fraction. SLC6A17P633R protein is indicated by HA and FLAG tags. HA and FLAG signals were mostly present in the LP2 input but not in layers 2–5 of the sucrose gradient, which were SV rich as shown by Syp and Syb2 positive immunoreactivities. On the other hand, SLC6A17G162R protein is still present in layers 2–5.
-
Figure 3—figure supplement 1—source data 1
Original files of the full raw unedited blots for Figure 3—figure supplement 1D.
- https://cdn.elifesciences.org/articles/86972/elife-86972-fig3-figsupp1-data1-v1.zip
-
Figure 3—figure supplement 1—source data 2
Uncropped blots with the relevant bands lablled for Figure 3—figure supplement 1D.
- https://cdn.elifesciences.org/articles/86972/elife-86972-fig3-figsupp1-data2-v1.zip
Figure 3—figure supplement 2
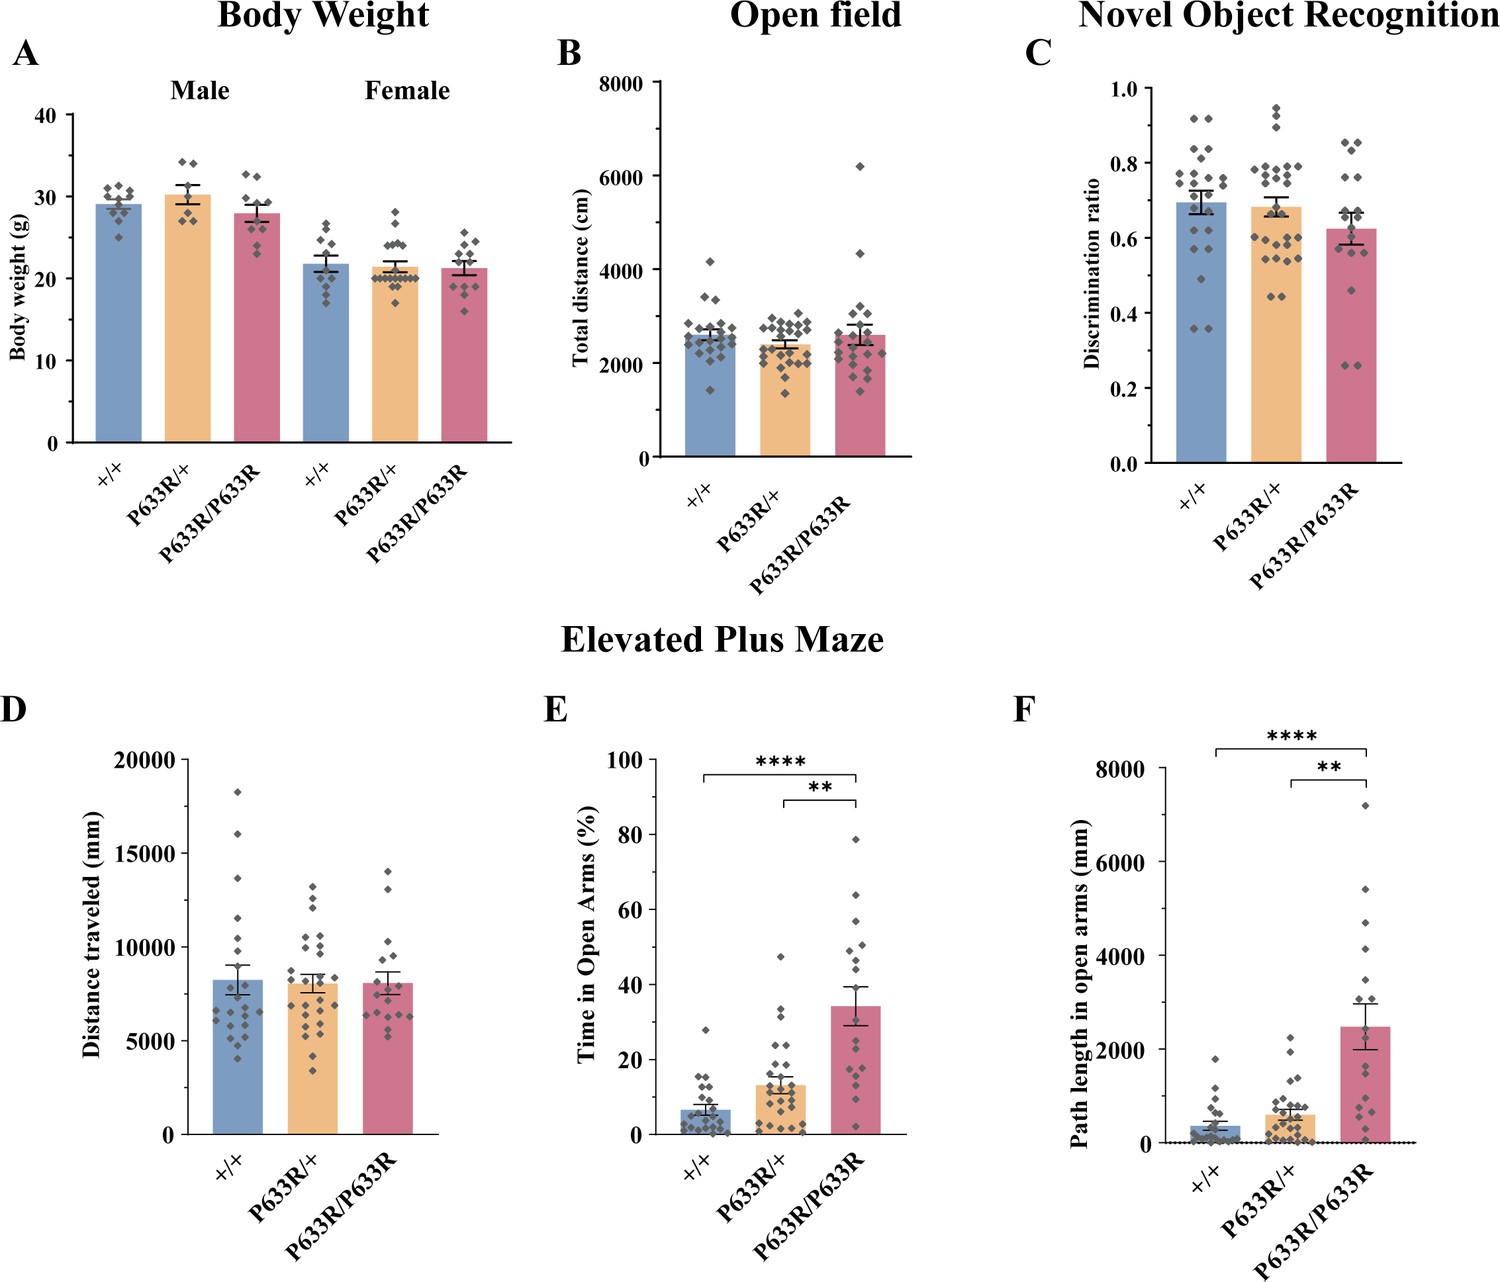
Phenotypical analysis of Slc6a17P633R mice.
(A) Slc6a17P633R mice were not significantly different the WT in body weight at the age of 10 wk, regardless of sex (male: n = 11, 7, and 10 for Slc6a17+/+, Slc6a17P633R/+, and Slc6a17P633R/P633R, respectively; p=0.7243 for Slc6a17+/+ vs. Slc6a17P633R/P633R, p=0.4078 for Slc6a17P633R/+ vs. Slc6a17P633R/P633R; female: n = 11, 19, and 12 for Slc6a17+/+, Slc6a17P633R/+, Slc6a17P633R/P633R, respectively; p=0.9698 for Slc6a17+/+ vs. Slc6a17P633R/P633R, p=9,982 for Slc6a17P633R/+ vs. Slc6a17P633R/P633R). (B) Locomotor activities of Slc6a17P633R mice were not significantly different from the WT (n = 23, 28, and 17 for Slc6a17+/+, Slc6a17P633R/+, Slc6a17P633R/P633R, respectively; p>0.9999 for Slc6a17+/+ vs. Slc6a17P633R/P633R, p=0.7803 for Slc6a17P633R/+ vs. Slc6a17P633R/P633R). (C) NOR was not significantly different among Slc6a17P633R mutant and WT mice (n = 23, 28, and 17 for Slc6a17+/+, Slc6a17P633R/+, Slc6a17P633R/P633R, respectively; p=0.4728 for Slc6a17+/+ vs. Slc6a17P633R/P633R, p=0.5776 for Slc6a17P633R/+ vs. Slc6a17P633R/P633R). (D–F) Slc6a17P633R homozygous mutants had lower level of anxiety in elevated plus maze (n = 22, 26, and 17 for Slc6a17+/+, Slc6a17P633R/+, Slc6a17P633R/P633R, respectively): overall locomotion was not significantly different (D, p=0.9974 for Slc6a17+/+ vs. Slc6a17P633R/P633R, p>0.9999 for Slc6a17P633R/+ vs. Slc6a17P633R/P633R); percentage of time spend in open arms was significantly increased in homozygous Slc6a17P633R mutants (E, p=0.0002 for Slc6a17+/+ vs. Slc6a17P633R/P633R, p=0.0035 for Slc6a17P633R/+ vs. Slc6a17P633R/P633R); travel distance in open arms was significantly increased in homozygous Slc6a17P633R mutants (F, p=0.0016 for Slc6a17+/+ vs. Slc6a17P633R/P633R, p=0.0044 for Slc6a17P633R/+ vs. Slc6a17P633R/P633R).
-
Figure 3—figure supplement 2—source data 1
Data points for Figure 3—figure supplement 2A–F.
- https://cdn.elifesciences.org/articles/86972/elife-86972-fig3-figsupp2-data1-v1.xlsx
Figure 4 with 2 supplements
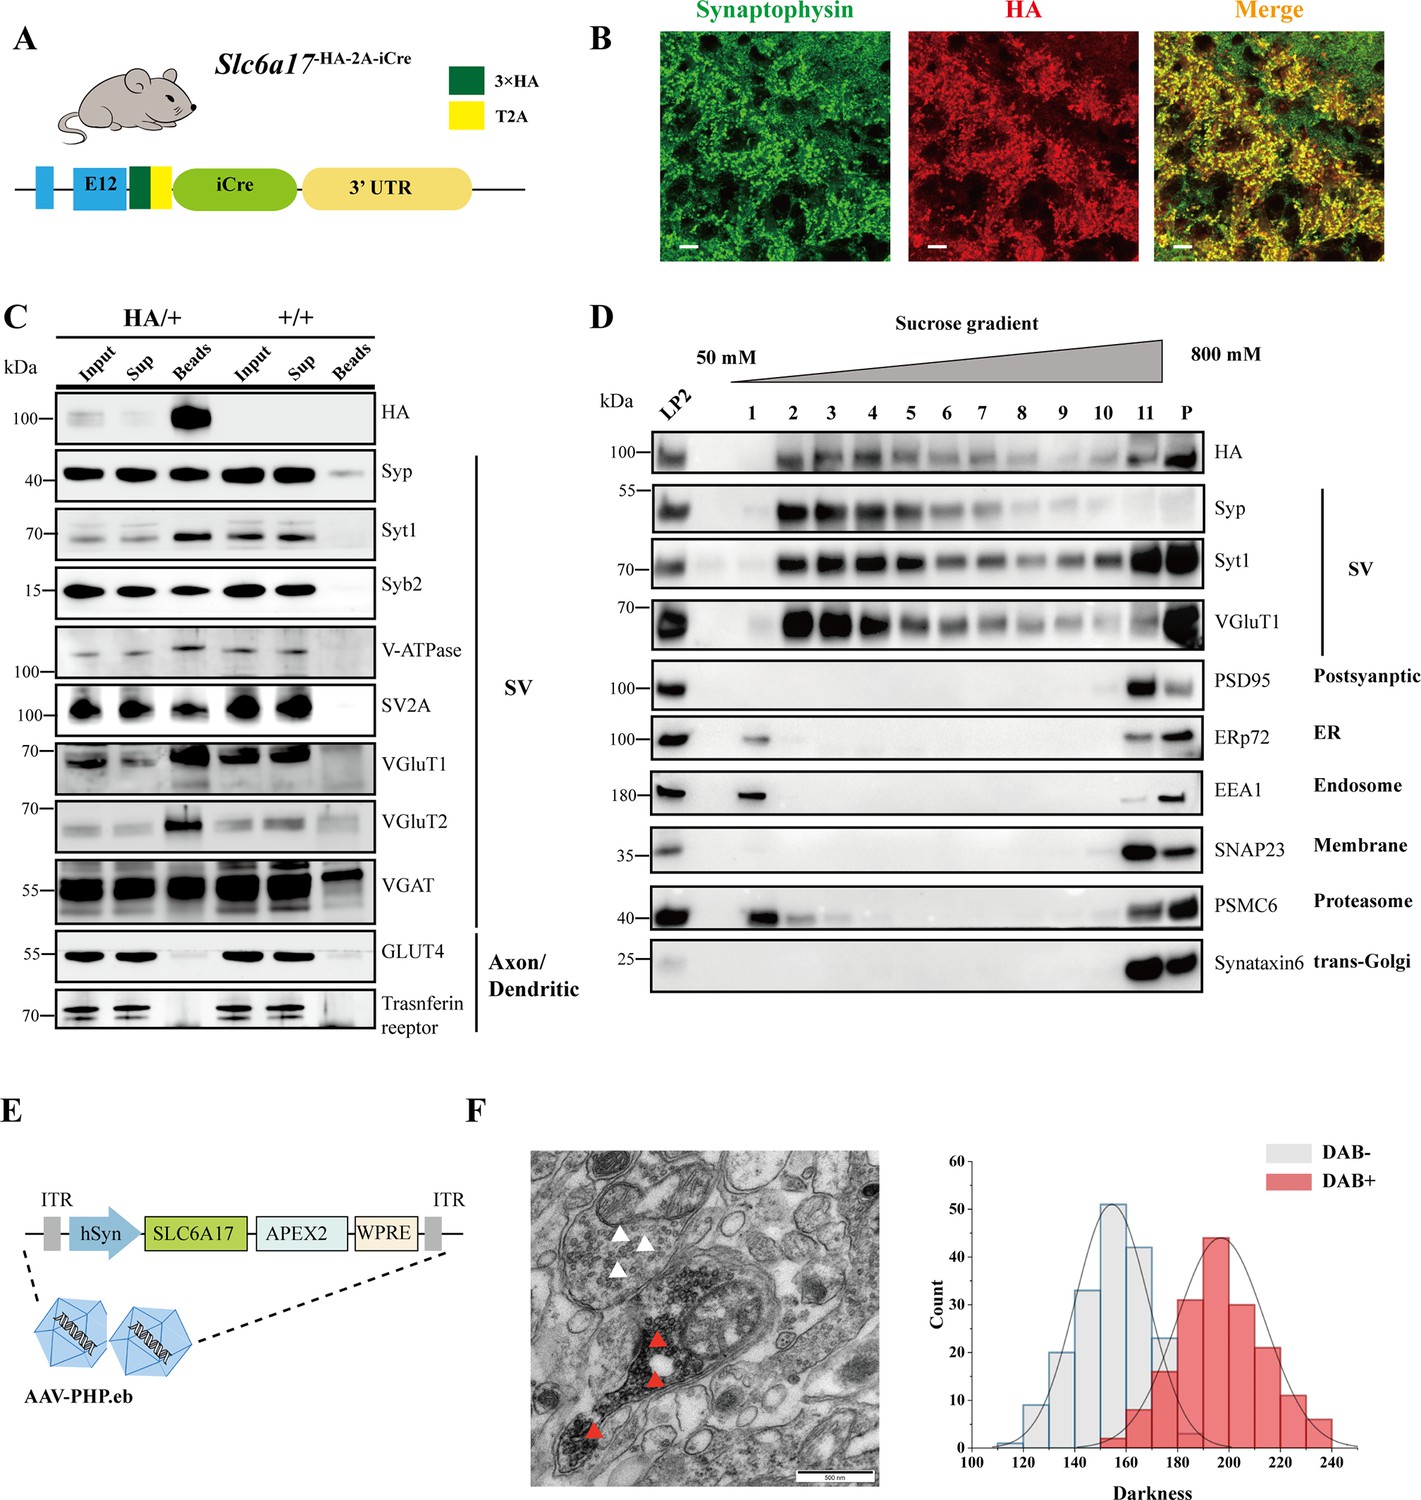
Biochemical and genetically assisted electron microscopy (EM) validation of the vesicular localization of SLC6A17.
(A) A schematic diagram illustrating the knock-in strategy for generating Slc6a17-HA-2A-iCre mice. More details in Figure 1—figure supplement 1D. (B) Higher magnification views of co-immunostaining by anti-Syp and anti-HA antibodies in the hippocampus. Scale bar = 10 μm. (C) Immunoisolation of SLC6A17-HA containing vesicles by the anti-HA antibody coated on magnetic beads. SLC6A17-HA fraction was positive for Syp, Syt1, Syb2, v-ATPase, VGluT1, VGluT2, and vGAT, but negative for GluT4 and transferrin receptor. (D) Further purification of the LP2 fraction by sucrose gradient showed that SLC6A17-HA was co-immunoisolated with Syp, Syt1, and VGluT1, but not PSD95, ERp72, EEA1, SNAP23, PSMC6, or STX6. (E) A schematic diagram illustrating the APEX2-based labeling strategy with AAV-PHP.eb virus mediated SLC6A17-APEX2 overexpression in vivo. SLC6A17 was fused in-frame to three repeats of the HA tag, a V5 tag, and APEX2. (F) Representative EM image of synaptic vesicles (SVs) labeled by SLC6A17-APEX2 and darkness distribution of DAB-positive and DAB-negative SVs in sections of Slc6a17-APEX2 mouse brains. Red arrow pointing to APEX2 labeled SVs. White arrow pointing to unlabeled SVs.
-
Figure 4—source data 1
Original files of the full raw unedited blots for Figure 4C and D.
- https://cdn.elifesciences.org/articles/86972/elife-86972-fig4-data1-v1.zip
-
Figure 4—source data 2
Uncropped blots with the relevant bands labeled for Figure 4C and D.
- https://cdn.elifesciences.org/articles/86972/elife-86972-fig4-data2-v1.zip
Figure 4—figure supplement 1
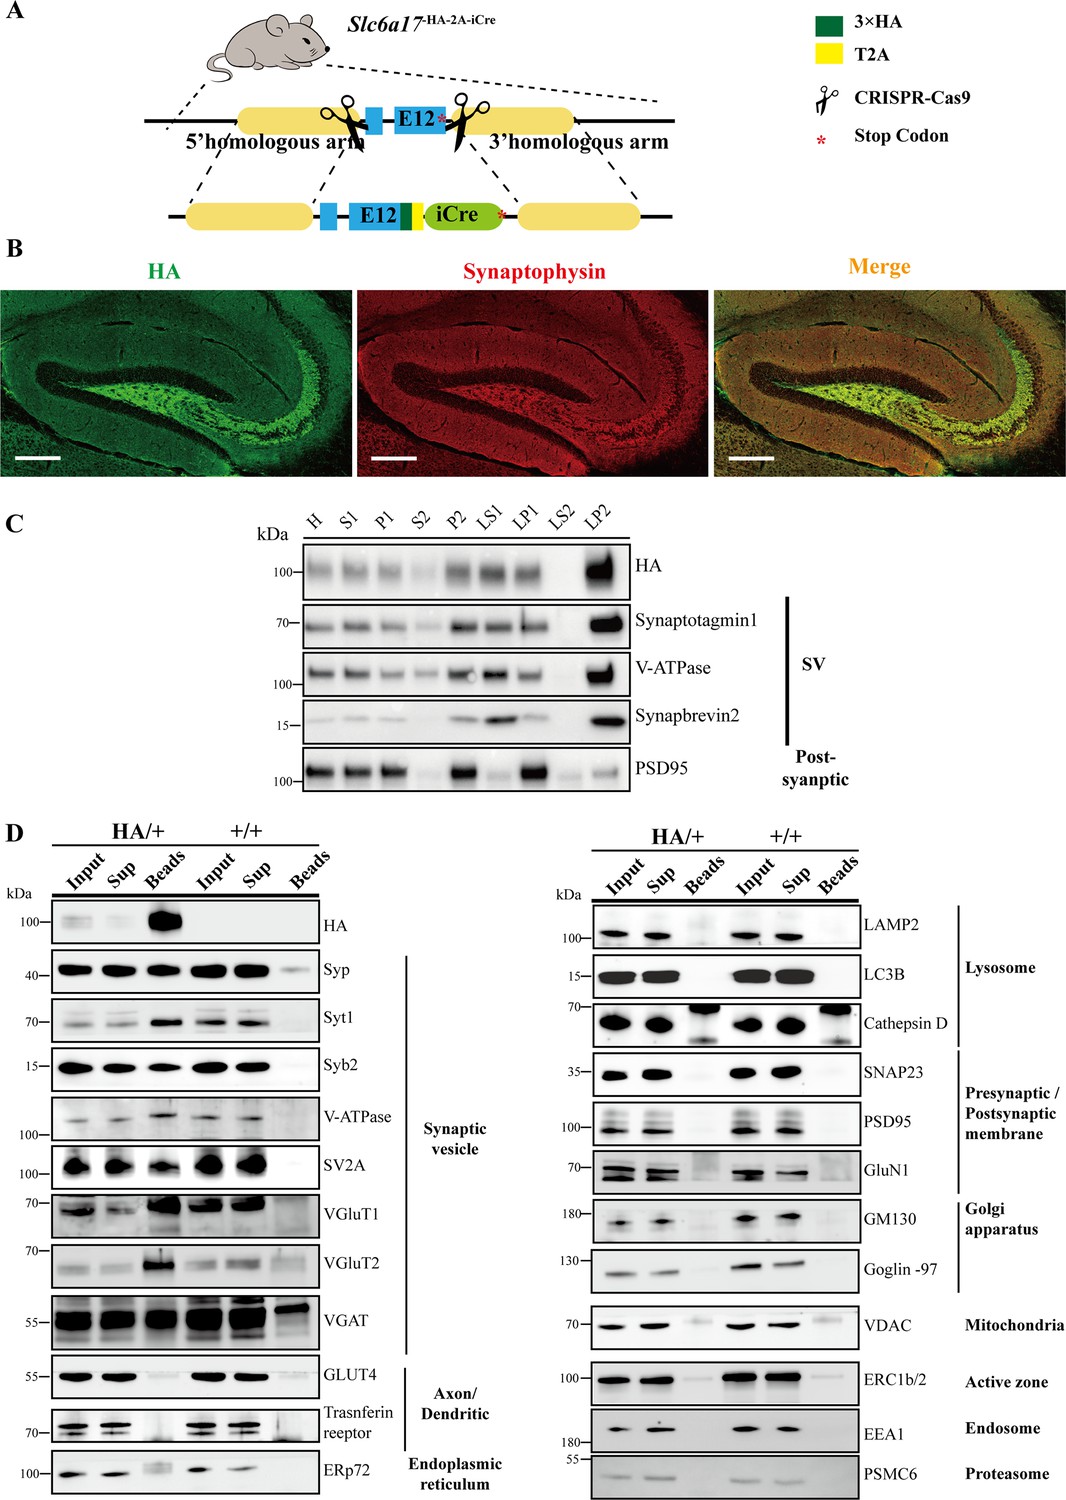
Immunoisolation and immunohistochemistry of Slc6a17-HA mice.
(A) A schematic diagram illustrating the knock-in strategy for generating Slc6a17-HA-2A-iCre KI mice. (B) Confocal images of the hippocampal region in Slc6a17HA/+ mice after immunocytochemistry with anti-Syp and anti-HA antibodies. Scale bar = 50 μm. (C) With fractions of whole brains by differential centrifugation, SLC6A17-HA was co-immunoisolated with synaptic markers including Syp, Syt1, Syb2, and V-ATPase, but not with PSD95. (D) Analysis of synaptic vesicles (SVs) isolated by anti-HA beads from Slc6a17-HA-2A-iCre mice and from WT mice. 23 markers for organelles were analyzed to confirm SV specificity, and absence of markers of lysosome, Golgi, mitochondria, ER, endosome, proteasome, and postsynaptic cytoplasmic membrane. Scale bar = 10 μm.
-
Figure 4—figure supplement 1—source data 1
Original files of the full raw unedited blots for Figure 4—figure supplement 1C and D.
- https://cdn.elifesciences.org/articles/86972/elife-86972-fig4-figsupp1-data1-v1.zip
-
Figure 4—figure supplement 1—source data 2
Uncropped blots with the relevant bands labeled for Figure 4—figure supplement 1C and D.
- https://cdn.elifesciences.org/articles/86972/elife-86972-fig4-figsupp1-data2-v1.zip
Figure 4—figure supplement 2
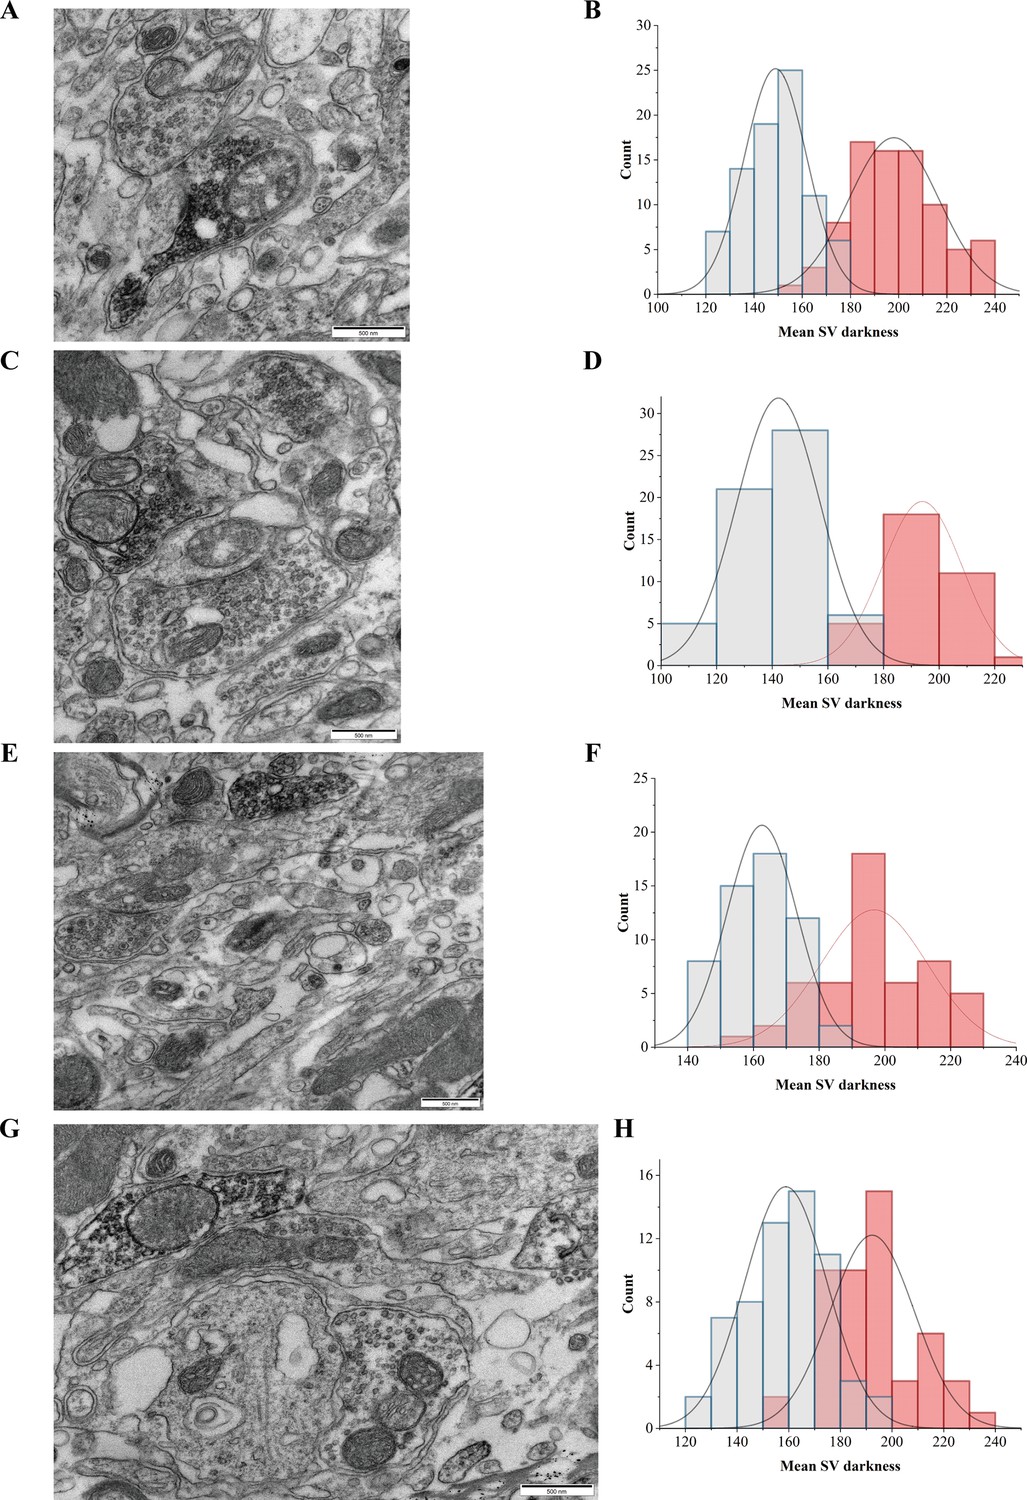
Electron microscopy (EM) confirmation of the synaptic vesicle (SV) localization of SLC6A17-APEX2.
(A, C, E, G) Different views of SLC6A17-APEX2 overexpression. (B, D, F, H) Normal distribution of SV electron density in the corresponding images on the left.
Figure 5 with 1 supplement
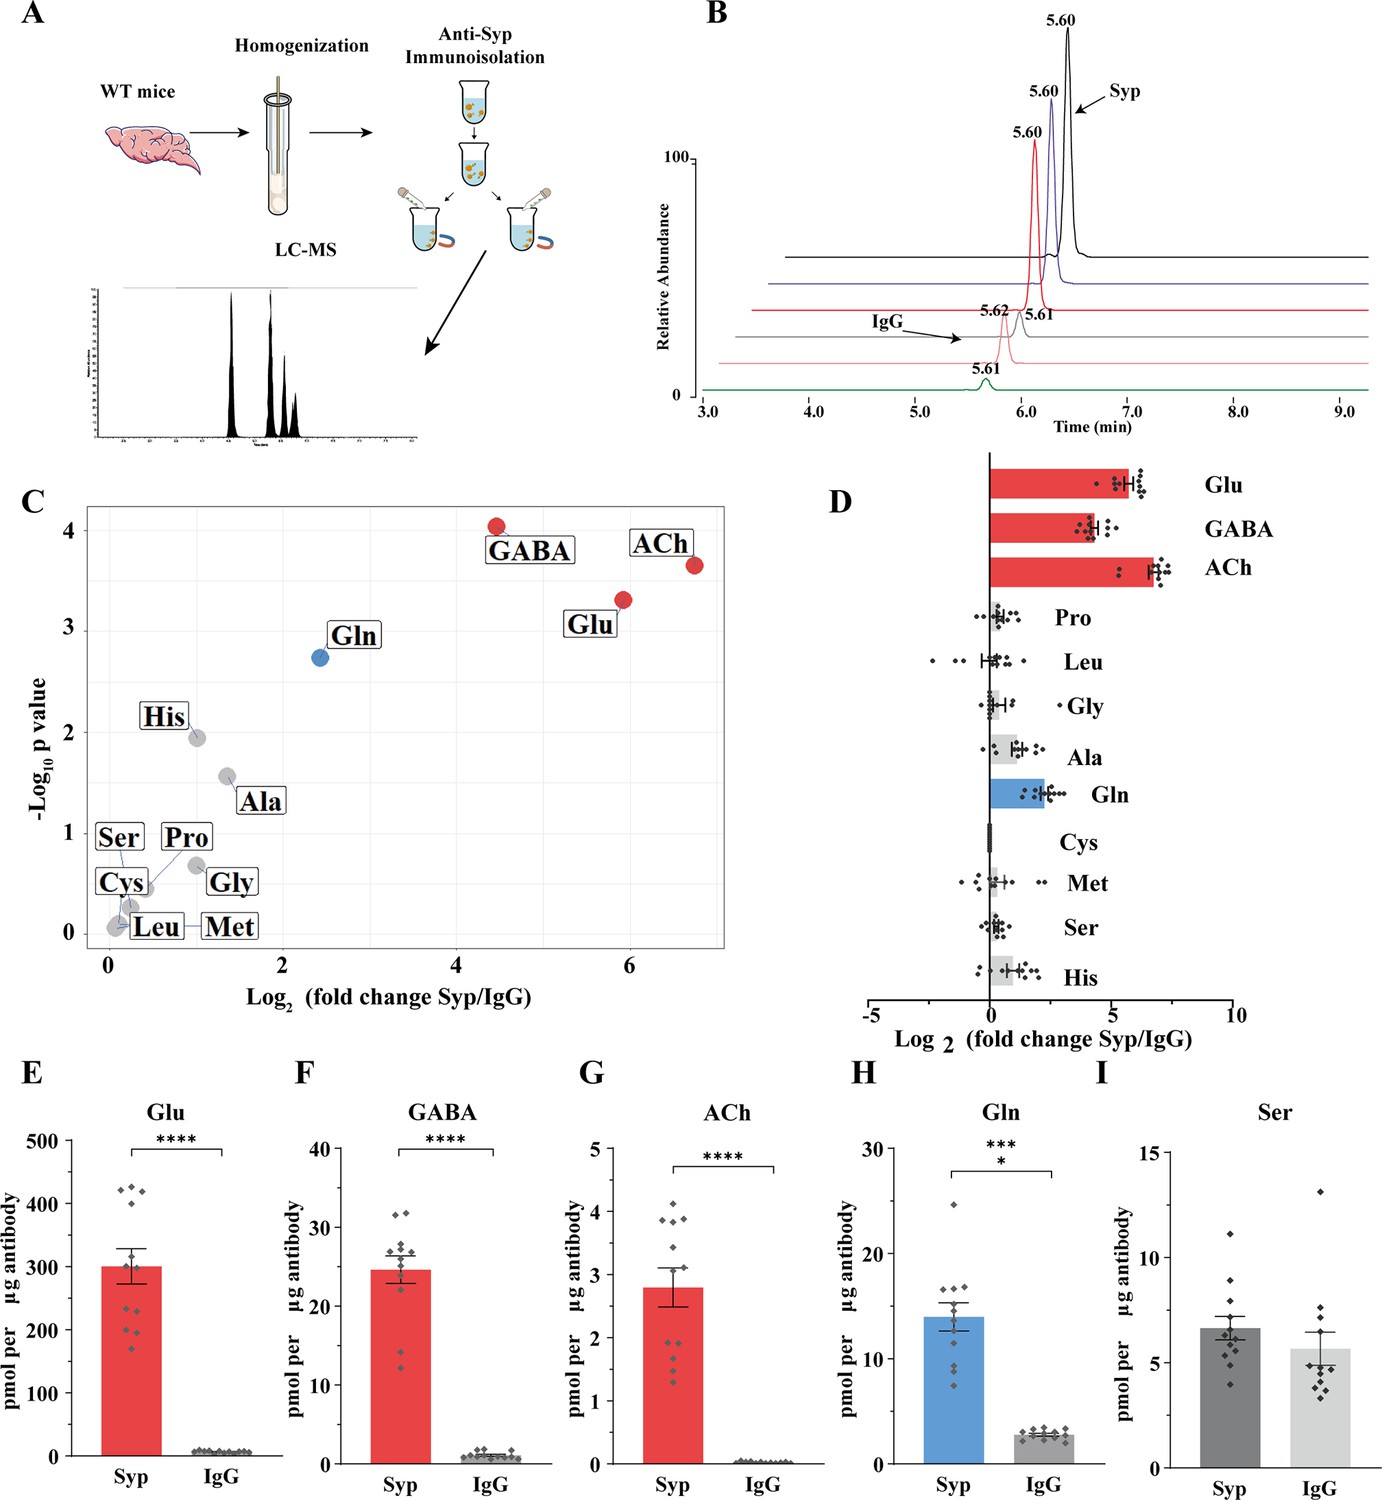
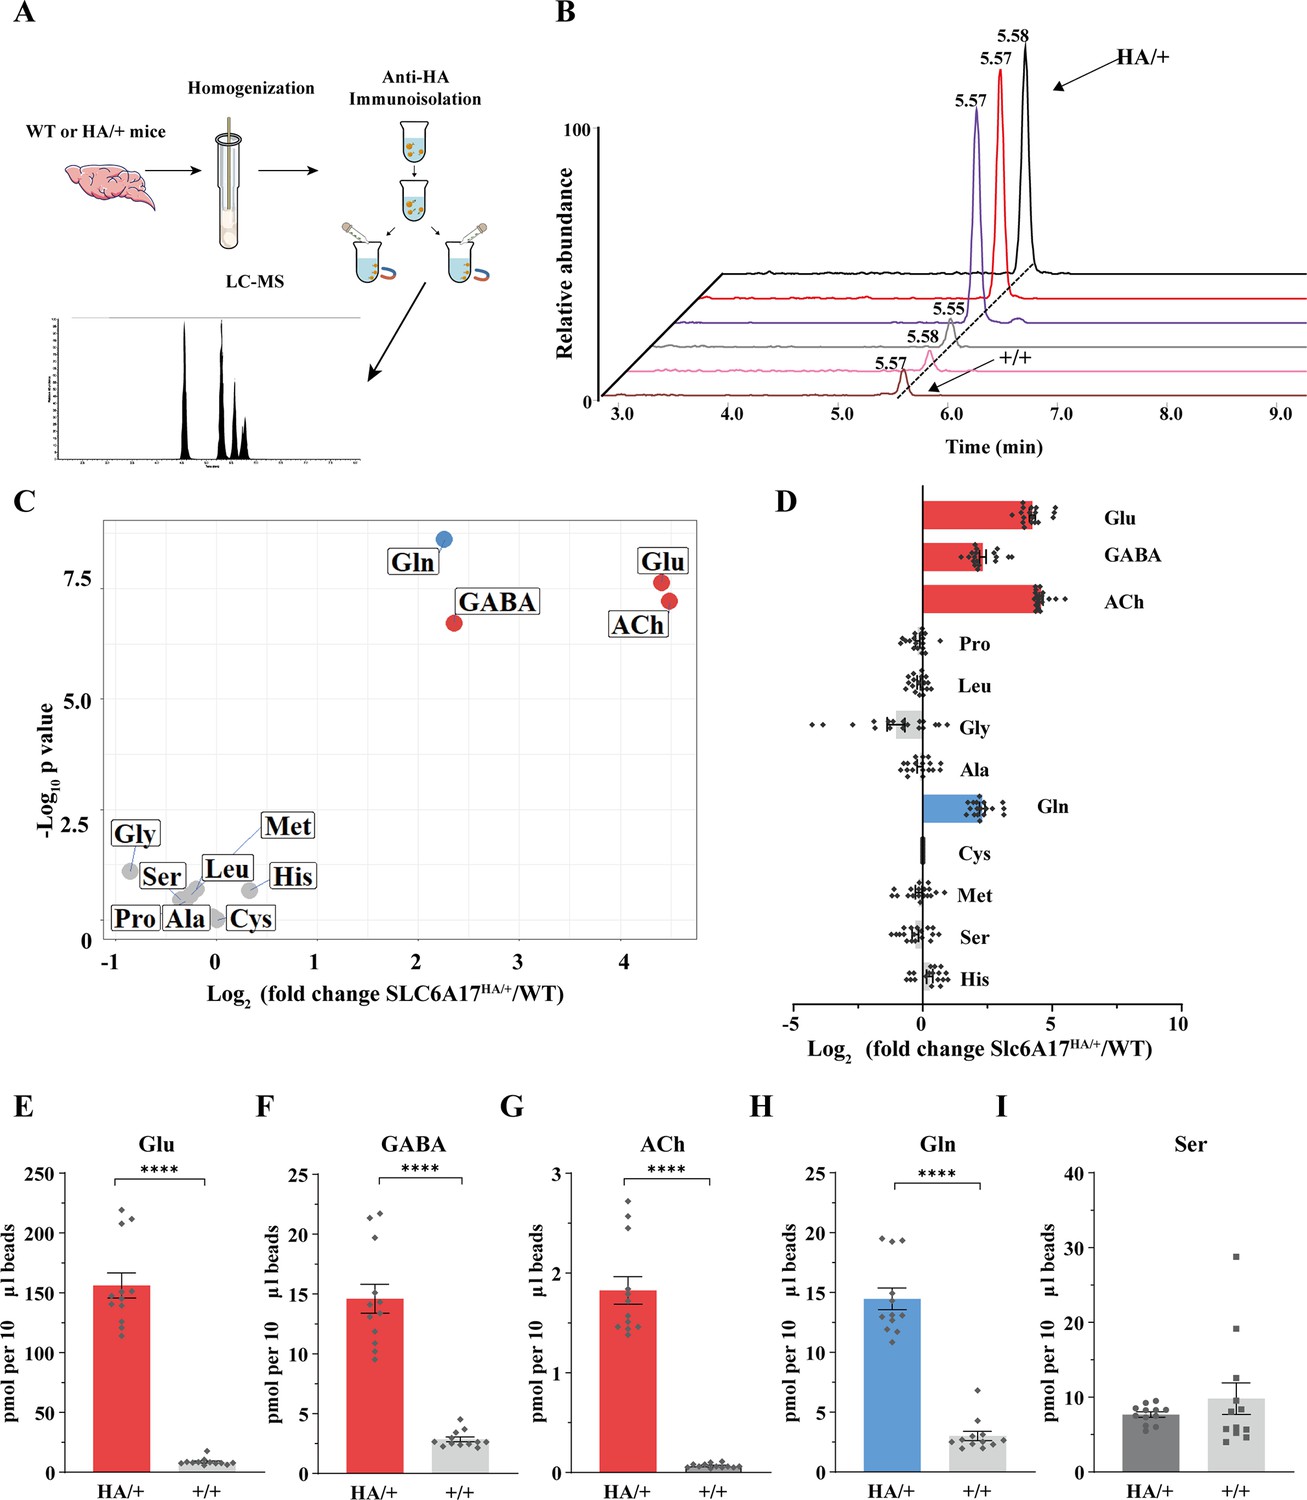
Presence of glutamine in synaptic vesicles (SVs) from the mouse brain.
(A) A schematic diagram illustrating the procedure to immunoisolate SVs with the anti-Syp antibody for liquid chromatography coupled to mass spectrometry (LC-MS) analysis of the contents in the SVs. (B) Representative MS results showing Gln signals from SVs immunoisolated by the anti-Syp antibody (anti-Syp) vs. the control sample immunoisolated with IgG. (C) Volcano plot of chemical contents in the SVs isolated by anti-Syp vs. IgG. The y axis shows p-values in log10 and the x axis shows the log2 of the ratio of the level of a molecule immunoisolated by anti-Syp vs. IgG. Classical neurotransmitters Glu, GABA, and ACh, as well as previously reported substrates of SLC6A17 are listed. (D) Ratios of the level of a chemical immunoisolated by anti-Syp vs. IgG (transformed into log2). (E–I) Chemicals were quantified to mole per μg antibody (n = 12 for each group from four different animals with three replicates each): Glu (E, p<0.0001 for anti-Syp vs. IgG); GABA (F, p<0.0001 for anti-Syp vs. IgG); ACh (G, p<0.0001 for anti-Syp vs. IgG); Gln (H, p<0.0001 for anti-Syp vs. IgG); Ser (I, p=0.7553 for anti-Syp vs. IgG).
-
Figure 5—source data 1
Data points for Figure 5C–I.
- https://cdn.elifesciences.org/articles/86972/elife-86972-fig5-data1-v1.xlsx
Figure 5—figure supplement 1
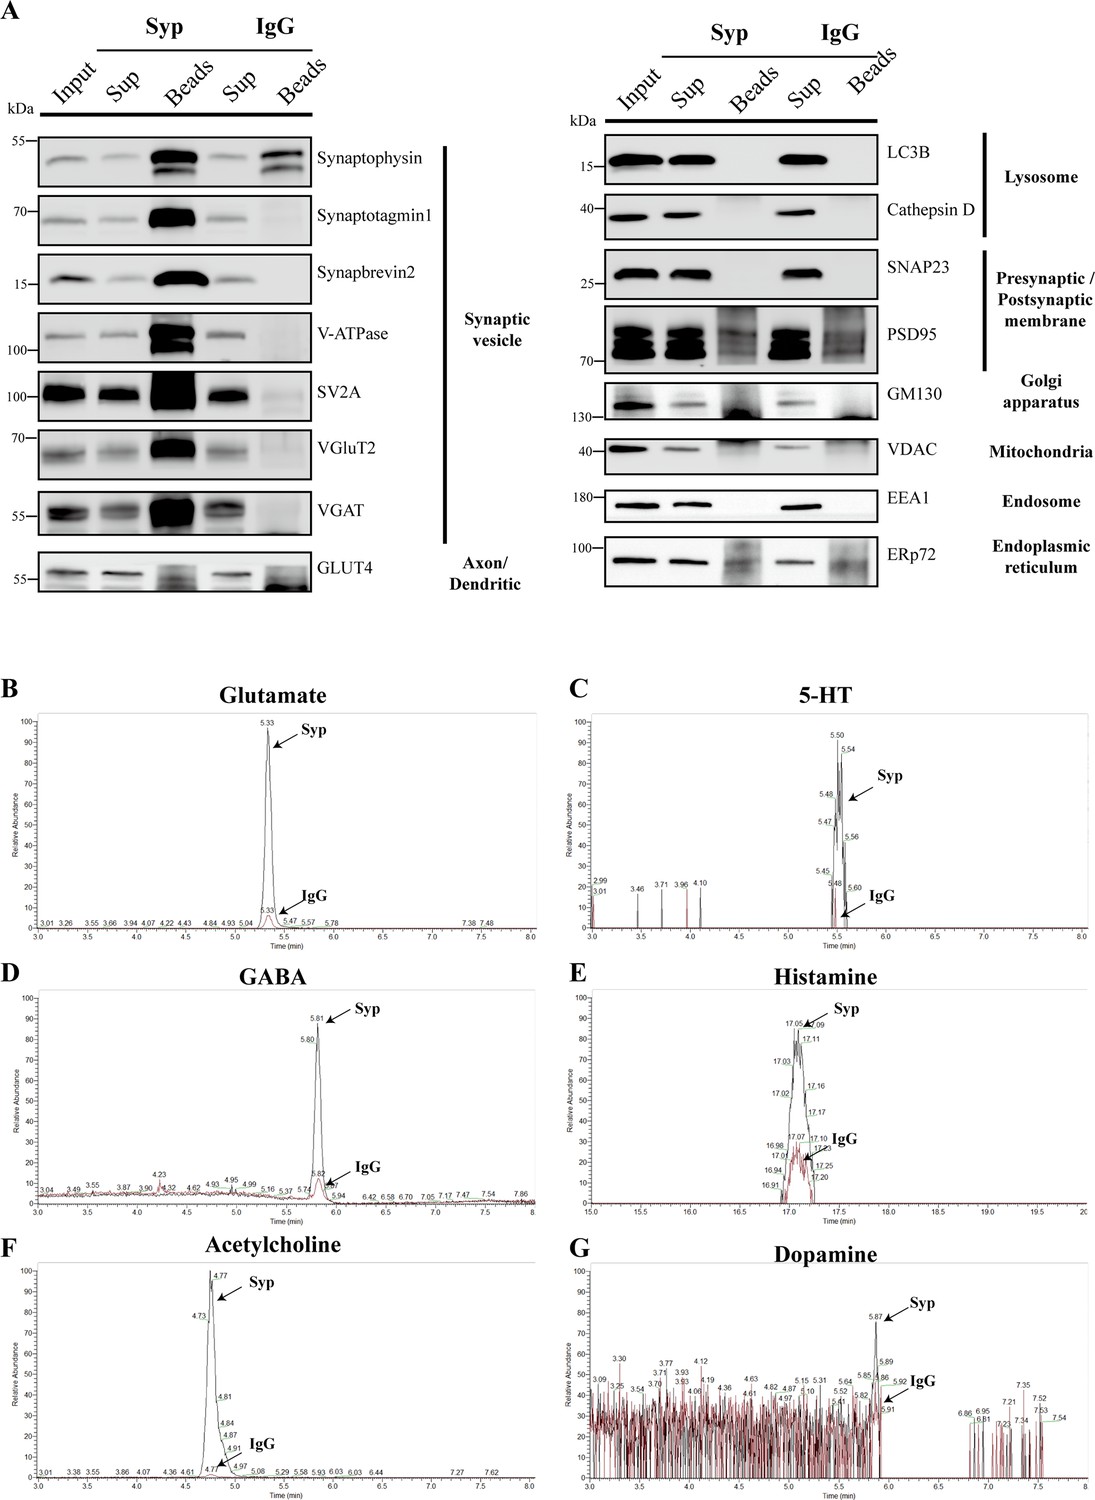
Liquid chromatography coupled to mass spectrometry (LC-MS) analysis of SVs immunoisolated by the anti-Syp antibody.
(A) Analysis of SVs isolated by the anti-Syp antibody. 16 markers for organelles were analyzed to confirm the SV specificity, with no detection of markers for lysosome, Golgi, mitochondria, ER, endosome and postsynaptic cytoplasmic membrane. IgG was used as a control. (B–G) Neurotransmitter contents in SVs isolated by the anti-Syp antibody. Representative LC-MS signals of anti-Syp and IgG group are shown, each graph was normalized: Glu (B), GABA (D), and ACh (F) highly enriched; 5-HT (C), histamine (E), and dopamine (G) moderately enriched.
-
Figure 5—figure supplement 1—source data 1
Original files of the full raw unedited blots for Figure 5—figure supplement 1A.
- https://cdn.elifesciences.org/articles/86972/elife-86972-fig5-figsupp1-data1-v1.zip
-
Figure 5—figure supplement 1—source data 2
Uncropped blots with the relevant bands labeled for Figure 5—figure supplement 1A.
- https://cdn.elifesciences.org/articles/86972/elife-86972-fig5-figsupp1-data2-v1.zip
Figure 6
Glutamine (Gln) enrichment in synaptic vesicles (SVs) containing SLC6A17.
(A) A schematic diagram illustrating the procedure to isolate SLC6A17-containing SVs for chemical analysis of SV contents. (B) Representative result showing MS Gln signals in SVs immunoisolated by the anti-HA beads in Slc6a17HA/+ mice vs. those from Slc6a17+/+ mice. (C) Volcano plot of chemical contents in the SVs immunoisolated by anti-HA beads from Slc6a17HA/+ mice vs. Slc6a17+/+ mice. The y axis shows p-values in log10 and the x axis shows the log2 of the ratio of the level of a molecule immunoisolated by anti-HA beads from Slc6a17HA/+ mice vs. that from Slc6a17+/+ mice. Classical neurotransmitters such as Glu, GABA, and ACh as well as the previously reported substrates of SLC6A17 are listed. (D) Ratios of the level of a chemical immunoisolated by anti-HA beads from Slc6a17HA/+ mice vs. that from Slc6a17+/+ mice (transformed into log2). (E–I) Contents of SLC6A17-containing SVs were quantified to mole per 10 μl anti-HA beads (n = 12, for each group from four different animals with three replicates each): Glu (E, p<0.0001 for Slc6a17HA/+ vs. Slc6a17+/+); GABA (F, p<0.0001 for Slc6a17HA/+ vs. Slc6a17+/+); ACh (G, p<0.0001 for Slc6a17HA/+ vs. Slc6a17+/+); Gln (H, p<0.0001 for Slc6a17HA/+ vs. Slc6a17+/+); Ser (I, p=0.7553 for Slc6a17HA/+ vs. Slc6a17+/+).
-
Figure 6—source data 1
Data points for Figure 6C–I.
- https://cdn.elifesciences.org/articles/86972/elife-86972-fig6-data1-v1.xlsx
Figure 7 with 1 supplement
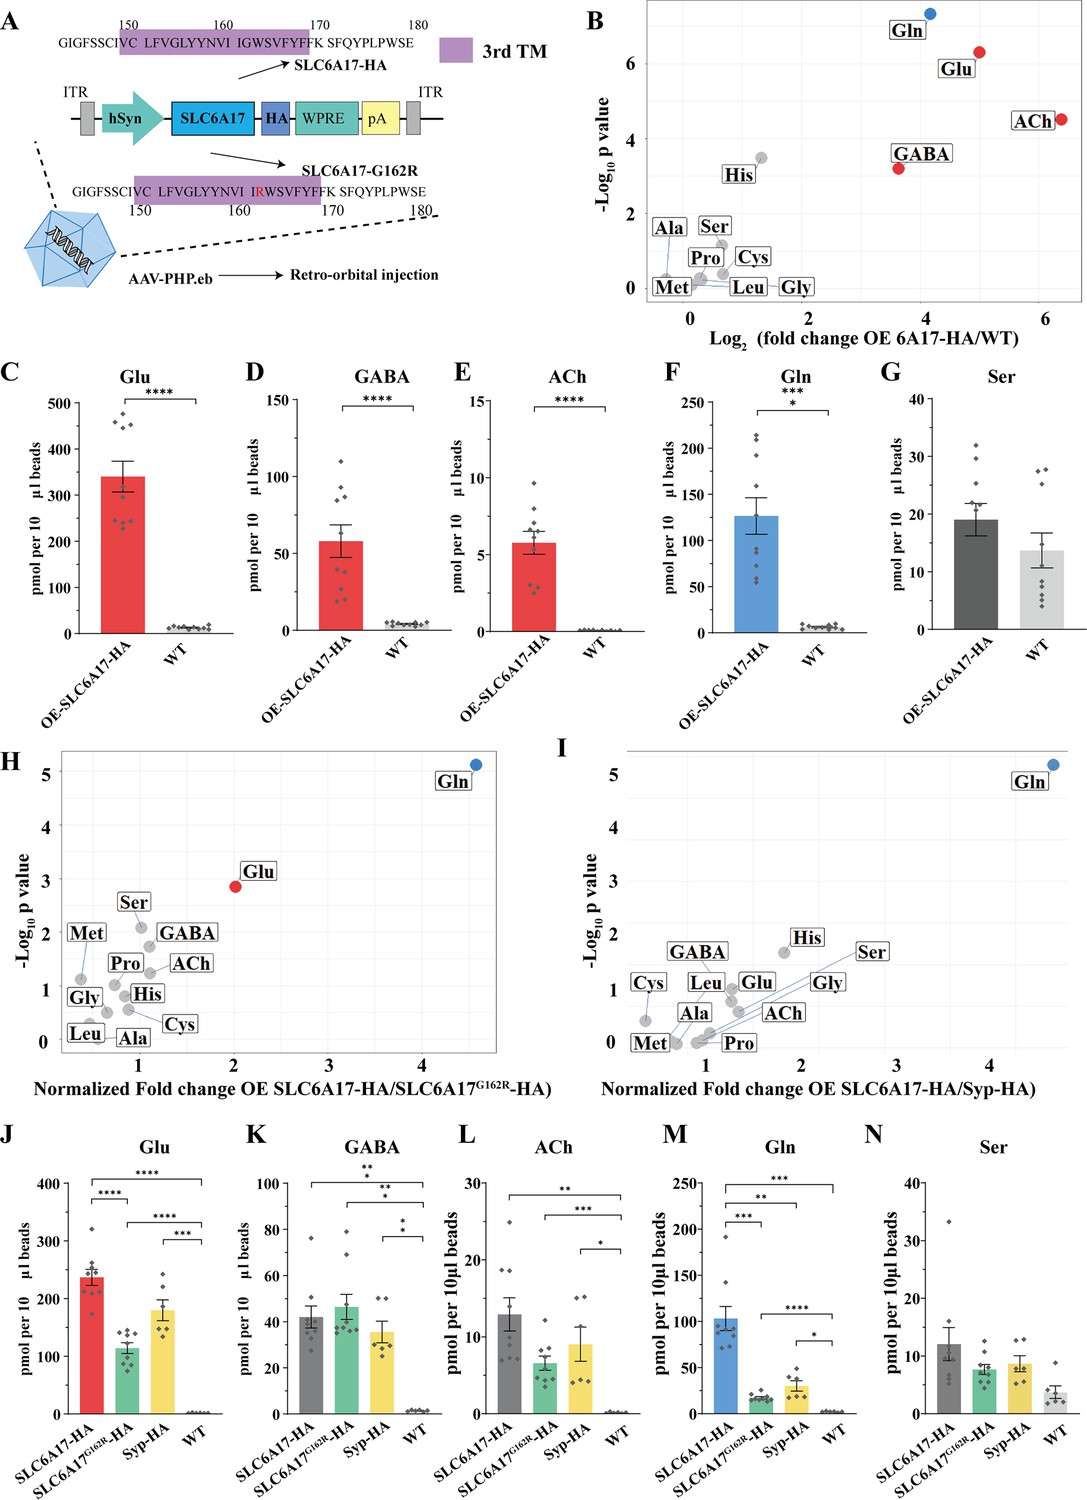
Increased glutamine (Gln) transport into synaptic vesicles (SVs) containing SLC6A17 but not into SVs containing SLC6A17G162R.
(A) A schematic diagram illustrating the strategy for the AAV-PHP.eb virus-mediated in vivo overexpression of SLC6A17-HA and SLC6A17G162R-HA. (B) Volcano plot of chemical contents in the SVs isolated by anti-HA beads from the OE-SLC6A17-HA mice vs. WT mice. The y axis shows p-values in log10 and the x axis shows the log2 of the ratio of the level of a molecule immunoisolated by anti-HA beads from mice overexpressing SLC6A17-HA vs. that from WT mice. Classical neurotransmitters and previously reported substrates of SLC6A17 are listed. (C–G) Contents of OE-SLC6A17-containing SV are quantified to mole per 10 μl HA beads (n = 10, for each group from three different animals with three replicates in two animal and four replicates in one animal): Glu (C, p<0.0001 for OE-SLC6A17-HA vs. WT); GABA (D, p<0.0001 for OE-SLC6A17-HA vs. WT); ACh (E, p<0.0001 for OE-SLC6A17-HA vs. WT); Gln (F, p<0.0001 for OE-SLC6A17-HA vs. WT); (G, p=0.1655 for OE-SLC6A17-HA vs. WT). (H) Volcano plot comparing the chemical contents of SVs containing OE-SLC6A17-HA with those containing OE-SLC6A17G162R-HA. Classical neurotransmitters and nine putative substrates of SLC6A17 are listed. Glu is the only classical transmitter significantly increased. Gln is the only substrates significantly increased in SLC6A17-HA containing SVs vs. SLC6A17G162R-HA containing SVs. (I) Volcano plot comparing the chemical contents of SVs containing OE-SLC6A17-HA with those containing OE-Syp-HA. Classical neurotransmitters and nine putative substrates of SLC6A17 are listed. Gln is the only substrates significantly increased in SLC6A17 containing SVs vs. Syp-HA containing SVs. (J–N) Contents of SVs containing SCL6A17-HA, SVs containing OE-SLC6A17G162R-HA, SVs containing Syp-HA immunosilated by anti-HA immunoisolation with that from WT mouse brains were quantified to mole per 10 μl HA beads and normalized to Syb2 relative abundance in WB (n = 9, 9, 6, and 6 for OE-SLC6A17-HA, OE-SLC6A17G162R-HA, OE-Syp-HA, and WT, respectively, from different animals with three replicates each): Glu (J, p<0.0001 for OE-SLC6A17-HA vs. OE-SLC6A17G162R-HA; p<0.0001 for OE-SLC6A17-HA vs. WT; p<0.0001 for OE-SLC6A17G162R-HA vs. WT; p=0.0009 for OE-Syp-HA vs. WT; p=0.1551 for OE-SLC6A17-HA vs. OE-Syp-HA; p=0.0618 for OE-SLC6A17G162R-HA vs. OE-Syp-HA); GABA (K, p=0.0002 for OE-SLC6A17-HA vs. WT; p=0.0002 for OE-SLC6A17G162R-HA vs. WT; p=0.0039 for OE-Syp-HA vs. WT; p=0.9885 for OE-SLC6A17-HA vs. OE-SLC6A17G162R-HA; p=0.9000 for OE-SLC6A17-HA vs. OE-Syp-HA; p=0.5840 for OE-SLC6A17G162R-HA vs. OE-Syp-HA); ACh (L, p=0.0019 for OE-SLC6A17-HA vs. WT; p=0.0006 for OE-SLC6A17G162R-HA vs. WT; p=0.0467 for OE-Syp-HA vs. WT; p=0.1054 for OE-SLC6A17-HA vs. OE-SLC6A17G162R-HA; p=0.7563 for OE-SLC6A17-HA vs. OE-Syp-HA; p=0.8702 for OE-SLC6A17G162R-HA vs. OE-Syp-HA); Gln (M, p=0.001 for OE-SLC6A17-HA vs. OE-SLC6A17G162R-HA; p=0.0018 for OE-SLC6A17-HA vs. OE-Syp-HA; p=0.0003 for OE-SLC6A17-HA vs. WT; p<0.0001 for OE-SLC6A17G162R-HA vs. WT; p=0.0189 for OE-Syp-HA vs. WT; p=0.2749 for OE-SLC6A17G162R-HA vs. OE-Syp-HA); Ser (N, p=0.626 for OE-SLC6A17-HA vs. OE-SLC6A17G162R-HA; p=0.8551 for OE-SLC6A17-HA vs. OE-Syp-HA; p=0.9874 for OE-SLC6A17-HA vs. OE-Syp-HA; p<0.0865 for OE-SLC6A17G162R-HA vs. WT; p=0.1017 for OE-Syp-HA vs. WT).
-
Figure 7—source data 1
Data points for Figure 7B–I.
- https://cdn.elifesciences.org/articles/86972/elife-86972-fig7-data1-v1.xlsx
Figure 7—figure supplement 1
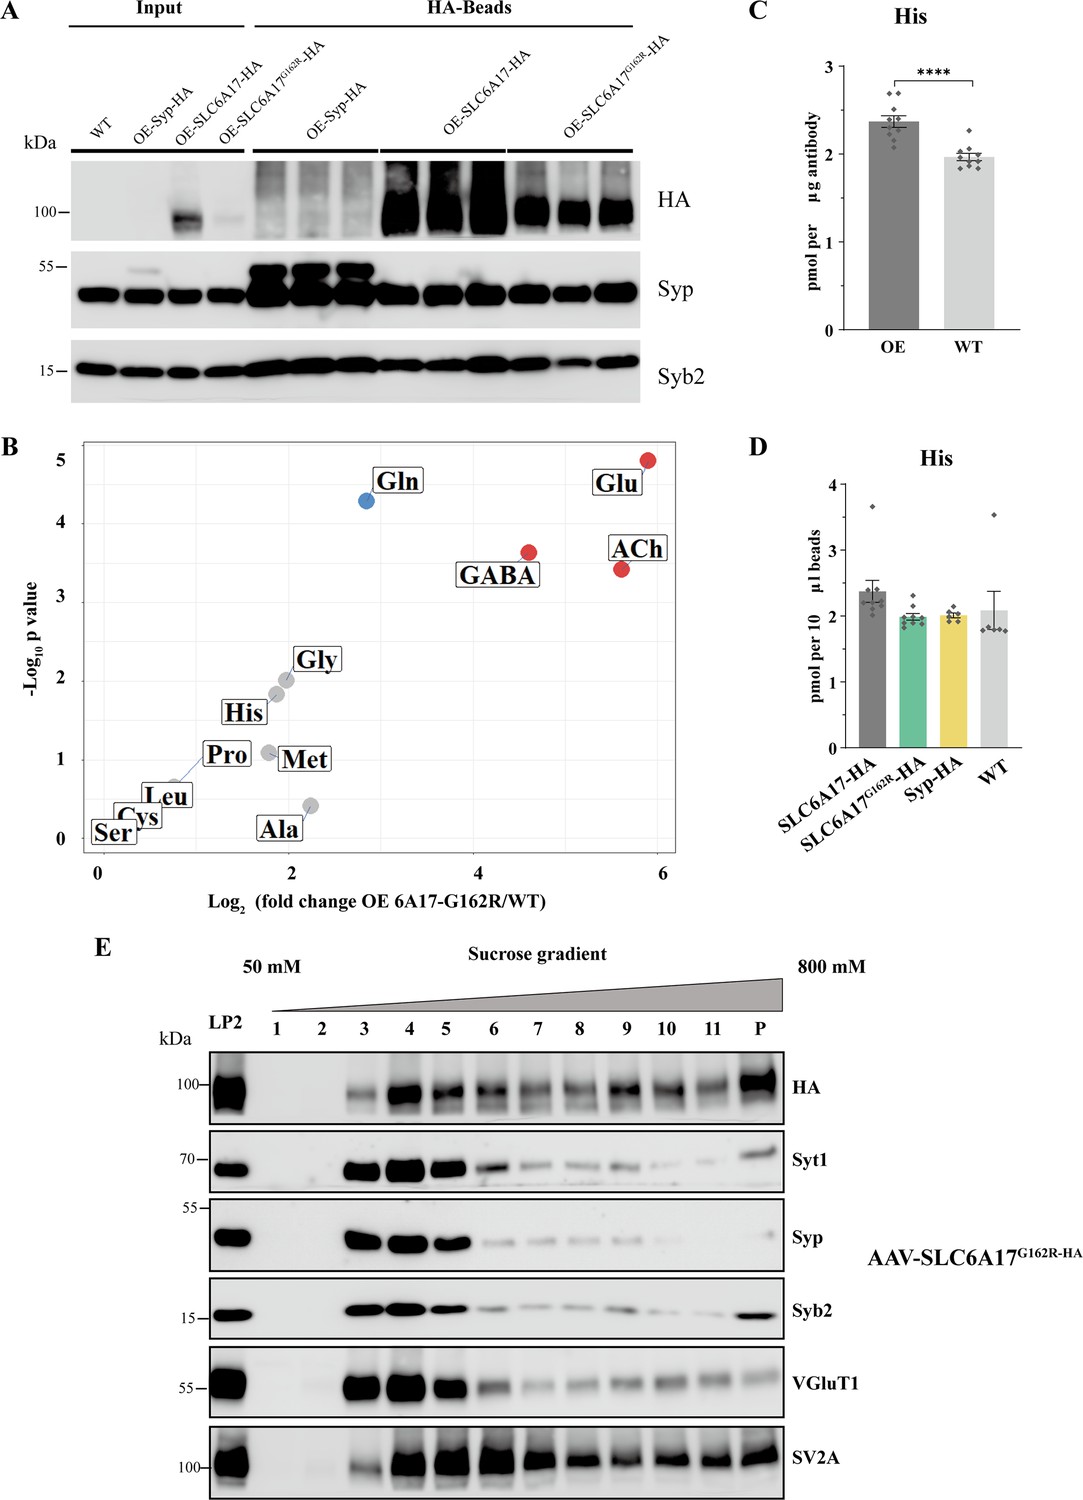
Virally mediated overexpression of SLC6A17-HA and SLC6A17G162R-HA.
(A) Analysis of synaptic vesicles (SVs) isolated by anti-HA beads from mice overexpressing OE-Syp-HA, OE-SLC6A17-HA, and OE-SLC6A17G162R-HA. High levels of association with SV markers (Syp and Syb2) were detected in both samples, indicating Syp-HA, SLC6A17-HA and SLC6A17G162R proteins were all localized on the SVs. Liquid chromatography coupled to mass spectrometry (LC-MS) results normalization was based on immunoblot analysis of SV markers. (B) Volcano plot of the contents from SVs purified by anti-HA immunoisolation from OE-SLC6A17G162R-HA overexpressing mice compared to that from WT mice. (C) Quantification of His levels (p<0.0001 for OE-SLC6A17 vs. WT). (D) Quantification of His levels (p=0.2433 for OE-SLC6A17 vs. OE-SLC6A17G162R-HA; p=0.0018 for OE-SLC6A17 vs. Syp-HA; p=0.2735 for OE-SLC6A17 vs. WT; p=0.9993 for OE-SLC6A17G162R-HA vs. WT; p=0.9998 for Syp-HA vs. WT). (E) Sucrose gradient analysis of Slc6a17G162R-HA LP2 fraction. Slc6a17G162R-HA was associated with layers 2–4, which were rich with SV markers such as Syt1, Syp, Syb2, and VGlut1.
-
Figure 7—figure supplement 1—source data 1
Original files of the full raw unedited blots for Figure 7—figure supplement 1A and E.
- https://cdn.elifesciences.org/articles/86972/elife-86972-fig7-figsupp1-data1-v1.zip
-
Figure 7—figure supplement 1—source data 2
Uncropped blots with the relevant bands labeled for Figure 7—figure supplement 1A and E.
- https://cdn.elifesciences.org/articles/86972/elife-86972-fig7-figsupp1-data2-v1.zip
-
Figure 7—figure supplement 1—source data 3
Data points for Figure 7—figure supplement 1B–D.
- https://cdn.elifesciences.org/articles/86972/elife-86972-fig7-figsupp1-data3-v1.xlsx
Figure 8

Reduced levels of glutamine (Gln) in the synaptic vesicles (SVs) of Slc6a17 KO mice.
Contents of SVs purified by the anti-Syp antibody from Slc6a17-KO mice were quantified to mole per 10 μg antibody (n = 12 for Slc6a17+/+, Slc6a17+/-, Slc6a17-/-, from four different animals with three replicates each): Glu (A, p=0.2749 for Slc6a17+/+ vs. Slc6a17-/-, p=0.2466 for Slc6a17+/- vs. Slc6a17-/-); GABA (B, p=0.665 for Slc6a17+/+ vs. Slc6a17-/-, p=0.2503 for Slc6a17+/- vs. Slc6a17-/-); ACh (C, p=0.9993 for Slc6a17+/+ vs. Slc6a17-/-, p=0.7186 for Slc6a17+/- vs. Slc6a17-/-); Pro (D, p=0.9986 for Slc6a17+/+ vs. Slc6a17-/-, p=0.8035 for Slc6a17+/- vs. Slc6a17-/-); Leu (E, p=0.826 for Slc6a17+/+ vs. Slc6a17-/-, p=0.61 for Slc6a17+/- vs. Slc6a17-/-); Gly (F, p=0.3211 for Slc6a17+/+ vs. Slc6a17-/-, p=0.442 for Slc6a17+/- vs. Slc6a17-/-); Ala (G, p=0.9092 for Slc6a17+/+ vs. Slc6a17-/-, p=0.1321 for Slc6a17+/- vs. Slc6a17-/-); Gln (H, p=0.002 for Slc6a17+/+ vs. Slc6a17-/-, p=0.0489 for Slc6a17+/- vs. Slc6a17-/-); Cys (I, p=0.3753 for Slc6a17+/+ vs. Slc6a17-/-, p=0.5718 for Slc6a17+/- vs. Slc6a17-/-); Met (J, p=0.9735 for Slc6a17+/+ vs. Slc6a17-/-, p=0.13 for +/- vs. Slc6a17-/-); Ser (K, p=0.8678 for Slc6a17+/+ vs. Slc6a17-/-, p=0.7834 for Slc6a17+/- vs. Slc6a17-/-); His (L, p>0.9999 for Slc6a17+/+ vs. Slc6a17-/-, p=0.9922 for Slc6a17+/- vs. Slc6a17-/-).
-
Figure 8—source data 1
Data points for Figure 8A–L.
- https://cdn.elifesciences.org/articles/86972/elife-86972-fig8-data1-v1.xlsx
Figure 9 with 1 supplement

Physiological requirement of SLC6A17 for glutamine (Gln) transport into synaptic vesicles (SVs) in vivo.
(A) A schematic diagram illustrating the strategy of Cas9-mediated cleavage of Slc6a17 specifically in Slc6a17-positive neurons, and simultaneous labeling of all SVs in these neurons by Syp-HA. (B) Immunoblot results showing SLC6A17 protein was significantly reduced in targeted neurons, while Syp-HA was efficiently tagged onto the SVs of these neurons. (C) Volcano plot of contents of SVs from AAV-sgRNA/Slc6a17iCre/Cas9+ targeted neurons compared to contents of SVs from control (AAV-sgRNA /Slc6a17iCre/Cas9-) neurons. Glu, GABA, ACh, and the nine previously reported substrates of SLC6A17 are listed. (D) Ratios of the level of a molecule from the SVs of AAV-sgRNA /Slc6a17iCre/Cas9+ neurons vs. the level of the same molecule from SVs of AAV-sgRNA/Slc6a17iCre/Cas9- neurons shown as fold change (log2 transformed). GABA level was significantly increased (p=0.0034 for AAV-sgRNA /Slc6a17iCre/Cas9+ vs. AAV-sgRNA /Slc6a17iCre/Cas9-). Gln level was significantly decreased (p<0.0001 for AAV-sgRNA /Slc6a17iCre/Cas9+ vs. AAV-sgRNA /Slc6a17iCre/Cas9-). (E–H) Contents of SVs from Slc6a17 containing neurons were quantified to mole per 10 μl HA beads (n = 18, 27 for Slc6a17iCre/Cas9- and Slc6a17iCre/Cas9+, respectively, from six and nine different animals with three replicates each): Glu (E, p=0.0005 for AAV-sgRNA /Slc6a17iCre/Cas9+ vs. AAV-sgRNA /Slc6a17iCre/Cas9-); GABA (F, p=0.0032 for AAV-sgRNA /Slc6a17iCre/Cas9+ vs. AAV-sgRNA /Slc6a17iCre/Cas9-); Gln (G, p<0.0001 for AAV-sgRNA /Slc6a17iCre/Cas9+ vs. AAV-sgRNA /Slc6a17iCre/Cas9-); Ser (H, p=0.0979 for AAV-sgRNA /Slc6a17iCre/Cas9+ vs. AAV-sgRNA /Slc6a17iCre/Cas9-).
-
Figure 9—source data 1
Data points for Figure 9C-I.
- https://cdn.elifesciences.org/articles/86972/elife-86972-fig9-data1-v1.xlsx
-
Figure 9—source data 2
Original files of the full raw unedited blots for Figure 9B.
- https://cdn.elifesciences.org/articles/86972/elife-86972-fig9-data2-v1.zip
-
Figure 9—source data 3
Uncropped blots with the relevant bands labeled for Figure 9B.
- https://cdn.elifesciences.org/articles/86972/elife-86972-fig9-data3-v1.zip
Figure 9—figure supplement 1
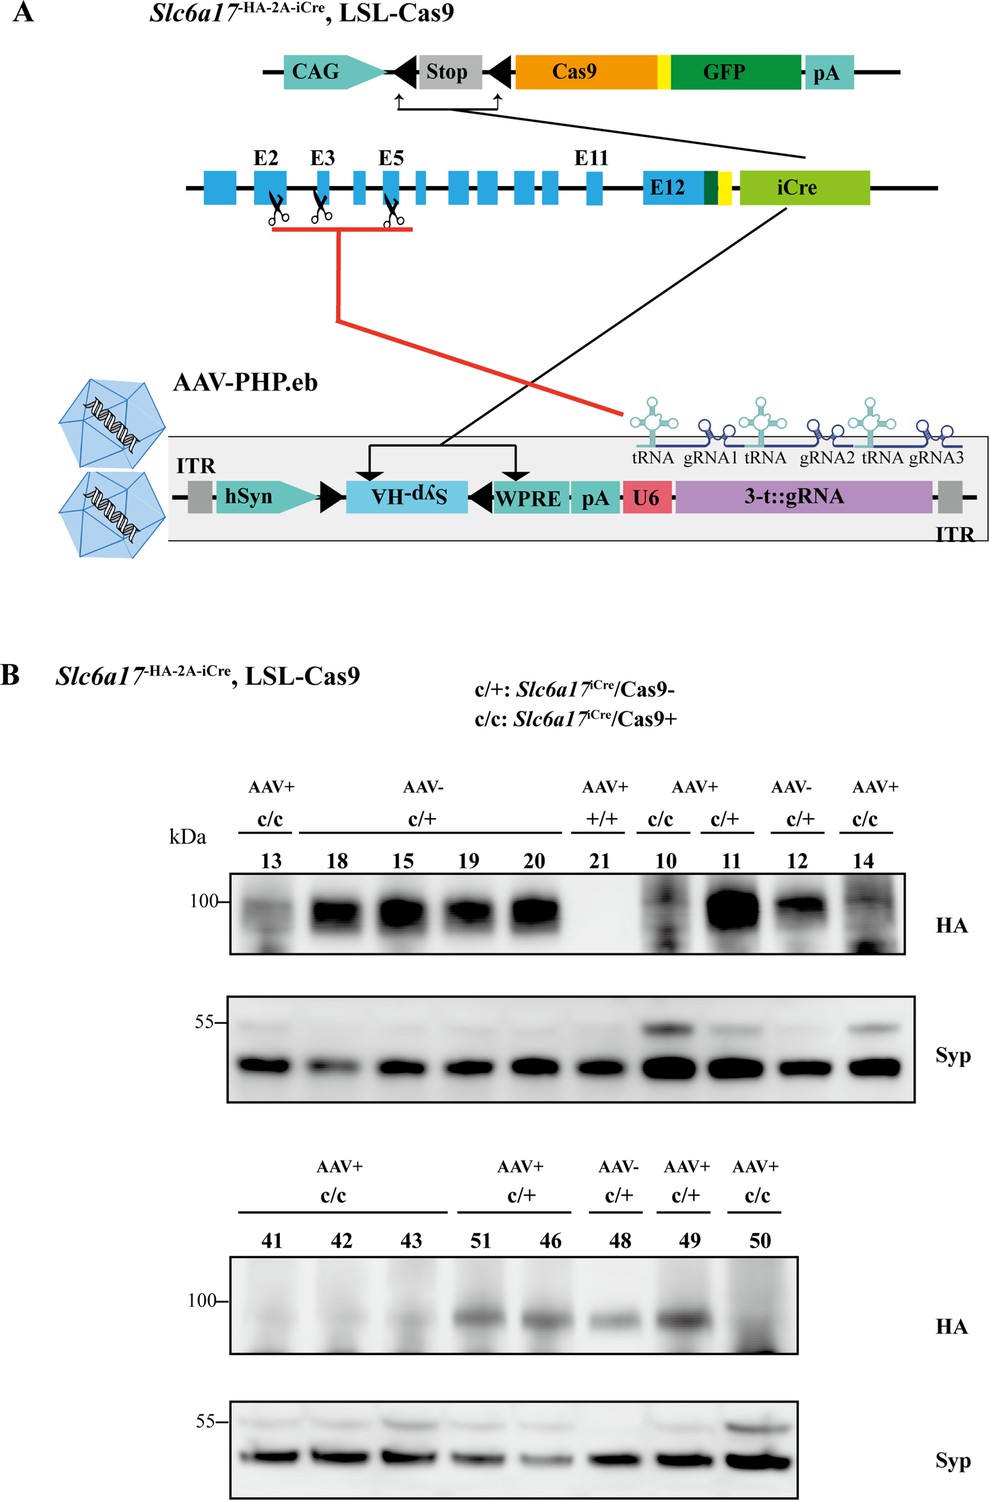
CRISPR/Cas9-mediated Slc6a17 gene cleavage in Slc6a17 expressing cells of adult mice.
(A) A schematic diagram illustrating the strategy for Cas9-mediated cleavage of Slc6a17 specifically in Slc6a17-positive neurons, and simultaneous labeling of SVs by Syp-HA. A single tRNA-gRNA allowed multiple gRNAs being efficiently produced, which could be precisely excised in vivo by the endogenous RNases, to improve editing efficiency of Cas9 system. (B) SLC6A17 protein in Slc6a17iCre/Cas9+ mice were efficiently removed. The protein level of SLC6A17 was measured in the input supernatant used for immunoisolation.
-
Figure 9—figure supplement 1—source data 1
Original files of the full raw unedited blots for Figure 9—figure supplement 1B.
- https://cdn.elifesciences.org/articles/86972/elife-86972-fig9-figsupp1-data1-v1.zip
-
Figure 9—figure supplement 1—source data 2
Uncropped blots with the relevant bands labeled for Figure 9—figure supplement 1B.
- https://cdn.elifesciences.org/articles/86972/elife-86972-fig9-figsupp1-data2-v1.zip
Figure 10
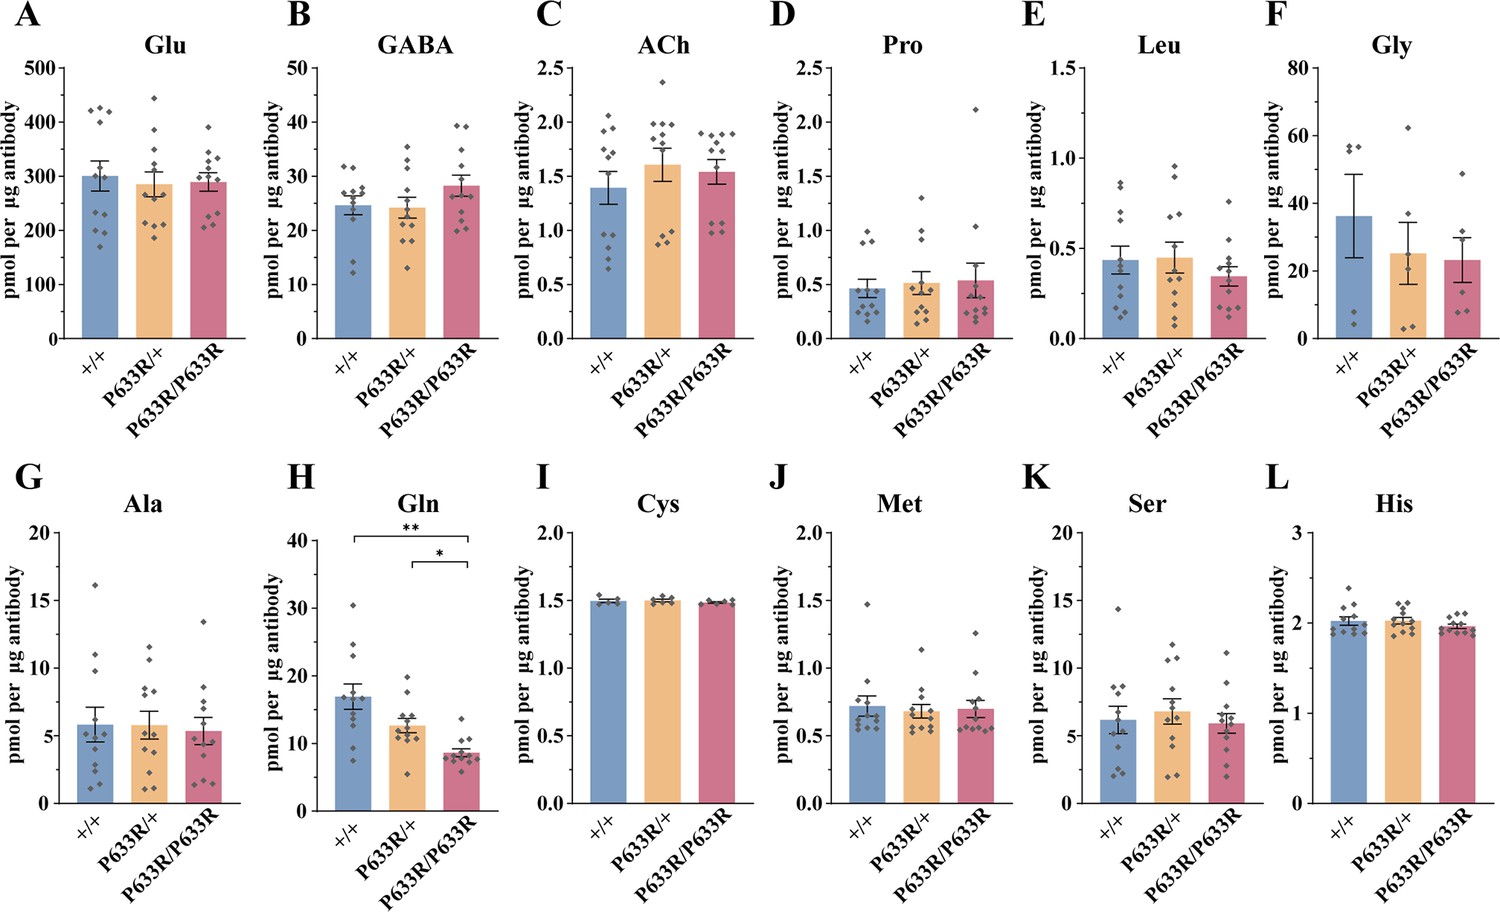
Reduced levels of glutamine (Gln) in the synaptic vesicles (SVs) of Slc6a17P633R mice.
Contents of SVs purified by the anti-Syp antibody from Slc6a17P633R mice were quantified to mole per 10 μg antibody (n = 12 for all genotype, from four different animals with three replicates each): Glu (A, p=0.9804 for Slc6a17+/+ vs. Slc6a17P633R/P633R, p=0.9982 for Slc6a17P633R/+ vs. Slc6a17P633R/P633R); GABA (B, p=0.4432 for Slc6a17+/+ vs. Slc6a17P633R/P633R p=0.3898 for Slc6a17P633R/+ vs. Slc6a17P633R/P633R); ACh (C, p=0.8175 for Slc6a17+/+ vs. Slc6a17P633R/P633R, p=0.9804 for Slc6a17P633R/+ vs. Slc6a17P633R/P633R); Pro (D, p=0.9674 for Slc6a17+/+ vs. Slc6a17P633R/P633R, p=0.9989 for Slc6a17P633R/+ vs. Slc6a17P633R/P633R); Leu (E, p=0.7116 for Slc6a17+/+ vs. Slc6a17P633R/P633R, p=0.6696 for Slc6a17P633R/+ vs. Slc6a17P633R/P633R); Gly (F, p=0.7376 for Slc6a17+/+ vs. Slc6a17P633R/P633R, p=0.9971 for Slc6a17P633R/+ vs. Slc6a17P633R/P633R); Ala (G, p=0.9871 for Slc6a17+/+ vs. Slc6a17P633R/P633R, p=0.986 for Slc6a17P633R/+ vs. Slc6a17P633R/P633R); Gln (H, p=0.0029 for Slc6a17+/+ vs. Slc6a17P633R/P633R, p=0.0117 for Slc6a17P633R/+ vs. Slc6a17P633R/P633R); Cys (I, p=0.8143 for Slc6a17+/+ vs. Slc6a17P633R/P633R, p=0.5475 for Slc6a17P633R/+ vs. Slc6a17P633R/P633R); Met (J, p=0.9942 for Slc6a17+/+ vs. Slc6a17P633R/P633R, p=0.995 for Slc6a17P633R/+ vs. Slc6a17P633R/P633R); Ser (K, p=0.9955 for Slc6a17+/+ vs. Slc6a17P633R/P633R, p=0.8355 for Slc6a17P633R/+ vs. Slc6a17P633R/P633R); His (L, p=0.6177 for Slc6a17+/+ vs. Slc6a17P633R/P633R, p=0.4316 for Slc6a17P633R/+ vs. Slc6a17P633R/P633R).
-
Figure 10—source data 1
Data points for Figure 10A–L.
- https://cdn.elifesciences.org/articles/86972/elife-86972-fig10-data1-v1.xlsx
Author response image 1

Control experiments to test for contamination.
A. Anti-Syp immunoisolation in Slc6a17-2A-HA-iCre mice. B. Quantification of Gln level in anti-Syt1 and anti-Syb2 immunoisolated fraction. C. Anti-HA immunoisolation in SLC6A7-2A-HA and anti-Slc6a17P633R mice. D. Anti-HA immunoisolation in AAV-PHP.eb-hSyn-SLC38A1-HA overexperssion mice. E. Anti-HA immunoisolation in AAV-PHP.eb-hSyn-TMEM192-HA overexperssion mice. F. Anti-HA immunoisolation in SLC6A7-2A-HA mice under FCCP (50 μM) and NEM (200 μM). G. Anti-Syp immunoisolation in wild type mice under FCCP (50 μM) and Nigercin (20 μM).
Author response image 2
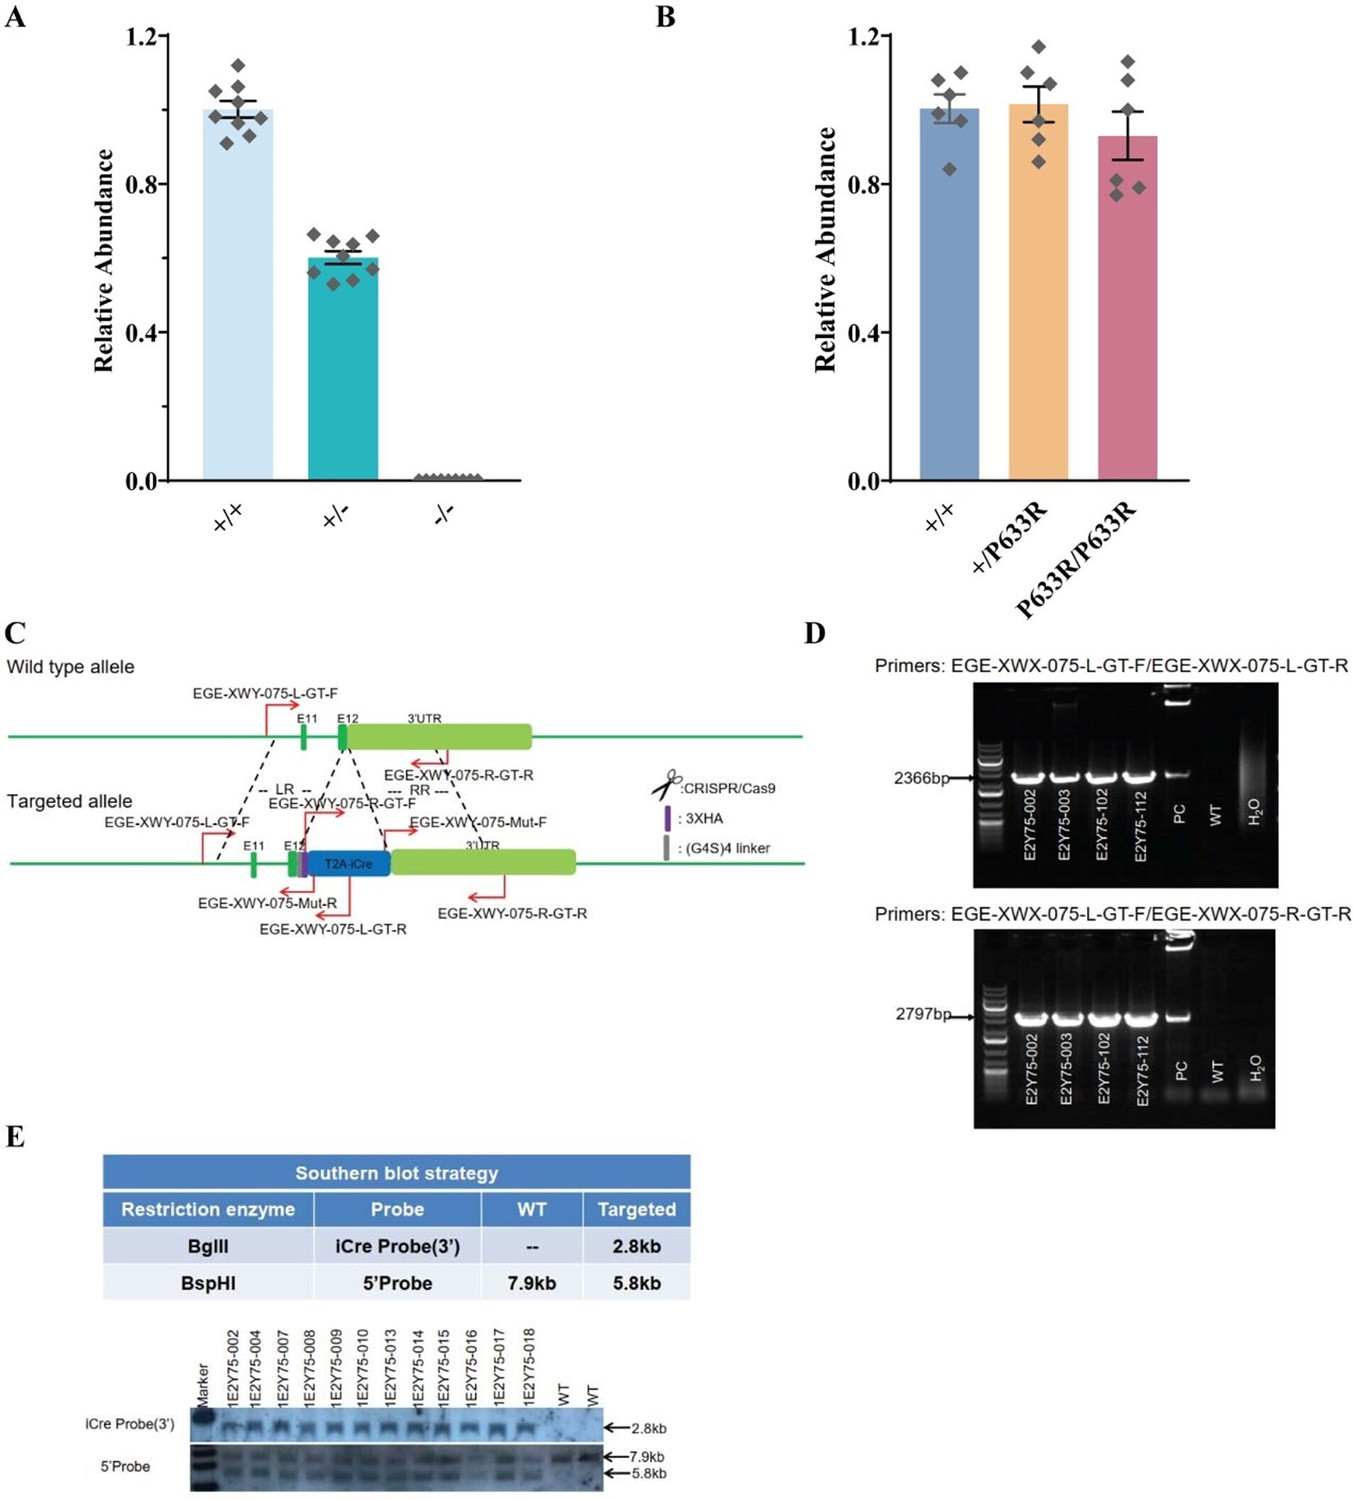
Verification of genetic mouse models.
A. q-PCR verification of Slc6a17-KO mice; B. q-PCR verification of Slc6a17P633R mice; C. Example of genomic primer design for Slc6a17-HA-2A-iCre mice founder mice screen; D. Example of genomic PCR for Slc6a17-HA-2A-iCre mice founder mice screen; E. Southern blot performed for Slc6a17-HA-2A-iCre mice.
Tables
Appendix 1—key resources table
| Reagent type (species) or resource | Designation | Source or reference | Identifiers | Additional information |
|---|---|---|---|---|
| Gene (Homo sapiens) | SLC6A17 | GenBank | NM_001010898.4 | |
| Gene (H. sapiens) | Syp | GenBank | NM_009305.2 | |
| Strain, strain background (C57BJ/N) | Ai14 | Dr. Hongkui Zeng lab | ||
| Strain, strain background (C57BJ/N) | Rosa26-LSL-Cas9 | Jackson Laboratory | 028551 | |
| Strain, strain background (C57BJ/N) | Slc6a17-2A-CreERT2 | CasGene Biotech (Beijing, China) | ||
| Strain, strain background (C57BJ/N) | Slc6a17-KO | CasGene Biotech (Beijing, China) | ||
| Strain, strain background (C57BJ/N) | Slc6a17-HA-2A-iCre | Biocytogen (Beijing, China) | ||
| Strain, strain background (C57BJ/N) | Slc6a17P633R | Biocytogen (Beijing, China) | ||
| Recombinant DNA reagent | pAAV-hSyn-SLC6A17- APEX2-WPRE-pA (plasmids) | This paper | Supplementary file 1 | |
| Recombinant DNA reagent | pAAV-hSyn-SLC6A17- HA-WPRE-pA (plasmids) | This paper | ||
| Recombinant DNA reagent | pAAV-hSyn-SLC6A17G 162R-HA-WPRE-pA (plasmids) | This paper | ||
| Recombinant DNA reagent | pAAV-hSyn-DIO-Syp-HA-WPRE- pA-U6-3-t::gRNA WPRE-pA (plasmids) | This paper | ||
| Recombinant DNA reagent | NEBuilder HiFi DNA Assembly Cloning Kit | NEB | E5520S | |
| Antibody | Anti-Synaptophysin (mouse monoclonal) | Synaptic System | 101011 | IP 1:200 |
| Antibody | Anti-Synaptophysin (rabbit polyclonal) | Synaptic System | 101 002 | IB 1:2000 |
| Antibody | Anti-Synaptotagmin 1 (rabbit polyclonal) | Synaptic System | 105 008 | IB 1:2000 |
| Antibody | Anti-VGLUT 1 (rabbit polyclonal) | Synaptic System | 135 302 | IB 1:2000 |
| Antibody | Anti-Proton ATPase (rabbit polyclonal) | Synaptic System | 109 002 | IB 1:2000 |
| Antibody | Anti-Synaptobrevin 2 (rabbit polyclonal) | Synaptic System | 104 202 | IB 1:2000 |
| Antibody | Anti-SV2A (rabbit polyclonal) | Synaptic System | 119 002 | IB 1:5000 |
| Antibody | Anti-VGAT (rabbit polyclonal) | Synaptic System | 131 002 | IB 1:2000 |
| Antibody | Anti-VGLUT2 (rabbit polyclonal) | Synaptic System | 135 402 | IB 1:2000 |
| Antibody | Anti-SNAP23 (rabbit polyclonal) | Synaptic System | 111 202 | IB 1:2000 |
| Antibody | Anti-GluN1 (mouse polyclonal) | Synaptic System | 114 011 | IB 1:5000 |
| Antibody | Anti-ERC 1b/2 (rabbit polyclonal) | Synaptic System | 143003 | IB 1:5000 |
| Antibody | Anti-Synaptophysin (mouse monoclonal) | Abcam | ab52636 | IF 1:500 |
| Antibody | Alexa Fluor 488 Anti-Synaptophysin (mouse monoclonal) | Abcam | ab196379 | IF 1:200 |
| Antibody | Anti-Cathepsin D (rabbit monoclonal) | Abcam | ab75852 | IB 1:2000 |
| Antibody | Anti-PSMC6 (mouse monoclonal) | Abcam | ab22639 | IB 1:5000 |
| Antibody | Anti-GLUT4 (rabbit monoclonal) | Abcam | ab33780 | IB 1:2000 |
| Antibody | Anti-Transferring receptor (rabbit monoclonal) | Abcam | ab84036 | IB 1:2000 |
| Antibody | Anti-M6PR (rabbit monoclonal) | Abcam | ab124767 | IB 1:2000 |
| Antibody | Anti-LAMP2 (rabbit monoclonal) | CST | #49067 | IB 1:2000 |
| Antibody | Anti-EEA1 (rabbit monoclonal) | CST | #3288 | IB 1:2000 |
| Antibody | Anti-ERp72 (rabbit monoclonal) | CST | #5033 | IB 1:2000 |
| Antibody | Anti-Goglin-97 (rabbit monoclonal) | CST | #12192S | IB 1:1000 |
| Antibody | Anti-GM130 (rabbit monoclonal) | CST | #12480 | IB 1:2000 |
| Antibody | Anti-VDAC (rabbit monoclonal) | CST | #4661S | IB 1:2000 |
| Antibody | Anti-Syntaxin 6 (rabbit monoclonal) | CST | #2869 | IB 1:1000 |
| Antibody | Anti-LC3B (rabbit monoclonal) | CST | #2775 | IB 1:2000 |
| Antibody | Anti-HA (rabbit monoclonal) | CST | #3724S | IB 1:5000 IF 1:200 |
| Antibody | Anti-PSD95 (mouse monoclonal) | NeuroMab | 75028 | IB 1:5000 |
| Antibody | Anti-FLAG M2 HRP (mouse monoclonal) | Sigma | A8592 | IB 1:5000 |
| Commercial assay or kit | TMT10plex Isobaric Label Reagent Set | Thermo Scientific | 90113 | |
| Commercial assay or kit | Pierce High pH Reversed- Phase Peptide Fractionation Kit | Thermo Scientific | 84868 | |
| Commercial assay or kit | Pierce protein G magnetic beads | Thermo Scientific | 88848 | |
| Commercial assay or kit | Pierce anti-HA magnetic beads | Thermo Scientific | 88837 | |
| Sequence-based reagent | KO sgRNA1 (5’- CGATGCTCCAGGCCACAAGGAGG -3’) | Michlits et al., 2020 | Targeting exon 5 | |
| Sequence-based reagent | KO sgRNA2 (5’-GCCGTGGCAGCATTGGTGTGTGG -3’) | Michlits et al., 2020 | Targeting exon 3 | |
| Sequence-based reagent | KO sgRNA3 (5’- TGGGCCTGGGCAACATCTGGAGG -3’) | Michlits et al., 2020 | Targeting exon 2 | |
| Chemical compound, drug | 3,3-Diaminobenzidine | Sigma | D5905 | |
| Software, algorithm | Noldus Video Tracking Software | Noldus | Ethovision XT 15 | |
| Software, algorithm | Prism 8 | GraphPad Software | ||
| Other | SeQuant ZIC-HILIC column (150 mm × 2.1 mm, 3.5 μm) | Merck Millipore | 150442 | HPLC column for chemical detection |
| Other | SeQuant ZIC-pHILIC column (150 mm × 2.1 mm, 5 μm) | Merck Millipore | 150460 | HPLC column for chemical detection |
Additional files
-
Supplementary file 1
Sequence information file for AAV plasmid used in this article.
pAAV-hSyn-SLC6A17-APEX2-WPRE-pA, pAAV-hSyn-SLC6A17-HA-WPRE-pA, pAAV-hSyn-SLC6A17G162R-HA-WPRE-pA, and pAAV-hSyn-DIO-Syp-HA-WPRE-pA-U6-3-t::gRNA WPRE-pA. Sequence information file for pAAV-hSyn-SLC6A17-APEX2-WPRE-pA.
- https://cdn.elifesciences.org/articles/86972/elife-86972-supp1-v1.docx
-
Supplementary file 2
Summarize table for Slc6a17 gene expression in Slc6a17-2A-CreERT2 mice.
Sequence information file for pAAV-hSyn-SLC6A17-HA-WPRE-pA.
- https://cdn.elifesciences.org/articles/86972/elife-86972-supp2-v1.xlsx
-
MDAR checklist
- https://cdn.elifesciences.org/articles/86972/elife-86972-mdarchecklist1-v1.pdf
Download links
A two-part list of links to download the article, or parts of the article, in various formats.
Downloads (link to download the article as PDF)
Open citations (links to open the citations from this article in various online reference manager services)
Cite this article (links to download the citations from this article in formats compatible with various reference manager tools)
Importance of glutamine in synaptic vesicles revealed by functional studies of SLC6A17 and its mutations pathogenic for intellectual disability
eLife 12:RP86972.
https://doi.org/10.7554/eLife.86972.2


