Catecholaminergic neuromodulation and selective attention jointly shape perceptual decision-making
- Department of Psychology, University of Amsterdam, Netherlands
- Amsterdam Brain & Cognition, University of Amsterdam, Netherlands
- Department of Psychiatry (UPK), University of Basel, Switzerland
- Jan and Dan Duncan Neurological Research Institute, Texas Children’s Hospital, United States
- Department of Neuroscience, Baylor College of Medicine, United States
- Cognitive and Systems Neuroscience, Swammerdam Institute for Life Sciences, University of Amsterdam, Netherlands
- Department of Psychiatry, Amsterdam UMC location University of Amsterdam, Netherlands
- Amsterdam Neuroscience, Netherlands
- Institute for Brain and Behavior Amsterdam, Vrije Universiteit Amsterdam, Netherlands
- Department of Experimental and Applied Psychology - Cognitive Psychology, Vrije Universiteit Amsterdam, Netherlands
Figures
Figure 1 with 1 supplement

Experimental set-up: behavioral task, pharmacological manipulation, and physiological responses.
(A) Schematic representation of the behavioral task. Participants responded to the orientation (clockwise/counterclockwise [CW/CCW]) of unilaterally presented Gabor stimuli that were embedded in noise (bilaterally presented). The likely location of the Gabor stimulus was cued (horizontal dash presented 0.33° left/right from fixation) with 80% validity before stimulus onset. (B) Schematic overview of experimental sessions. Participants came to the lab on four occasions: one intake session and three experimental sessions. On the experimental sessions, participants received either placebo (PLC, data in orange), donepezil (DNP, 5 mg, data in green), or atomoxetine (ATX, 40 mg, data in blue). Drug order was counterbalanced across participants. (C) Time schedule of experimental sessions. Participants received a pill on two moments in each session, one at the beginning of the session and a second pill 2 hr later. The first pill contained either placebo (PLC and ATX session) or donepezil (DNP session), the second pill was either a placebo (PLC and DNP session) or atomoxetine (ATX session). Behavioral testing started 4 hr after administration of the first pill. (D) Baseline pupil diameter was measured before onset of the behavioral task. Participants fixated while the background luminance of the monitor was dimmed (for 15 s) and then brightened (for 15 s) to establish the pupil size in dark and bright circumstances. Shading indicates standard error of the mean (SEM). (E–J) Effects of drug on pupil diameter during the dark (Pmax, E) and bright (Pmin, F) measurement windows, heart rate (HR, G), mean arterial blood pressure (MAP, H, see Materials and methods), and subjective ratings (visual analogue scale [VAS]; see Materials and methods) of alertness (panel I) and calmness (J). All measurements except pupil diameter were baseline-corrected to the first measurement taken right before ingestion of the first pill.
-
Figure 1—source data 1
Source files for physiological data.
- https://cdn.elifesciences.org/articles/87022/elife-87022-fig1-data1-v1.zip
Figure 1—figure supplement 1
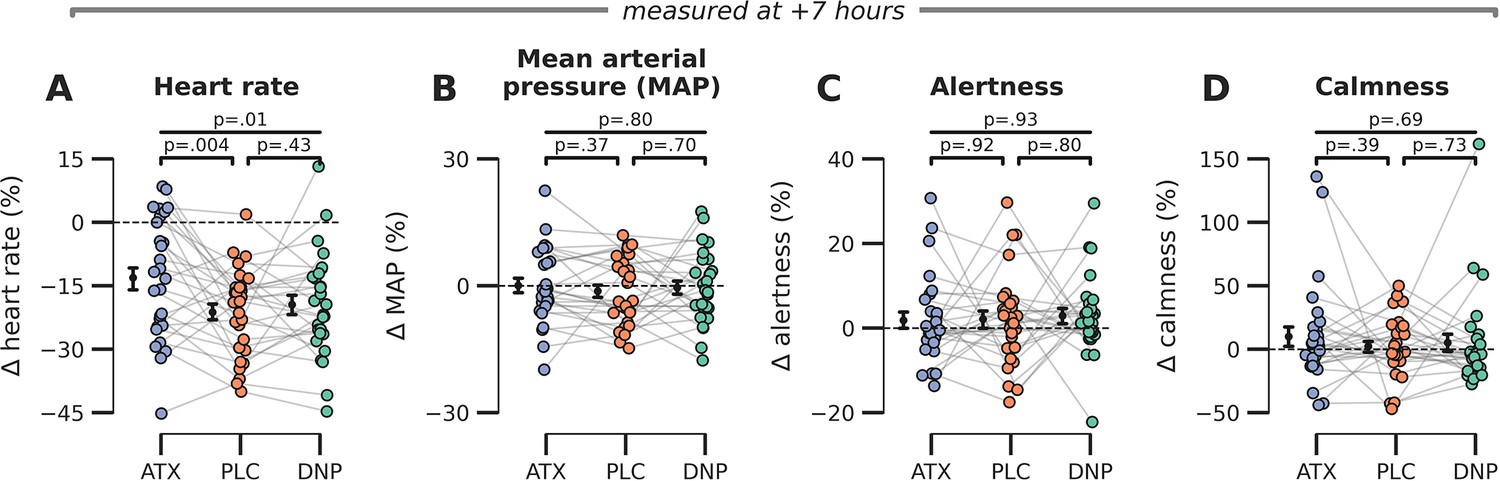
Late effects of drug on subjective and bodily measures of arousal.
(A) Heart rate was modulated by drug condition at the end of the experimental session (F2,54=5.44, p=0.01, = 0.17) and post hoc tests showed that this effect was driven by increased heart rates under ATX vs. PLC (t(27)=3.11, p=0.004, = 0.26) but not DNP vs. PLC t(27)=0.80, p=0.43, = 0.02, BF01=3.72. (B–D) We observed no late effects of drug condition on (B) mean arterial blood pressure (F2,54=0.23, p=0.80, = 0.01), (C) subjective ratings of alertness (F2,54=0.37, p=0.69, = 0.01), and (D) calmness (F2,54=0.03, p=0.97, = 0.00). Error bars around the means indicate SEM. Abbr.: ATX: atomoxetine, PLC: placebo, DNP: donepezil.
-
Figure 1—figure supplement 1—source data 1
Source files for late physiological data.
- https://cdn.elifesciences.org/articles/87022/elife-87022-fig1-figsupp1-data1-v1.zip
Figure 2 with 5 supplements

Behavioral results.
(A) Signal detection theoretic sensitivity (d’), separately per drug and cue validity. Error bars indicate SEM, x demarks the p-value for the omnibus interaction effect between drug condition and cue validity, val. refers to the factor cue validity. (B) As A, but for reaction time (RT). (C) Schematic of the drift diffusion model (DDM), accounting for behavioral performance and RTs. The model describes behavior based on various latent parameters, including drift rate (v), boundary separation (a), and non-decision time (t0). These parameters (demarked with Y in formula) were allowed to fluctuate with cue validity, drug condition, and their interaction. Models were fitted separately for atomoxetine (ATX) (+placebo [PLC]) and donepezil (DNP) (+PLC). (D–E) Posterior probability distributions for DDM parameter estimates (blue: ATX model, green: DNP model). The effects of cue validity (left column), drug (middle column), and their interaction (right column) are shown for (D) drift rate and (E) non-decision time.
-
Figure 2—source data 1
Source files for behavioral data and computational analyses.
- https://cdn.elifesciences.org/articles/87022/elife-87022-fig2-data1-v1.zip
Figure 2—figure supplement 1
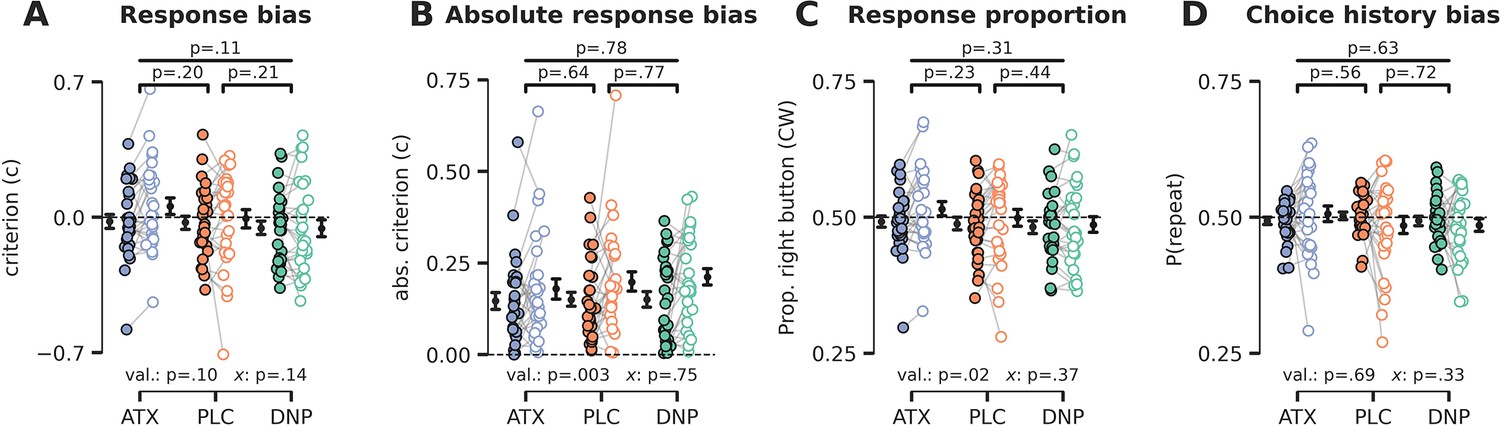
Cue validity and drug condition effects on (choice history) bias.
(A) Signal detection theory (SDT) criterion was not modulated by cue validity (F1,27=2.89, p=0.10, = 0.10) or drug (F2,54=2.31, p=0.11, = 0.08), nor was there a modulatory effect of drug on the effects of cue validity (F2,54=2.01, p=0.14, = 0.07). (B) Absolute SDT criterion was minimized for validly cued trials, suggesting that participants were more biased (either liberal or conservative) when they did not attend the target stimulus (F1,27=11.05, p=0.003, = 0.29). There were no drug condition main effects (F2,54=0.25, p=0.78, = 0.01) and interaction effects (F2,54=0.29, p=0.75, = 0.01). (C) Participants pressed the right button more often during invalidly cued trials (F1,27=5.79, p=0.02, = 0.18), possibly related to defaulting back to their preferred hand (right-handedness), but there was no main effect of drug condition (F2,54=1.19, p=0.31, = 0.04) nor an interaction between cue validity and drug (F2,54=1.02, p=0.37, = 0.04). (D) We did not observe any effects of drug condition (F2,54=0.46, p=0.63, = 0.02), cue validity (F1,27=0.17, p=0.69, = 0.01), or their interaction (F2,54=1.14, p=0.33, = 0.04) on choice history bias. Note that x demarks the omnibus interaction between drug condition and cue validity. Val. (short for validity) refers to the factor cue validity.
-
Figure 2—figure supplement 1—source data 1
Source files for behavioral data.
- https://cdn.elifesciences.org/articles/87022/elife-87022-fig2-figsupp1-data1-v1.zip
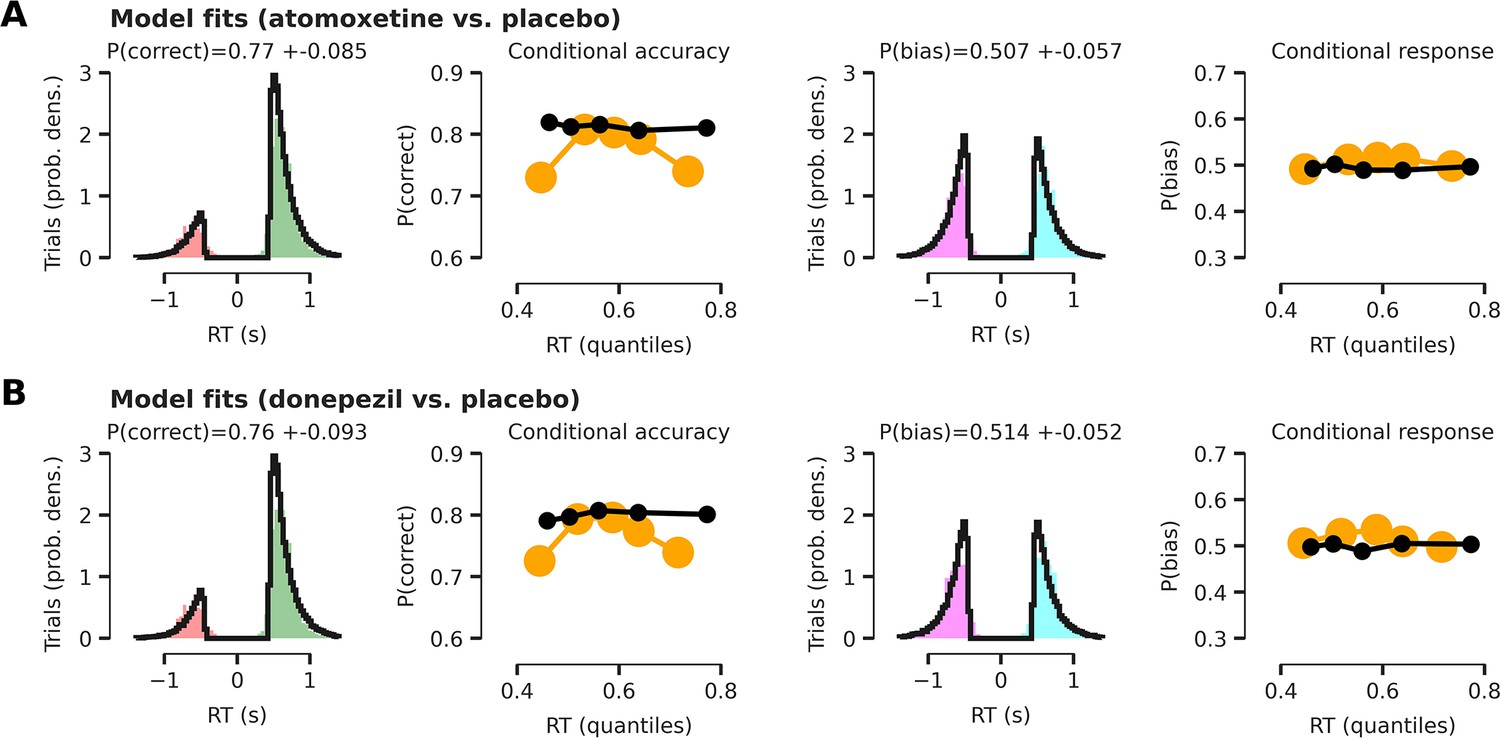
Figure 2—figure supplement 2
HDDM model fits.
All model fits are shown with respect to the empirical data after collapsing across conditions (cue validity and drug). Note that our modeling approach renders the drift diffusion model (DDM) fits complicated to interpret, as the intercept of the effect-coded regression implementation of the DDM reflects a grand mean across conditions. Therefore, model fits show how well empirical data fits the model across all experimental conditions. (A) Model fits for the atomoxetine (vs. placebo) model. Left panel shows reaction time (RT) fits (black lines) for incorrect and correct responses. Empirical RTs for correct responses are shown in green, for erroneous responses in red. The second panel (from the left) shows modeled proportion correct (black dots) within 5 quantiles of modeled RTs, compared to empirical proportion correct responses (yellow dots) within 5 quantiles of empirical RTs. Right two panels are similar to left two, but show RT distributions for left (turquoise) vs. right (purple) button responses and the proportion of right button responses within each RT bin. (B) Same as panel (A), but for the donepezil (vs. placebo) model. The first quintile seems relatively poorly fitted. This is because the model was fitted after excluding outlier RTs (5% of data; Materials and methods; Wiecki et al., 2013), which are typically very short-latency errors. Thus, these outlier RTs have an effect on the first empirical quintile (yellow), but not on synthetic data generated by the fitted model (black).
-
Figure 2—figure supplement 2—source data 1
Source files for drift diffusion model (DDM) fits.
- https://cdn.elifesciences.org/articles/87022/elife-87022-fig2-figsupp2-data1-v1.zip
Figure 2—figure supplement 3

No effects of cue validity, drug, and their interaction on decision bound separation in weighted regression drift diffusion model (DDM).
The computational model described in the main text allowed drift rate, non-decision time, and decision bound separation to fluctuate with drug and cue validity. There were no effects of cue validity and drug on decision boundary separation. Blue distribution = atomoxetine (ATX) model, green distribution = donepezil (DNP) model.
-
Figure 2—figure supplement 3—source data 1
Source files for drift diffusion model (DDM) model bound estimates.
- https://cdn.elifesciences.org/articles/87022/elife-87022-fig2-figsupp3-data1-v1.zip
Figure 2—figure supplement 4

Parameter estimates of unweighted regression drift diffusion model (DDM).
We verified whether applying weights to our effect coding scheme for the regression DDMs, used to counteract the disbalance in the proportion of validly and invalidly cued trials, affected our parameter estimates in any way by fitting the exact same models but now using regular, unweighted, effect coding for cue validity (–1 and 1).There were no substantial differences in parameter estimates compared to the model that used weighted effect coding. Blue distribution = atomoxetine (ATX) model, green distribution = donepezil (DNP) model.
-
Figure 2—figure supplement 4—source data 1
Source files for unweighted drift diffusion model (DDM) regression model parameter estimates.
- https://cdn.elifesciences.org/articles/87022/elife-87022-fig2-figsupp4-data1-v1.zip
Figure 2—figure supplement 5

Drift rate variability was not modulated by drug or cue validity.
This additional model allowed drift rate (top row), drift rate variability (middle row), and non-decision time (bottom row) to fluctuate with cue validity, drug condition, and their interaction, but decision bound separation was fixed across conditions. We observed no significant effects on drift rate variability. Blue distribution = atomoxetine (ATX) model, green distribution = donepezil (DNP) model.
-
Figure 2—figure supplement 5—source data 1
Source files for weighted drift diffusion model (DDM) regression drift rate variability model parameter estimate.
- https://cdn.elifesciences.org/articles/87022/elife-87022-fig2-figsupp5-data1-v1.zip
Figure 3 with 1 supplement
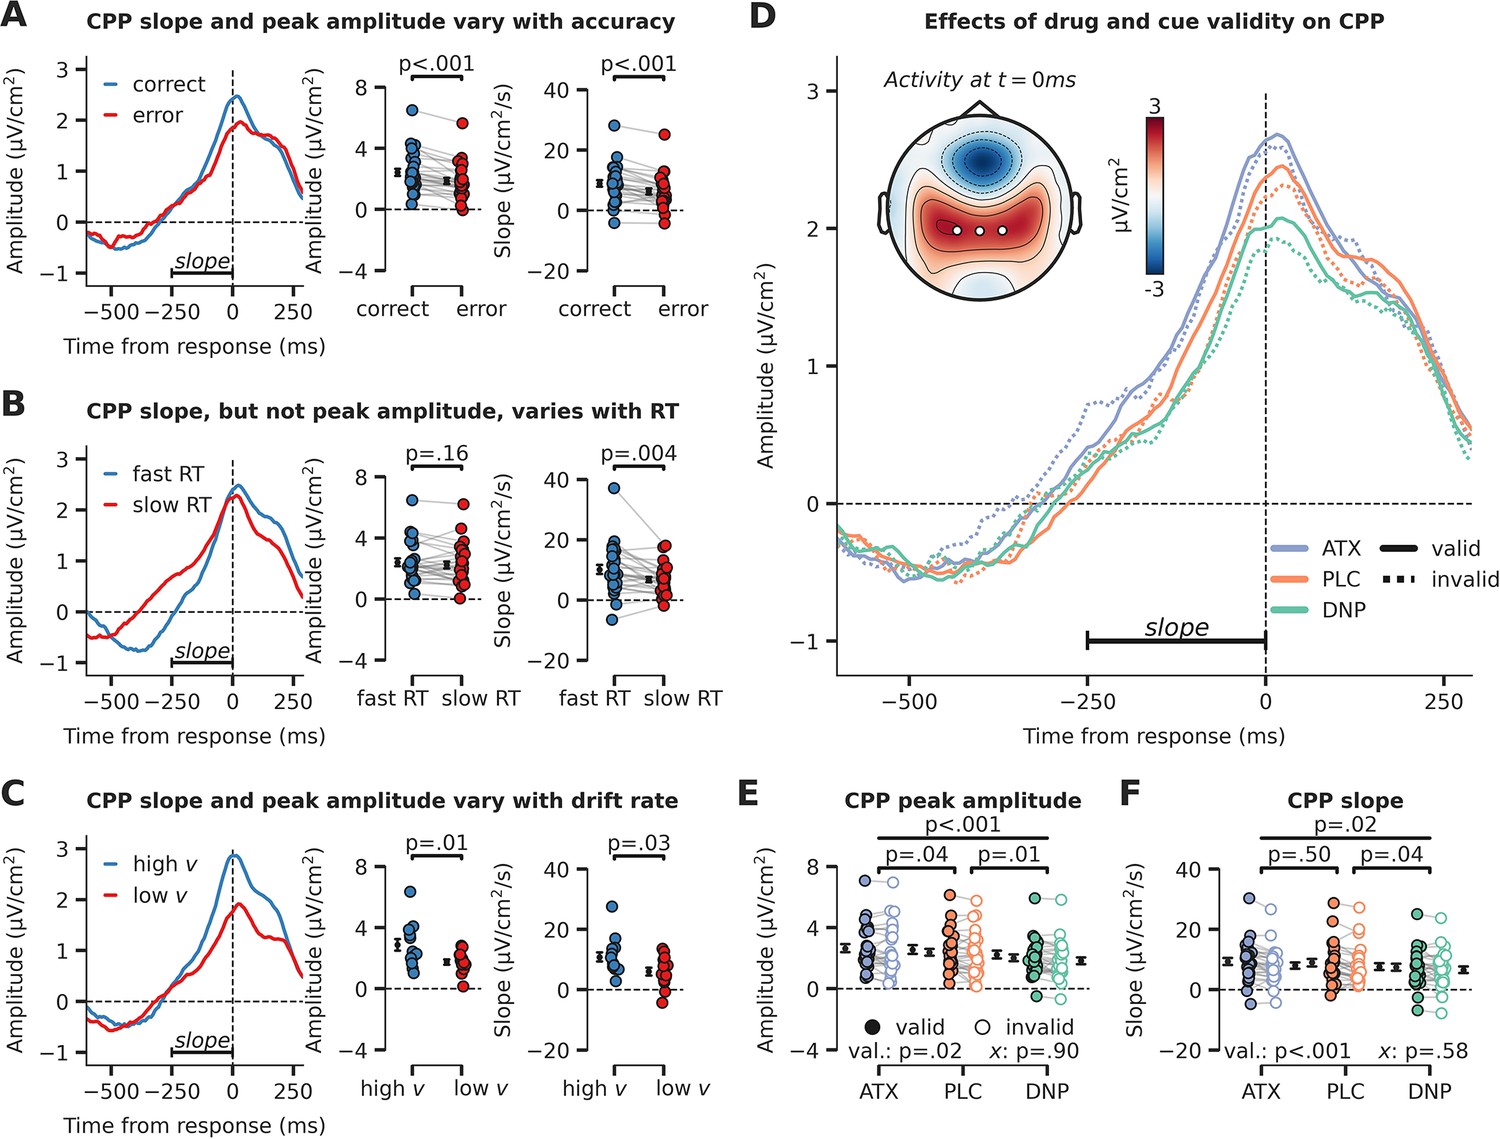
Evidence accumulation is affected by cue validity and drug, indexed by changes in centro-parietal positivity (CPP).
(A) Response-locked CPP for correct and incorrect answers, (B) for trials with fast and slow reaction times (RTs) and (C) for participants with overall high drift rate and low drift rate. (D) Modulation of response-locked CPP by drug and cue validity. The horizontal black line indicates the time-window for which CPP slope was calculated (linear regression from –250 ms to 0 ms pre-response). The topographic map shows activation at the moment of the response, with white markers indicating the centro-parietal ROI used for the CPP analyses (channels CP1, CP2, CPz). (E) Peak CPP amplitude, separately for drug and cue validity. (F) CPP slope for all drug and cue validity conditions. Note that x demarks the p-value for the omnibus interaction effect between drug condition and cue validity and that val. (short for validity) refers to the factor cue validity. Error bars indicate SEM.
-
Figure 3—source data 1
Source files for centro-parietal positivity (CPP) data and analyses.
- https://cdn.elifesciences.org/articles/87022/elife-87022-fig3-data1-v1.zip
Figure 3—figure supplement 1

Centro-parietal positivity (CPP) topography without current source density (CSD) transformation.
The topographic map shows activation at the moment of the response, with white markers indicating the centro-parietal region of interest (ROI) used for the CPP analyses (channels CP1, CP2, CPz).
-
Figure 3—figure supplement 1—source data 1
Source files for centro-parietal positivity (CPP) topographical data (without current source density [CSD] transformation).
- https://cdn.elifesciences.org/articles/87022/elife-87022-fig3-figsupp1-data1-v1.zip
Figure 4 with 1 supplement

Modulation of perceptual processing by drug and attention, indexed by changes in occipito-temporal activity.
(A) Schematic of the definition of ERP conditions, based on the cued location and the location of the target stimulus. The cue was presented before the stimulus and is not shown here, but the cued and uncued location are, respectively, illustrated by solid and dashed circles around the stimulus (not shown in the actual experiment). We extracted activity from bilateral occipito-temporal regions of interest (ROIs) (left ROI: P7/P9 and right ROI: P8/P10; see white markers in topographic map), separate for target stimuli (ROI contralateral to target) and noise stimuli (ROI ipsilateral to the target) and cued stimuli (ROI contralateral to cued location) and uncued stimuli (ROI ipsilateral to cued location). This was done for each drug condition. In the schematic we show two example scenarios for when the target stimulus appeared on the right side of fixation (it could also appear on the left side of fixation). In the first example, in the left panel, the target stimulus was cued (validly cued trial), in which case the left ROI shows activity related to the ‘cued target’ and the right ROI shows activity related to the ‘uncued noise’ stimulus. In the second example, in the right panel, the noise stimulus was cued (invalidly cued trial) in which case the right ROI shows activity related to the ‘cued noise’ stimulus and the left ROI shows activity related to the ‘uncued target’ stimulus. By defining ERP traces as such, we were able to investigate the effects of the spatial cue in isolation (i.e. cued vs. uncued, spatial attention effect) and in interaction with stimulus identity (i.e. cue validity effect). (B) Stimulus-locked ERPs (0 ms = stimulus presentation) over regions processing the target stimulus (i.e. contralateral to target stimulus, opaque line) and the noise stimulus (i.e. ipsilateral to target stimulus and/or contralateral to noise stimulus, transparent line). These traces are further split up depending on cue condition, meaning whether the stimulus was cued (i.e. contralateral to the cue, continuous line) or uncued (i.e. ipsilateral to the cue, dashed line). Note that the traces of validly cued trials can be seen in both cued target (solid, opaque lines) and uncued noise trials (dashed, transparent lines). Finally, the traces are plotted for the different drug conditions. (C) The main effects of cue (cued vs uncued, left panel), stimulus identity (target vs. noise, middle panel), and drug condition (ATC/donepezil [DNP]/placebo [PLC], right panel). (D) Data extracted from these cluster for each of the conditions of the main effect. Post hoc two-sided t-test were performed to test the respective effects of atomoxetine (ATX) and DNP vs. PLC (right panel). Error bars indicate SEM.
-
Figure 4—source data 1
Source files for stimulus-locked occipital ERP data.
- https://cdn.elifesciences.org/articles/87022/elife-87022-fig4-data1-v1.zip
Figure 4—figure supplement 1
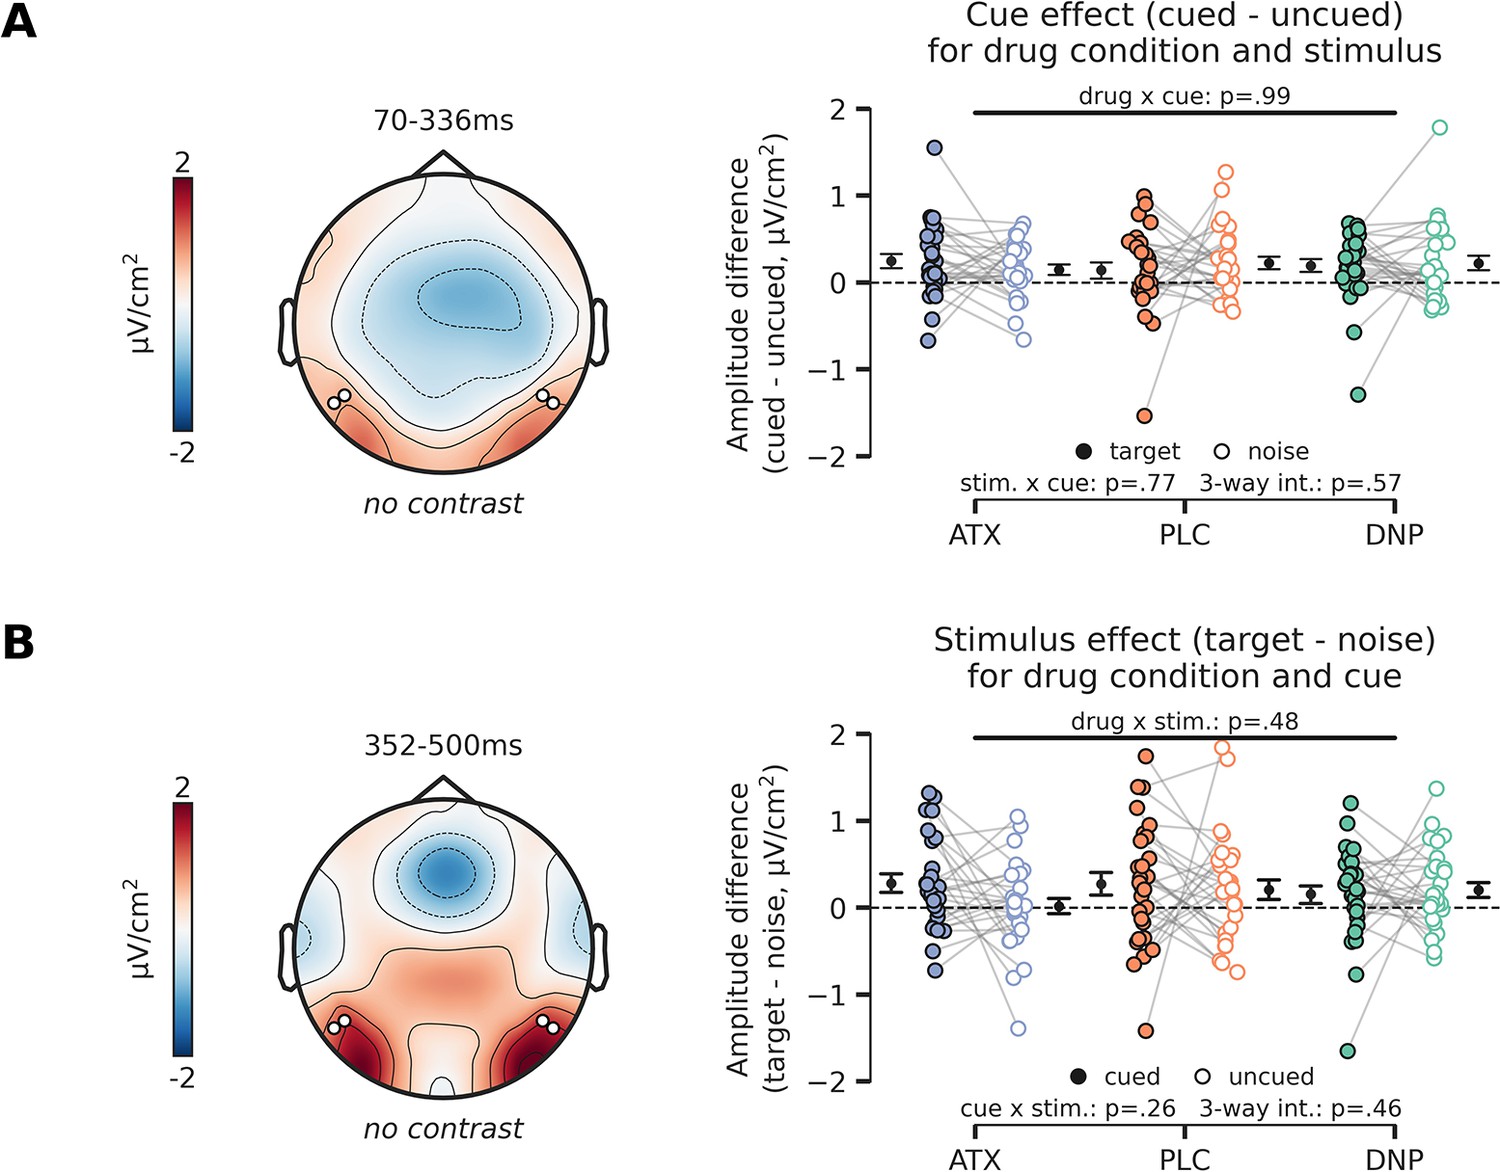
Post-hoc analyses of interactions with stimulus-locked cue-effect and stimulus effect.
(Α) Topographic map (left panel) shows overall activity (no contrast) across all conditions in the time-window in which we observed a main effect of cue (Figure 4C, left panel). The cue effect (difference between cued and uncued) is plotted in the right panel, separately for targets vs. noise stimuli and for drug condition (atomoxetine [ATX]/donepezil [DNP]/placebo [PLC]). Post hoc tests revealed that the cue effect was not modulated by drug condition, stimulus identity (target or noise), nor was there a three-way interaction between cue, stimulus identity, and drug condition. (B) Same as (A), but for the stimulus identity effect. The stimulus identity effect (difference between target and noise stimulus) is plotted in the right panel split up for drug and cue (cued/uncued) conditions. The stimulus effect was not modulated by the drug and cue conditions and we also did not observe a three-way interaction effect. Error bars indicate SEM.
-
Figure 4—figure supplement 1—source data 1
Source files for additional stimulus-locked occipital ERP analyses.
- https://cdn.elifesciences.org/articles/87022/elife-87022-fig4-figsupp1-data1-v1.zip
Figure 5 with 1 supplement
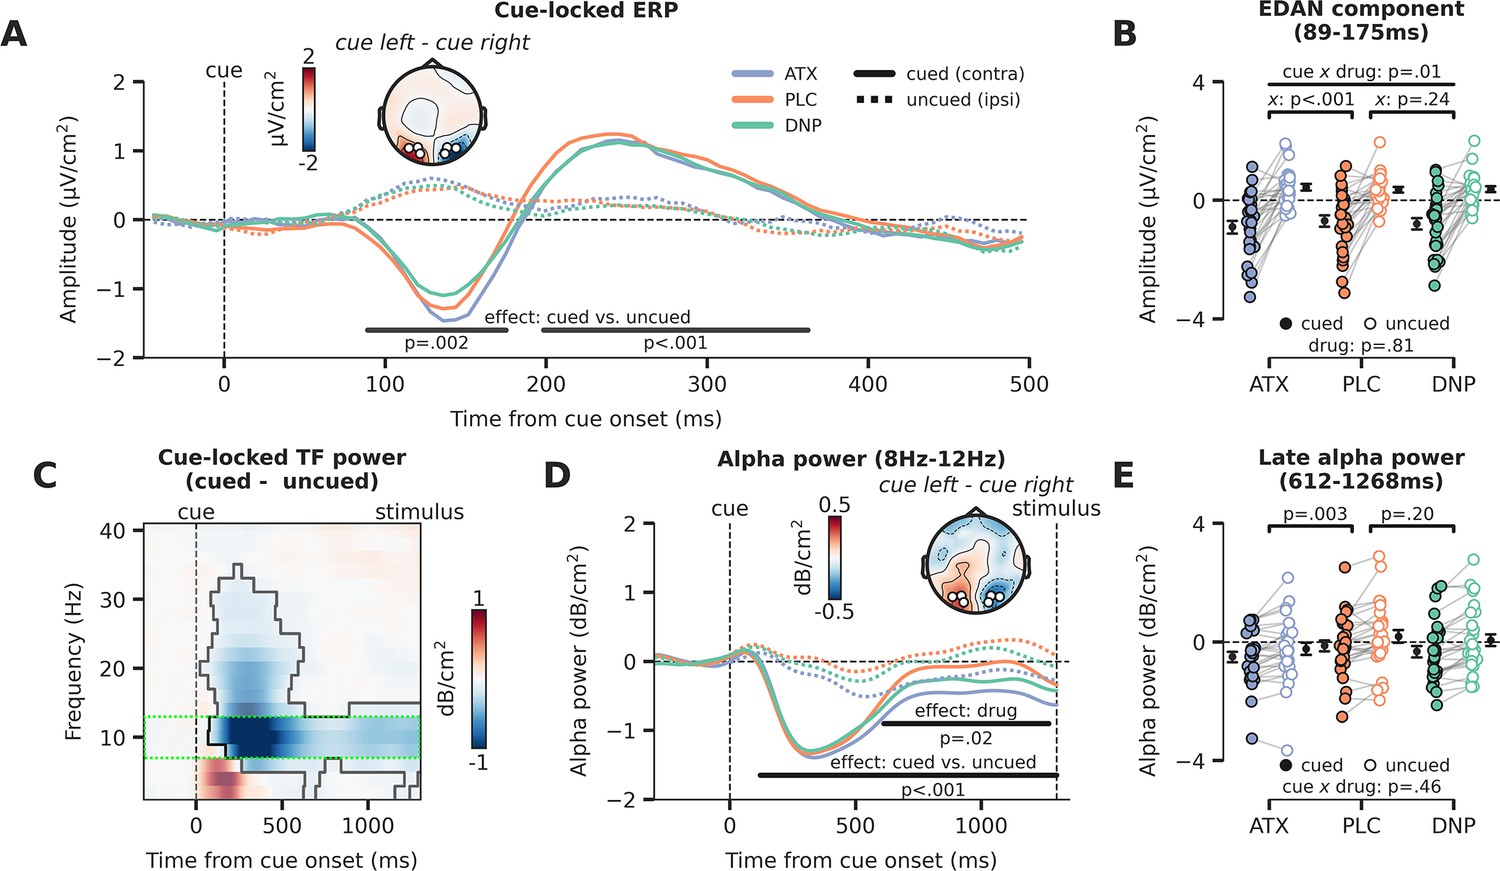
Attentional and catecholaminergic modulation of prestimulus cortical activity.
(A) Cue-locked ERP (µV/cm2) over occipital regions reflecting the cued location (hemisphere contralateral to the cued direction) and reflecting the uncued location (hemisphere ipsilateral to the cued direction), split up for the three drug conditions. Black horizontal bars show repeated measures ANOVA (rmANOVA) main effects of cue, cued (contra) vs. uncued (ipsi), cluster corrected for multiple comparisons. The topographic map shows the contrast between a cue to the left vs. a cue to the right (time-window: 89–175 ms, early cluster in which we observed the lateralization effect). White markers indicate the regions of interest (ROIs) used for all cue-locked analyses. (B) Average activity within the early temporal cluster for the hemisphere associated with the cued (contra) vs uncued (ipsi) location as a factor of drug, showing lateralized effects. The p-value of the interaction effect between cue and drug (pairwise vs. placebo [PLC]) is demarked with x. (C) The difference in time-frequency (TF) power (dB/cm2) for cued (contra) vs uncued (ipsi) locations (lateralization effect). The significant TF cluster (highlighted by the solid black line) is derived from cluster-based permutation testing controlling for multiple comparisons. The green dotted box indicates the alpha-band TF ROI that is used to compute panel D. (D) Cue-locked prestimulus alpha power (dB/cm2) over occipital regions associated with the cued (contra) and uncued (ipsi) location, split up for the three drug conditions. Black horizontal bars show rmANOVA main effects for cue (contra vs. ipsi, lateralization effect) and drug. The topographic map shows the contrast between when a cue to the left vs. a cue to the right was presented (time-window: 659–1253 ms, cluster in which we observed a main effect of drug). (E) Average alpha power within the late temporal cluster in which drug effects on alpha power were observed, split up for cue and drug conditions. The p-values on top reflect the main effects between atomoxetine (ATX)/donepezil (DNP) and placebo (PLC) and the p-value at the bottom demarked with x depicts the omnibus interaction effect between drug condition and cue. Error bars indicate SEM.
-
Figure 5—source data 1
Source files for cue-locked ERP and time-frequency data.
- https://cdn.elifesciences.org/articles/87022/elife-87022-fig5-data1-v1.zip
Figure 5—figure supplement 1
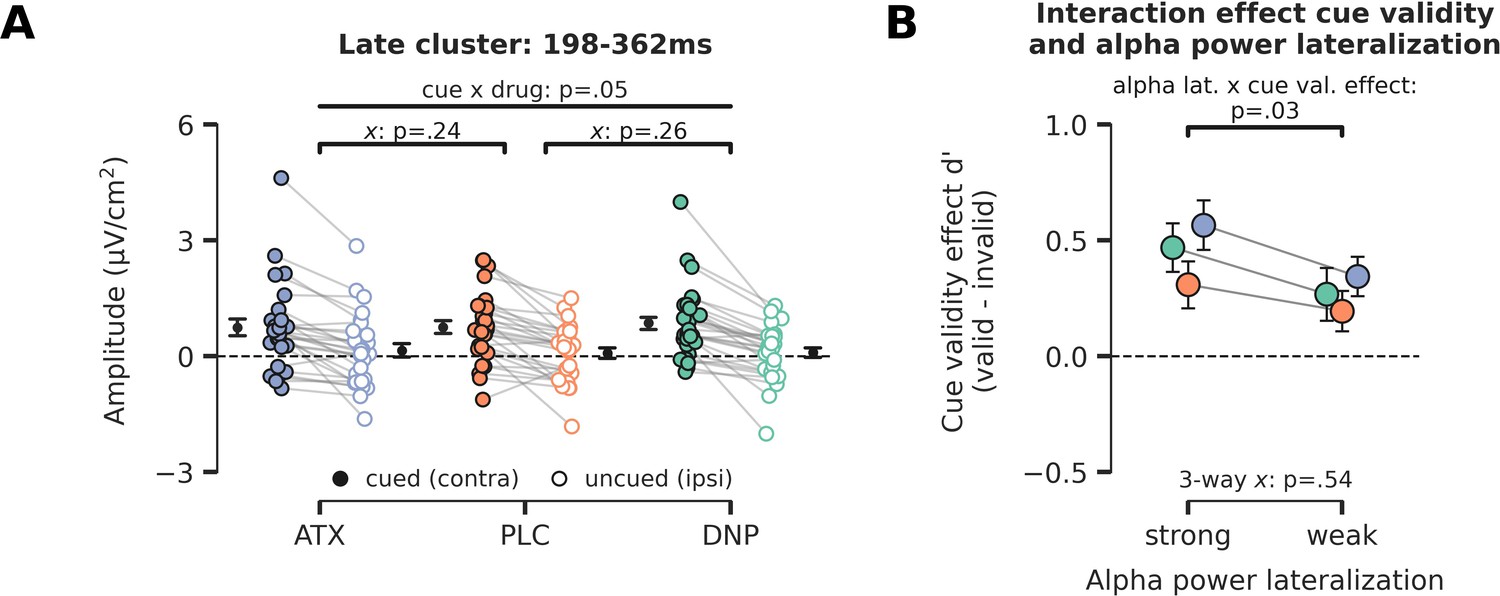
Late cue-locked ERP effects and relation between prestimulus alpha power and behavioral cue validity effects.
(A) Late cue-locked activity. The difference in activity between hemispheres associated with the cued and uncued location (contra minus ipsi) for the time-window of 198–362 ms. A trending interaction between cue and drug was observed, but pairwise post hoc tests showed no reliable differences for atomoxetine (ATX)/donepezil (DNP) vs. placebo (PLC) separately. Note that x demarks p-value for pairwise (drug vs. PLC) interaction effect. (B) To test whether alpha-band lateralization bears any relation to task performance, we grouped trials in two bins according to the level of alpha-band suppression in the late time-window (median split: strong vs weak alpha-band lateralization). We observed that trials with strong alpha power lateralization were associated with better performance when targets were validly cued vs when they were invalidly cued (F1,27=5.14, p=0.03, = 0.16). Efficient allocation of attention thus aids performance for validly cued trials, but harms performance when the target is presented at the unattended location. Enhanced neuromodulatory activity did not alter this relationship (three-way interaction: F2,54=0.63, p=0.54, = 0.02, BF01=4.33). Error bars indicate SEM.
-
Figure 5—figure supplement 1—source data 1
Source files for late cue-locked ERP cluster and alpha data.
- https://cdn.elifesciences.org/articles/87022/elife-87022-fig5-figsupp1-data1-v1.zip
Additional files
Download links
A two-part list of links to download the article, or parts of the article, in various formats.
Downloads (link to download the article as PDF)
Open citations (links to open the citations from this article in various online reference manager services)
Cite this article (links to download the citations from this article in formats compatible with various reference manager tools)
Catecholaminergic neuromodulation and selective attention jointly shape perceptual decision-making
eLife 12:RP87022.
https://doi.org/10.7554/eLife.87022.3


