Extensive remodelling of the cell wall during the development of Staphylococcus aureus bacteraemia
- School of Cellular and Molecular Medicine, University of Bristol, United Kingdom
- Department of Life Sciences, University of Bath, United Kingdom
- Department of Biosciences, Università degli Studi di Milano, Italy
- Institute of Tropical Medicine, University of Tübingen, Germany
- Centre for Ecology and Conservation, University of Exeter, Penryn Campus, United Kingdom
- Laboratory of Bacteriology, National Institute of Allergy and Infectious Diseases (NIAID), US National Institutes of Health (NIH), United States
- Host Pathogen Interactions Group, School of Biochemistry and Immunology, Trinity College Dublin, Ireland
- Schools of Microbiology and Medicine, University College Cork, and APC Microbiome Ireland, Ireland
Figures
Figure 1
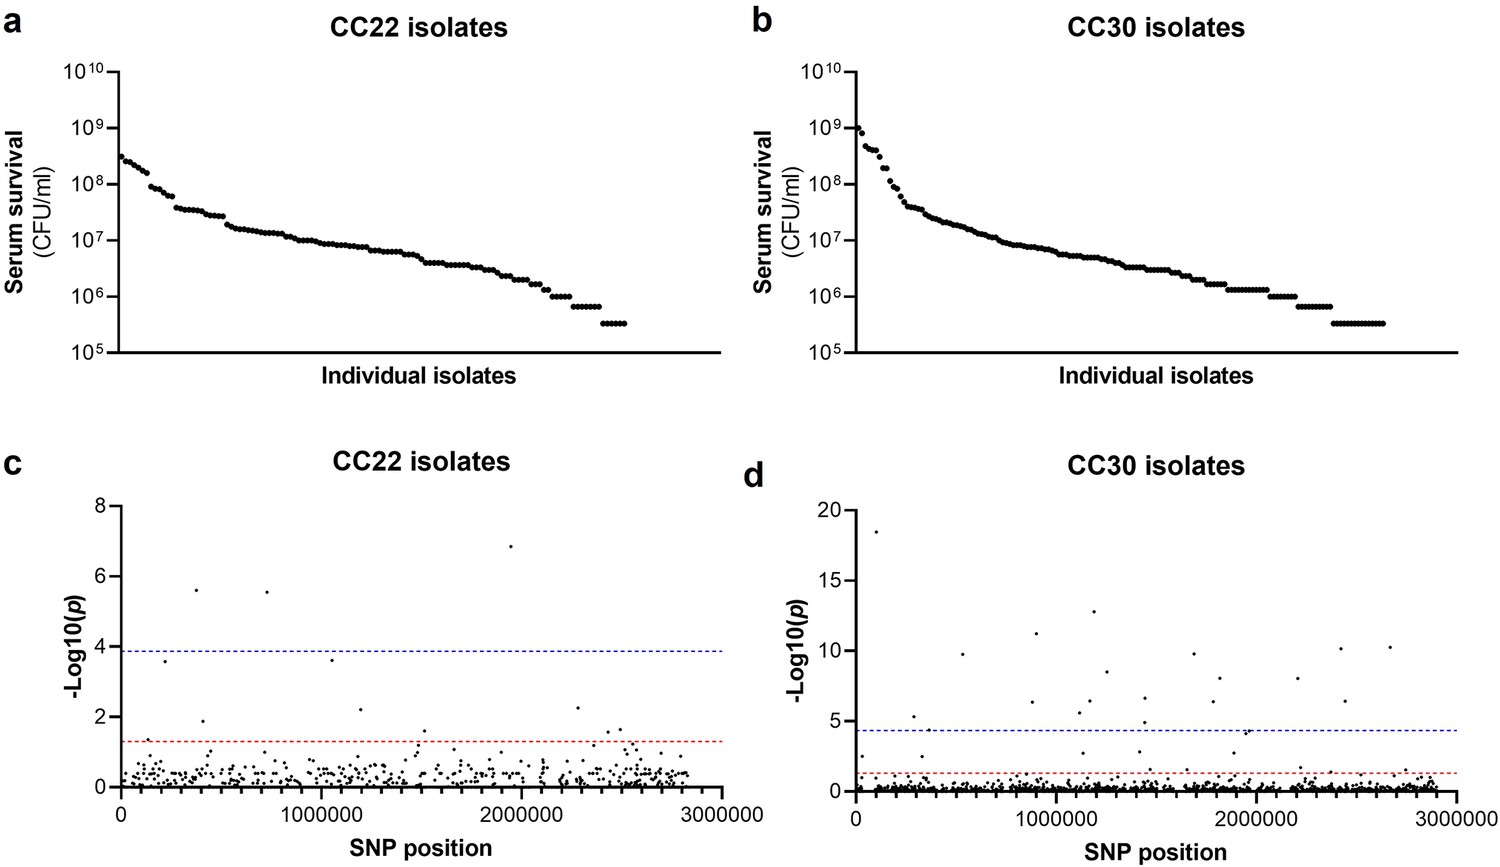
Serum susceptibility is multifactorial and varies widely across closely related S. aureus isolates.
(a and b) The susceptibility of 300 bacteraemia isolates from clonal complexes clonal complex 22 (CC22) and CC30 were exposed to human serum and their ability to survive this exposure quantified. The survival of each isolate was quantified in triplicate and dot represents the mean of these data. (c and d) Manhattan plots representing the statistical associations (on the y axis) between individual single nucleotide polymorphisms (SNPs) across the genome (on the x axis) and serum survival. The dotted red line represents the uncorrected significance threshold, and the dotted blue line represents the Sidak corrected (for multiple comparisons) threshold.
Figure 2
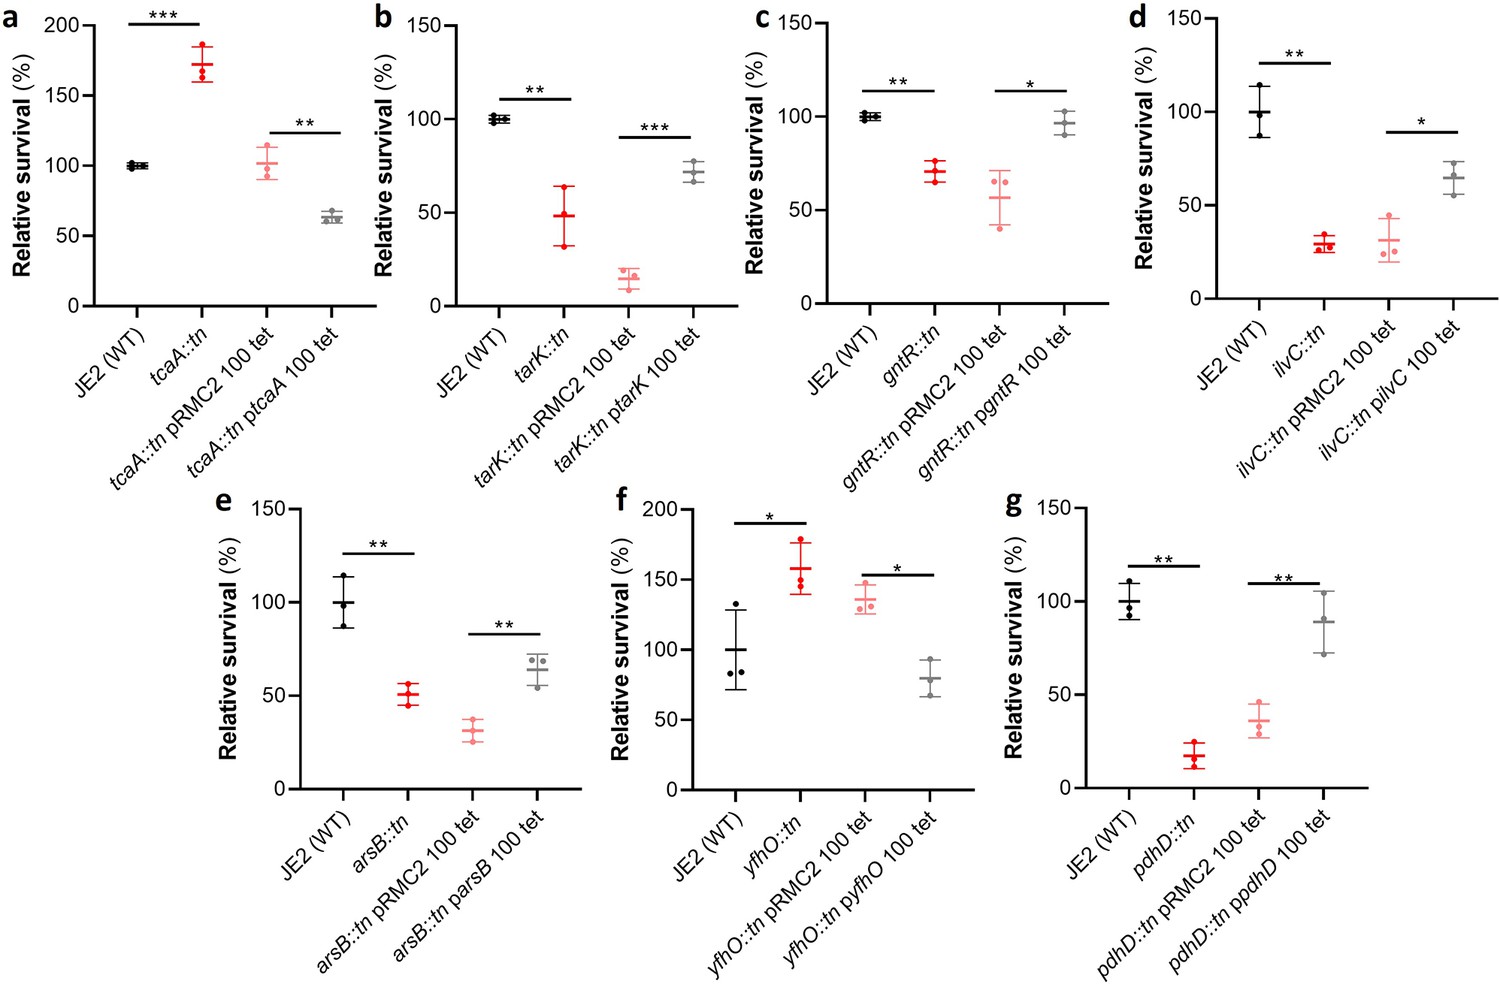
Functional verification of loci involved in serum sensitivity of S. aureus.
The effect of the inactivation of the genes associated serum sensitivity was examined using transposon mutants of strain JE2. Of the 32 mutants tested seven were significantly affected: (a) tcaA, (b) tarK, (c) gntK, (d) ilvC, (e) arsB, (f) yhfO, and (g) pdhD. The effect of the mutations on serum sensitivity was complemented by expressing the gene from the expression plasmid pRMC2 (e.g., the tcaA complementing plasmid is called ptcaA). The dots represent individual data points (n=3), the bars the mean value, and the error bars the standard deviation. Significance was determined as *<0.05, **<0.01, ***<0.001.
Figure 3
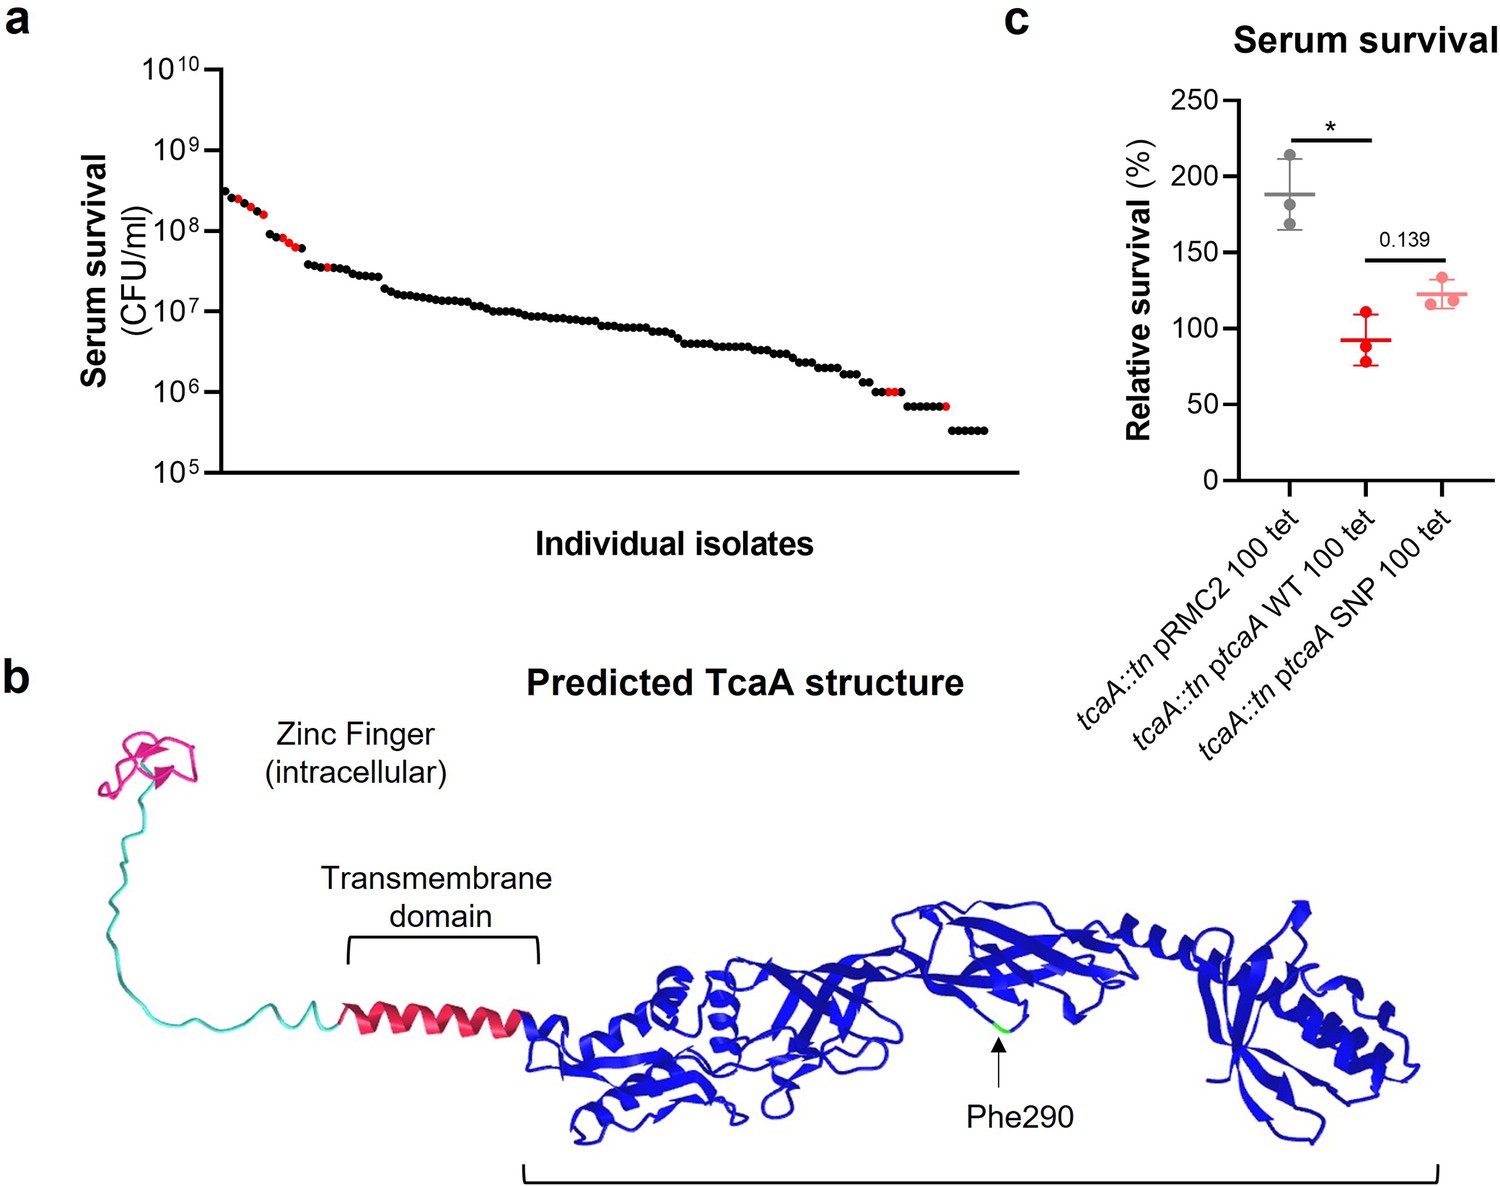
The clinical tcaA mutations are associated with increased serum resistance.
(a) The individual clinical isolates with polymorphism in the tcaA gene are indicated (in red) on a graph displaying the range of serum survival of the collection. (b) The structure of the TcaA protein as predicted by AlphaFold. (c) The most common tcaA single nucleotide polymorphism (SNP) decreases the sensitivity of S. aureus to serum. The dots represent individual data points (n=3), the bars the mean value, and the error bars the standard deviation. Significance was determined as *<0.05.
Figure 4 with 2 supplements
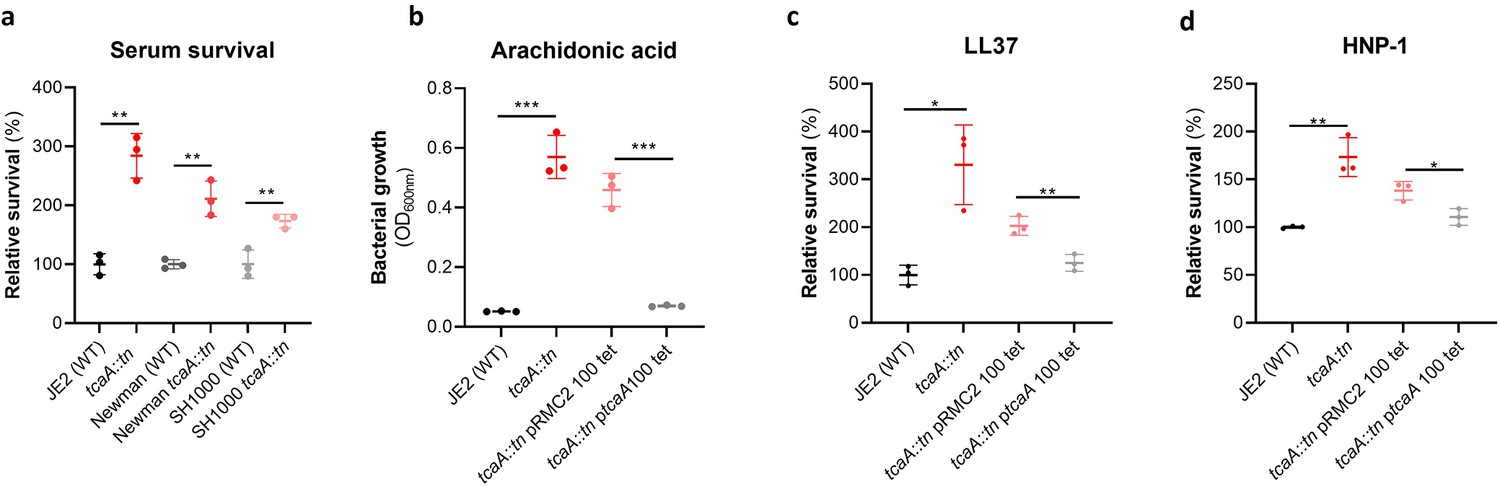
TcaA production confers increased sensitivity to several antibacterial components of serum.
(a) The inactivation of the tcaA gene decreases the sensitivity of three S. aureus strains (i.e., JE2, Newman and SH1000) to serum (90 min exposure). (b) TcaA production by the wild type and ptcaA complemented strain confers increased sensitivity to arachidonic acid (100 μM) following overnight growth. (c) TcaA production by the JE2 wild type and ptcaA complemented strain confers increased sensitivity to LL37 (5 μg/ml, 90 min exposure) and (d) TcaA production by the wild type and ptcaA complemented strain confers increased sensitivity to HNP-1 (5 μg/ml, 90 min exposure). The dots represent individual data points (n=3), the bars the mean value, and the error bars the standard deviation. Significance was determined as *<0.05, **<0.01, ***<0.001.
Figure 4—figure supplement 1

TcaA does not contribute to the clumping of S.aureus when incubated with serum.
A pair of light microscopy images has been provided for each of the wild type and tcaA mutant incubated with either PBs or human serum. No differences in clumping of the bacterial cells were observed.
Figure 4—figure supplement 2

Sensitivity of genome-wide association study (GWAS) identified loci to antibacterial components of serum.
(a) The ilvC mutant is more resistant to arachidonic acid. The bars represent the mean value. (b and c) The tarK, gntK, arsB, and pdhD mutants are all more sensitive to LL-37 and HNP-1, whereas the yfhO mutant was more resistant to both. The dots represent individual data points (n=3), the bars the mean value, and the error bars the standard deviation. Significance was determined as *<0.05, **<0.01, ***<0.001.
Figure 5
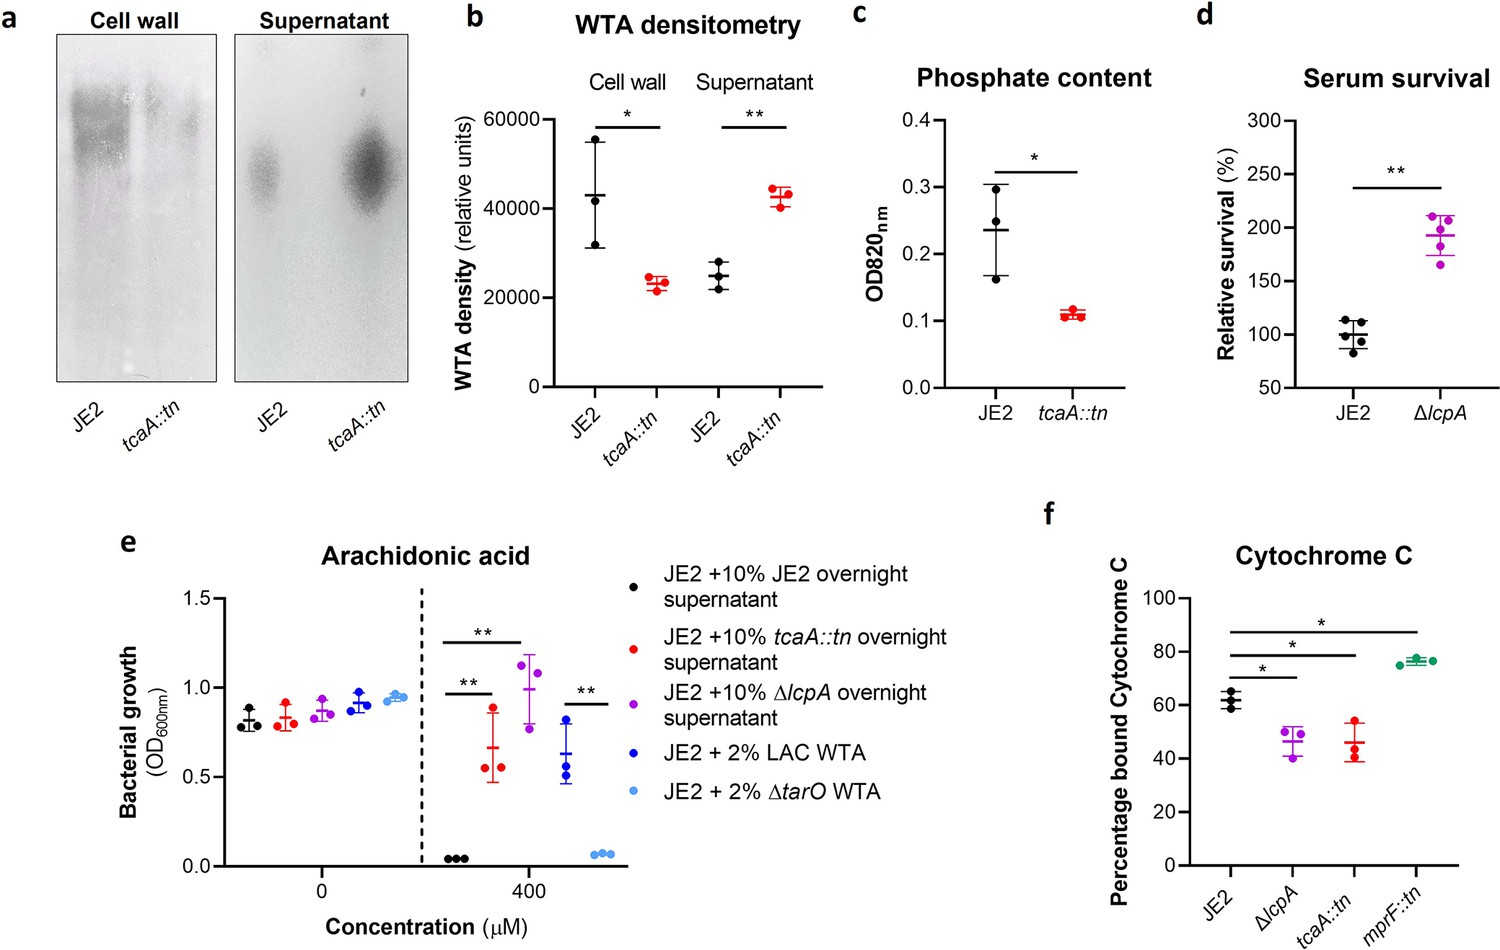
Wall teichoic acids (WTA) are released from the cell wall in the tcaA mutant to affect resistance to host defence fatty acids (HDFAs) and antimicrobial peptides (AMPs).
(a) WTA was extracted from both cells and supernatant of the wild type and tcaA mutant of S. aureus and visualised on and SDS-PAGE gel stained with 1 mg/ml Alcian blue. The tcaA mutant had significantly less WTA in the cell wall but more in the supernatant. (b) The WTA extractions were performed on the wild type and tcaA mutant in triplicate the relative density of the WTA quantified by densitometry. (c) The phosphate content of the cell wall WTA extracts was quantified, which verified that the tcaA mutant has significantly less WTA. (d) The inactivation of the lcpA gene increases the sensitivity of S. aureus to killing by serum. (e) The wild type strain JE2 was grown in broth supplemented (at 10%) with supernatant of either itself (JE2), with that from a tcaA mutant, or with that from a lcpA mutant. These supernatants had no effect on the growth of JE2 in the absence of arachidonic acid. In the presence of arachidonic acid JE2 was unable to grow when supplemented with its own supernatant, however, when supplemented with the supernatant of the two mutants, which both contain soluble WTA, JE2 was able to grow. The addition of purified WTA extract (at 2%) from another S. aureus strain (LAC) also neutralised arachidonic acid, however an equivalent extract from an isogenic WTA mutant (LAC ΔtarO) did not. (f) The charge across the cell wall of the wild type and tcaA mutant was compared using cytochrome c, where the mutant was found to be less negatively charged. An mprF mutant has been included as a control. The dots represent individual data points (n=5 for (d), n=3 for remaining assays), the bars the mean value, and the error bars the standard deviation. Significance was determined as *<0.05, **<0.01, ***<0.001, ****<0.0001.
-
Figure 5—source data 1
Uncropped gel of wall teichoic acid (WTA) extracts from the cell wall of the wild type and tcaA mutant in triplicate.
- https://cdn.elifesciences.org/articles/87026/elife-87026-fig5-data1-v2.docx
-
Figure 5—source data 2
Uncropped gel of wall teichoic acid (WTA) extracts from the supernatant of the wild type and tcaA mutant in triplicate.
- https://cdn.elifesciences.org/articles/87026/elife-87026-fig5-data2-v2.docx
Figure 6 with 1 supplement
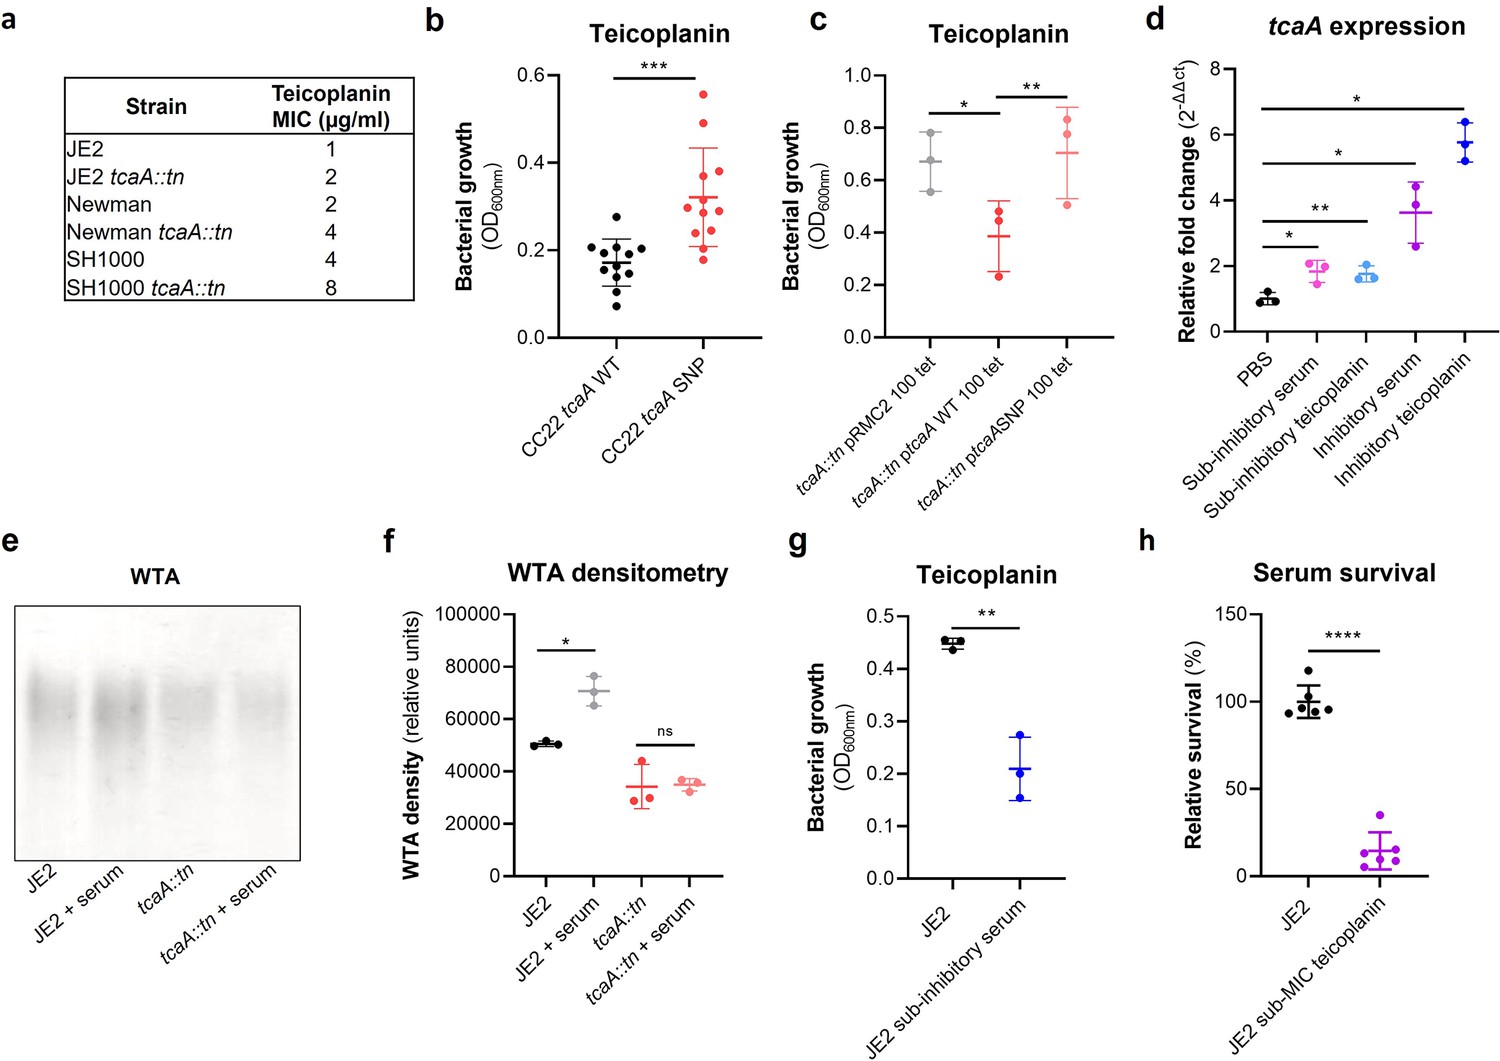
TcaA confers increased sensitivity to teicoplanin.
(a) The inactivation of the tcaA gene increases the minimum inhibitory concentrations (MICs) in three S. aureus backgrounds. (b) The clinical isolates with polymorphisms in the tcaA gene were on average less sensitive to teicoplanin (0.5 μg/ml) than those with the wild type gene. (c) The most common tcaA single nucleotide polymorphism (SNP) decreases the sensitivity of S. aureus to teicoplanin (0.5 μg/ml). (d) The expression of the tcaA gene was quantified by qRT-PCR in both subinhibitory and inhibitory concentrations of serum and teicoplanin. There was a dose-dependent effect on tcaA induction for all concentrations used. (e) Exposure of JE2 to inhibitory concentrations of human serum resulted in an increase in wall teichoic acid (WTA) abundance in the bacterial cell wall, an effect not seen when the tcaA mutant was exposed to serum. (f) The WTA extractions were performed on the wild type and tcaA mutant in triplicate the relative density of the WTA quantified by densitometry. (g) Growth of JE2 in the presence of subinhibitory concentrations of teicoplanin (0.5 μg/ml) over a 24 hr period was quantified following pre-exposure to subinhibitory concentrations of human serum (2.5%), where pre-exposure to serum increased sensitivity to teicoplanin. (h) The ability of S. aureus to survive exposure to subinhibitory concentrations of serum (2.5%) following overnight growth in a subinhibitory concentration of teicoplanin (0.5 μg/ml), where pre-exposure to teicoplanin increases the sensitivity to serum. The dots represent individual data points (n=12 for (b), n=3 for (c, d, f, g), n=6 for (h)) for the serum, the bars the mean value, and the error bars the standard deviation. Significance was determined as *<0.05, **<0.01, ***<0.001, ****<0.0001.
-
Figure 6—source data 1
Uncropped gels of wall teichoic acid (WTA) extracts from cell wall extracts of a wild type and tcaA mutant incubated with and without human serum, performed in triplicate.
- https://cdn.elifesciences.org/articles/87026/elife-87026-fig6-data1-v2.docx
Figure 6—figure supplement 1

Induction of expression of the tcaA gene by arachidonic acid and LL37.
Using a GFP reporter system the tcaA gene was induced in strains JE2, SH1000, Newman, and EMRSA15 by arachidonic acid (a, b, e, and f) and in strains JE2, SH1000, and Newman by LL37 (c, d, g). The mean of three biological replicates is presented where the error bars represent the standard deviation.
Figure 7 with 2 supplements
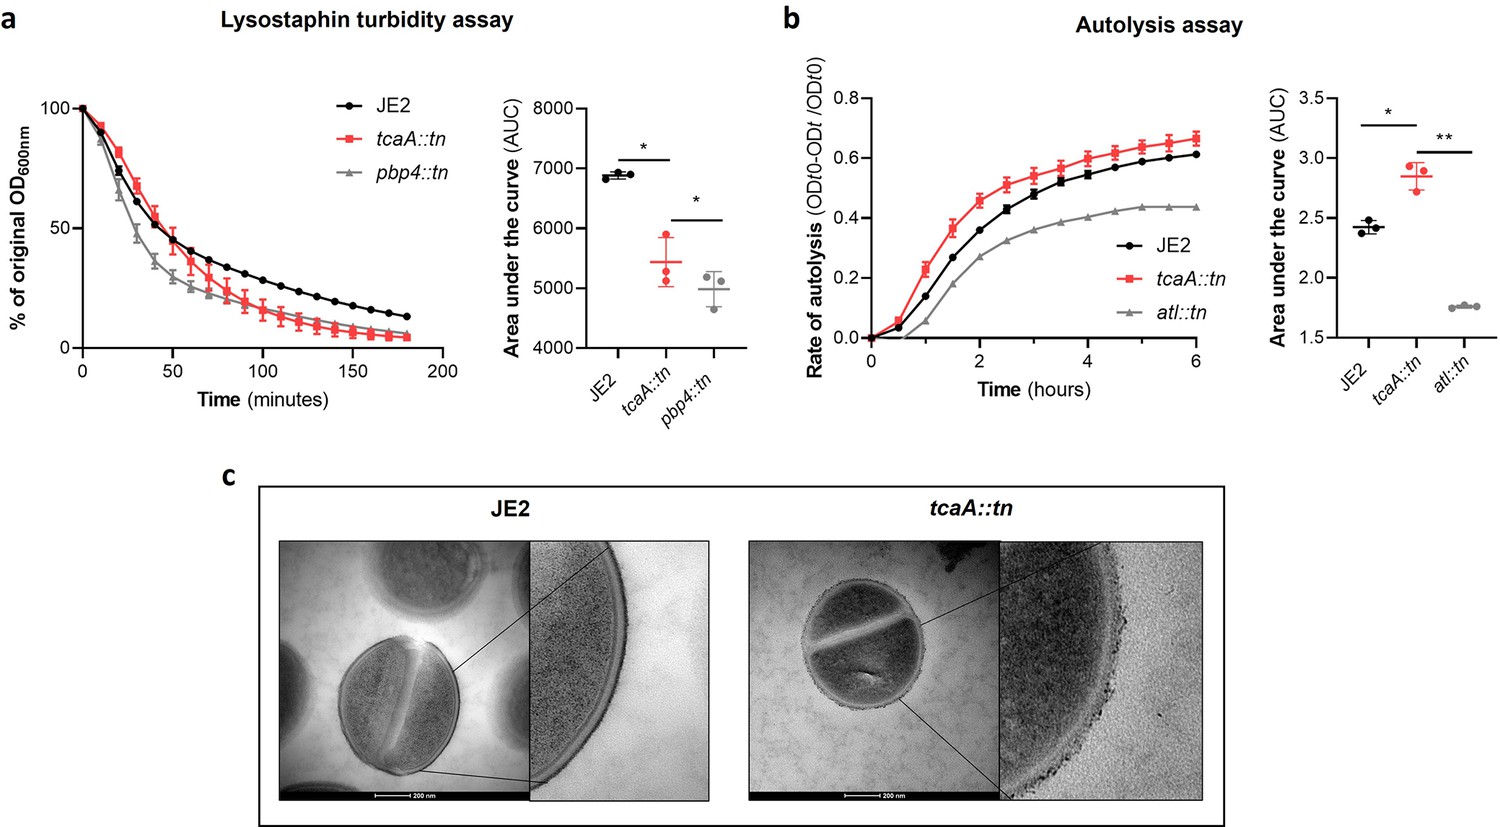
TcaA alters the structure of the S. aureus cell wall.
(a) The rate of lysis in the presence of lysostaphin was assayed, where the strain producing TcaA was lysed at a slower rate than the tcaA mutant. A pbp4 mutant was included as a control. Turbidity (OD600) and area under the curves (AUCs) of the OD600 data over time are presented. (b) The rate of autolysis of the bacteria in the presence of Triton X-100 was assayed where the TcaA producing strain lysed at a slower rate relative to the tcaA mutant. An autolysin (atl) mutant was included as a control. Autolysis data and AUCs of the autolysis data over time are presented. The dots represent individual data points (n=3), the bars the mean value, and the error bars the standard deviation. For both (a) and (b) significance was determined as *<0.05, **<0.01 following AUC analysis of three biological replicates. (c) Transmission electron micrograph (TEM) of a wild type JE2 and tcaA mutant cell at two magnifications showing the smooth and consistent density of the cell wall when TcaA is produced, compared to the rough and patchy density of the mutant cell wall.
Figure 7—figure supplement 1

Relative growth of the wild type JE2 and tcaA mutant in a range of concentrations of cell wall attacking antibiotics: vancomycin, ramoplanin, dalbavancin, oritavancin, oxacillin, and moenomycin.
The bars represent the mean of three biological replicates and the error bars the standard error of the mean. Significance is indicated as *p<0.05, **p<0.01, ***p<0.001.
Figure 7—figure supplement 2
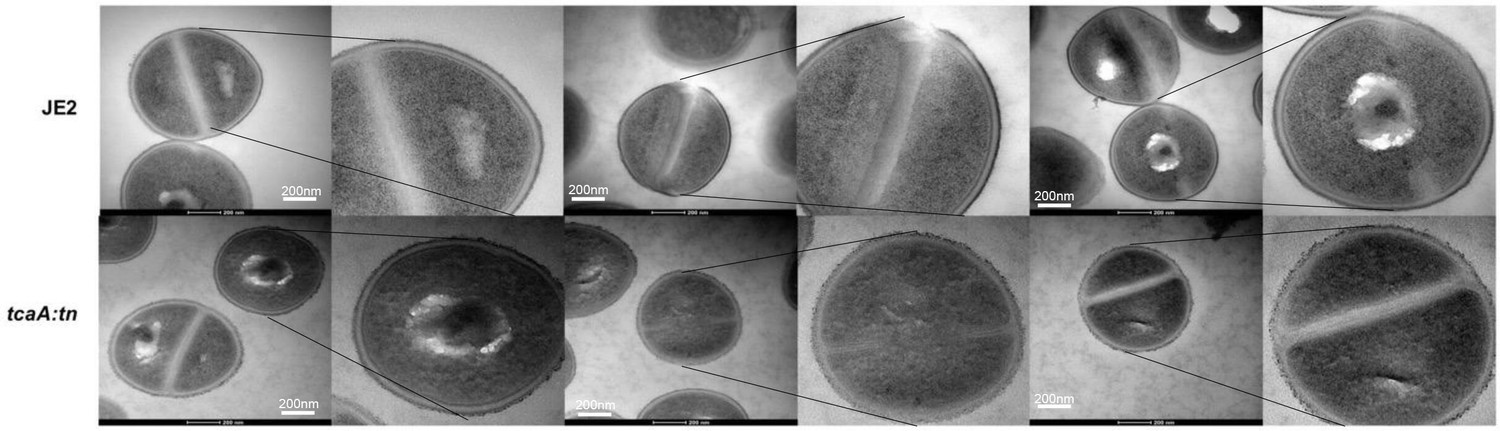
Replicate transmission electron micrograph (TEM) images of wild type JE2 and tcaA mutant cells showing the relative rough and patchy cell wall of the mutant.
Figure 8
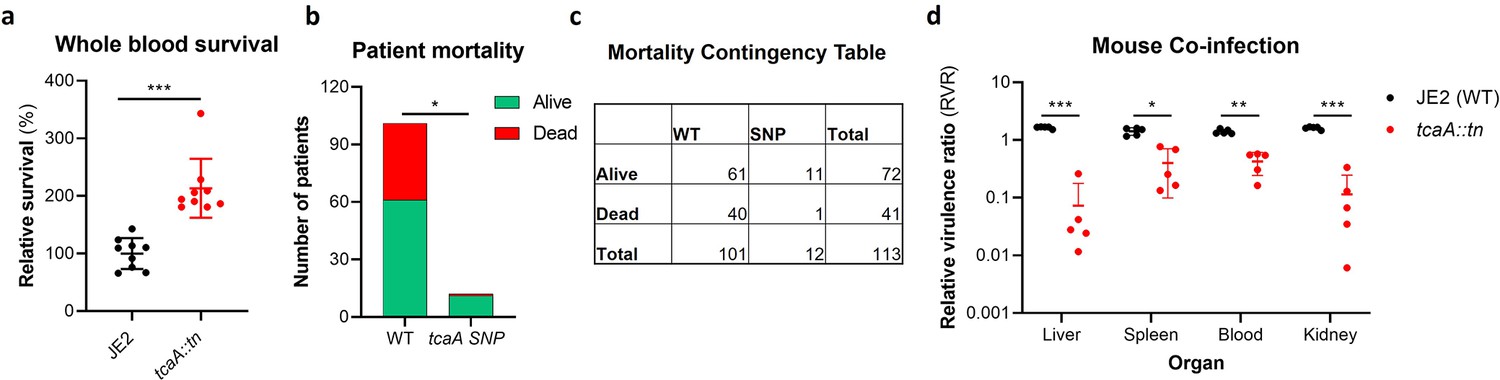
TcaA contributes to increased disease severity in mice and humans.
(a) Whole human blood survival. The wild type JE2 and tcaA mutant were incubated in human blood from three donors (each in biological triplicate) for 90 min and their relative survival was quantified. TcaA production renders that bacteria more susceptible to killing. The dots represent individual data points (n=9), the bars the mean value, and the error bars the standard deviation. (b and c) A graph and contingency table showing data from 113 patient with S. aureus bacteraemia. The 30-day mortality rate was significantly higher for those infected with a S. aureus strain with a wild type tcaA gene compared to those with a mutated tcaA gene. (d) Mice were injected intravenously with 100 l of PBS containing an equal mixture of wild type and tcaA mutant (2×10⁷ colony forming units [CFUs] of each). After 48 hr, the ratio of the wild type and mutant were quantified, and the relative virulence ratio calculated. In the blood and all organs tested the wild type bacteria had a competitive advantage over the mutant demonstrating its increased relative virulence. The dots represent individual data points (n=5 per group), the bars the mean value, and the error bars the standard deviation. Significance was determined as *<0.05, **<0.01, and ***<0.001.
Figure 9
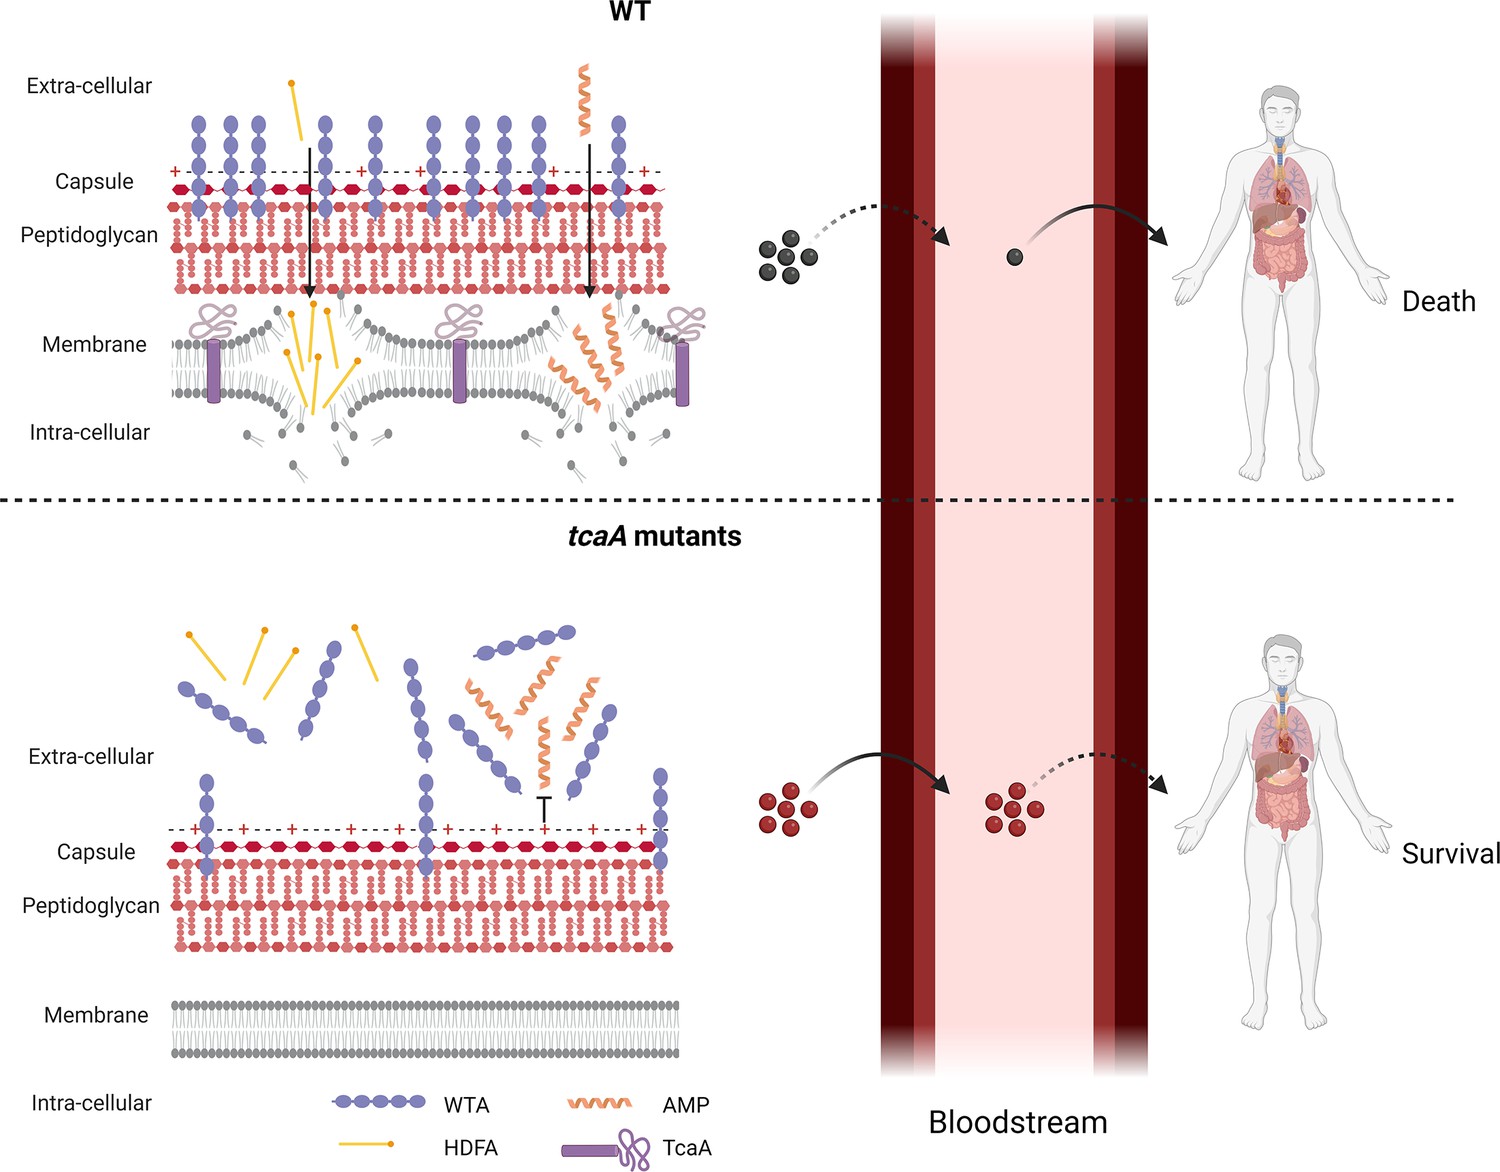
Graphical summary of our hypothesis for TcaA activity.
Upon exposure to serum the expression of tcaA is induced in the wild type strain, resulting in an increased abundance of wall teichoic acid (WTA) in the cell wall and less in the extracellular milieu. This decreases the negative charge of the bacterial surface, rendering the bacteria more susceptible to antimicrobial peptides (AMPs). In addition, there is less WTA released into the extracellular milieu to sequester host defence fatty acids (HDFAs), rendering the bacteria more susceptible to killing by these molecules. This self-sensitising activity of TcaA limits the ability of S. aureus to establish a bloodstream infection. However, once established a strain with wild-type TcaA can cause more severe disease. In tcaA mutants, there is lower abundance of WTA in the cell wall and a higher abundance in the extracellular milieu. This increases bacterial resistance to AMPs as it increases the charge of the bacterial surface, resulting in less electrostatic attraction. The release of WTA into the extracellular milieu also sequesters HDFAs, preventing them from reaching the bacterial surface. As a result, a tcaA mutant is more likely to establish a bloodstream infection. However, this infection is less likely to cause severe disease due to the importance of TcaA in remodelling the cell wall for the full virulence of S. aureus. (Image created using BioRender.com.)
Tables
Table 1
Loci associated with serum survival in the clonal complex 22 (CC22) (a) and CC30 (b) collections.
The single nucleotide polymorphism (SNP) position is relative to the origin of replication in the reference genomes: HO 5096 0412 (CC22) and MRSA252 (CC30). Locus tags and where available gene names or putative protein functions have been provided. NTML refers to the mutant available in the Nebraska transposon library.
| a | ||||
|---|---|---|---|---|
| SNP position | CC22 locus tag | Description | Log p-Value | NTML |
| 1945336 | SAEMRSA15_RS09605 | Intergenic | 6.851546 | N/A |
| 375179 | SAEMRSA15_03110 | metE | 5.606418 | NE944 |
| 728154 | SAEMRSA15_06310 | saeS | 5.553331 | NE1296 |
| 1053036 | N/A | Intergenic | 3.60927 | N/A |
| 219764 | SAEMRSA15_01760 | Putative oxidoreductase | 3.575929 | NE312 |
| 2280500 | SAEMRSA15_20910 | Alcohol dehydrogenase | 2.257841 | NE1147 |
| 1196127 | SAEMRSA15_10750 | yfhO | 2.212486 | NE1597 |
| 408213 | SAEMRSA15_03430 | guaA | 1.876101 | N/A |
| 2492381 | SAEMRSA15_23120 | tcyB | 1.645759 | NE228 |
| 1514441 | SAEMRSA15_13420 | Hypothetical protein | 1.600037 | NE1349 |
| 2430758 | SAEMRSA15_22540 | tcaA | 1.572702 | NE285 |
| 134276 | SAEMRSA15_01100 | Hypothetical protein | 1.358386 | NE599 |
| b | ||||
| SNP position | CC30 locus tag | Description | Log p-Value | NTML |
| 101174 | SAR0097 | Putative DNA binding protein | 18.466 | N/A |
| 1188605 | SAR1143 | arcC | 12.786 | NE1719 |
| 900409 | SAR0856 | Phosphoglycerate mutase | 11.226 | NE1422 |
| 2667418 | SAR2584 | gntR | 10.263 | NE1124 |
| 2421610 | SAR2347 | Putative membrane protein | 10.160 | N/A |
| 1687821 | SAR1615 | aroK | 9.793 | N/A |
| 532944 | SAR0495 | veg | 9.751 | NE1703 |
| 1252982 | SAR1203 | recG | 8.502 | NE1344 |
| 1816815 | SAR1754 | clpX | 8.064 | N/A |
| 2203190 | SAR2143 | ilvC | 8.050 | NE1177 |
| 1443567 | SAR1386 | trpA | 6.647 | NE304 |
| 1167449 | SAR1119 | uvrC | 6.439 | NE1212 |
| 2242306 | SAR2374 | ureC | 6.425 | NE410 |
| 1784580 | SAR1719 | tgt | 6.396 | NE1885 |
| 880082 | SAR0835 | est | 6.354 | NE1122 |
| 1116463 | SAR1070 | pdhD | 5.600 | NE1610 |
| 289265 | SAR0248 | tagB | 5.324 | NE362 |
| 1442353 | SAR1385 | trpB | 4.910 | NE310 |
| 364861 | SAR0319 | NADH flavin oxidoreductase | 4.373 | N/A |
| 1963781 | SAR1877 | menE | 4.315 | N/A |
| 1946567 | SAR1856 | arsB2 | 4.122 | NE1484 |
| 1416353 | SAR1364 | Iron sulphur cluster protein | 2.829 | NE1910 |
| 1887414 | SAR1810 | fhs | 2.741 | NE706 |
| 1133886 | SAR0251 | tarF | 2.725 | N/A |
| 30969 | SAR0023 | sasH | 2.507 | NE295 |
| 330358 | SAR0284 | essC | 2.486 | NE1484 |
| 2220348 | SAR2151 | tex | 1.704 | NE1079 |
| 1468392 | SAR1410 | hipO | 1.569 | NE1688 |
| 1652613 | SAR1582 | zwf | 1.556 | N/A |
| 2744774 | SAR2656 | nrmA | 1.549 | NE1223 |
| 2370812 | SAR2287 | lacR | 1.382 | NE346 |
Table 2
Strains used in this study.
| Strain | Description | Reference |
|---|---|---|
| JE2 | USA300; CA -MRSA, type IV SCCmec; lacking plasmids p01 and p03; wild -type strain of the NTML | Fey et al., 2013 |
| JE2 tcaA:tn | tcaA transposon mutant in JE2 | Fey et al., 2013 |
| JE2 tcaA:tn pRMC2 | tcaA transposon mutant in JE2 transformed with empty pRMC2 vector | This study |
| JE2 tcaA:tn ptcaA | tcaA transposon mutant complemented with tcaA gene housed in pRMC2 expression plasmid | This study |
| JE2 tarK:tn | tarK transposon mutant in JE2 | Fey et al., 2013 |
| JE2 tarK:tn pRMC2 | tarK transposon mutant in JE2 transformed with empty pRMC2 vector | This study |
| JE2 tarK:tn ptarK | tarK transposon mutant complemented with tarK gene housed in pRMC2 expression plasmid | This study |
| JE2 gntR:tn | gntK transposon mutant in JE2 | Fey et al., 2013 |
| JE2 gntR:tn pRMC2 | gntK transposon mutant in JE2 transformed with empty pRMC2 vector | This study |
| JE2 pgntR | gntK transposon mutant complemented with gntK gene housed in pRMC2 expression plasmid | This study |
| JE2 ilvC:tn | ilvC transposon mutant in JE2 | Fey et al., 2013 |
| JE2 ilvC:tn pRMC2 | ilvC transposon mutant in JE2 transformed with empty pRMC2 vector | This study |
| JE2 ilvC:tn pilvC | ilvC transposon mutant complemented with ilvC gene housed in pRMC2 expression plasmid | This study |
| JE2 arsB:tn | arsB transposon mutant in JE2 | Fey et al., 2013 |
| JE2 arsB:tn pRMC2 | arsB transposon mutant in JE2 transformed with empty pRMC2 vector | This study |
| JE2 arsB:tn parsB | arsB transposon mutant complemented with arsB gene housed in pRMC2 expression plasmid | This study |
| JE2 yfhO:tn | yfhO transposon mutant in JE2 | Fey et al., 2013 |
| JE2 yfhO:tn pRMC2 | yfhO transposon mutant in JE2 transformed with empty pRMC2 vector | This study |
| JE2 yfhO:tn pyfhO | yfhO transposon mutant complemented with yfhO gene housed in pRMC2 expression plasmid | This study |
| JE2 pdhD:tn | pdhD transposon mutant in JE2 | Fey et al., 2013 |
| JE2 pdhD:tn pRMC2 | pdhD transposon mutant in JE2 transformed with empty pRMC2 vector | This study |
| JE2 pdhD:tn ppdhD | pdhD transposon mutant complemented with pdhD gene housed in pRMC2 expression plasmid | This study |
| RN4220 | Restriction deficient mutant of 8325–4 | Kreiswirth et al., 1983 |
| DC10B | Δdcm mutant in Escherichia coli DH10B (K12) | Monk et al., 2012 |
| Mach1 | One Shot Mach1 T1 Phage-Resistant Chemically Competent E. coli. | Commercially available |
| SH1000 | MSSA, laboratory strain, 8325-4 with a repaired rsbU gene; SigB positive. | Horsburgh et al., 2002 |
| SH1000 tcaA::tn | tcaA transposon mutant in SH1000 | This study |
| Newman | MSSA, laboratory strain isolated from human infection | Hawiger et al., 1970 |
| Newman tcaA::tn | tcaA transposon mutant in Newman | This study |
| tcaA::tn ptcaASNP | tcaA transposon mutant complemented with tcaA gene harbouring F290S SNP housed in pRMC2 expression plasmid | This study |
| mprF::tn | mprF transposon mutant in Newman | Fey et al., 2013 |
| ΔlcpA | In frame unmarked deletion of lcpA generated by allelic exchange | Beavers et al., 2019 |
| LAC | CA-MRSA USA300 type IV SCCmec | Diep et al., 2006 |
| ΔtarO | tarO KO mutant in LAC | Schuster et al., 2020 |
| JE2 pSB2019:tcaA | JE2 transformed with the pSB2019:tcaA reporter fusion | This study |
| SH1000 pSB2019:tcaA | SH1000 transformed with the pSB2019:tcaA reporter fusion | This study |
| Newman pSB2019:tcaA | SH1000 transformed with the pSB2019:tcaA reporter fusion | This study |
| EMRSA15 pSB2019:tcaA | SH1000 transformed with the pSB2019:tcaA reporter fusion | This study |
Table 3
PCR primers used in this study.
| Primer name | Primer sequence 5’–3’ |
|---|---|
| tcaA FW | ataagcttgatggtaccaattgaagaggaacagaattgag |
| tcaA RV | tgaattcgagctcagatcatgacacatgcatcttatttaag |
| tarK FW | ataagcttgatggtacctttaataaaccgatggggg |
| tarK RV | tgaattcgagctcagatgcaagtaatatatgccaacattag |
| gntK FW | ataagcttgatggtaccgtatgtcgtgtaatgaaggagtg |
| gntK RV | tgaattcgagctcagatttctttctttcattttaattcaacc |
| ilvC FW | ataagcttgatggtacccgaaacacaaaatatttaattatttgg |
| ilvC RV | tgaattcgagctcagattaacaactcctcattgtaggtctatc |
| arsB2 FW | ataagcttgatggtaccgtcataaccttaagactggtgaatgc |
| arsB2 RV | tgaattcgagctcagatgagttgcctgtacatataaaataaattg |
| yfhO FW | ataagcttgatggtacctgaaagttgaggataatgttgtg |
| yfhO RV | tgaattcgagctcagatgtagcaacattatttttgtcttgc |
| pdhD FW | ataagcttgatggtaccgaattattattaatggaggggtaaaac |
| pdhD RV | tgaattcgagctcagatgcatgtcacatgttaacgatatctc |
Additional files
-
Supplementary file 1
Table of the clinical isolates used this study which includes the Strain Identification code (Strain ID); what clonal complex or sequence type the isolates correspond to; the type of infection they were isolated from; the patient outcome after 30 days was known; whether they have a single nucleotide polymorphism (SNP) in their tcaA gene; and their genome sequence accession numbers.
- https://cdn.elifesciences.org/articles/87026/elife-87026-supp1-v2.docx
-
MDAR checklist
- https://cdn.elifesciences.org/articles/87026/elife-87026-mdarchecklist1-v2.docx
Download links
A two-part list of links to download the article, or parts of the article, in various formats.
Downloads (link to download the article as PDF)
Open citations (links to open the citations from this article in various online reference manager services)
Cite this article (links to download the citations from this article in formats compatible with various reference manager tools)
Extensive remodelling of the cell wall during the development of Staphylococcus aureus bacteraemia
eLife 12:RP87026.
https://doi.org/10.7554/eLife.87026.3


