Independent regulation of Z-lines and M-lines during sarcomere assembly in cardiac myocytes revealed by the automatic image analysis software sarcApp
- Department of Cell and Developmental Biology, Vanderbilt University School of Medicine Basic Sciences, United States
- Sorbonne Université, INSERM, Institut de Myologie, Centre de Recherche en Myologie, France
Figures
Figure 1 with 1 supplement
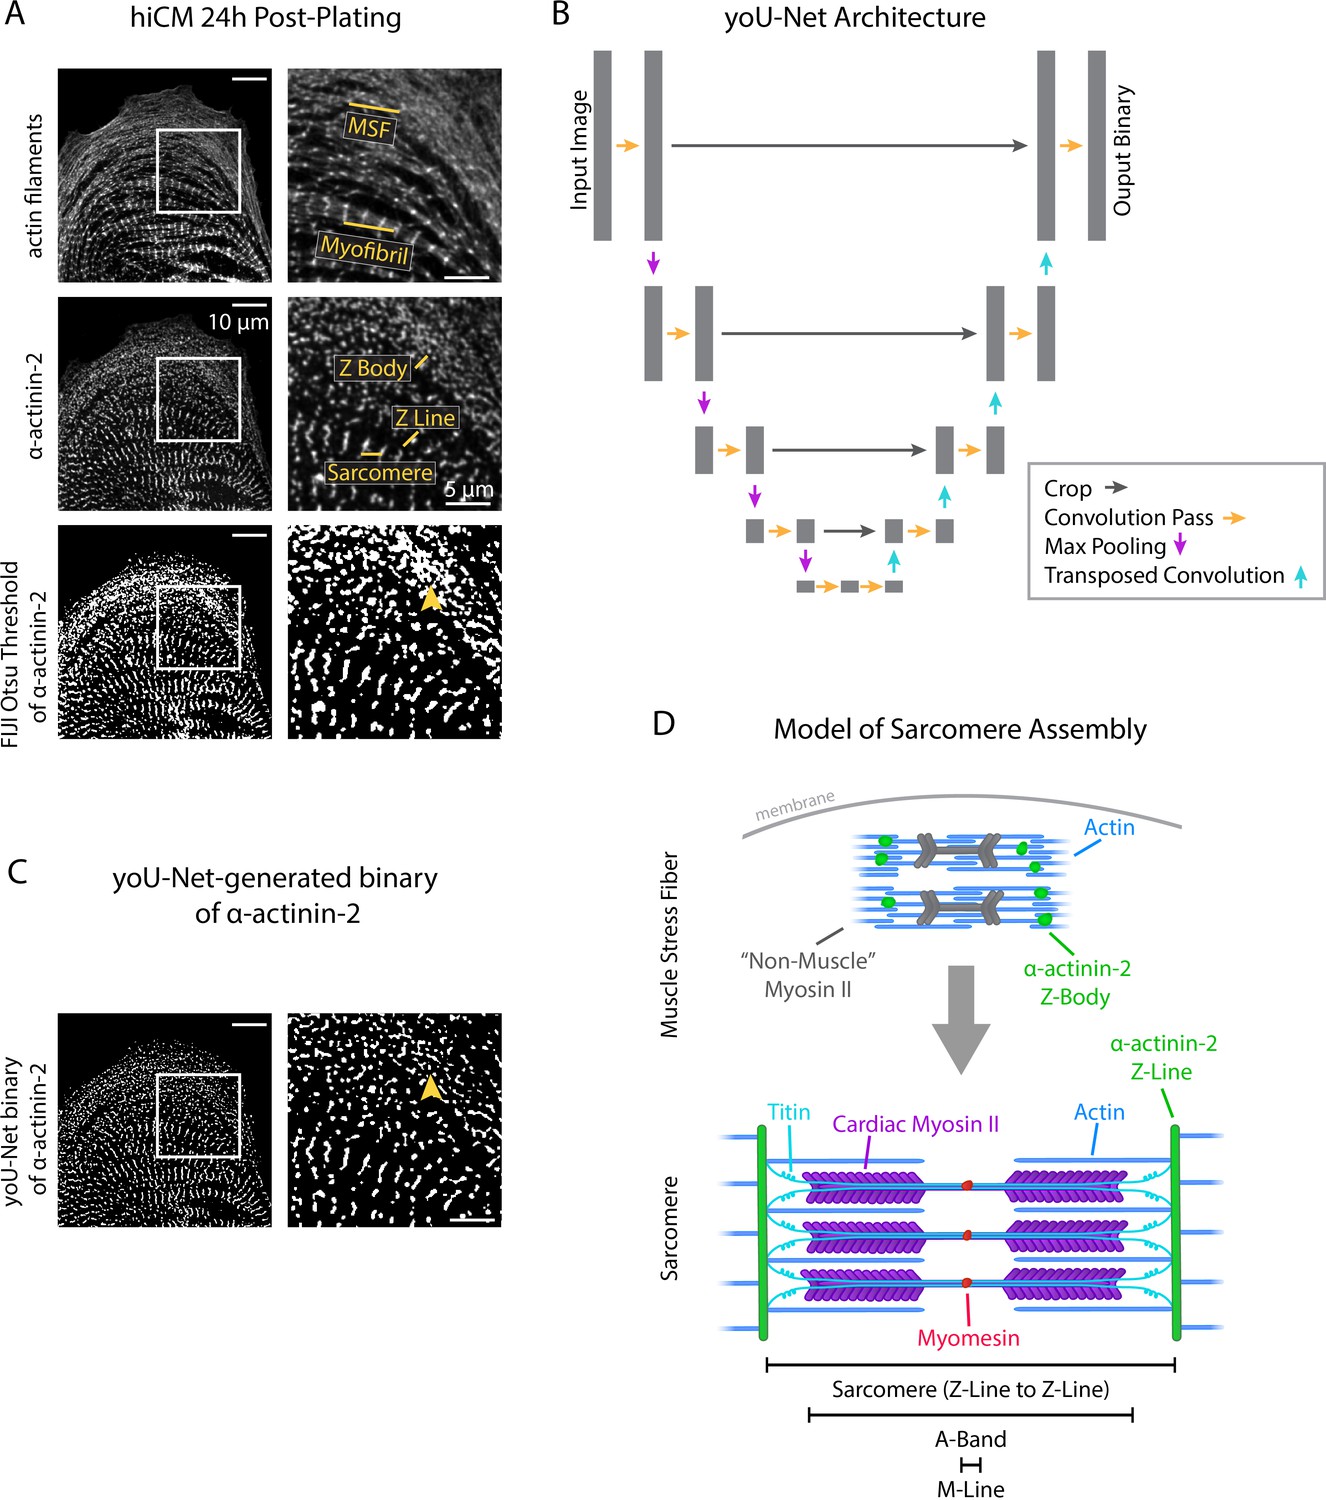
yoU-Net follows a U-Net architecture to binarize immunofluorescence images.
(A) Representative images of α-actinin-2 and actin filaments (phalloidin) in a human induced pluripotent stem cell-derived cardiac myocyte (hiCM). The α-actinin-2 binary was thresholded in FIJI using Otsu’s method. Orange arrowhead denotes Z-Bodies. (B) yoU-Net architecture from input image to output binary. Details can be found in the Methods and in Figure 1—figure supplement 1. (C) yoU-Net-generated binary of α-actinin-2, predicted using the trained U-Net described in (B). Orange arrowhead: Z-Bodies. (D) Model of muscle stress fibers (MSFs) and myofibrils during sarcomere formation. Black arrow denotes direction of MSF translocation as α-actinin-2-positive Z-Bodies elongate and coalesce to form Z-Lines.
Figure 1—figure supplement 1
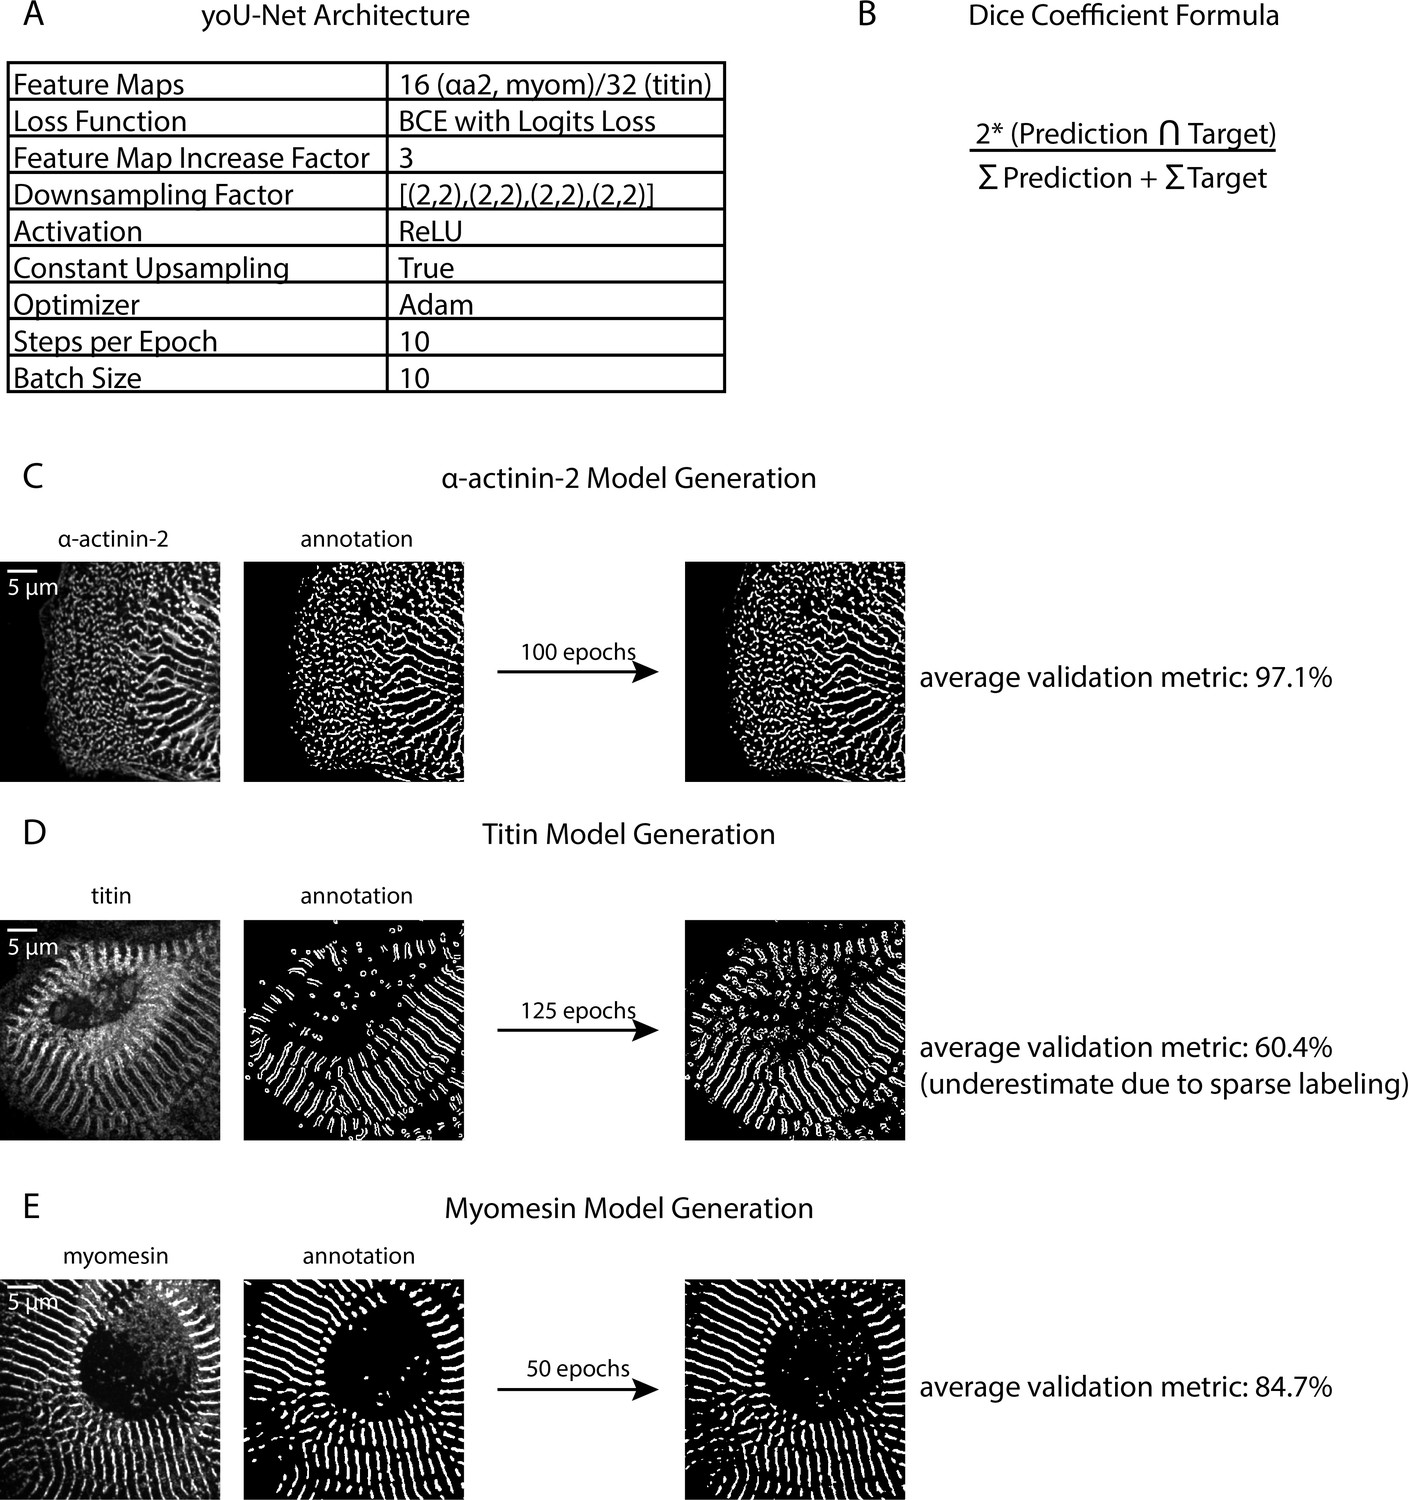
Details of yoU-Net architecture and trained model generation.
(A) U-Net architecture details used for this manuscript (details can be adjusted in yoU-Net). (B) Dice coefficient formula, used for validating trained models. (C) Representative fluorescence image and matched annotated binary of a human induced pluripotent stem cell-derived cardiac myocyte (hiCM) with α-actinin-2 localized. (D) Representative fluorescence image and matched annotated binary of an hiCM with titin localized. (E) Representative fluorescence image and matched annotated binary of an hiCM with myomesin localized.
Figure 2 with 1 supplement
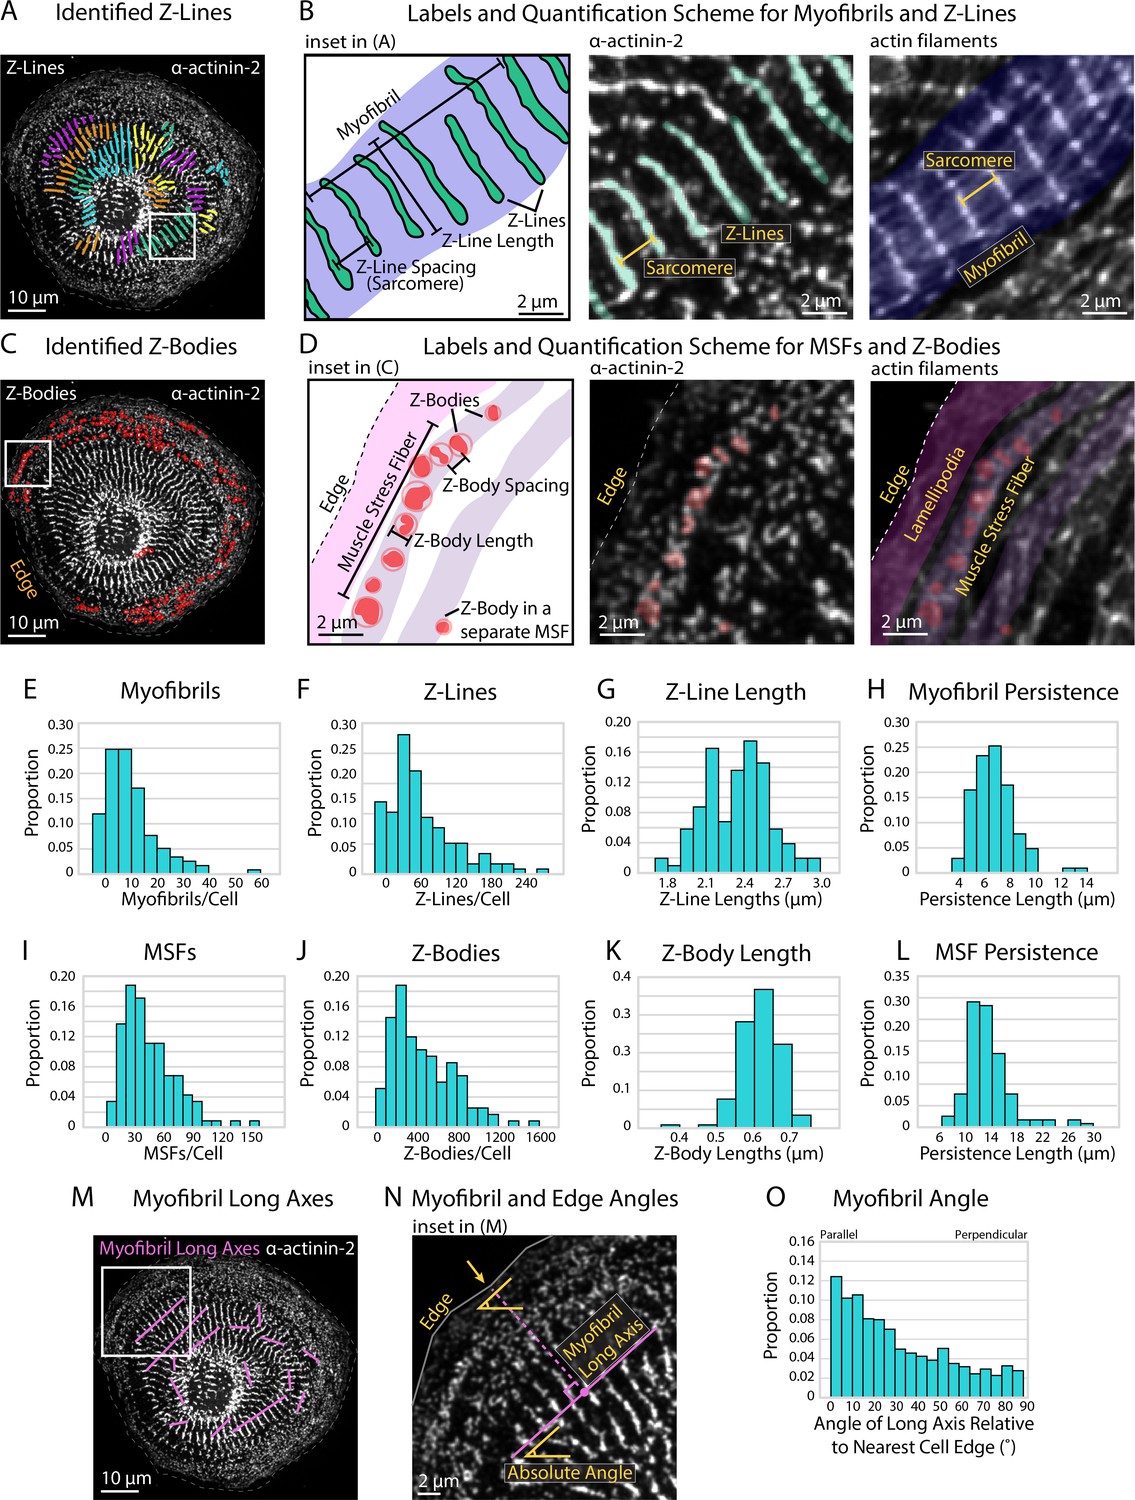
Quantifying sarcomere and myofibril organization using α-actinin-2 binaries.
(A) Z-Lines and myofibrils identified by sarcApp. Each line denotes a Z-Line, and each different color represents a different myofibril. (B) Quantification scheme for myofibrils and Z-Lines. Details can be found in Figure 2—figure supplement 1. (C) Z-Bodies identified by sarcApp. Each red circle denotes a Z-Body. (D) Quantification scheme for muscle stress fibers (MSFs) and Z-Bodies. Details can be found in Figure 2—figure supplement 1. (E) Distribution of myofibrils per human induced pluripotent stem cell-derived cardiac myocyte (hiCM) plated for 24 hr (N = 188 cells; four biological replicates). (F) Distributions of Z-Lines per hiCMs from (E). (G) Distribution of average Z-Line length per cell from (F) (N = 104 cells). (H) Distribution of average myofibril persistence lengths per cell from (G) (N = 104 cells; quantification details can be found in Figure 2—figure supplement 1). (I) Distribution of MSFs per cell from (E). (J) Distribution of Z-Bodies per cell from (E). (K) Distribution of average Z-Body length per cell from (E). (L) Distribution of average MSF persistence lengths per cell from (E). (M) Myofibril long axes identified by sarcApp. (N) Quantification scheme for myofibril angle relative to edge. Briefly, the closest edge segment to the myofibril long axis (perpendicularly) is used as the reference angle, and the numerical output is the difference between the myofibril long axis angle and the reference edge angle. (O) Distribution of myofibril orientation relative to cell edge in the same cells as (E) (N = 188 cells, 1217 myofibrils). Note that most myofibrils are relatively parallel to the edge in hiCMs plated for 24 hr.
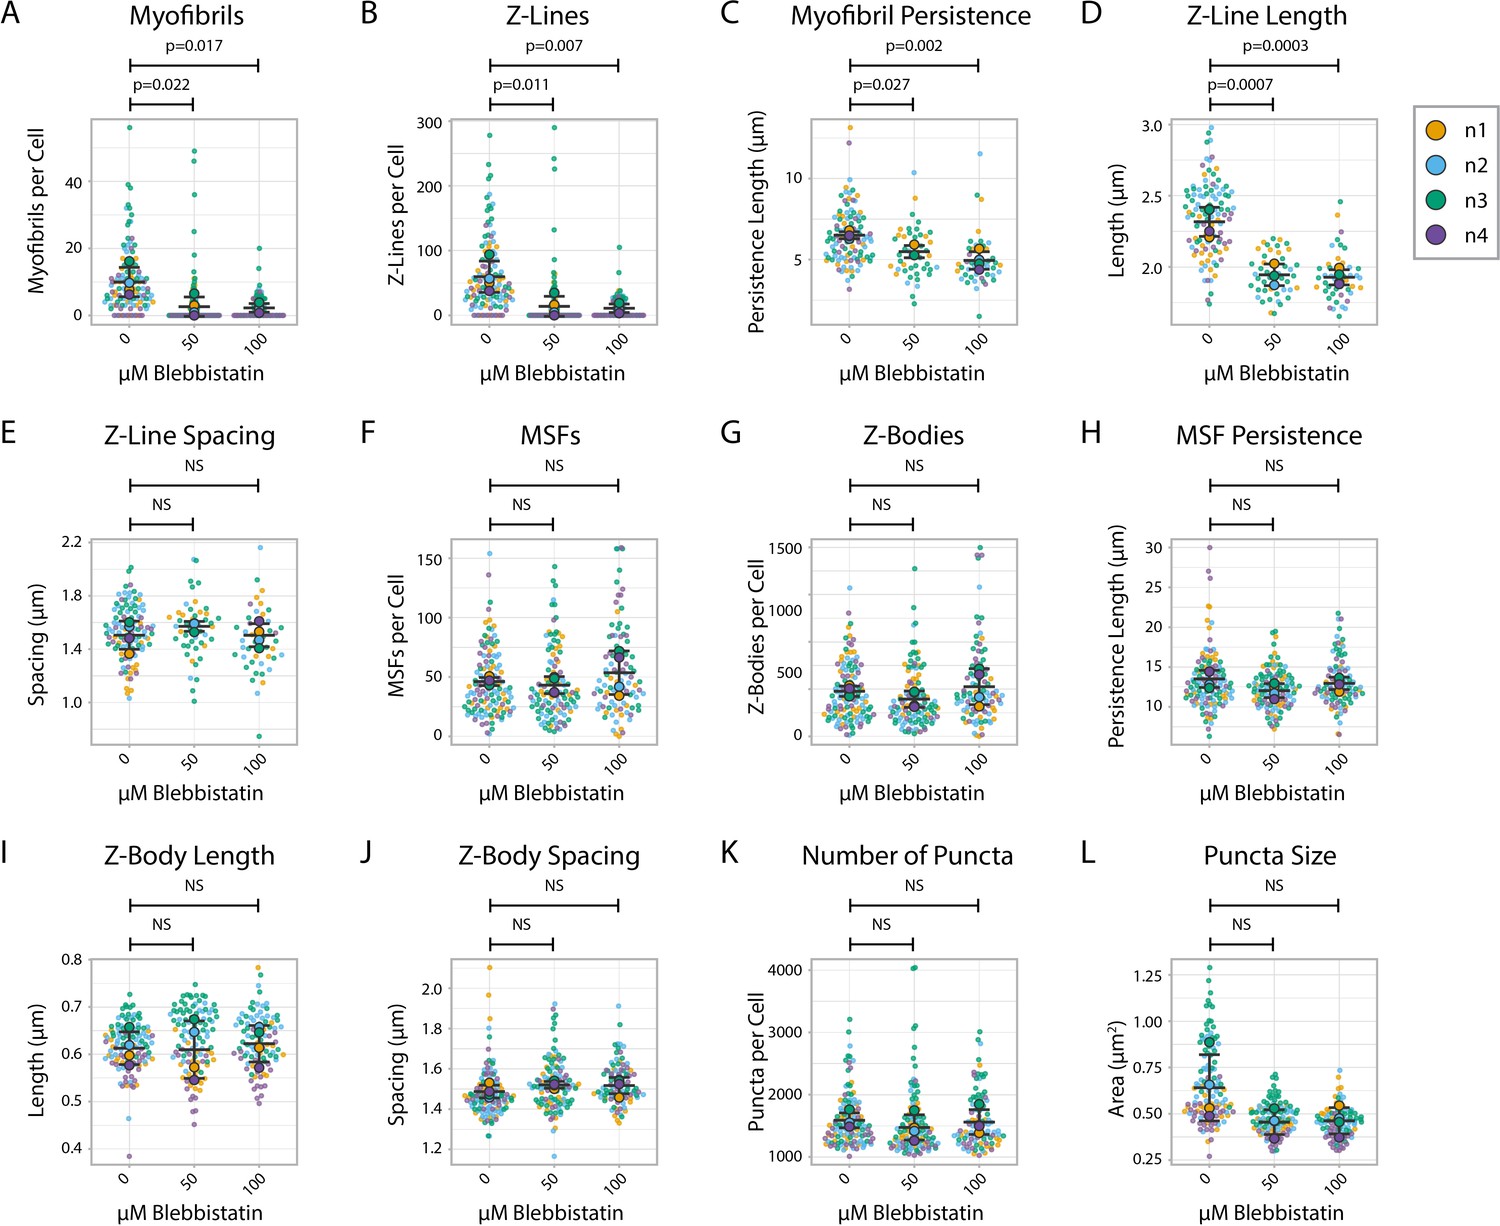
Figure 2—figure supplement 1
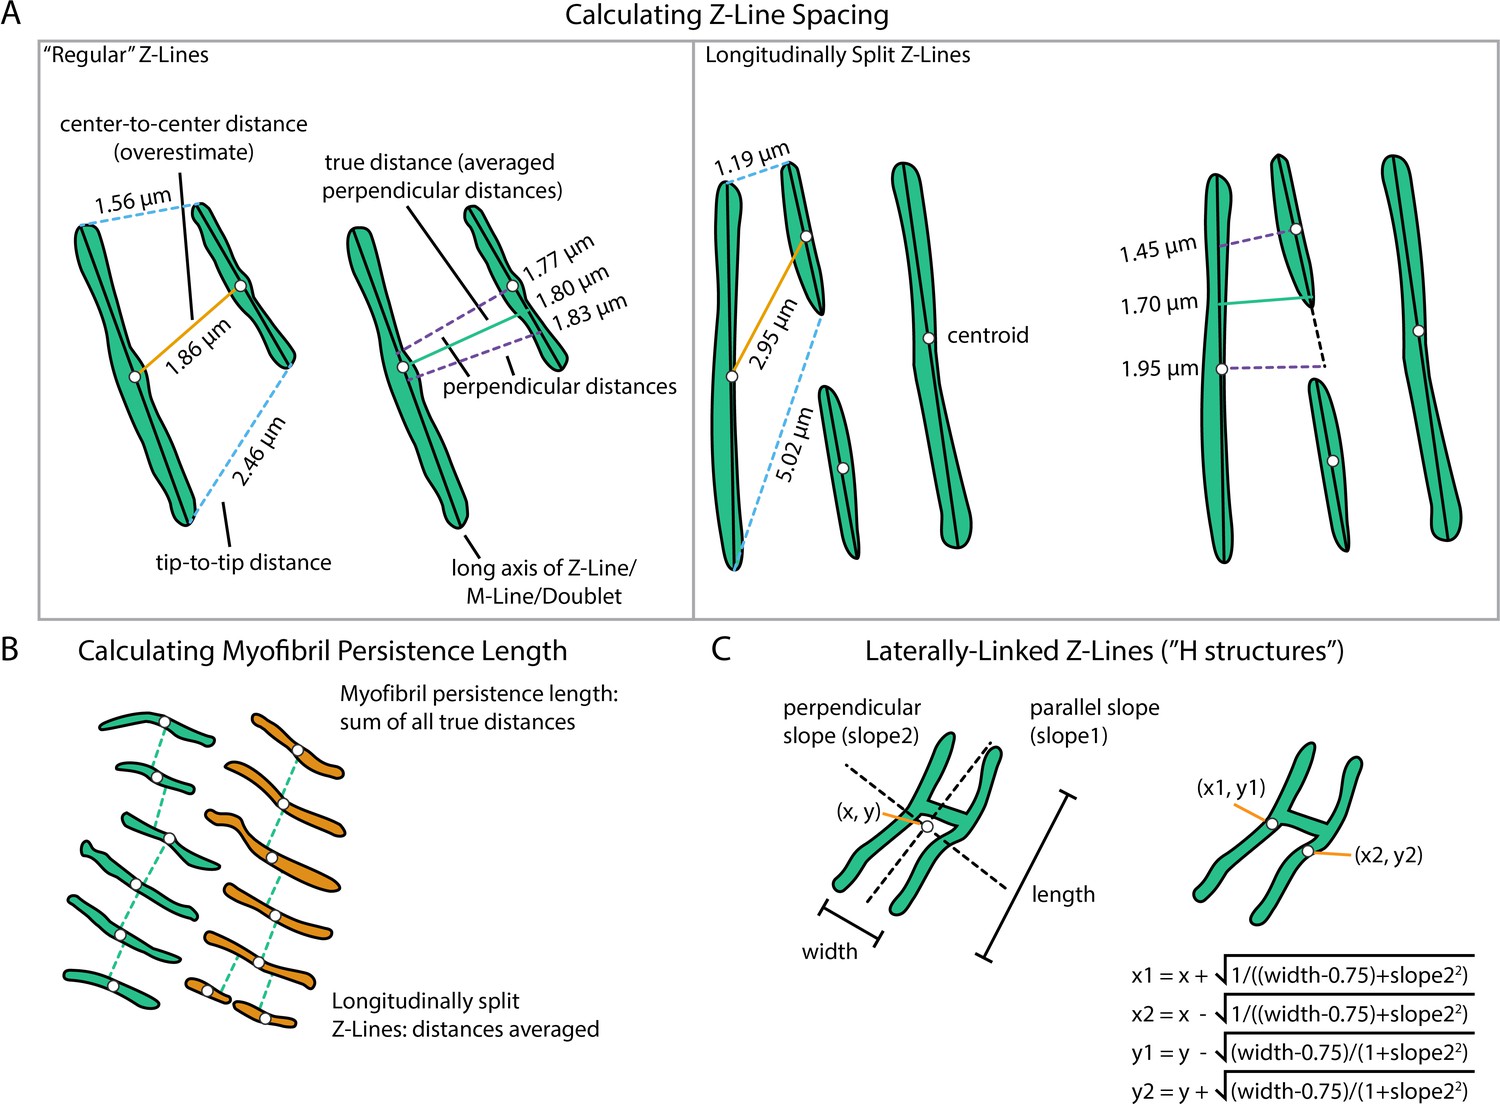
Details of geometric calculations used in sarcApp.
(A) How Z-Line spacing is calculated in sarcApp. In short, for each pair of Z-Lines, a line is measured from the centroid of one Z-Line to the next Z-Line using a line drawn perpendicularly to the first Z-Line. The same is done vice versa: a line from the second Z-Line to the first is measured. The averaged perpendicular distances comprise the ‘true’ distance. (B) How myofibril persistence length is calculated. In short, persistence length is the sum of all true Z-Line distances across an entire myofibril. If Z-Lines are longitudinally split, the Z-Line distances are averaged. (C) How laterally linked Z-Lines (H structures) are solved in sarcApp. In short, the length, width, and centroid of the H structure are used to back calculate the predicted centroid of each individual Z-Line.
Figure 3 with 3 supplements
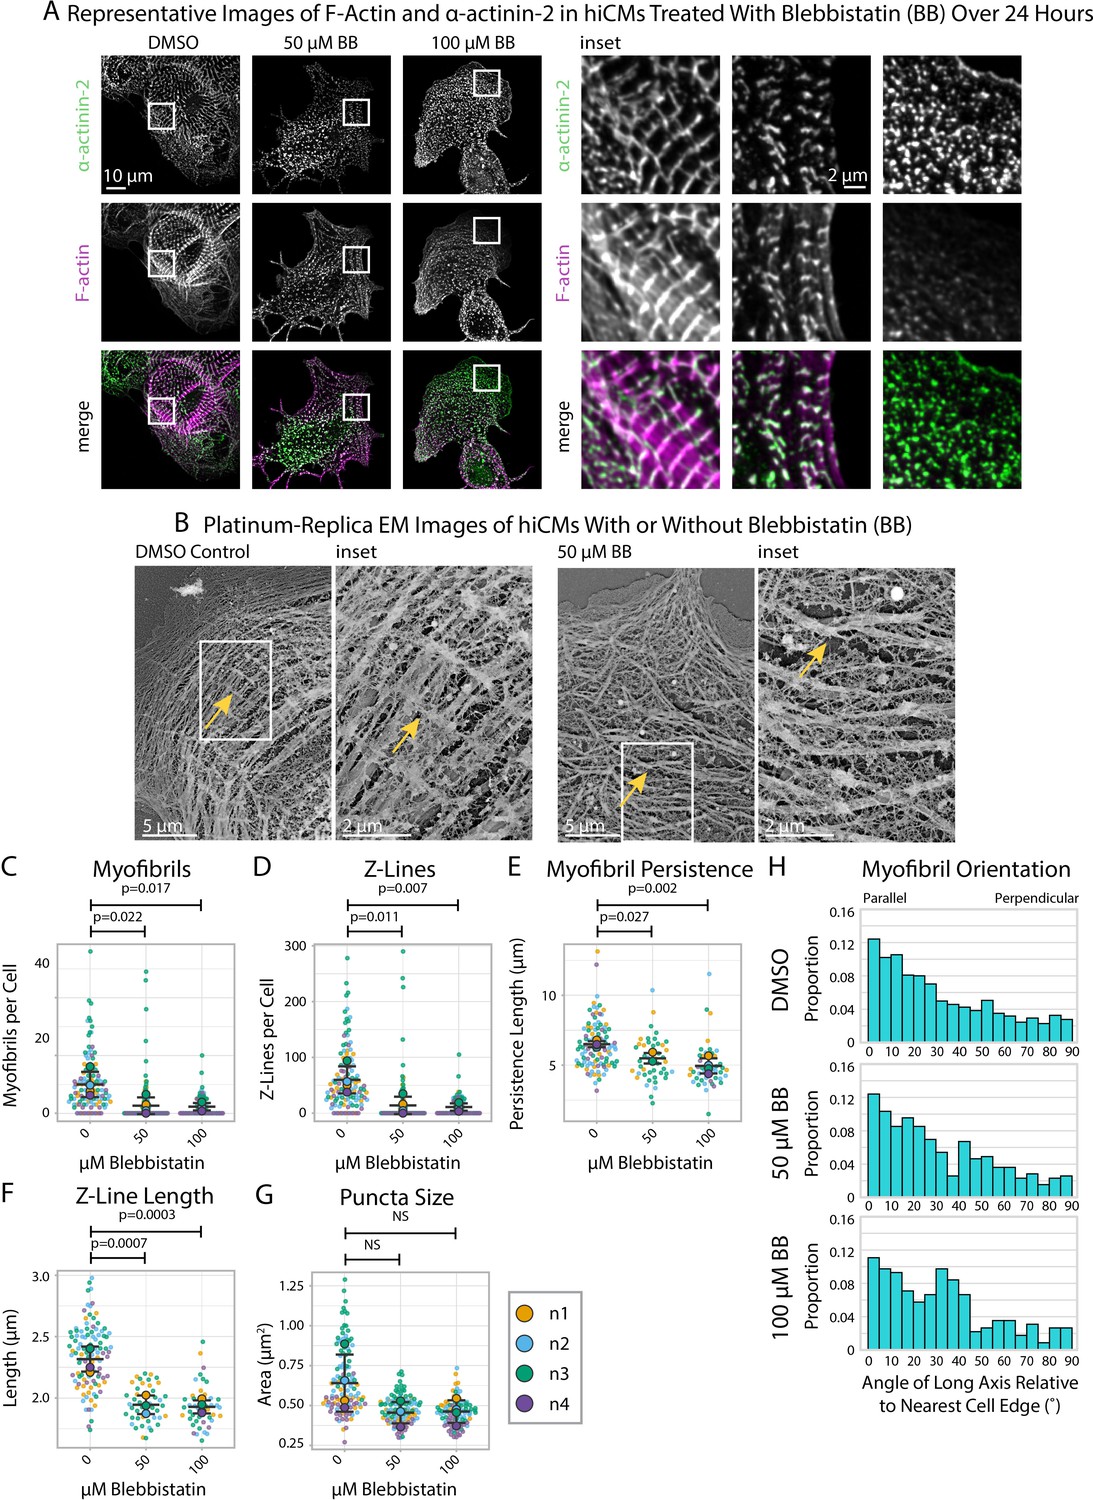
Blebbistatin treatment ablates Z-Line formation in human induced pluripotent stem cell-derived cardiac myocytes (hiCMs).
(A) Representative images and insets of α-actinin-2 and F-actin in hiCMs treated with DMSO, 50 µM Blebbistatin, or 100 µM Blebbistatin. (B) Representative platinum replica EM image of a control hiCM and a 50 µM Blebbistatin-treated hiCM. Arrows indicate an elongated Z-Line in the DMSO-treated hiCM and a Z-Body in the Blebbistatin-treated hiCM. (C) Myofibrils per cell in hiCMs (N = 118 DMSO cells, 108 50 µM Blebbistatin cells, and 93 100 µM Blebbistatin cells; four biological replicates). (D) Z-Lines per cell in hiCMs from (C). (E) Average myofibril persistence length per cell in hiCMs from (C) (N = 104 DMSO control cells, 45 50 µM Blebbistatin cells, and 45 100 µM Blebbistatin cells). (F) Average Z-Line length per cell from (E). (G) Average size of all α-actinin-2-positive puncta in hiCMs from (C). (H) Myofibril orientation relative to the cell edge segment closest to the myofibril center, perpendicularly. N = 4 biological replicates, 1217 DMSO control myofibrils, 385 50 µM Blebbistatin myofibrils, 220 100 µM Blebbistatin myofibrils. Blebbistatin treatment for 6 and 12 hr can be found in Figure 3—figure supplement 2 and Figure 3—figure supplement 3.
Figure 3—figure supplement 1

α-actinin-2 quantification and organization in Blebbistatin-treated human induced pluripotent stem cell-derived cardiac myocytes (hiCMs) 6 hr post-plating.
(A) Myofibrils per cell in cells treated with DMSO or 50/100 µM Blebbistatin. N = 3 biological replicates, 73 control cells, 54 50 µM Blebbistatin cells, and 72 100 µM Blebbistatin cells. Myofibrils defined as having four or more Z-Lines in a row. Details in Figure 2—figure supplement 1. (B) Z-Lines per cell in hiCMs from (A). (C) Average myofibril persistence length per cell in hiCMs from (B). N = 59 control cells, 34 50 µM Blebbistatin cells, and 51 100 µM Blebbistatin cells (only cells with myofibrils were quantified for C–E). (D) Average Z-Line length per cell in hiCMs from (C). (E) Average spacing between Z-Lines per cell in hiCMs from (C). (F) Muscle stress fibers (MSFs) per cell in hiCMs from (A). (G) Z-Bodies per cell in hiCMs from (A). (H) Average MSF persistence length per cell in hiCMs from (A). N = 3 biological replicates, 73 control cells, 54 50 µM Blebbistatin cells, and 72 100 µM Blebbistatin cells (only cells with MSFs were quantified for H–J). (I) Average Z-Body length per cell in hiCMs from (H). (J) Average spacing between Z-Bodies per cell in hiCMs from (H). (K) Number of α-actinin-2-positive puncta per cell in hiCMs from (A). (L) Average size of α-actinin-2-positive puncta in hiCMs from (A). (M) Representative images of α-actinin-2 and F-actin in control and Blebbistatin-treated hiCMs. (N) Myofibril orientation relative to the cell edge segment closest to the myofibril center, perpendicularly. N = 3 biological replicates, 668 control myofibrils, 385 50 µM Blebbistatin myofibrils, and 582 100 µM Blebbistatin myofibrils. Details of quantification can be found in Figure 2M–O.
Figure 3—figure supplement 2

α-actinin-2 quantification and organization in Blebbistatin-treated human induced pluripotent stem cell-derived cardiac myocytes (hiCMs) 12 hr post-plating.
(A) Myofibrils per cell in cells treated with DMSO or 50/100 µM Blebbistatin. N = 3 biological replicates, 95 control cells, 77 50 µM Blebbistatin cells, and 80 100 µM Blebbistatin cells. Myofibrils defined as having four or more Z-Lines in a row. More quantification details can be found in Figure 2—figure supplement 1. (B) Z-Lines per cell in hiCMs from (A). (C) Average myofibril persistence length per cell in hiCMs from (A): N = 3 biological replicates, 92 control cells, 69 50 µM Blebbistatin cells, and 65 100 µM Blebbistatin cells (only cells with myofibrils were quantified for C–E). (D) Average Z-Line length per cell in hiCMs from (C). (E) Average spacing between Z-Lines per cell in hiCMs from (C). (F) Muscle stress fibers (MSFs) per cell in hiCMs from (A). (G) Z-Bodies per cell in hiCMs from (A). (H) Average MSF persistence length per cell in hiCMs from (A): N = 3 biological replicates, 94 control cells, 77 50 µM Blebbistatin cells, and 80 100 µM Blebbistatin cells (only cells with MSFs were quantified for H–J). (I) Average Z-Body length per cell in hiCMs from (H). (J) Average spacing between Z-Bodies per cell in hiCMs from (H). (K) Number of α-actinin-2-positive puncta per cell in hiCMs from (A). (L) Average size of α-actinin-2-positive puncta in hiCMs from (A) .(M) Representative images of α-actinin-2 and F-actin in control and Blebbistatin-treated hiCMs. (N) Myofibril orientation relative to the cell edge segment closest to the myofibril center, perpendicularly. N = 3 biological replicates, 1560 control myofibrils, 1012 50 µM Blebbistatin myofibrils, and 777 100 µM Blebbistatin myofibrils. Details of quantification can be found in Figure 2M–O.
Figure 3—figure supplement 3
α-actinin-2 quantification and organization in Blebbistatin-treated human induced pluripotent stem cell-derived cardiac myocytes (hiCMs) 24 hr post-plating.
(A) Myofibrils per cell in cells treated with DMSO or 50/100 µM Blebbistatin. N = 4 biological replicates, 118 control cells, 108 50 µM Blebbistatin cells, and 93 100 µM Blebbistatin cells. Note that some of these subfigures were used also in Figure 3. Myofibrils defined as having four or more Z-Lines in a row. More quantification details can be found in Figure 2—figure supplement 1. (B) Z-Lines per cell in hiCMs from (A). (C) Average myofibril persistence length per cell in hiCMs from (A). (D) Average Z-Line length per cell in hiCMs from (B): N = 4 biological replicates, 104 control cells, 45 50 µM Blebbistatin cells, and 45 100 µM Blebbistatin cells (only cells with myofibrils were quantified for C–E). (E) Average spacing between Z-Lines per cell in hiCMs from (C). (F) Muscle stress fibers (MSFs) per cell in hiCMs from (A). (G) Z-Bodies per cell in hiCMs from (A). (H) Average MSF persistence length per cell in hiCMs from (A): N = 4 biological replicates, 118 control cells, 108 50 µM Blebbistatin cells, and 93 100 µM Blebbistatin cells (only cells with MSFs were quantified for H–J). (I) Average Z-Body length per cell in hiCMs from (H). (J) Average spacing between Z-Bodies per cell in hiCMs from (H). (K) Number of α-actinin-2-positive puncta per cell in hiCMs from (A). (L) Average size of α-actinin-2-positive puncta in hiCMs from (A).
Figure 4
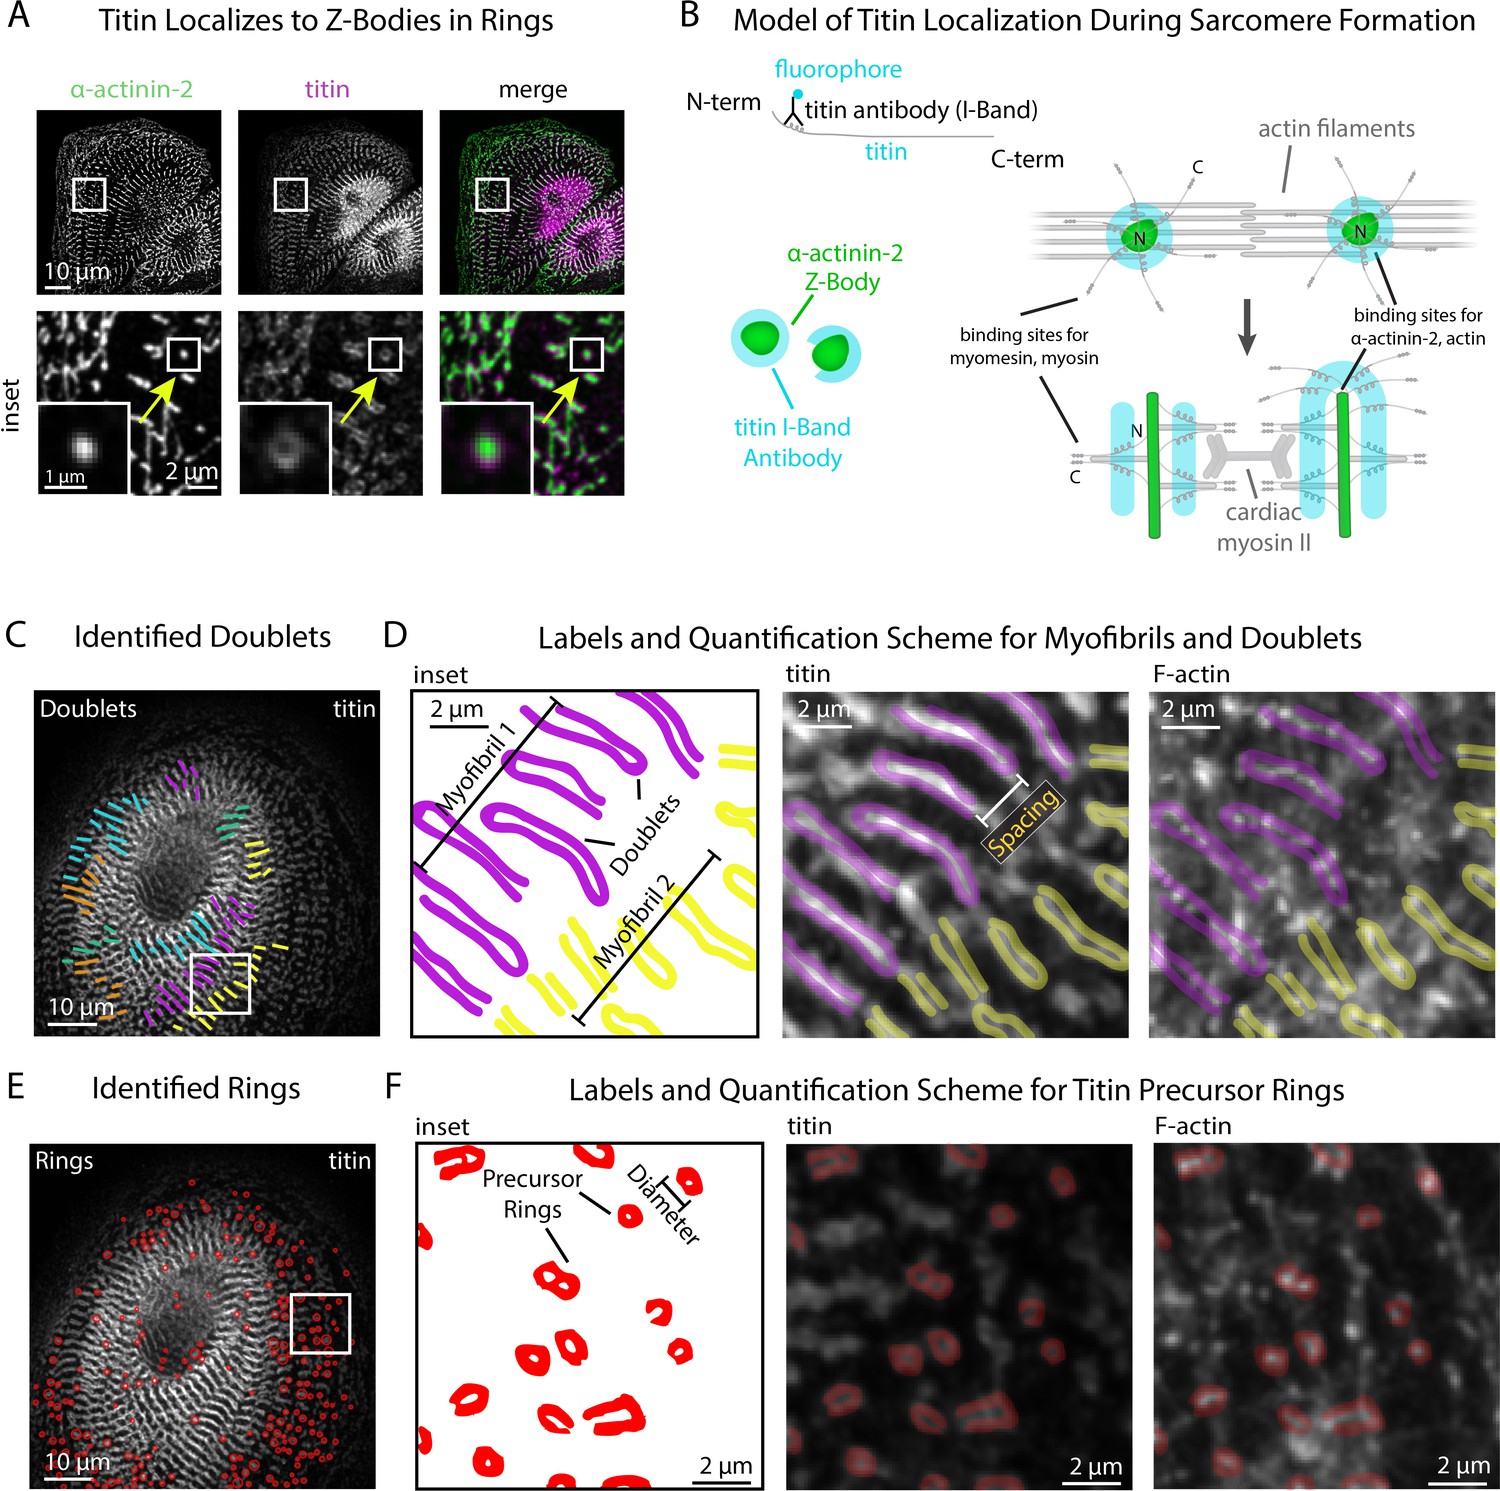
sarcApp uses titin binaries to identify myofibrils and precursor ring structures.
(A) Representative image of titin and α-actinin-2 in a control human induced pluripotent stem cell-derived cardiac myocyte (hiCM). Arrow: an α-actinin-2-positive Z-Body with titin localized in a ring around it. (B) Model of titin localization during sarcomere formation. (C) Titin doublets identified by sarcApp. Each line denotes a doublet with titin localized, and each color is a myofibril. (D) Quantification scheme for myofibrils and titin doublets. Details can be found in Figure 2—figure supplement 1 and the Methods. (E) Titin precursor rings identified by sarcApp (red). (F) Quantification scheme for titin precursor rings. Details can be found in Figure 2—figure supplement 1 and the Supplemental Methods.
Figure 5 with 1 supplement
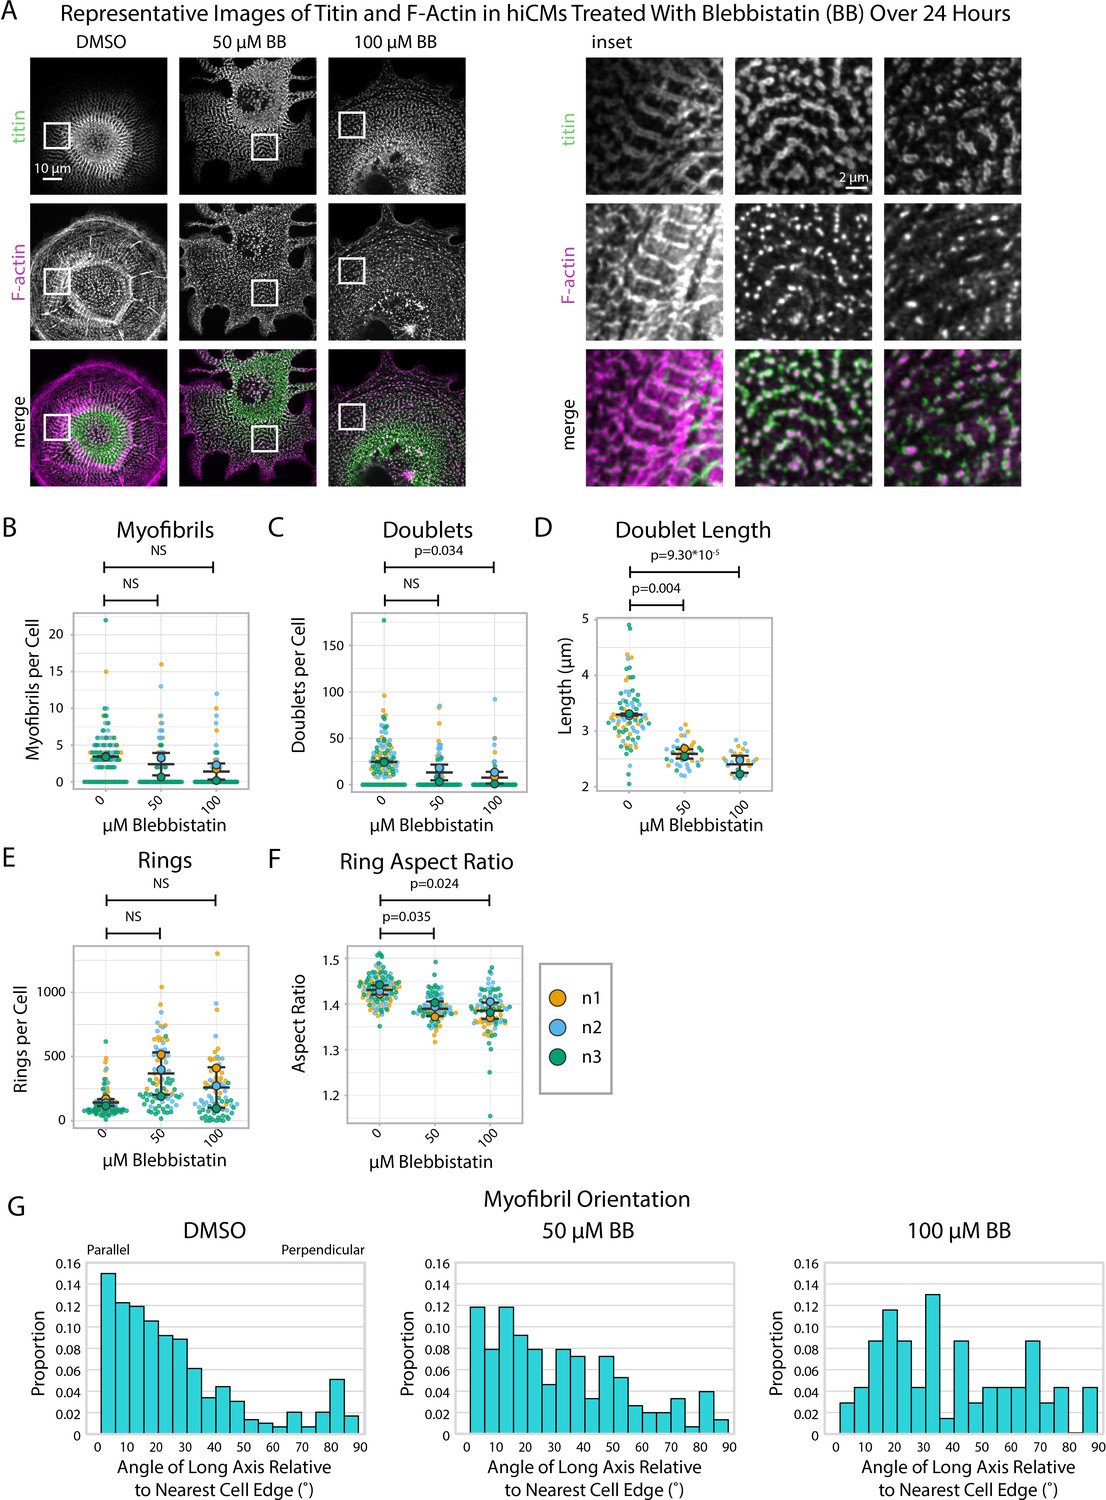
Blebbistatin affects myofibril orientation and the morphology of titin structures.
(A) Representative images of titin and F-actin in human induced pluripotent stem cell-derived cardiac myocytes (hiCMs) treated with DMSO, 50 µM Blebbistatin, and 100 µM Blebbistatin. (B) Myofibrils per cell in hiCMs (N = 3 biological replicates, 107 DMSO cells, 95 50 µM Blebbistatin cells, and 84 100 µM Blebbistatin cells). (C) Doublets per cell in hiCMs from (B). (D) Doublet length per cell in hiCMs from (B) (N = 58 DMSO cells, 32 50 µM Blebbistatin cells, and 21 100 µM Blebbistatin cells). (E) Rings per cell in hiCMs from (B). (F) Average ring aspect ratio per cell in hiCMs from (B) (N = 105 DMSO control cells, 95 50 µM Blebbistatin cells, and 78 100 µM Blebbistatin cells). (G) Myofibril orientation N = 292 DMSO control myofibrils, 151 50 µM Blebbistatin myofibrils, and 69 100 µM Blebbistatin myofibrils. Full sarcApp outputs can be found in Figure 5—figure supplement 1.
Figure 5—figure supplement 1

Titin quantification and organization in Blebbistatin-treated human induced pluripotent stem cell-derived cardiac myocytes (hiCMs) 24 hr post-plating.
(A) Myofibrils per cell in cells treated with DMSO or 50/100 µM Blebbistatin. Myofibrils defined as having four or more doublets in a row. N = 3 biological replicates, 107 DMSO control cells, 95 50 µM Blebbistatin cells, and 84 100 µM Blebbistatin cells. (B) Titin doublets per cell. Only doublets within myofibrils are counted. (C) Myofibril persistence length average per cell in hiCMs from (A): N = 3 biological replicates, 58 control cells, 32 50 µM Blebbistatin cells, and 21 100 µM Blebbistatin cells (only cells with myofibrils were quantified for C–E and M–N). (D) Average doublet length per cell in hiCMs from (C). (E) Average spacing between doublets per cell in hiCMs from (C). (F) Number of titin precursor rings per cell in hiCMs from (A). (G) Average ring diameter per cell per cell in hiCMs from S6A: N = 3 biological replicates, 105 control cells, 95 50 µM Blebbistatin cells, and 78 100 µM Blebbistatin cells (only cells with rings were quantified for G–H and K–L). (H) Average ring aspect ratio per cell in hiCMs from (G). An aspect ratio of 1 is circular, and higher ratios are elongated. (I) Total number of titin-positive puncta per cell in hiCMs from (G). (J) Average size of all titin-positive puncta per cell in hiCMs from (A). (K) Average distance from the edge of the five closest titin rings, per cell, in cells from (H). (L) Average distance from the edge of all titin rings per cell, in cells from (H). (M) Average distance from the edge of the five closest titin doublets, per cell, in hiCMs from (C). (N) Average distance from the edge of all titin doublets within myofibrils per cell, in hiCMs from (C).
Figure 6 with 1 supplement
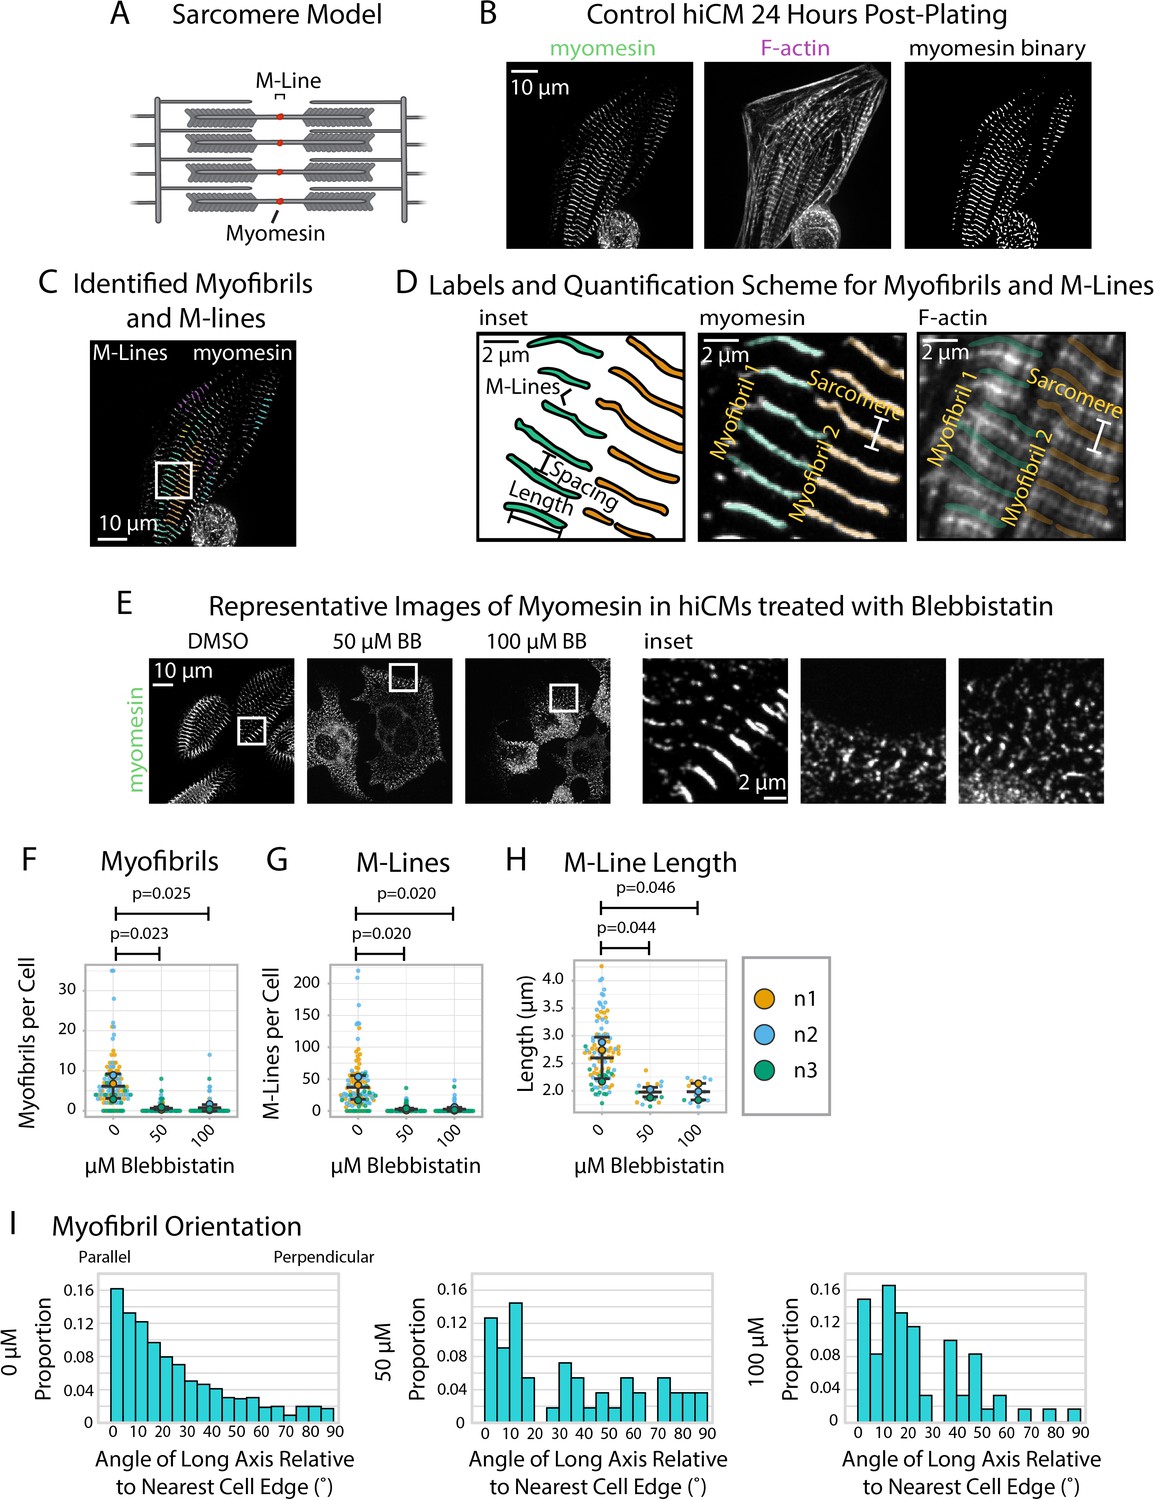
sarcApp uses myomesin binaries to identify myofibrils and M-Lines in human induced pluripotent stem cell-derived cardiac myocytes (hiCMs).
(A) Schematic showing myomesin localization at the M-Line. (B) Representative image of myomesin and F-actin in a hiCM. The myomesin binary was predicted using yoU-net as described in the Supplemental Methods. (C) Myofibrils and M-Lines identified by sarcApp. Each line denotes an M-Line, and each color represents a myofibril. (D) Quantification scheme for myofibrils and M-Lines. Details can be found in Figure 2—figure supplement 1. (E) Representative images of myomesin and F-actin in hiCMs treated with DMSO, 50 µM Blebbistatin, and 100 µM Blebbistatin. (F) Myofibrils per cell in hiCMs (N = 3 biological replicates; 112 DMSO cells, 90 50 µM Blebbistatin cells, and 89 100 µM Blebbistatin cells). (G) M-Lines per cell in hiCMs from (F). (H) Average M-Line length per cell in hiCMs from (F) (N = 97 DMSO control cells, 16 50 µM Blebbistatin cells, and 13 100 µM Blebbistatin cells). (I) Myofibril orientation (N = 752 DMSO control myofibrils, 49 50 µM Blebbistatin myofibrils, and 60 100 µM Blebbistatin myofibrils). Full sarcApp outputs can be found in Figure 6—figure supplement 1.
Figure 6—figure supplement 1
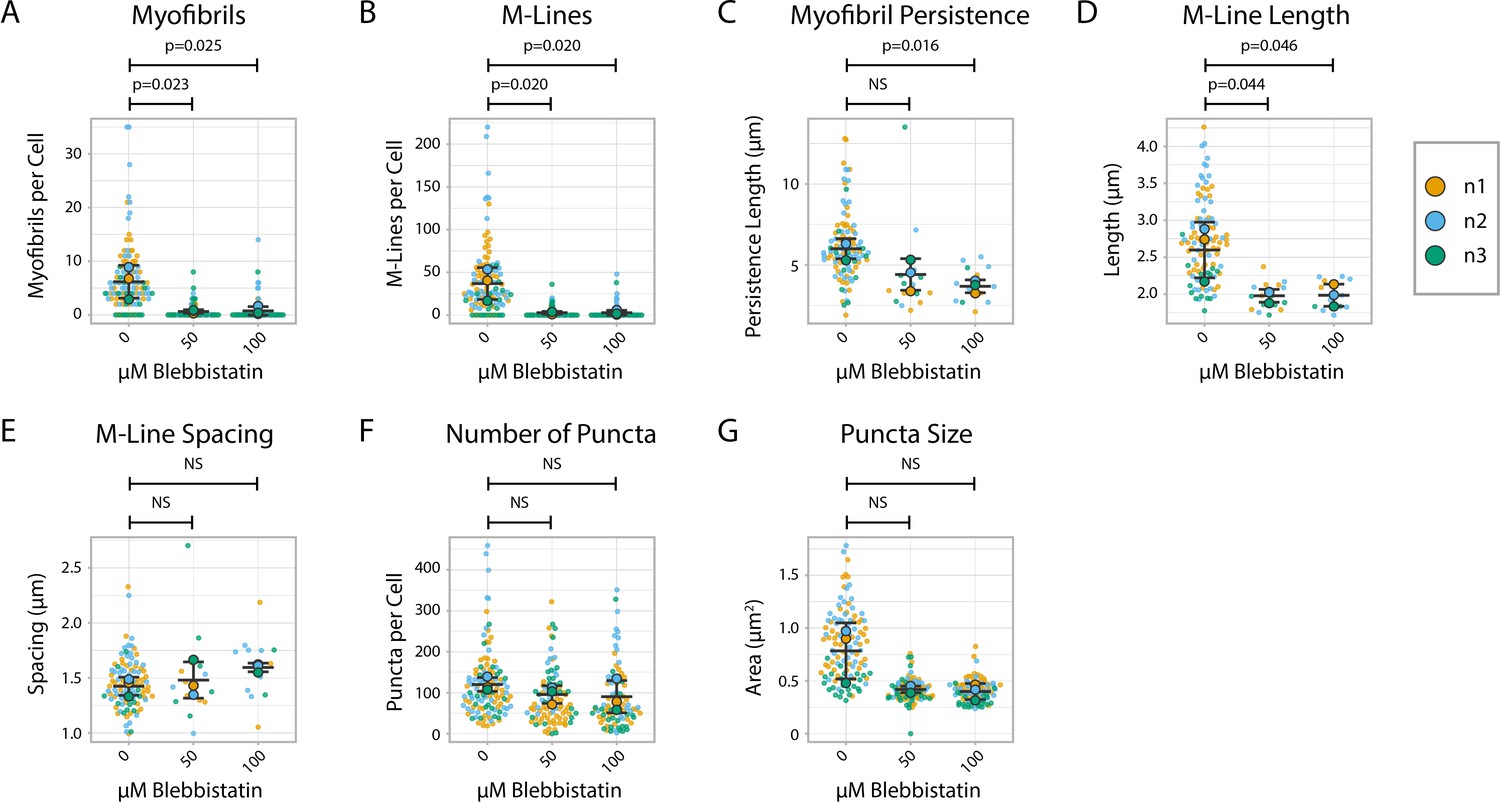
Myomesin quantification and organization in Blebbistatin-treated human induced pluripotent stem cell-derived cardiac myocyte (hiCMs) 24 hr post-plating.
(A) Myofibrils per cell in cells treated with DMSO or 50/100 µM Blebbistatin. Myofibrils defined as having three or more M-Lines in a row. N = 3 biological replicates, 112 DMSO control cells, 90 50 µM Blebbistatin cells, and 89 100 µM Blebbistatin cells. Quantification scheme details in Figure S2. (B) M-Lines per cell from (A). (C) Average myofibril persistence length per cell in hiCMs from (A): N = 3 biological replicates, 97 DMSO control cells, 16 50 µM Blebbistatin cells, and 13 100 µM Blebbistatin cells (only cells with myofibrils were quantified for C–E). (D) Average M-Line length per cell in hiCMs from (C). (E) Average spacing between M-Lines per cell in hiCMs from (C). (F) Number of myomesin-positive puncta per cell in hiCMs from (A). (G) Average size of all myomesin-positive puncta per cell in hiCMs from (A).
Figure 7 with 7 supplements
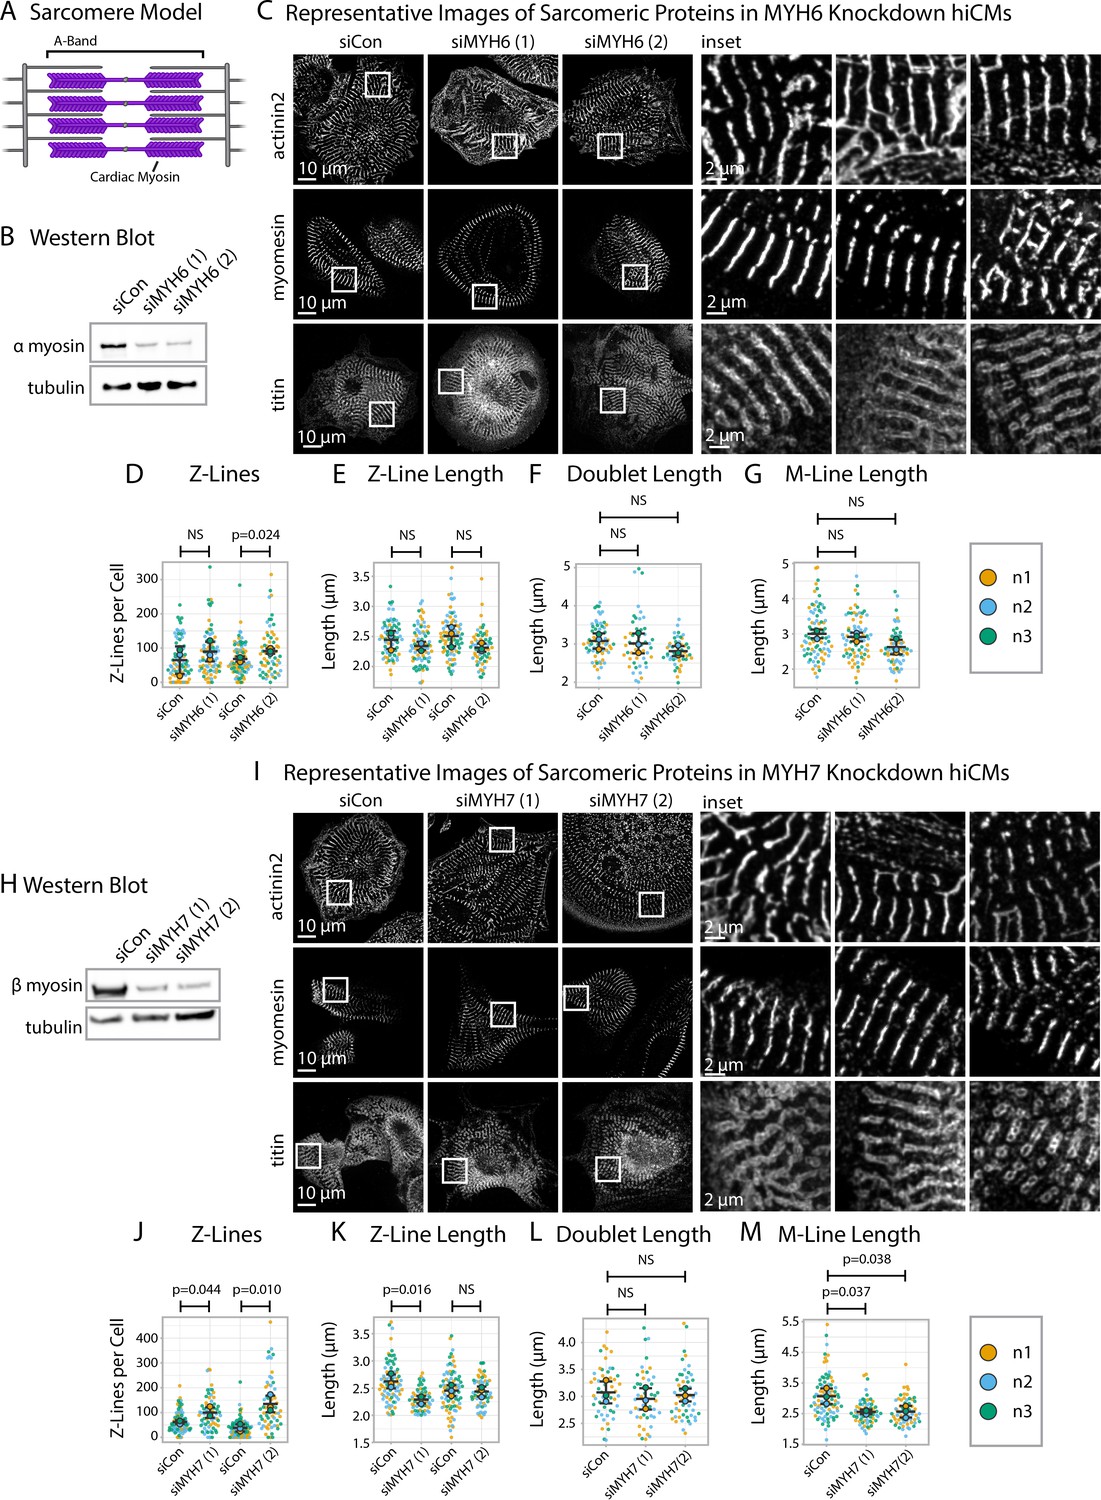
Knockdown of α or β cardiac myosin II reduces but does not eliminate sarcomeres.
(A) Schematic showing cardiac myosin localization in a sarcomere. (B) Representative western blot showing α cardiac myosin (MYH6) knockdown in hiCMs. (C) Representative images of α-actinin-2, titin, and myomesin in siControl human induced pluripotent stem cell-derived cardiac myocytes (hiCMs) and α cardiac myosin (MYH6) knockdown hiCMs. (D) Number of Z-Lines per cell in hiCMs in two independent groups of siControl (scramble)-treated hiCMs and two separate MYH6 siRNA-treated hiCMs (sequences 1 and 2). N = 3 biological replicates, 81 siCon cells and 78 siMYH6 (1) cells, and 88 siCon cells and 63 siMYH6 (2) cells. (E) Average Z-Line length per cell in hiCMs from (D). N = 68 siCon cells and 75 siMYH6 (1) cells, and 83 siCon cells and 62 siMYH6 (2) cells. (F) Average doublet length per cell in hiCMs in siCon (scramble)-treated hiCMs and two MYH6 siRNA sequences (1 and 2). 71 siCon cells, 49 siMYH6 (1) cells, and 50 siMYH6 (2) cells. (G) Average M-Line length per hiCMs. 85 siCon cells, 78 siMYH6 (1) cells, and 64 siMYH6 (2) cells. (H) Representative western blot showing β cardiac myosin (MYH7) knockdown in hiCMs. (I) Representative images of α-actinin-2, titin, and myomesin in β cardiac myosin (MYH7) knockdown hiCMs. (J) Number of Z-Lines per cell in hiCMs in two independent groups of siCon (scramble)-treated hiCMs and two separate MYH7 siRNA-treated hiCMs (pools 1 and 2). N = 86 siCon cells and 66 siMYH7 (1) cells, and 97 siCon cells and 62 siMYH7 (2) cells. (K) Average Z-Line length per cell in hiCMs from (J). 81 siCon cells and 63 siMYH7 (1) cells, and 81 siCon cells and 59 siMYH7 (2) cells. (L) Average doublet length per hiCM. N = 3 biological replicates, 94 siCon cells, 72 siMYH7 (1) cells, and 66 siMYH7 (2) cells. (M) Average M-Line length per cell in hiCMs. N = 87 siCon cells, 65 siMYH7 (1) cells, and 62 siMYH7 (2) cells. Full sarcApp outputs and western blots can be found in Figure 7—figure supplements 1–7.
-
Figure 7—source data 1
Original 16-bit image file for anti-MYH6 western blot.
See Figure 7-figure supplement 7A and Figure 7B.
- https://cdn.elifesciences.org/articles/87065/elife-87065-fig7-data1-v1.zip
-
Figure 7—source data 2
Original 16-bit image file for anti-tubulin western blot.
See Figure 7-figure supplement 7A and Figure 7B.
- https://cdn.elifesciences.org/articles/87065/elife-87065-fig7-data2-v1.zip
-
Figure 7—source data 3
Original 16-bit image file for anti-MYH7 western blot.
See Figure 7-figure supplement 7B and Figure 7H.
- https://cdn.elifesciences.org/articles/87065/elife-87065-fig7-data3-v1.zip
-
Figure 7—source data 4
Original 16-bit image file for anti-tubulin western blot.
See Figure 7-figure supplement 7B and Figure 7H.
- https://cdn.elifesciences.org/articles/87065/elife-87065-fig7-data4-v1.zip
Figure 7—figure supplement 1
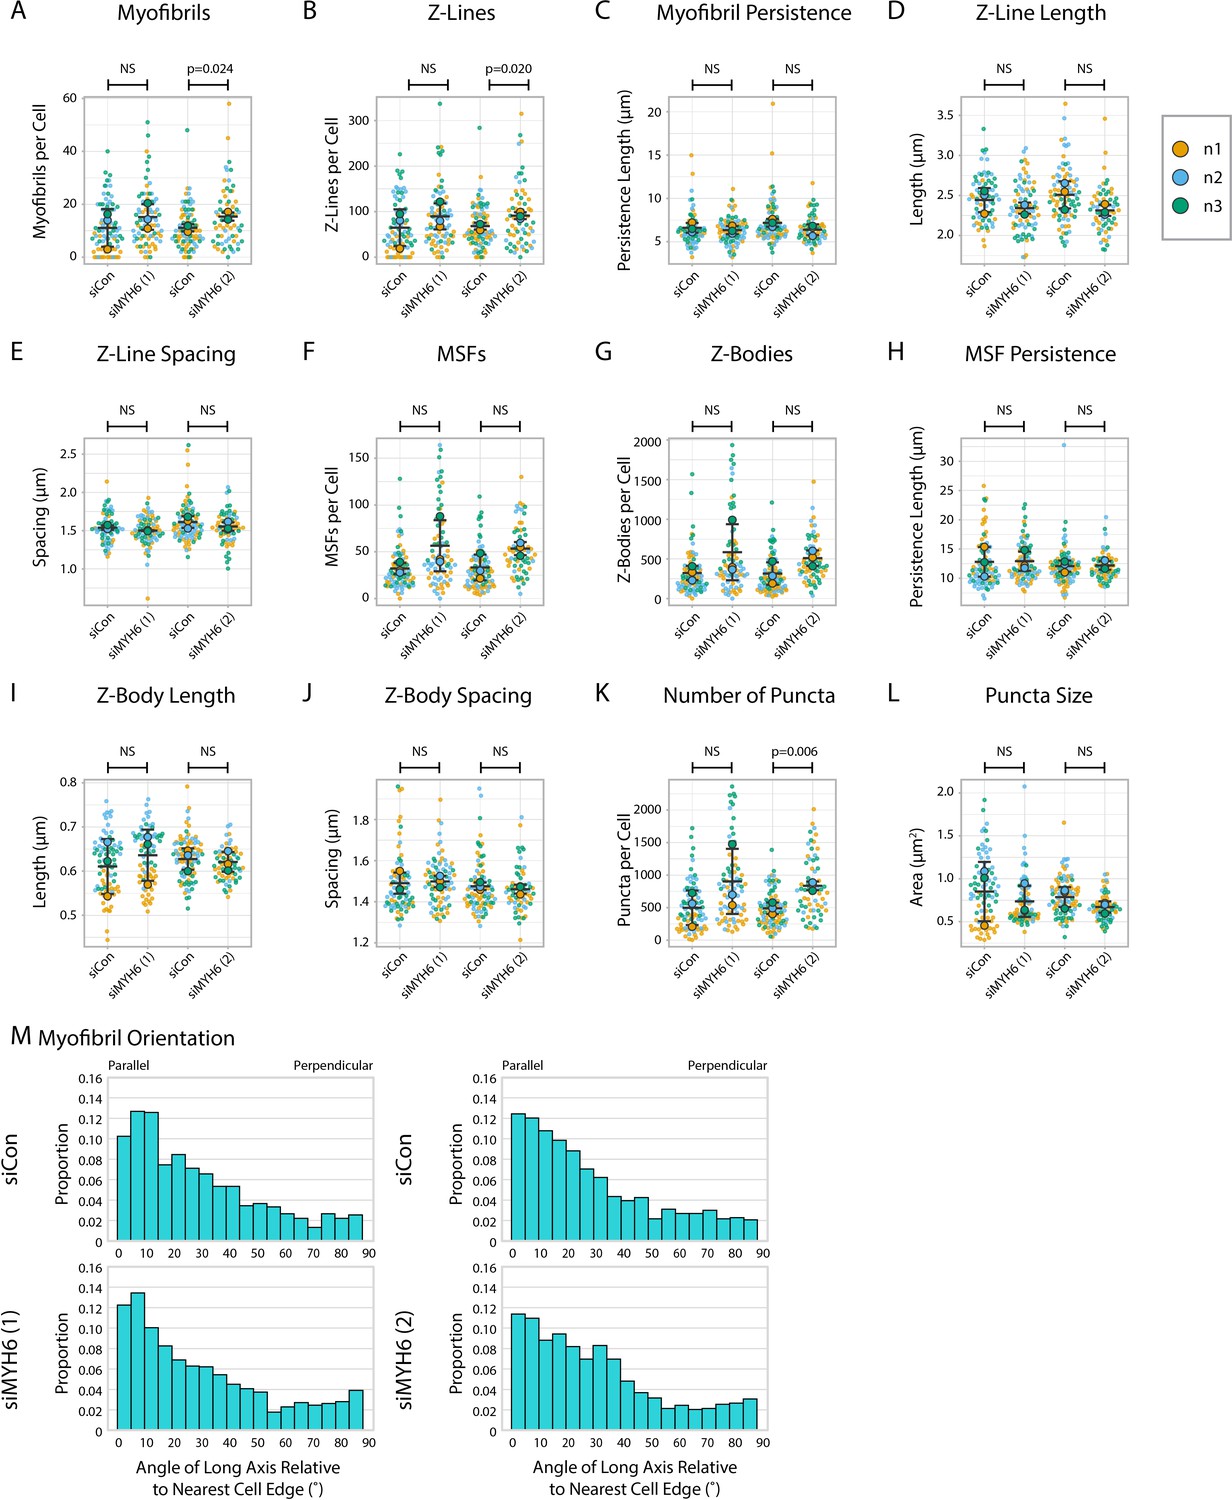
α-actinin-2 quantification and organization in MYH6 knockdown human induced pluripotent stem cell-derived cardiac myocytes (hiCMs).
(A) Myofibrils per cell in two groups of siCon (scramble)-treated hiCMs and two separate MYH6 siRNA-treated hiCMs (sequences 1 and 2). N = 3 biological replicates, 81 siCon cells and 78 siMYH6 (1) cells, and 88 siCon cells and 63 siMYH6 (2) cells. Myofibrils defined as having four or more Z-Lines in a row. Quantification details can be found in Figure 2—figure supplement 1. (B) Z-Lines per cell in hiCMs from (A). (C) Average myofibril persistence length per cell in hiCMs from (B): N = 68 siCon cells and 75 siMYH6 (1) cells, and 83 siCon cells and 62 siMYH6 (2) cells (only cells with myofibrils were quantified for C–E). (D) Average Z-Line length per cell in hiCMs from (C). (E) Average spacing between Z-Lines per cell in hiCMs from (C). (F) Muscle stress fibers (MSFs) per cell in cells from (A). (G) Z-Bodies per cell in hiCMs from (A). (H) Average MSF persistence length per cell in hiCMs from (A): N = 3 biological replicates, X7 siCon cells, X8 siMYH6 (1) cells, and X9 siMYH6 (2) cells (only cells with MSFs were quantified for H–J). (I) Average Z-Body length per cell in hiCMs from (H). (J) Average spacing between Z-Bodies per cell in hiCMs from (H). (K) Number of α-actinin-2-positive puncta per cell in hiCMs from (A). (L) Average size of α-actinin-2-positive puncta per cell in hiCMs from (A). (M) Myofibril orientation relative to the cell edge segment closest to the myofibril center, perpendicularly. N = 3 biological replicates: 898 siCon myofibrils and 1173 siMYH6 (1) myofibrils, and 964 siCon myofibrils and 974 siMYH6 (2) myofibrils. Details of quantification can be found in Figure 2M–O. N = 3 biological replicates.
Figure 7—figure supplement 2

Titin quantification and organization in MYH6 knockdown human induced pluripotent stem cell-derived cardiac myocytes (hiCMs).
(A) Myofibrils per cell in siCon (scramble)-treated hiCMs and two separate MYH6 siRNA-treated hiCMs (sequences 1 and 2). Myofibrils were defined as having four or more doublets in a row. N = 3 biological replicates, 91 siCon cells, 73 siMYH6 (1) cells, and 66 siMYH6 (2) cells. (B) Titin doublets per cell from Figure S9A. (C) Myofibril persistence length average per cell in hiCMs from (A): N = 3 biological replicates, 71 siCon cells, 49 siMYH6 (1) cells, and 50 siMYH6 (2) cells (only cells with myofibrils were quantified for C–E and M–N). (D) Average doublet length per cell in hiCMs from (C). (E) Average spacing between doublets per cell in hiCMs from (C). (F) Number of titin precursor rings per cell in hiCMs from (A). (G) Average ring diameter per cell in hiCMs from (A). N = 3 biological replicates, 78 siCon cells, 67 siMYH6 (1) cells, 60 siMYH6 (2) cells (only cells with rings were quantified for G–H and K–L). (H) Average ring aspect ratio per cell in hiCMs from (G). An aspect ratio of 1 is circular, and higher ratios are elongated. (I) Total number of titin-positive puncta per cell in hiCMs from (A). (J) Average size of all titin-positive puncta per cell in hiCMs from (A). (K) Average distance from the edge of the five closest titin rings, per cell, in hiCMs from (G). (L) Average distance from the edge of all titin rings per cell in hiCMs from (G). (M) Average distance from the edge of the five closest titin doublets, per cell, in hiCMs from (C). (N) Average distance from the edge of all titin doublets within myofibrils per cell in hiCMs from (C). (O) Myofibril orientation relative to the cell edge segment closest to the myofibril center, perpendicularly in hiCMs from (B). N = 3 biological replicates, 449 siCon myofibrils, 440 siMYH6 (1) myofibrils, and 442 siMYH6 (2) myofibrils. Details of quantification can be found in Figure 2M–O.
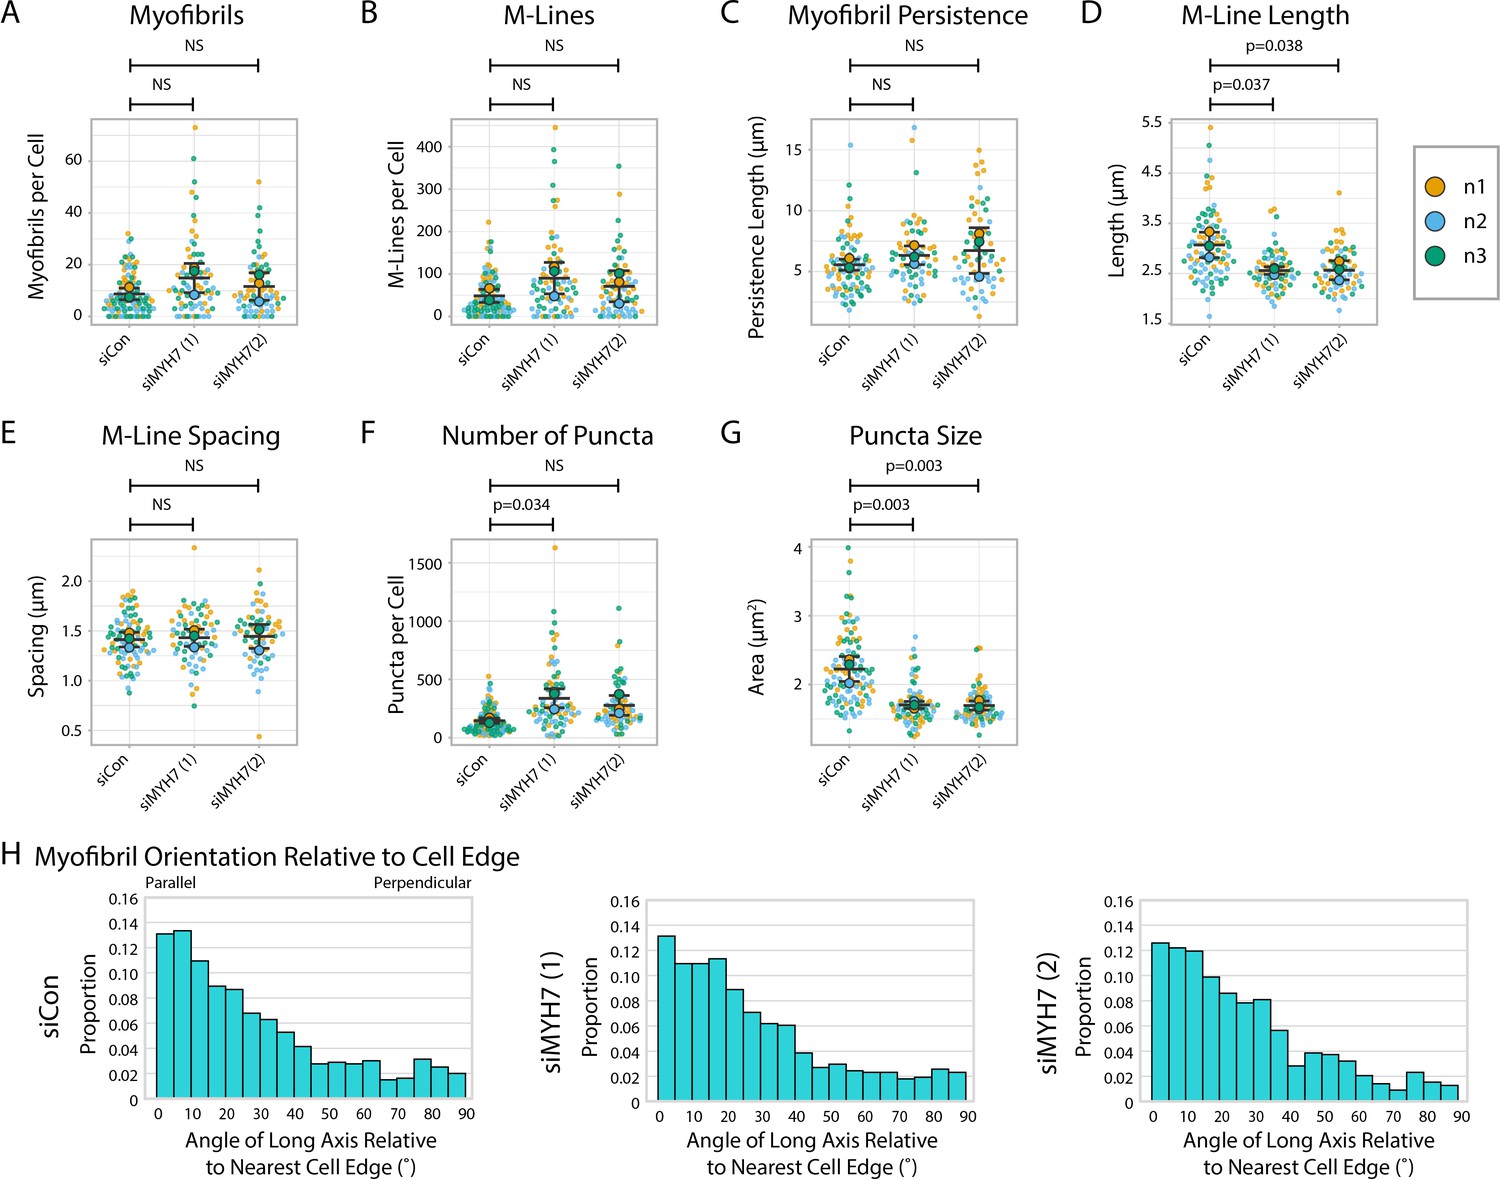
Figure 7—figure supplement 3
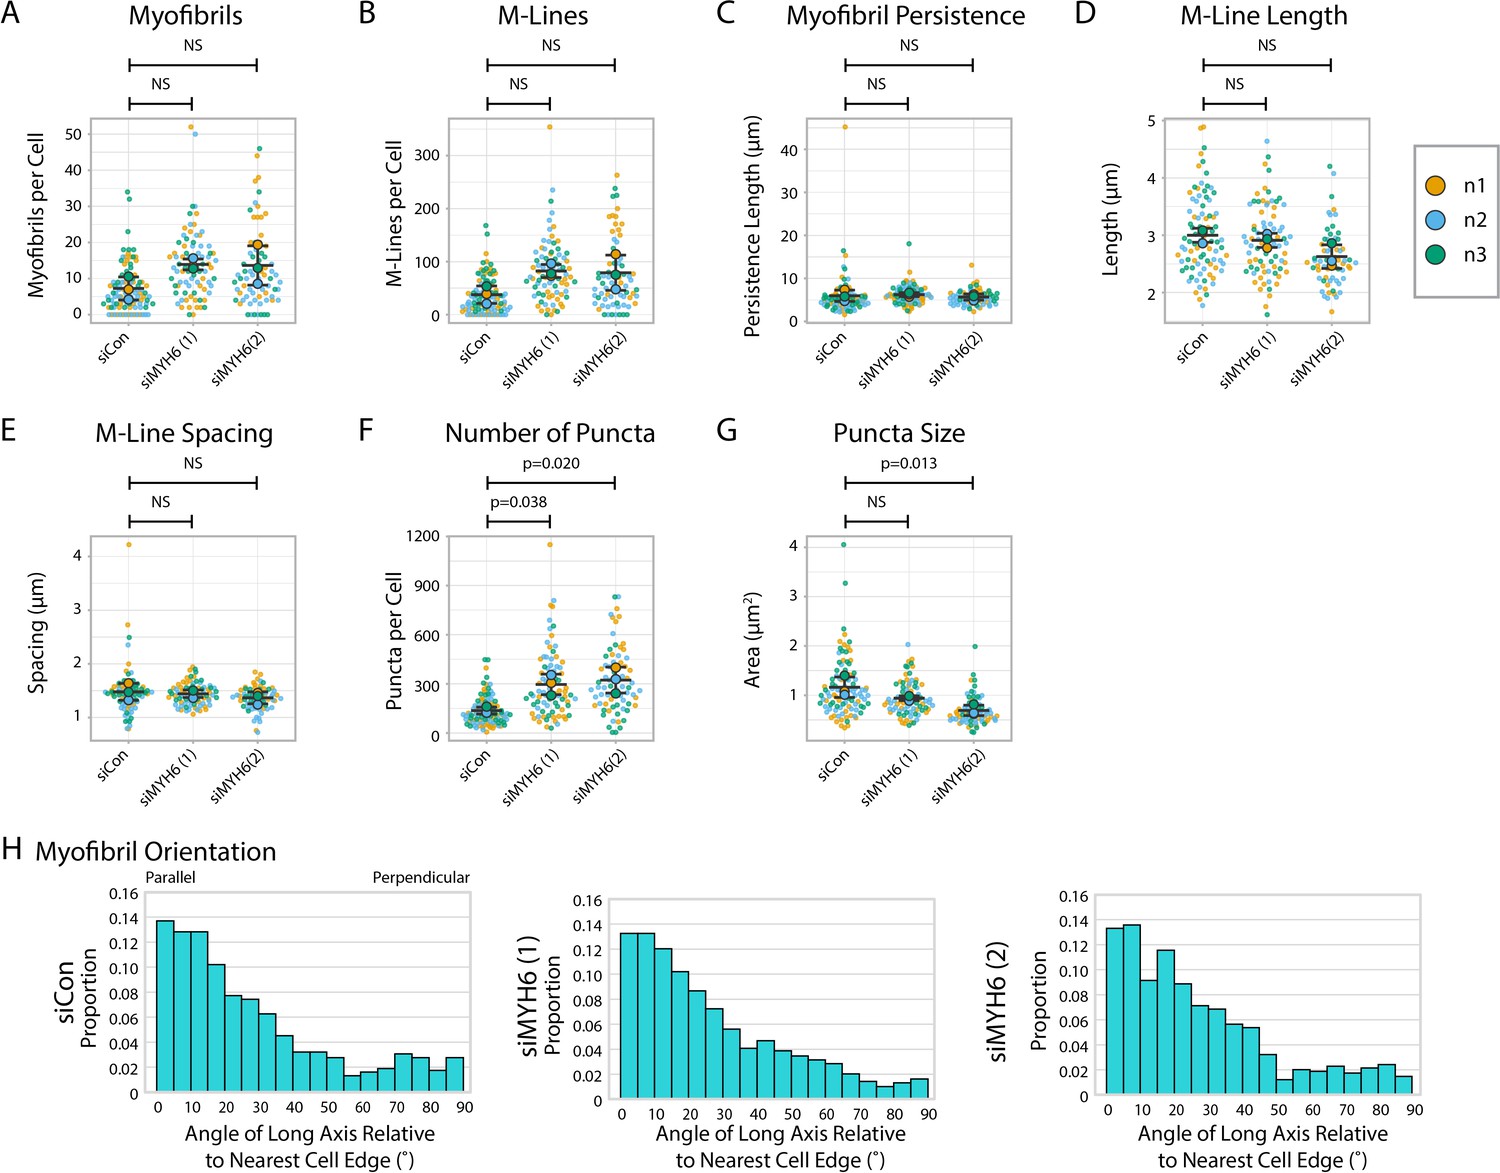
Myomesin quantification and organization in MYH6 knockdown cells.
(A) Myofibrils per cell in siCon (scramble)-treated human induced pluripotent stem cell-derived cardiac myocytes (hiCMs) and two separate MYH6 siRNA-treated hiCMs (sequences 1 and 2). Myofibrils defined as having three or more M-Lines in a row. N = 3 biological replicates, 100 siCon cells, 80 siMYH6 (1) cells, and 71 siMYH6 (2) cells. Quantification scheme details in Figure 2—figure supplement 1. (B) M-Lines per cell from (A). (C) Average myofibril persistence length per cell in hiCMs from (A): N = 3 biological replicates, 85 siCon cells, 78 siMYH6 (1) cells, and 64 siMYH6 (2) cells (only cells with myofibrils were quantified for C–E). (D) Average M-Line length per cell in hiCMs from (C). (E) Average spacing between M-Lines per cell in hiCMs from (C). (F) Number of myomesin-positive puncta per cell in hiCMs from (A). (G) Average size of all myomesin-positive puncta per cell in hiCMs from (A). (H) Myofibril orientation relative to the cell edge segment closest to the myofibril center, perpendicularly. N = 3 biological replicates, 685 siCon myofibrils, 979 siMYH6 (1) myofibrils, and 743 siMYH6 (2) myofibrils. Details of quantification can be found in Figure 2M–O.
Figure 7—figure supplement 4
α-actinin-2 quantification and organization in MYH7 knockdown human induced pluripotent stem cell-derived cardiac myocytes (hiCMs).
(A) Myofibrils per cell in two groups of siCon (scramble)-treated hiCMs and two separate MYH7 siRNA-treated hiCMs (pools 1 and 2). N = 3 biological replicates, 86 siCon cells and 66 siMYH7 (1) cells, and 97 siCon cells and 62 siMYH7 (2) cells. Myofibrils were defined as having four or more Z-Lines in a row. Details can be found in Figure 2—figure supplement 1. (B) Z-Lines per cell in hiCMs from (A). (C) Average myofibril persistence length per cell in hiCMs from (A): N = 3 biological replicates, 81 siCon cells and 62 siMYH7 (1) cells, and 81 siCon cells and 59 siMYH7 (2) cells (only cells with myofibrils were quantified for C–E). (D) Average Z-Line length per cell in hiCMs from (C). (E) Average spacing between Z-Lines per cell in hiCMs from (C). (F) Muscle stress fibers (MSFs) per cell in cells from (A). (G) Z-Bodies per cell in hiCMs from (A). (H) Average MSF persistence length per cell in hiCMs from (A): N = 3 biological replicates, 86 siCon cells and 66 siMYH7 (1) cells, and 97 siCon cells and 62 siMYH7 (2) cells (only cells with MSFs were quantified for H–J). (I) Average Z-Body length per cell in hiCMs from (H). (J) Average spacing between Z-Bodies per cell in hiCMs from (H). (K) Number of α-actinin-2-positive puncta per cell in hiCMs from (A). (L) Average size of α-actinin-2-positive puncta per cell in hiCMs from (A). (M) Myofibril orientation relative to the cell edge segment closest to the myofibril center, perpendicularly. N = 3 biological replicates, 878 siCon myofibrils and 1126 siMYH7 (1) myofibrils, and 622 siCon myofibrils and 1324 siMYH7 (2) myofibrils. Details of quantification can be found in Figure 2M–O.
Figure 7—figure supplement 5
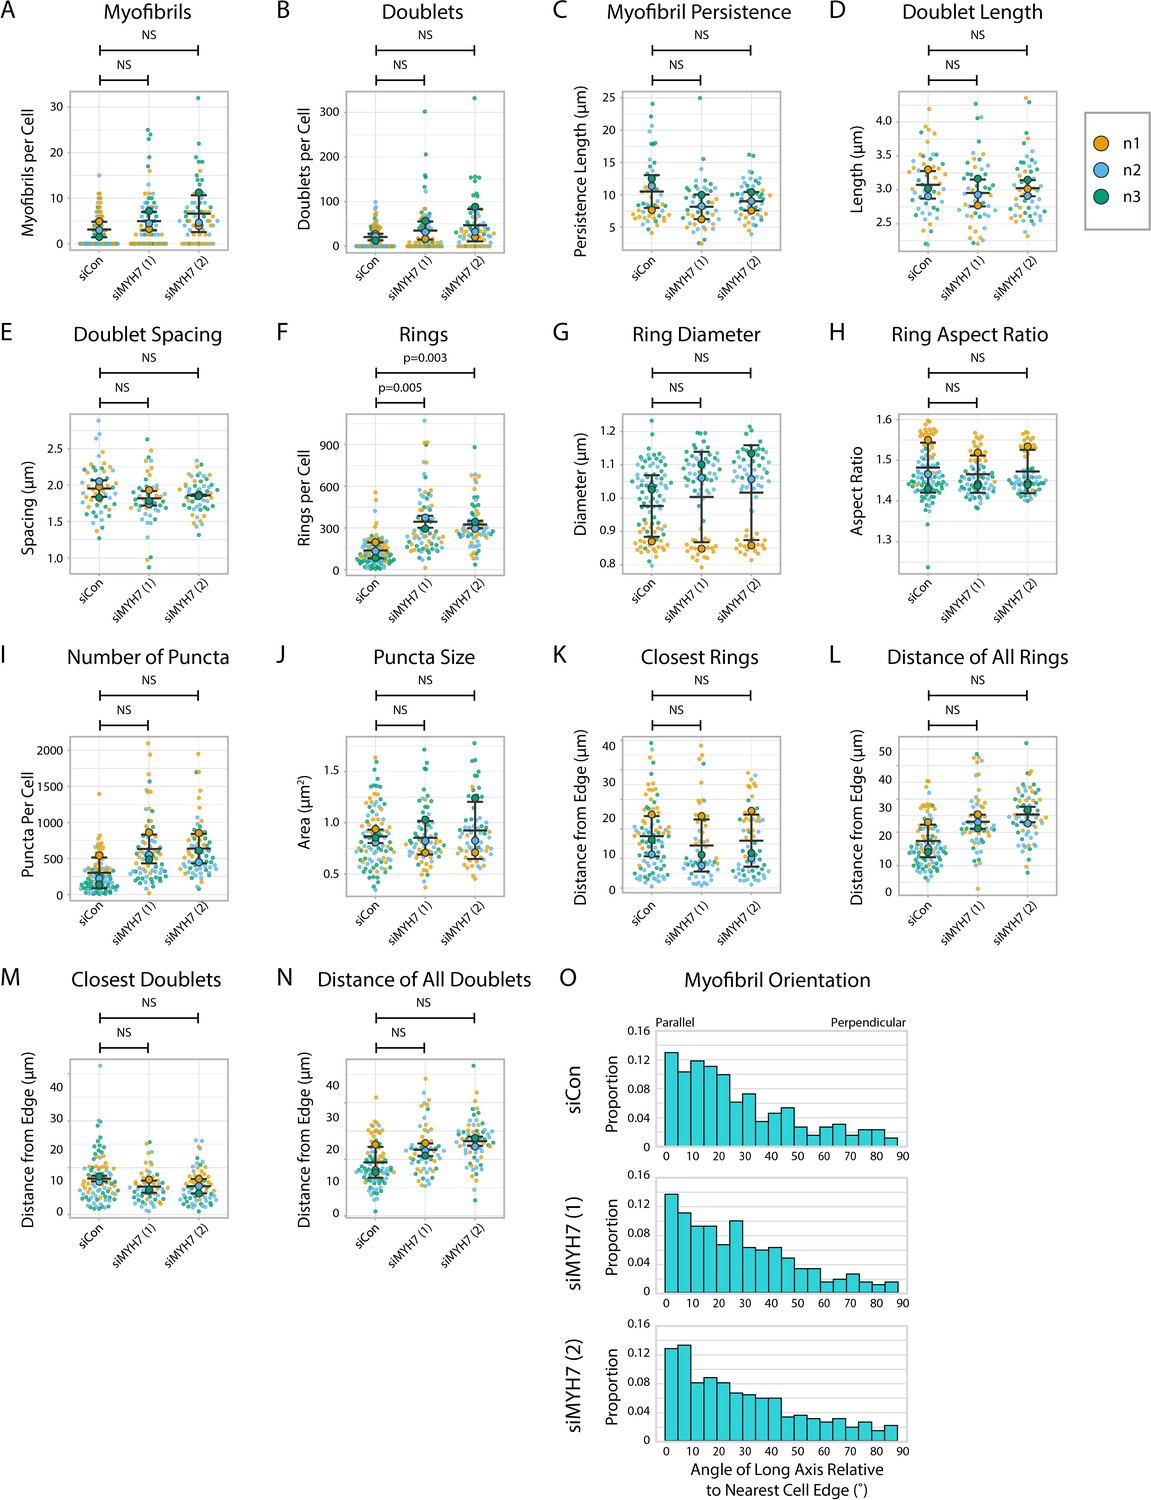
Titin quantification and organization in MYH7 knockdown human induced pluripotent stem cell-derived cardiac myocytes (hiCMs).
(A) Myofibrils per cell in siCon (scramble)-treated hiCMs and two separate MYH7 siRNA-treated hiCMs (pools 1 and 2). Myofibrils defined as having four or more doublets in a row. N = 3 biological replicates, 94 siCon cells, 72 siMYH7 (1) cells, and 66 siMYH7 (2) cells. (B) Titin doublets per cell from (A). (C) Myofibril persistence length average per cell in hiCMs from (A): N = 3 biological replicates, 56 siCon cells, 56 siMYH7 (1) cells, and 52 siMYH7 (2) cells (only cells with myofibrils were quantified for C–E and M–N). (D) Average doublet length per cell in hiCMs from (C). (E) Average spacing between doublets per cell in hiCMs from (C). (F) Number of titin precursor rings per cell in hiCMs from (A). (G) Average ring diameter per cell in hiCMs from (A): N = 3 biological replicates, 90 siCon cells, 58 siMYH7 (1) cells, and 64 siMYH7 (2) cells (only cells with rings were quantified for G–H and J-K). (H) Average ring aspect ratio per cell in hiCMs from (G). An aspect ratio of 1 is circular, and higher ratios are elongated. (I) Total number of titin-positive puncta per cell in hiCMs from (A). (J) Average size of all titin-positive puncta per cell in hiCMs from (A). (K) Average distance from the edge of the five closest titin rings, per cell, in hiCMs from (G). (L) Average distance from the edge of all titin rings per cell in hiCMs from (G). (M) Average distance from the edge of the five closest titin doublets, per cell, in hiCMs from (C). (N) Average distance from the edge of all titin doublets within myofibrils per cell in hiCMs from (C). (O) Myofibril orientation relative to the cell edge segment closest to the myofibril center, perpendicularly in hiCMs from (B). N = 3 biological replicates, 278 siCon myofibrils, 318 siMYH7 (1) myofibrils, and 458 siMYH7 (2) myofibrils. Details of quantification can be found in Figure 2M–O.
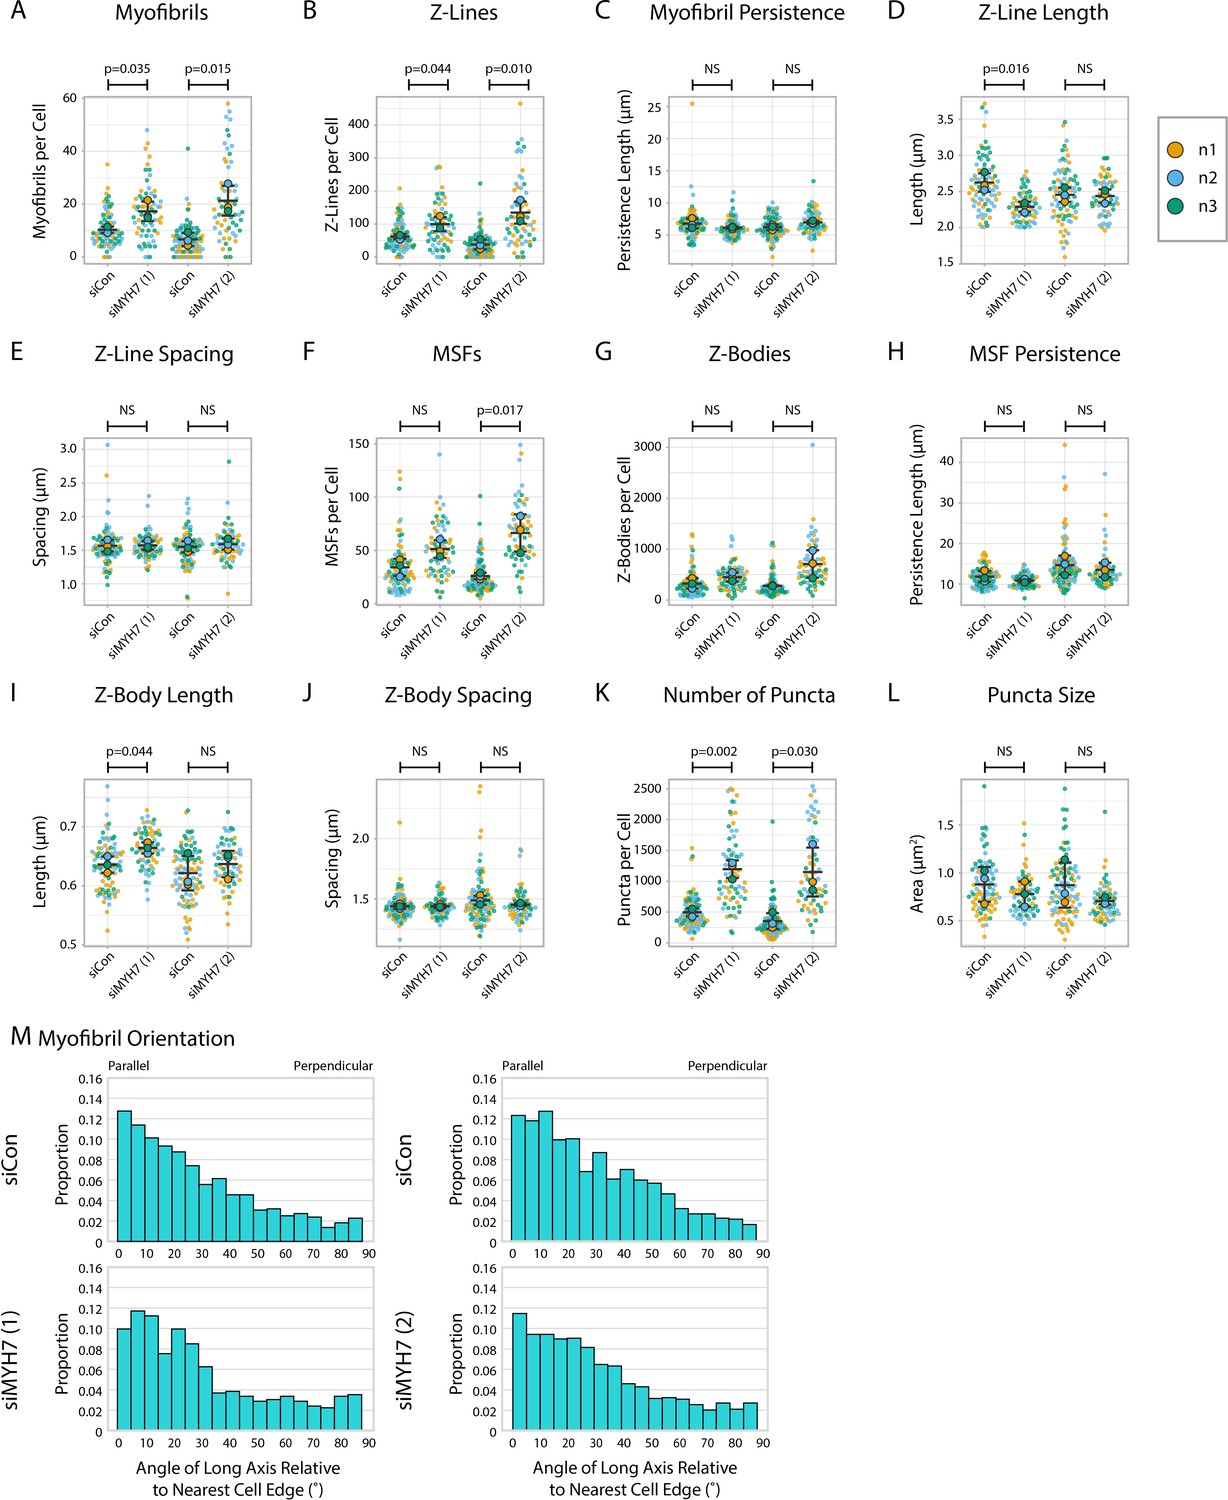
Figure 7—figure supplement 6
Myomesin quantification and organization in MYH7 knockdown cells.
(A) Myofibrils per cell in siCon (scramble)-treated human induced pluripotent stem cell-derived cardiac myocytes (hiCMs) and two separate MYH7 siRNA-treated hiCMs (pools 1 and 2). Myofibrils defined as having three or more M-Lines in a row. N = 3 biological replicates, 104 siCon cells, 75 siMYH7 (1) cells, and 70 siMYH7 (2) cells. Quantification scheme details in Figure 2—figure supplement 1. (B) M-Lines per cell in hiCMs from (A). (C) Average myofibril persistence length per cell in hiCMs from (A): N = 3 biological replicates, 87 siCon cells, 65 siMYH7 (1) cells, and 62 siMYH7 (2) cells (only cells with myofibrils were quantified for Figure S13C–E). (D) Average M-Line length per cell in hiCMs from (C). (E) Average spacing between M-Lines per cell in hiCMs from (C). (F) Number of myomesin-positive puncta per cell in hiCMs from (A). (G) Average size of all myomesin-positive puncta per cell in hiCMs from (A). (H) Myofibril orientation relative to the cell edge segment closest to the myofibril center, perpendicularly. N = 3 biological replicates, 793 siCon myofibrils, 775 siMYH7 (1) myofibrils, and 778 siMYH7 (2) myofibrils. Details of quantification can be found in Figure 2M–O.
Figure 7—figure supplement 7
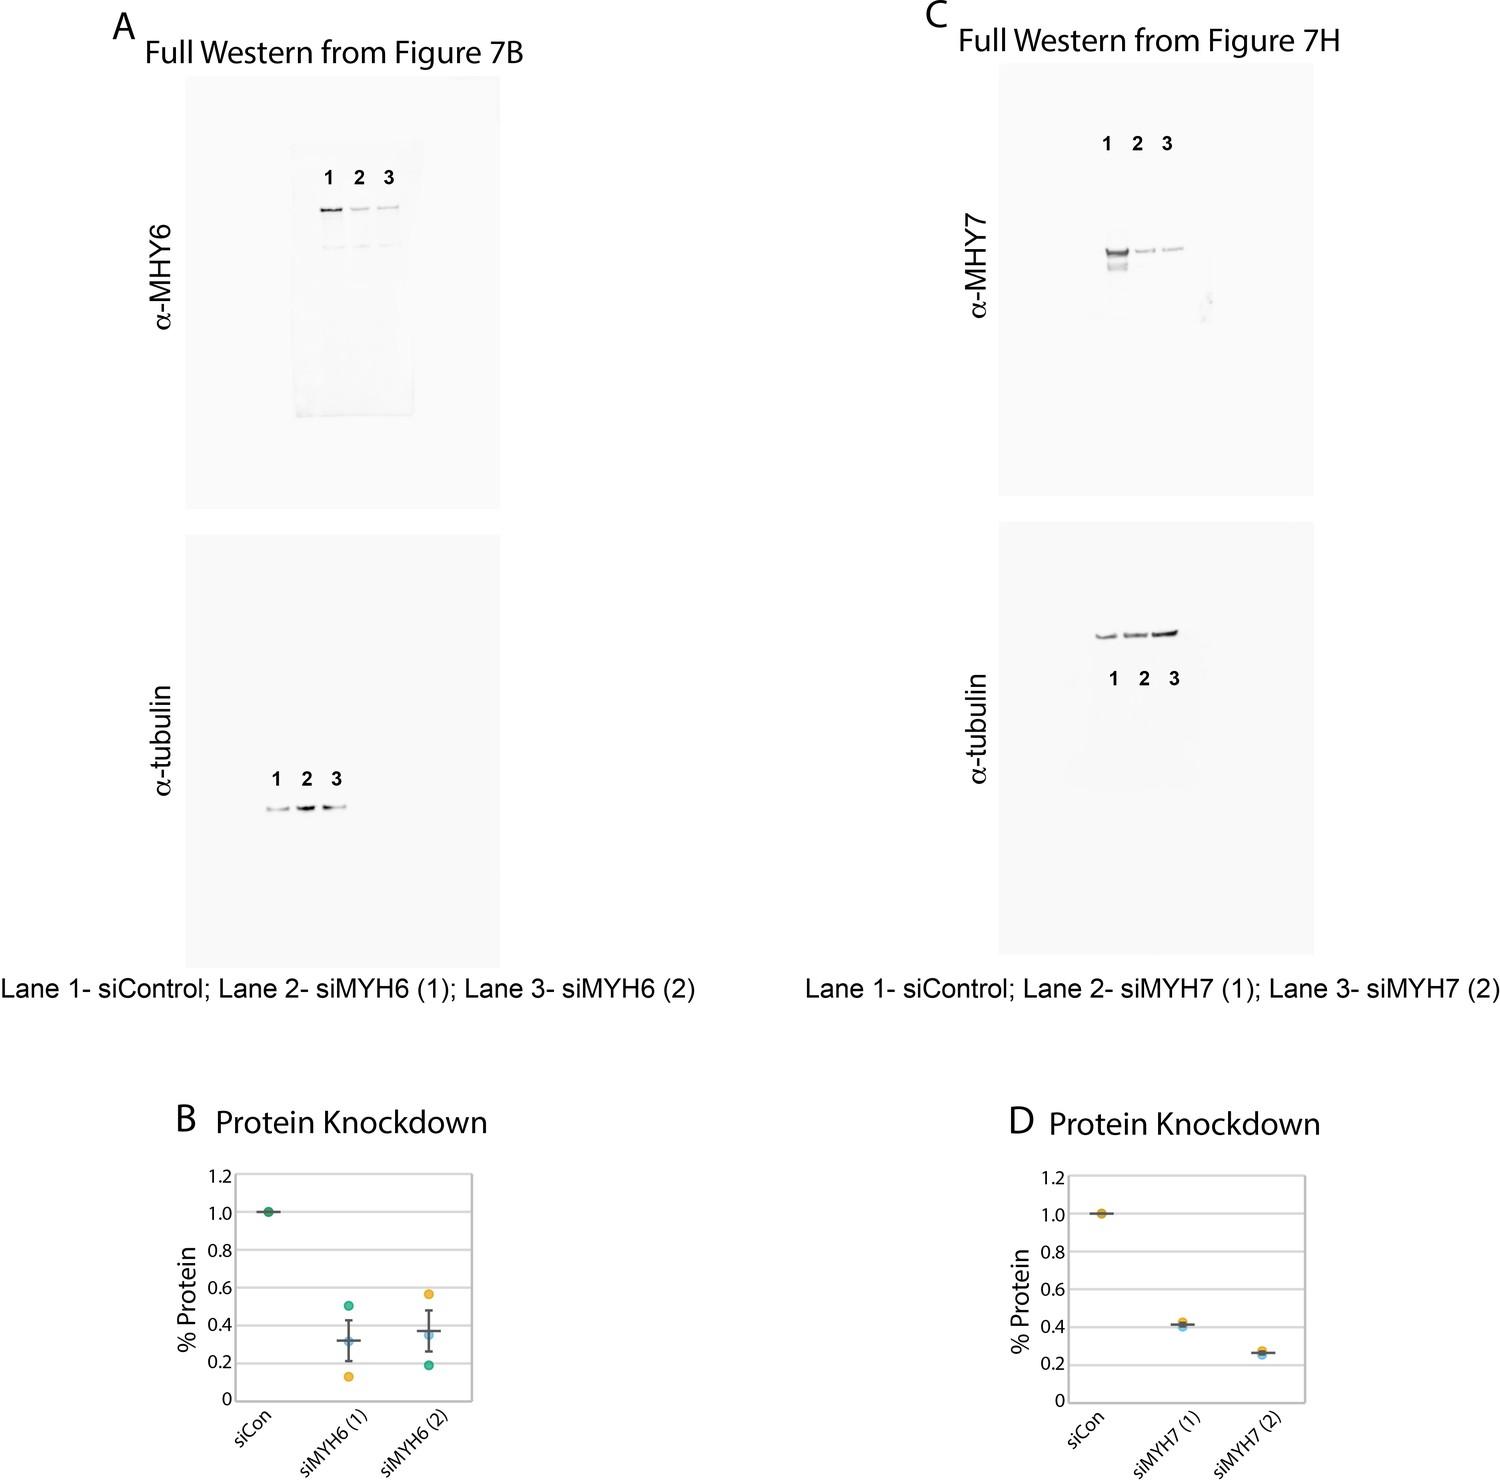
MYH6 and MYH7 knockdown western blots.
(A) Full image for the western blots shown in in Figure 7B. Individual lanes are denoted by numbers. Protein knockdown using siRNA targeted to MYH6. (C) Full image for the western blots shown in in Figure 7H. Individual lanes are denoted by numbers. (D) Protein knockdown using siRNA targeted to MYH7. N = 2 biological replicates. Anti-MYH6 and Anti-MYH7 images displayed at 0–50,000 gray levels. Anti-tubulin images displayed at 0–40,000. Full 16-bit images can be found in Figure 7—source data 1–4.
Figure 8 with 3 supplements
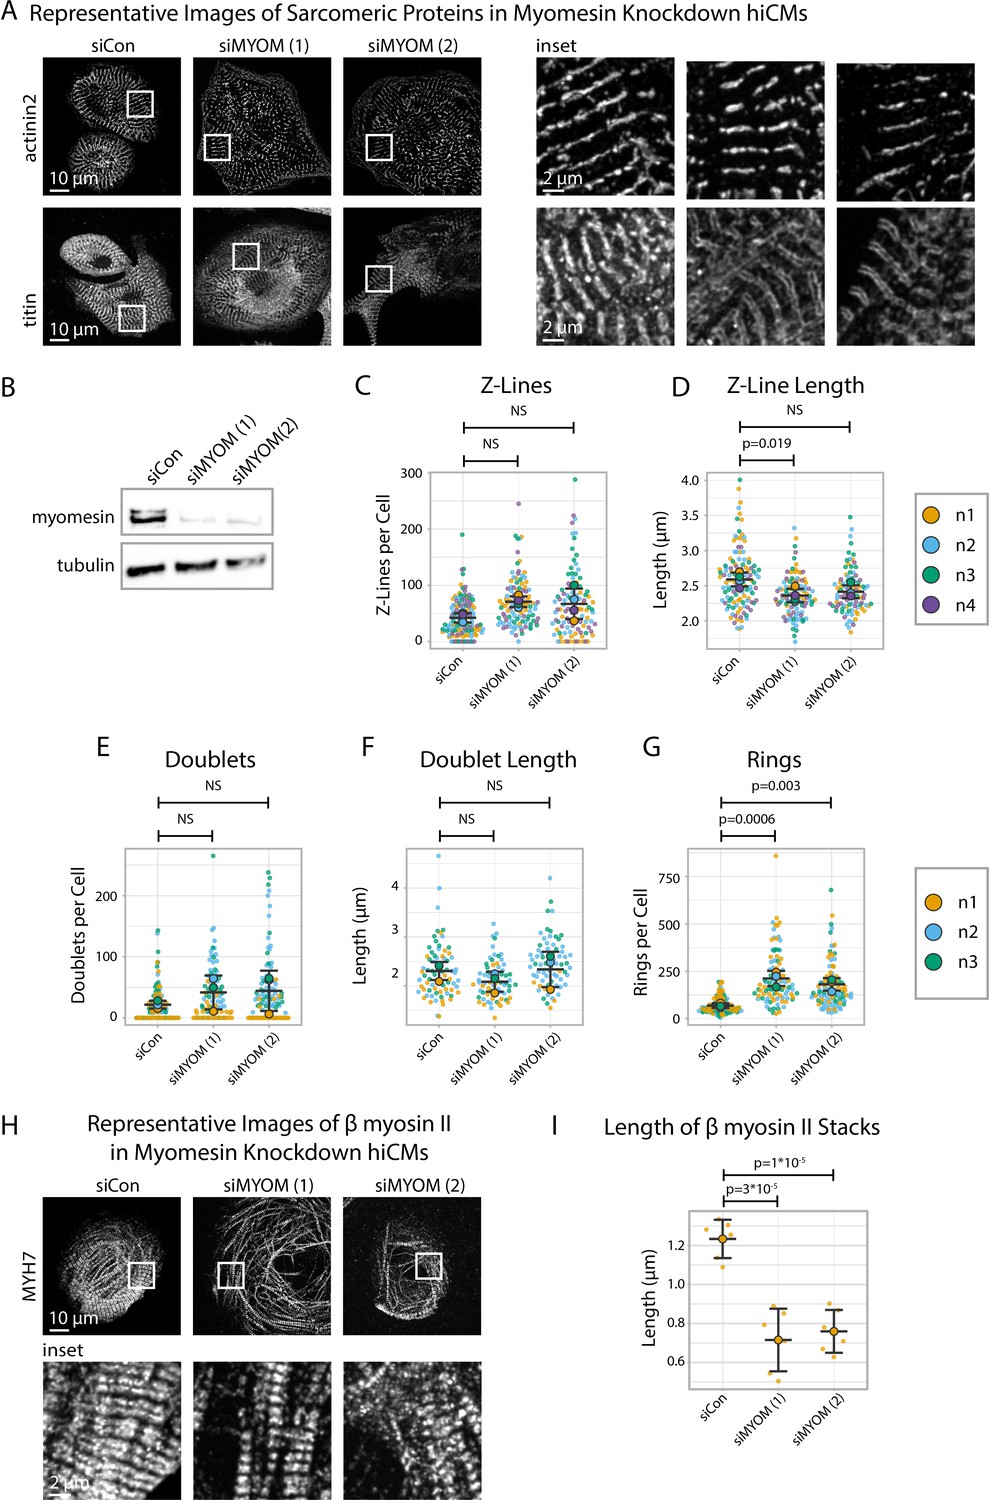
Myomesin knockdown alters titin and cardiac myosin II localization, but not α-actinin-2.
(A) Representative images of sarcomeric proteins α-actinin-2 and titin in myomesin (MYOM) knockdown human induced pluripotent stem cell-derived cardiac myocytes (hiCMs). (B) Representative western blot and quantification showing MYOM knockdown in hiCMs, N = 3 biological replicates. (C) Number of Z-Lines per cell in siCon (scramble)-treated hiCMs and two separate MYOM siRNA-treated hiCMs (sequences 1 and 2). N = 3 biological replicates, 132 siCon cells, 105 siMYOM (1) cells, and 103 siMYOM (2) cells. (D) Average Z-Line length per cell in hiCMs from (C): N = 4 biological replicates, 117 siCon cells, 104 siMYOM (1) cells, and 92 siMYOM (2) cells (only cells with myofibrils were quantified for D). (E) Titin doublets per cell in hiCMs using experimental treatments in (C). N = 3 biological replicates, 117 siCon cells, 90 siMYOM (1) cells, and 100 siMYOM (2) cells. (F) Average doublet length per cell in hiCMs from (E): N = 3 biological replicates, 74 siCon cells, 68 siMYOM (1) cells, and 70 siMYOM (2) cells (only cells with myofibrils were quantified for F). (G) Rings per cell in hiCMs from (E). (H) Representative images of MYH7 and F-actin in siCon, siMYOM (1), and siMYOM (2) hiCMs. (I) Length of β cardiac myosin stacks in siCon, siMYOM (1), and siMYOM (2) hiCMs. Full sarApp outputs and western blot can be found in Figure 8—figure supplements 1–3.
-
Figure 8—source data 1
Original 16-bit image file for anti-MYH6 western blot.
See Figure 8—figure supplement 3A and Figure 8B.
- https://cdn.elifesciences.org/articles/87065/elife-87065-fig8-data1-v1.zip
-
Figure 8—source data 2
Original 16-bit image file for anti-tubulin western blot.
See Figure 8—figure supplement 3A and Figure 8B.
- https://cdn.elifesciences.org/articles/87065/elife-87065-fig8-data2-v1.zip
Figure 8—figure supplement 1
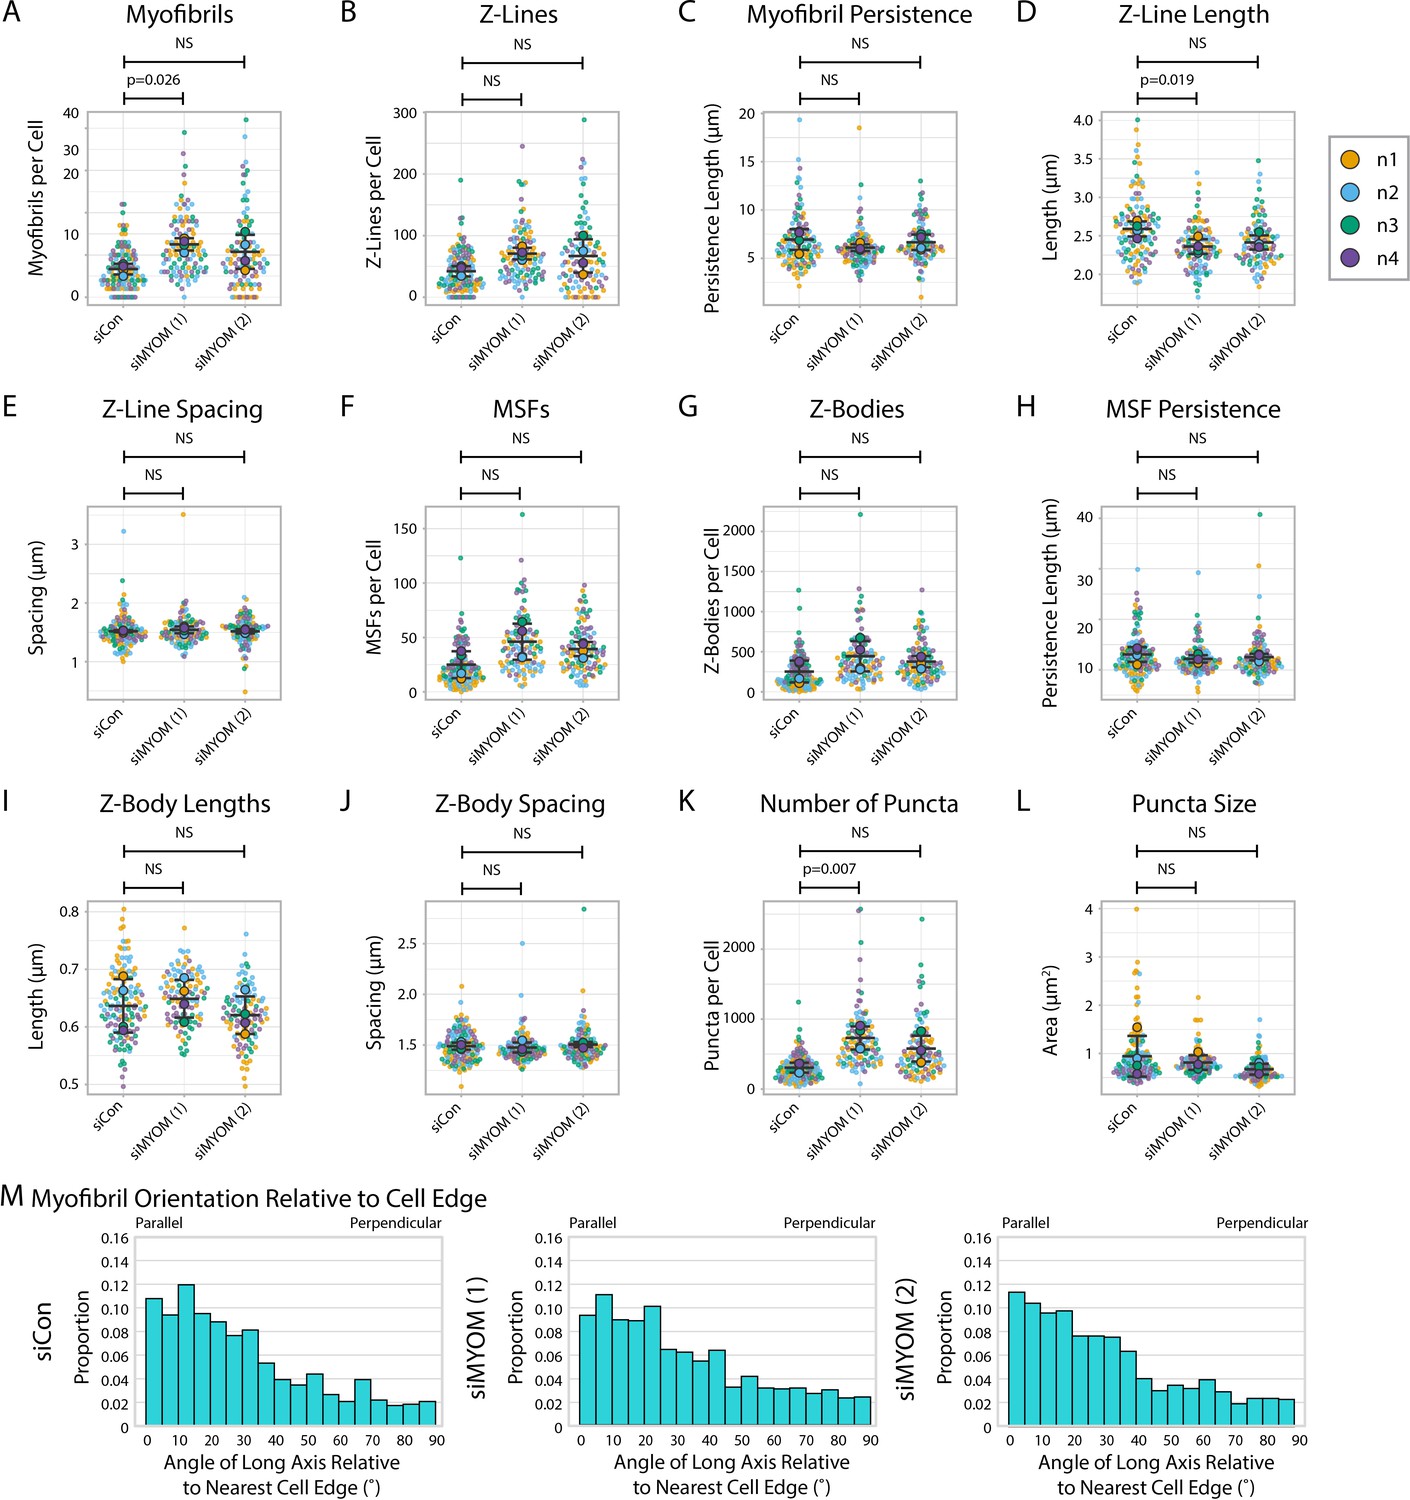
α-actinin-2 quantification and organization in myomesin knockdown human induced pluripotent stem cell-derived cardiac myocytes (hiCMs).
(A) Myofibrils per cell in siCon (scramble)-treated hiCMs and two separate myomesin siRNA-treated hiCMs (sequences 1 and 2). Myofibrils defined as having four or more Z-Lines in a row. N = 4 biological replicates, 132 siCon cells, 105 siMYOM (1) cells, and 103 siMYOM (2) cells. More quantification details can be found in Figure 2—figure supplement 1. (B) Z-Lines per cell in hiCMs from (A). (C) Average myofibril persistence length per cell in hiCMs from (A): N = 4 biological replicates, 117 siCon cells, 104 siMYOM (1) cells, and 92 siMYOM (2) cells (only cells with myofibrils were quantified for C–E). (D) Average Z-Line length per cell in hiCMs from (C). (E) Average spacing between Z-Lines per cell in hiCMs from (C). (F) Muscle stress fibers (MSFs) per cell in cells from (A). (G) Z-Bodies per cell in hiCMs from (A). (H) Average MSF persistence length per cell in hiCMs from Figure S14A: N = 4 biological replicates, 131 siCon cells, 105 siMYOM (1) cells, and 103 siMYOM (2) cells (only cells with MSFs were quantified for H–J). (I) Average Z-Body length per cell in hiCMs from (H). (J) Average spacing between Z-Bodies per cell in hiCMs from (H). (K) Number of α-actinin-2-positive puncta per cell in hiCMs from (A). (L) Average size of α-actinin-2-positive puncta per cell in hiCMs from (A). (M) Myofibril orientation relative to the cell edge segment closest to the myofibril center, perpendicularly. N = 4 biological replicates, 862 siCon myofibrils, 1305 siMYOM (1) myofibrils, and 1086 siMYOM (2) myofibrils. Details of quantification can be found in Figure 2M–O.
Figure 8—figure supplement 2
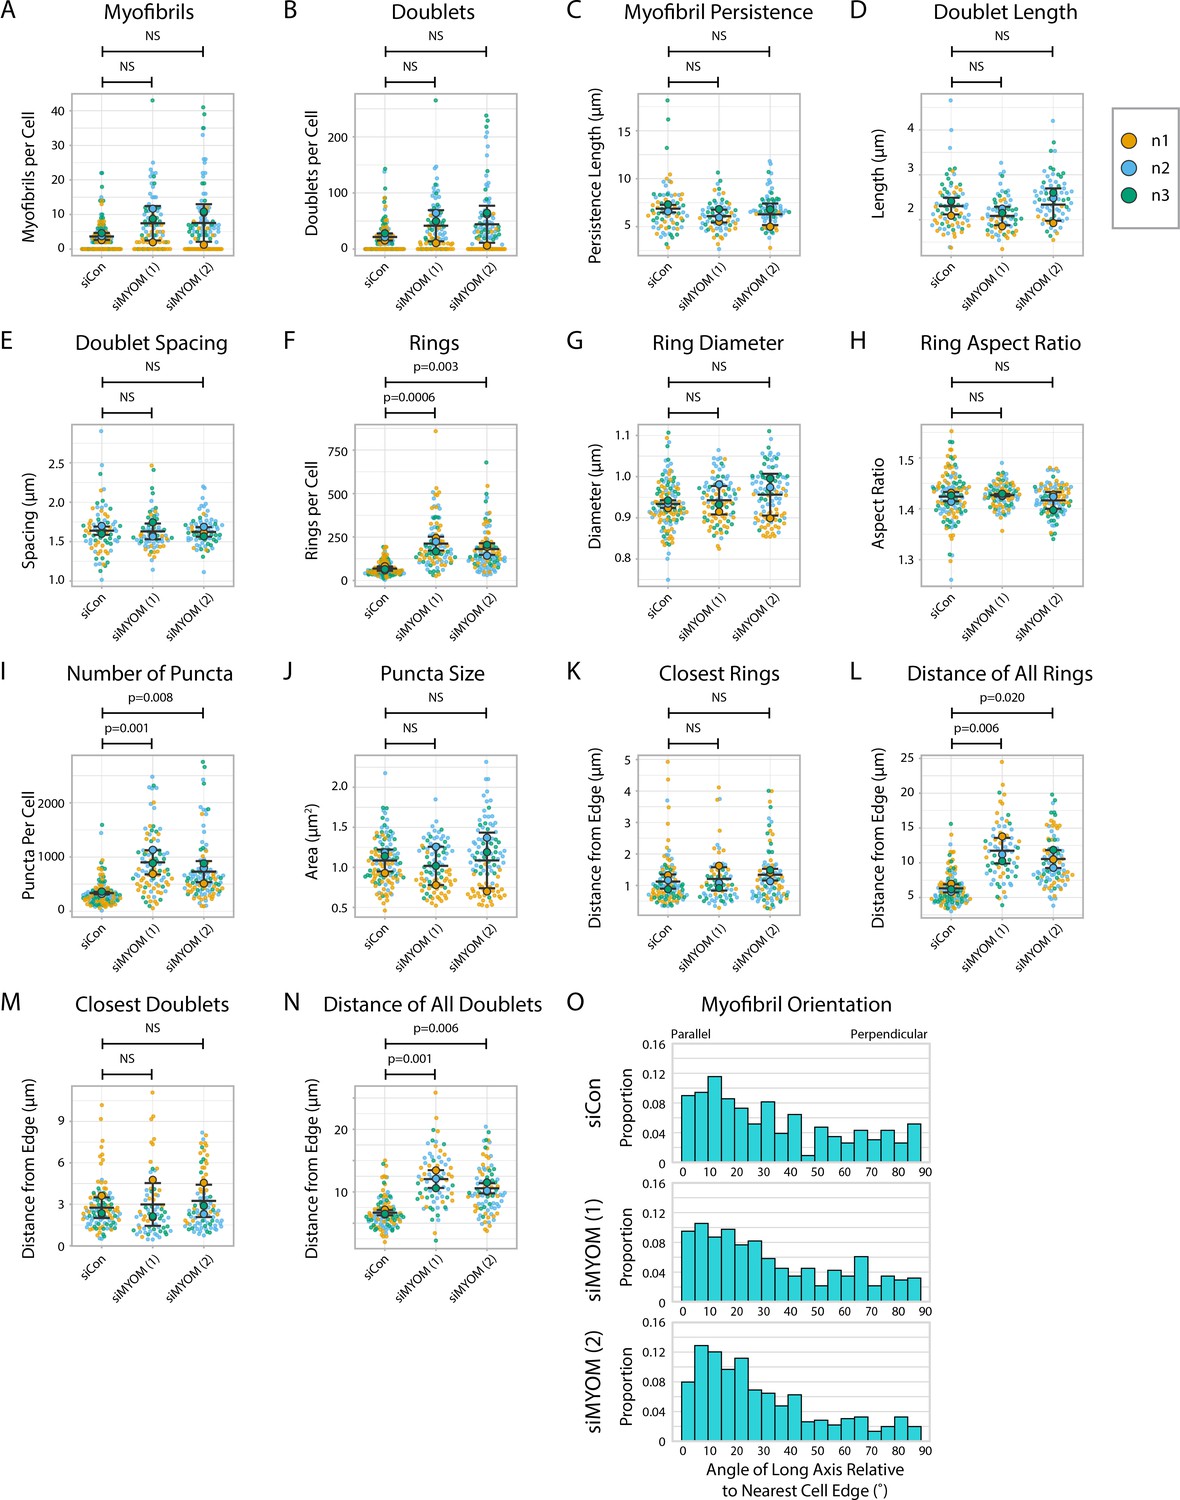
Titin quantification and organization in myomesin knockdown human induced pluripotent stem cell-derived cardiac myocytes (hiCMs).
(A) Myofibrils per cell in siCon (scramble)-treated hiCMs and two separate MYOM siRNA-treated hiCMs (sequences 1 and 2). Myofibrils defined as having four or more doublets in a row. N = 3 biological replicates, 117 siCon cells, 90 siMYOM (1) cells, and 100 siMYOM (2) cells. More quantification details can be found in Figure 2—figure supplement 1. (B) Titin doublets per cell in hiCMs from (A). (C) Myofibril persistence length average per cell in hiCMs from (A): N = 3 biological replicates, 74 siCon cells, 68 siMYOM (1) cells, and 70 siMYOM (2) cells (only cells with myofibrils were quantified for C–E and M–N). (D) Average doublet length per cell in hiCMs from (C). (E) Average spacing between doublets per cell in hiCMs from (C). (F) Number of titin precursor rings per cell in hiCMs from (A). (G) Average ring diameter per cell in hiCMs from (A): N = 3 biological replicates, 106 siCon cells, 71 siMYOM (1) cells, and 89 siMYOM (2) cells. (Only cells with rings were quantified for G-H and K, L). (H) Average ring aspect ratio per cell in hiCMs from (G). An aspect ratio of 1 is circular, and higher ratios are elongated. (I) Total number of titin-positive puncta per cell in hiCMs from (A). (J) Average size of all titin-positive puncta per cell in hiCMs from (A). (K) Average distance from the edge of the five closest titin rings, per cell, in hiCMs from (G). (L) Average distance from the edge of all titin rings per cell in hiCMs from (G). (M) Average distance from the edge of the five closest titin doublets, per cell, in hiCMs from (B). (N) Average distance from the edge of all titin doublets within myofibrils per cell in hiCMs from (B). (O) Myofibril orientation relative to the cell edge segment closest to the myofibril center, perpendicularly in hiCMs from (B). N = 3 biological replicates, 361 siCon myofibrils, 561 siMYOM (1) myofibrils, and 667 siMYOM (2) myofibrils. Details of quantification can be found in Figure 2M–O.
Figure 8—figure supplement 3
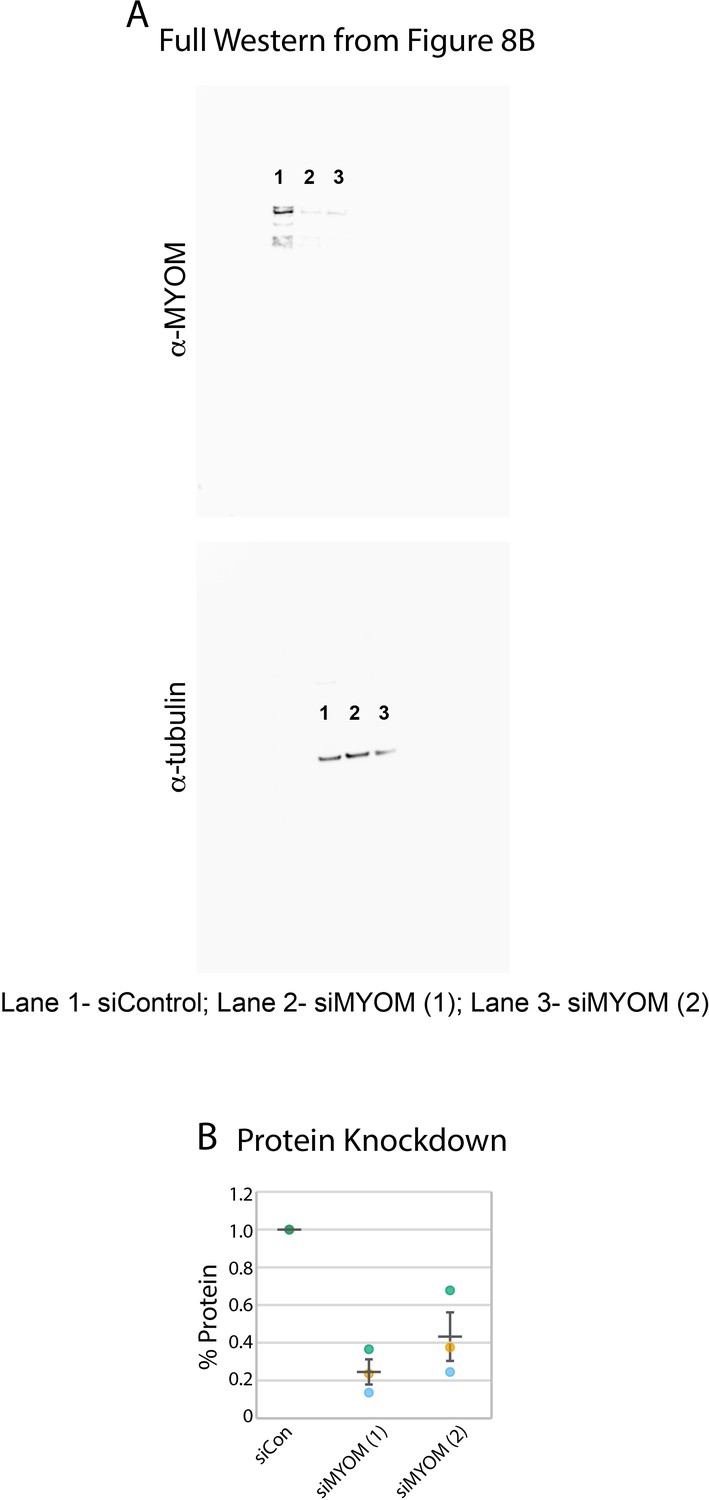
MYOM knockdown western blots.
(A) Full image for the western blots shown in in Figure 8B. Individual lanes are denoted by numbers. Protein knockdown using siRNA targeted to MYOM. Individual lanes are denoted by numbers. (B) Protein knockdown using siRNA targeted to MYH7. N = 3 biological replicates. Anti-MYOM image displayed at 0–50,000 gray levels. Anti-tubulin image displayed at 0–40,000. Full 16 bit images can be found in Figure 8—source data 1 and 2.
Author response image 1

Uncropped images and merges from Figures 2, 4 and 6, respectively.
Tables
Key resources table
| Reagent type (species) or resource | Designation | Source or reference | Identifiers | Additional information |
|---|---|---|---|---|
| Antibody | Anti-alpha actinin 2 (mouse monoclonal) | Sigma | A7811 | IF, 1:200 |
| Antibody | Anti-Titin (mouse monoclonal) | DHSB | 9D10 | IF, 1:2 |
| Antibody | Mouse anti-Myomesin | DHSB | MYOM | IF, 1:2 |
| Antibody | Mouse anti-MYH | DHSB | A4.591 | IF, 1:2 |
| Antibody | Rabbit anti-MYH6 | ProteinTech | 22281-1-AP | WB, 1:500 |
| Antibody | Rabbit anti-MYH7 | ProteinTech | 22280-1-AP | WB, 1:500 |
| Antibody | Goat anti-mouse 488 | Life Technologies | A11001 | IF, 1:100 |
| Antibody | Goat anti-rabbit 488 | Life Technologies | A11034 | IF, 1:100 |
| Antibody | Goat anti-mouse 568 | Life Technologies | A11004 | IF, 1:100 |
| Antibody | Goat anti-rabbit 568 | Life Technologies | A11036 | IF, 1:100 |
| Antibody | Goat anti-mouse 647 | Life Technologies | A32728 | IF, 1:100 |
| Antibody | Goat anti-rabbit 647 | Life Technologies | A32733 | IF, 1:100 |
| Biological sample (Bos taurus) | Bovine serum albumin | RPI | A30075-100 | |
| Chemical compound, drug | Phalloidin Alexa Fluor 488 | Invitrogen | A12379 | |
| Chemical compound, drug | Phalloidin Alexa Fluor 568 | Invitrogen | A12380 | |
| Chemical compound, drug | Phalloidin Alexa Fluor 647 | Invitrogen | A22287 | |
| Chemical compound, drug | PBS, 10×, Ca2+/Mg2+ free | Life Technologies | 70011-044 | |
| Chemical compound, drug | PBS, 10×, with Ca2+/Mg2+ | Corning | 46-013CM | |
| Chemical compound, drug | PFA, 16% | Electron Microscopy Sciences | 15710 | |
| Chemical compound, drug | 0.5% Trypsin | Life Technologies | 15400-054 | |
| Chemical compound, drug | 0.1% Gelatin | Sigma | ES-006-B | |
| Chemical compound, drug | Dimethyl sulfoxide | Sigma | 276855 | |
| Chemical compound, drug | Vectashield with DAPI | Vector | H-1200 | |
| Chemical compound, drug | Blebbistatin | Sigma | B0560 | |
| Chemical compound, drug | Fibronectin | Corning | 354008 | |
| Chemical compound, drug | Lipofectamine RNAiMAX | Thermo Fisher | LMRNA015 | |
| Chemical compound, drug | TBS, 10× | Corning | 46-012CM | |
| Chemical compound, drug | Tween 20 | Sigma | P7949 | |
| Cell line (Homo sapiens) | iCell cardiomyocytes^2 kit | Fujifilm International | CMC-100-012-000.5 | |
| Sequence-based reagent | SMART Pool siRNA against human MYH7 (13–16) | Horizon Discovery | A-011086 | |
| Sequence-based reagent | SMART Pool siRNA against human MYH7 (13, 14) | Horizon Discovery | A-011086-13, A-011086-14 | |
| Sequence-based reagent | siRNA against human MYH6 3’ UTR (13) | Horizon Discovery | A-012645-13-0005 | |
| Sequence-based reagent | siRNA against human MYH6 CDS (14) | Horizon Discovery | A-012645-14-0005 | |
| Sequence-based reagent | siRNA against human myomesin 3’UTR (13) | Horizon Discovery | A-006342-13-0005 | |
| Sequence-based reagent | siRNA against human myomesin CDS (16) | Horizon Discovery | A-006342-16-0005 | |
| Software, algorithm | FIJI | NIH | ||
| Software, algorithm | sarcApp | This study | ||
| Software, algorithm | yoU-Net | This study |
Additional files
Download links
A two-part list of links to download the article, or parts of the article, in various formats.
Downloads (link to download the article as PDF)
Open citations (links to open the citations from this article in various online reference manager services)
Cite this article (links to download the citations from this article in formats compatible with various reference manager tools)
Independent regulation of Z-lines and M-lines during sarcomere assembly in cardiac myocytes revealed by the automatic image analysis software sarcApp
eLife 12:RP87065.
https://doi.org/10.7554/eLife.87065.3


