Structural and functional properties of the transporter SLC26A6 reveal mechanism of coupled anion exchange
- Department of Biochemistry, University of Zurich, Switzerland
- Department of Chemistry, Loughborough University, United Kingdom
Figures
Figure 1 with 1 supplement
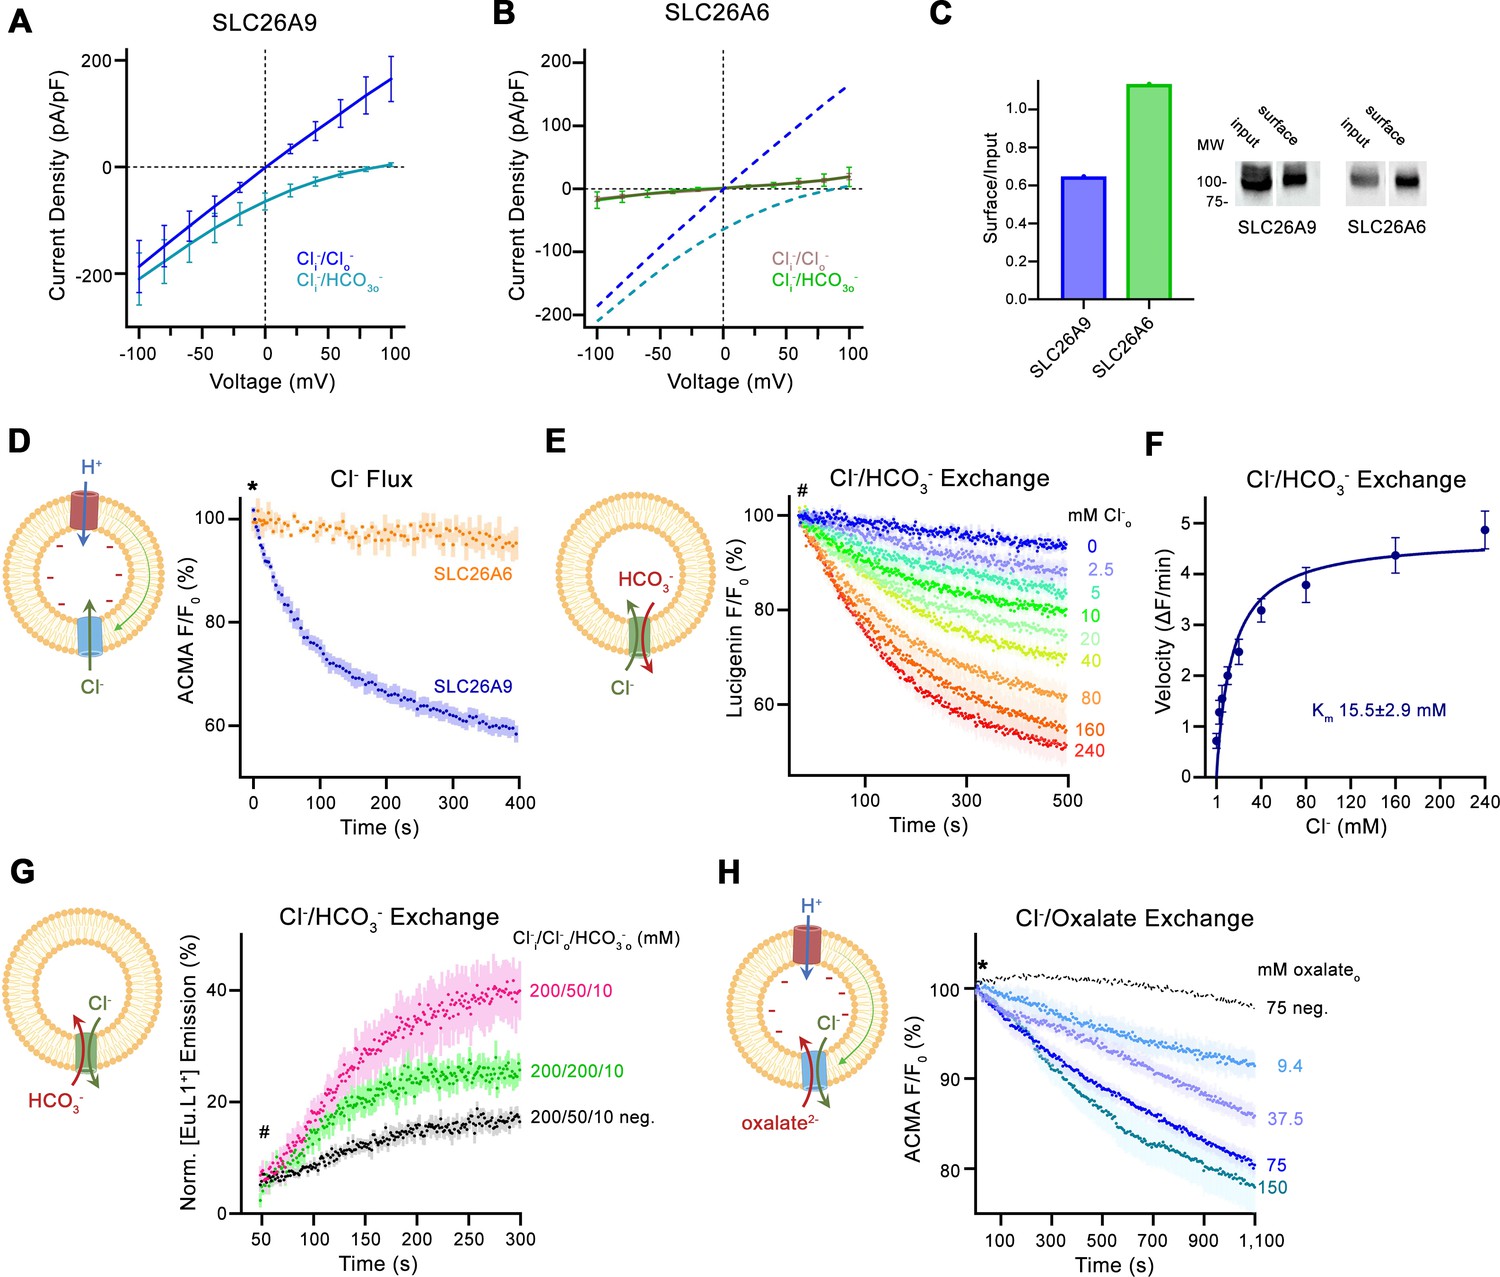
Transport properties of SLC26A6.
(A) Current-Voltage relationships of HEK 293 cells expressing murine SLC26A9 and (B) human SLC26A6. Data were recorded in the whole-cell configuration in symmetric (150 mM) Cl- concentrations and asymmetric conditions with equimolar (150 mM) concentrations of intracellular Cl- and extracellular HCO3-. Values show mean of independent experiments (SLC26A9 Cl-/Cl- n=6, Cl-/ HCO3-, n=6; SLC26A6 Cl-/Cl- n=6, Cl-/ HCO3-, n=6). Dashed lines in (B) correspond to SLC26A9 data displayed in (A). (C) Protein expression at the surface of HEK cells determined by surface biotinylation. Ratio of biotinylated (right) over total protein (left) as quantified from a Western blot against a myc-tag fused to the C-terminus of the respective constructs. (D) Uncoupled Cl- transport mediated by either the modified murine construct SLC26A9T or SLC26A6 reconstituted into proteoliposomes, as monitored by the fluorescence change of the pH gradient-sensitive fluorophore ACMA. Traces show mean of seven and three replicates from two independent reconstitutions for SLC26A9T and SLC26A6. (E) Coupled Cl-/HCO3- exchange monitored by the time- and concentration-dependent quenching of the fluorophore lucigenin trapped inside proteoliposomes containing SLC26A6. Traces show mean of six independent experiments from two reconstitutions. (F) Cl- concentration dependence of transport. Initial velocities were obtained from individual measurements displayed in (E), the solid line shows a fit to the Michaelis Menten equation with an apparent Km of 16 mM. (G) Coupled Cl-/HCO3- exchange monitored by the time- and concentration-dependent luminescence increase of the HCO3-selective probe [Eu.L1+] trapped inside proteoliposomes containing SLC26A6. Traces show mean of five independent experiments from three reconstitutions. ‘neg.’ refers to mock liposomes. (E, G), Hashtag indicates addition of the assayed anion. (H) Electrogenic oxalate uptake followed by the fluorescence change of the pH gradient sensitive fluorophore ACMA. Traces show mean quenching of ACMA fluorescence in a time- and concentration-dependent manner for SLC26A6 proteoliposomes with outside oxalate concentrations of 9.4 mM (n=3), 37.5 mM (n=5), 75 mM (n=6), 150 mM (n=8, all from two independent reconstitutions). Neg. refers to mock liposomes assayed upon addition of 75 mM oxalate as defined in Figure 1—figure supplement 1G. (D, H), Asterisk indicates addition of the H+ ionophore CCCP, which allows counterion movement and electrogenic Cl– transport to proceed. (A, B, D–H), errors are s.e.m. (D, E, G, H) Scheme of the respective assay is shown left.
-
Figure 1—source data 1
Electrophysiology, liposomal transport assay data and western blot.
- https://cdn.elifesciences.org/articles/87178/elife-87178-fig1-data1-v1.xlsx
Figure 1—figure supplement 1
Transport data.
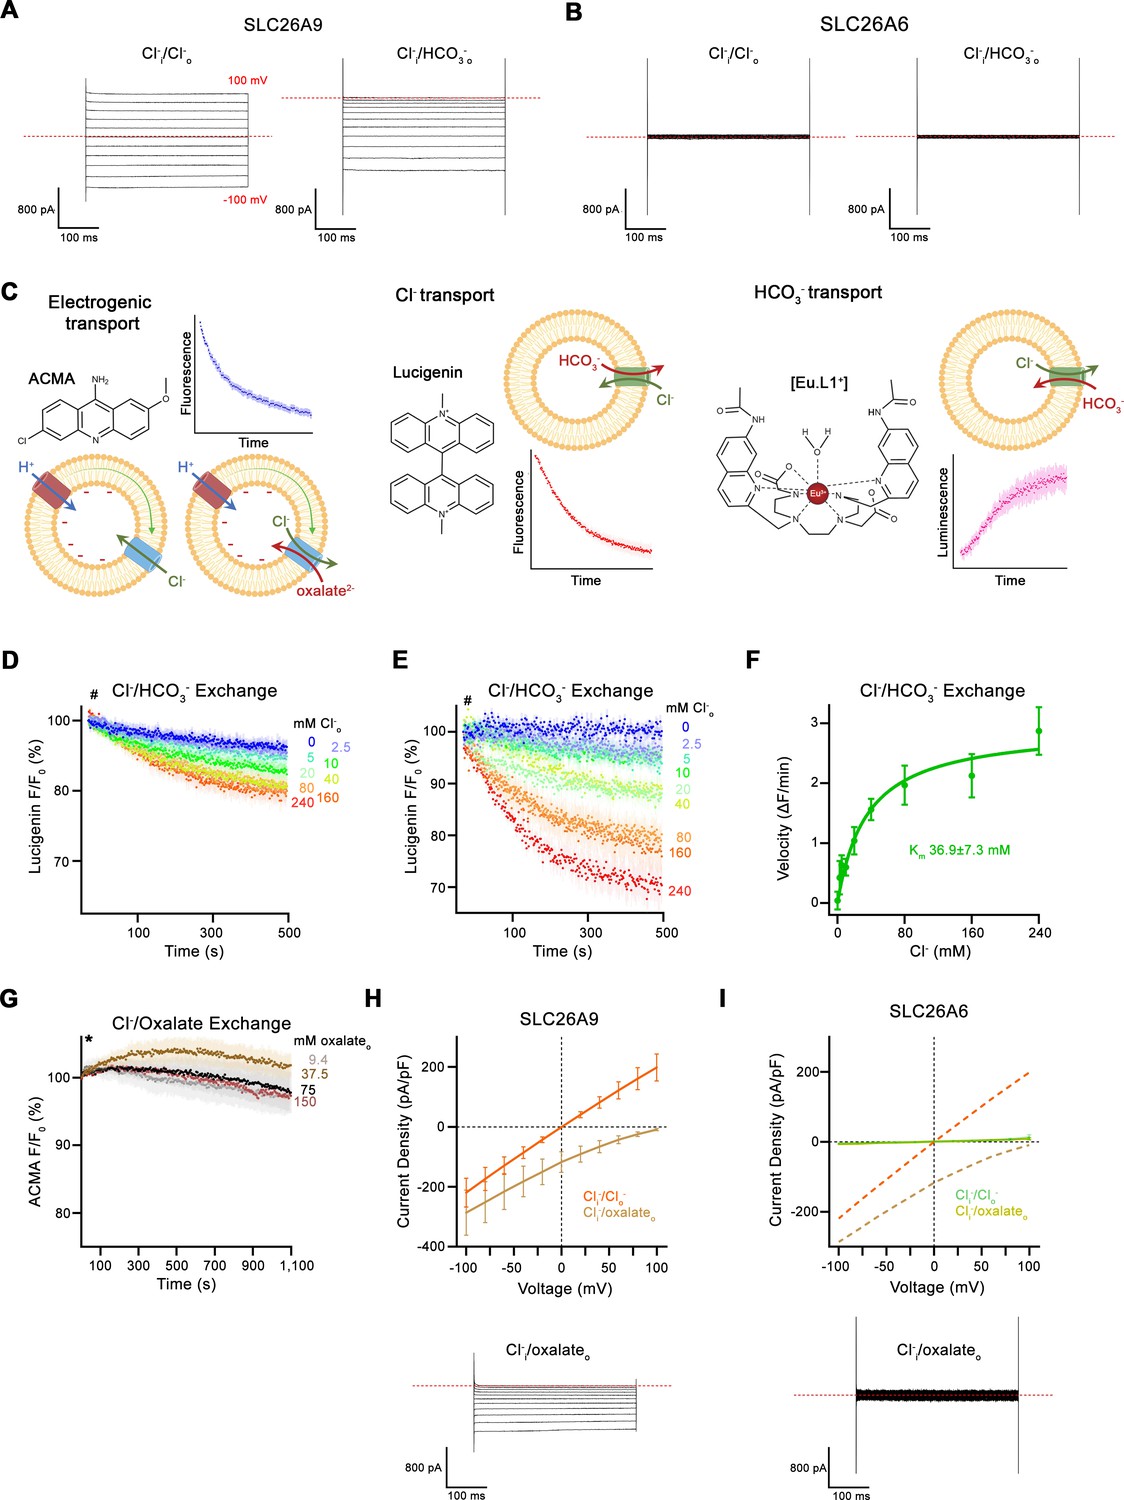
(A, B) Representative whole-cell recordings of HEK293 cells expressing murine SLC26A9 (A) or human SLC26A6 (B) recorded by a step protocol. (C) Proteoliposome-based ion transport assays used in this study. Left, electrogenic uncoupled Cl- flux or coupled Cl-/oxalate exchange assayed by the decrease of the fluorescence of the pH-sensitive fluorophore ACMA that is caused by the associated influx of H+ mediated by the protonophore CCCP to dissipate the membrane potential. Center, electroneutral Cl-/HCO3- exchange assayed by the quenching of the Cl- selective fluorophore lucigenin as a consequence of the influx of Cl-. Right, Influx of HCO3- into proteoliposomes as a consequence of electroneutral Cl-/HCO3- exchange, assayed by the luminescence increase of the HCO3- selective probe [Eu.L1+]. Shown are 2D-chemical structures of the respective probes, schemes of the direction of transport and example traces of the measured signals. (D) Time- and concentration-dependent quenching of the fluorophore lucigenin trapped inside mock liposomes not containing any protein determining the non-specific background for experiments displayed in Figure 1E. Data show average of six experiments. (E) Background-subtracted traces of the quenching of lucigenin by Cl- as a consequence of coupled Cl-/HCO3- exchange displayed in Figure 1E. Data show mean of six independent experiments from two reconstitutions. (D, E), Hashtag indicates addition of the assayed anion. (F) Cl- concentration dependence of transport. Initial velocities were obtained from background-corrected individual measurements and the solid line shows a fit to the Michaelis Menten equation with an apparent Km of 37 mM displayed in (E). (G) Time- and concentration-dependent change of the fluorescence of the pH-gradient-sensitive fluorophore ACMA upon addition of indicated concentrations of oxalate to the outside of mock liposomes not containing any protein. The traces serve as negative controls for the experiments displayed in Figure 1H. Traces show mean of four to five independent experiments. Asterisk indicates addition of CCCP. (H) Current-Voltage relationships of HEK 293 cells expressing murine SLC26A9 and (I) human SLC26A6. Data were recorded in the whole-cell configuration in symmetric (150 mM) Cl- concentrations and asymmetric conditions with equimolar (150 mM) concentrations of intracellular Cl- and extracellular oxalate. Values show mean of independent experiments (SLC26A9 Cl-/Cl- n=4, Cl-/oxalate, n=4; SLC26A6 Cl-/Cl- n=3, Cl-/oxalate, n=4). Representative current traces recorded in asymmetric Cl-/oxalate conditions are shown below. Dashed lines in (I) correspond to SLC26A9 data displayed in (H). (A, B, H, I) Dashed lines in recordings indicates 0 pA. (D–I), Errors are s.e.m.
-
Figure 1—figure supplement 1—source data 1
Extended electrophysiology and liposomal transport assay data.
- https://cdn.elifesciences.org/articles/87178/elife-87178-fig1-figsupp1-data1-v1.xlsx
Figure 2 with 3 supplements
SLC26A6 structure.
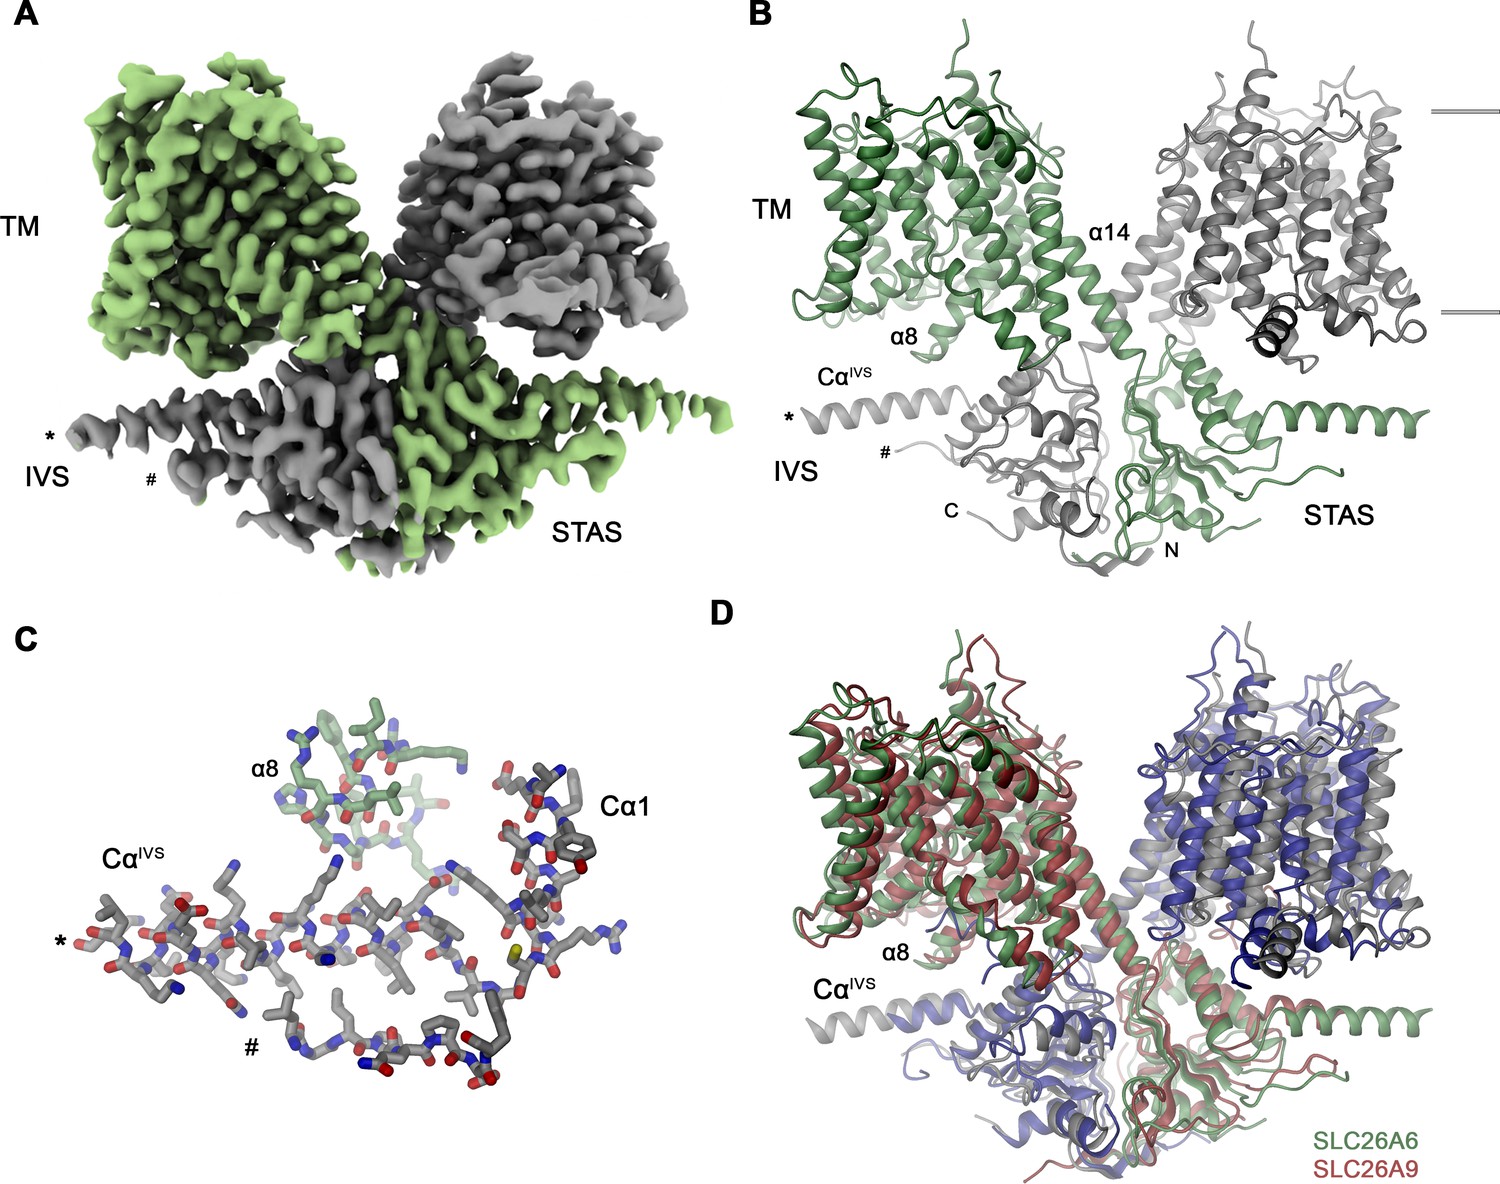
(A) Cryo-EM density of the SLC26A6 dimer at 3.28 Å and (B) ribbon representation of the model in the same orientation. Subunits are shown in unique colors and selected structural elements are labeled. The membrane boundary is indicated. (C) Interaction region between the loop proceeding α8 of the core domain and the helix CαIVS of the adjacent subunit. (A–C) Start (*) and end (#) of the disordered region of the IVS are indicated. (D) Ribbon representation of the superimposed SLC26A6 (green, gray) and SLC26A9 (red, blue, PDBID: 7CH1) dimers.
Figure 2—figure supplement 1
Cryo-EM reconstruction of SLC26A6.
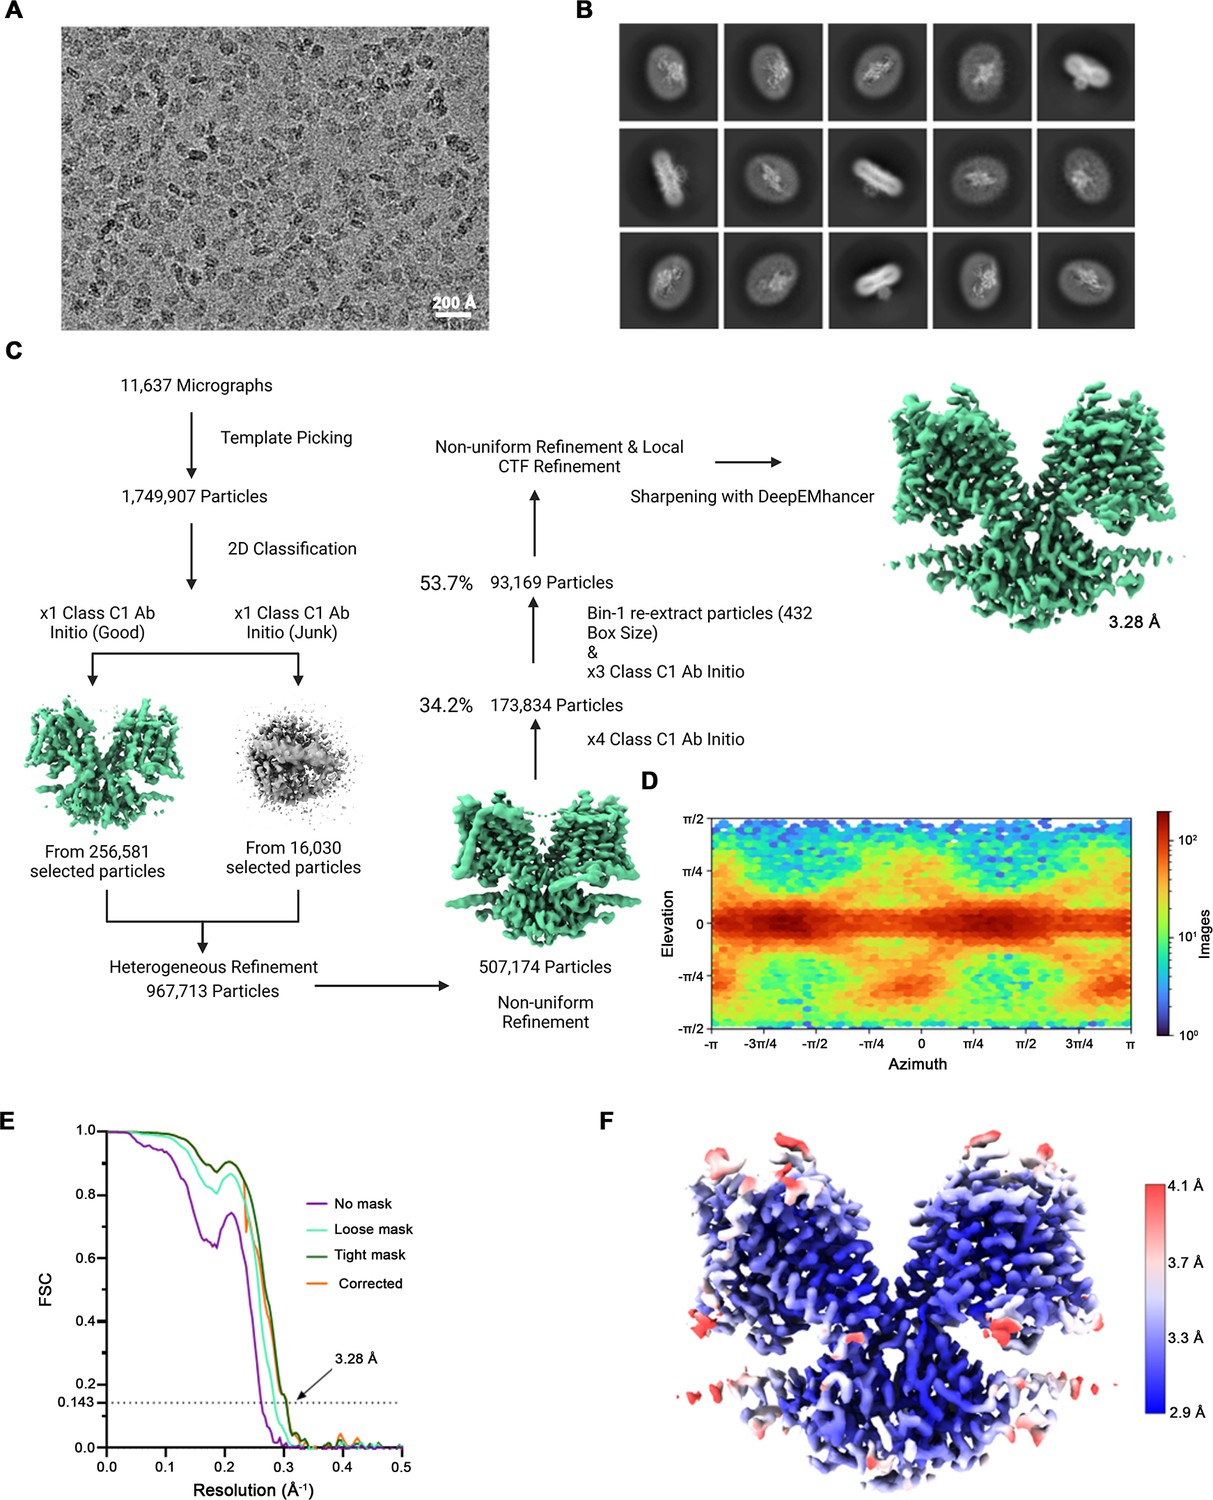
(A) Representative micrograph (of a total of 11,637) of the SLC26A6 dataset. (B) 2D class averages of SLC26A6. (C) Data-processing workflow. Particles were extracted and subjected to 2D classification, and the obtained 2D class averages were subsequently used as templates for particle picking. After extraction, the new set of particles was subjected to a second round of 2D classification. Based on 2D class averages, particles were selected for an ab initio reconstruction. A generated reconstruction displaying protein features (green) and a ‘decoy’ reconstruction lacking such features (grey) were both used for several rounds of heterogenous refinement, followed by non-uniform refinement. Two additional multi-class ab initio reconstructions were performed for further sorting prior to non-uniform refinement and local CTF refinement yielding a map at 3.28 Å resolution. (D) Heatmap displaying the angular distribution of particle orientations. (E) FSC plot of cryo-EM density maps of the SLC26A6 complex used for the estimation of its resolution. The dotted line indicates the resolution at which the FSC drops below the 0.143 threshold. (F) Final 3D reconstruction colored according to the local resolution.
Figure 2—figure supplement 2
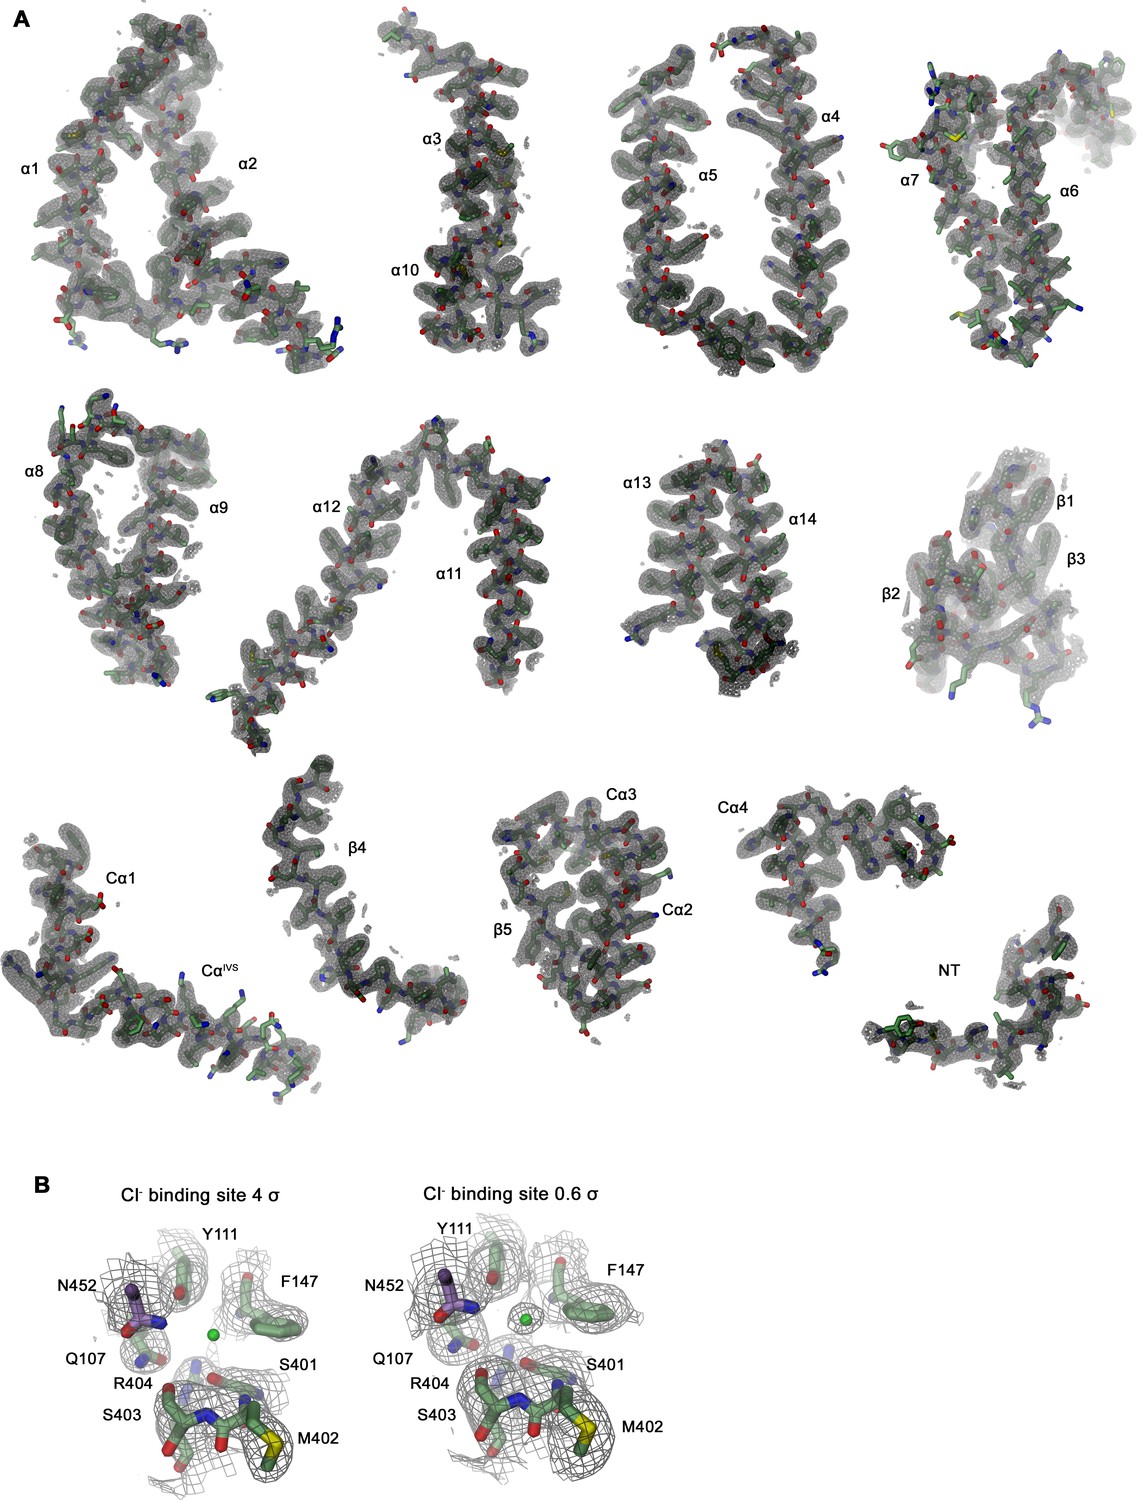
Section of the cryo-EM density of SLC26A6.
(A) Cryo-EM density at 3.28 Å (contoured at 4σ) superimposed on indicated parts of the model. (B) Cryo-EM density surrounding the ion binding site at high (4 σ, left) and low (0.6 σ, right) contour surrounding displayed residues. Residual density at low contour defines the position of a bound Cl- ion (green sphere).
Figure 2—figure supplement 3
Sequence and Topology.
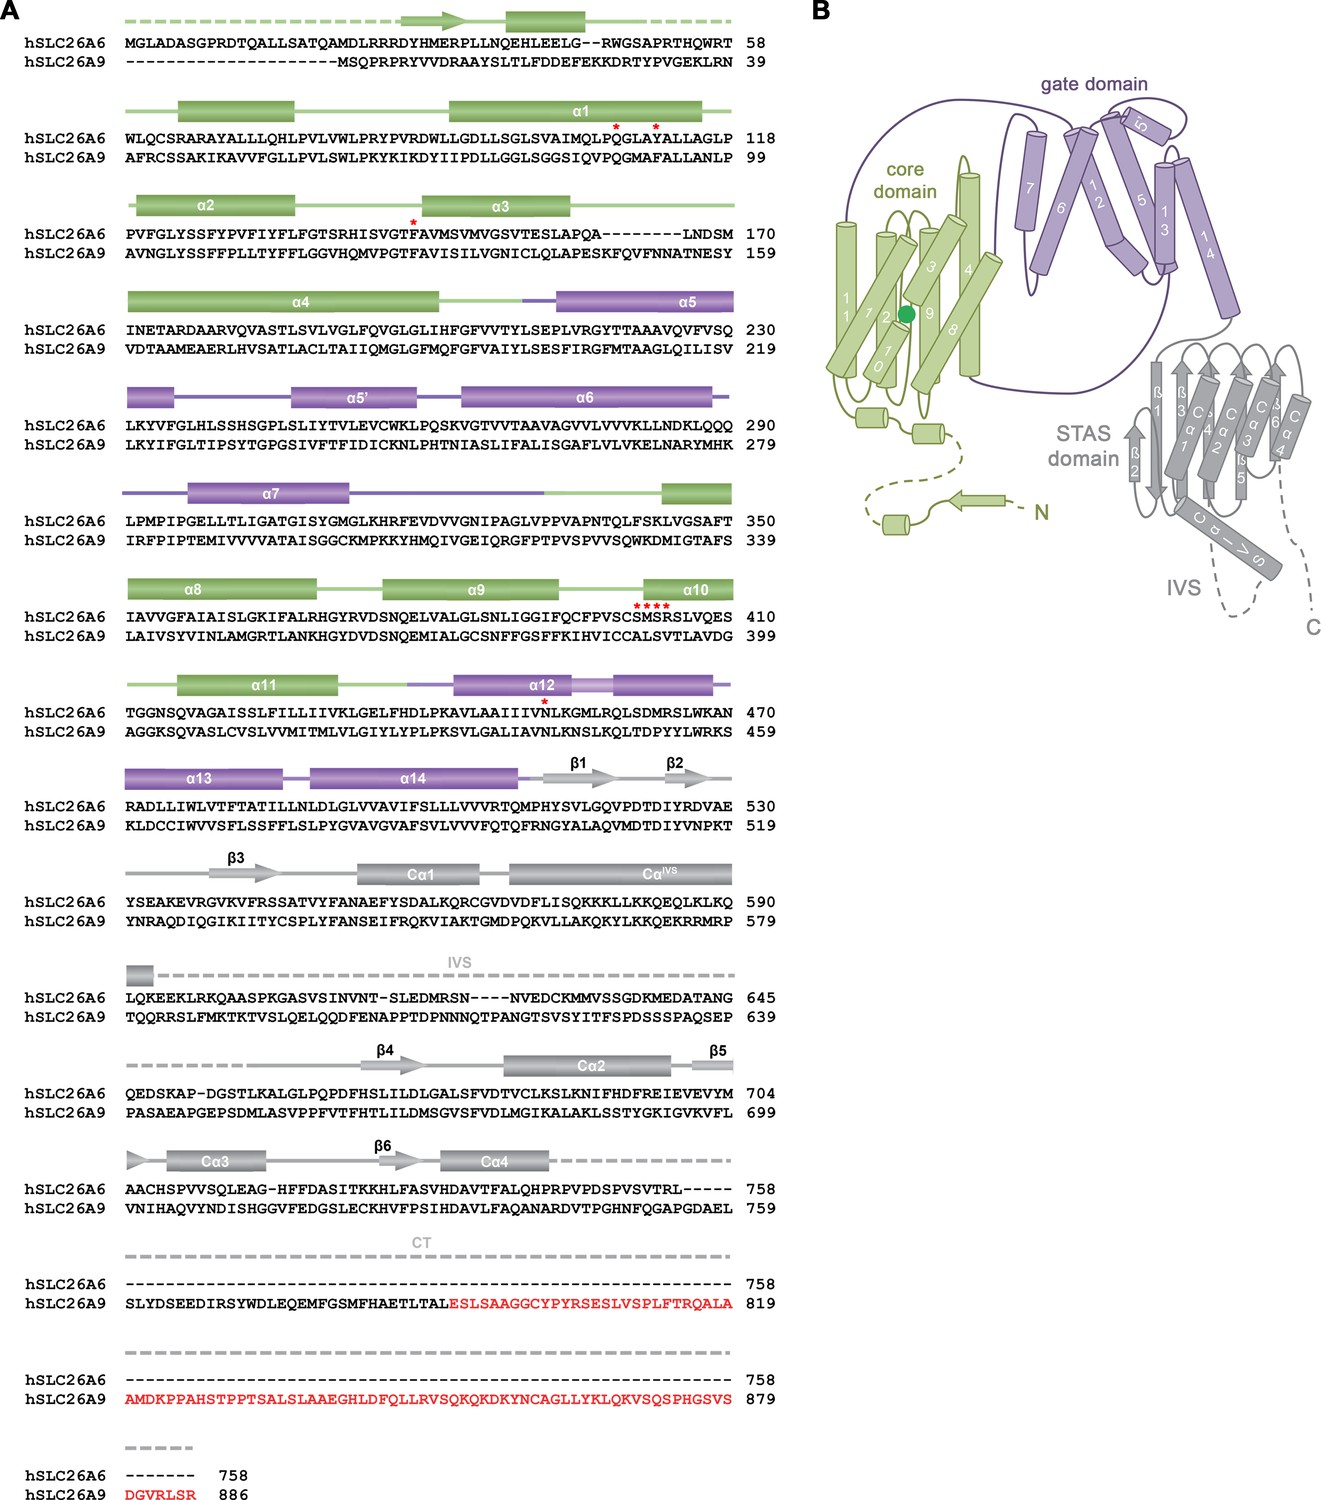
(A) Sequence alignment of the human proteins SLC26A6 (isoform 3, NCBI reference sequence: NP_602298.2) and SLC26A9 (isoform b, NCBI reference sequence: NP_599152.2). Secondary structure elements of SLC26A6 are indicated above, regions not defined in the structure are shown as dashed lines. An extension at the C-terminus of SLC26A9 of isoform b compared to isoform a, which was shown to bind to the cavity leading to the anion binding site in the inward-facing conformation of the transporter (PDBID: 7CH1) is highlighted in red. Residues surrounding the bound ion in SLC26A6 are indicated by red asterisks. (B) Topology of the SLC26A6 subunit. The different domains of the transporter are labeled.
Figure 3 with 1 supplement
SLC26A6 TM domain.
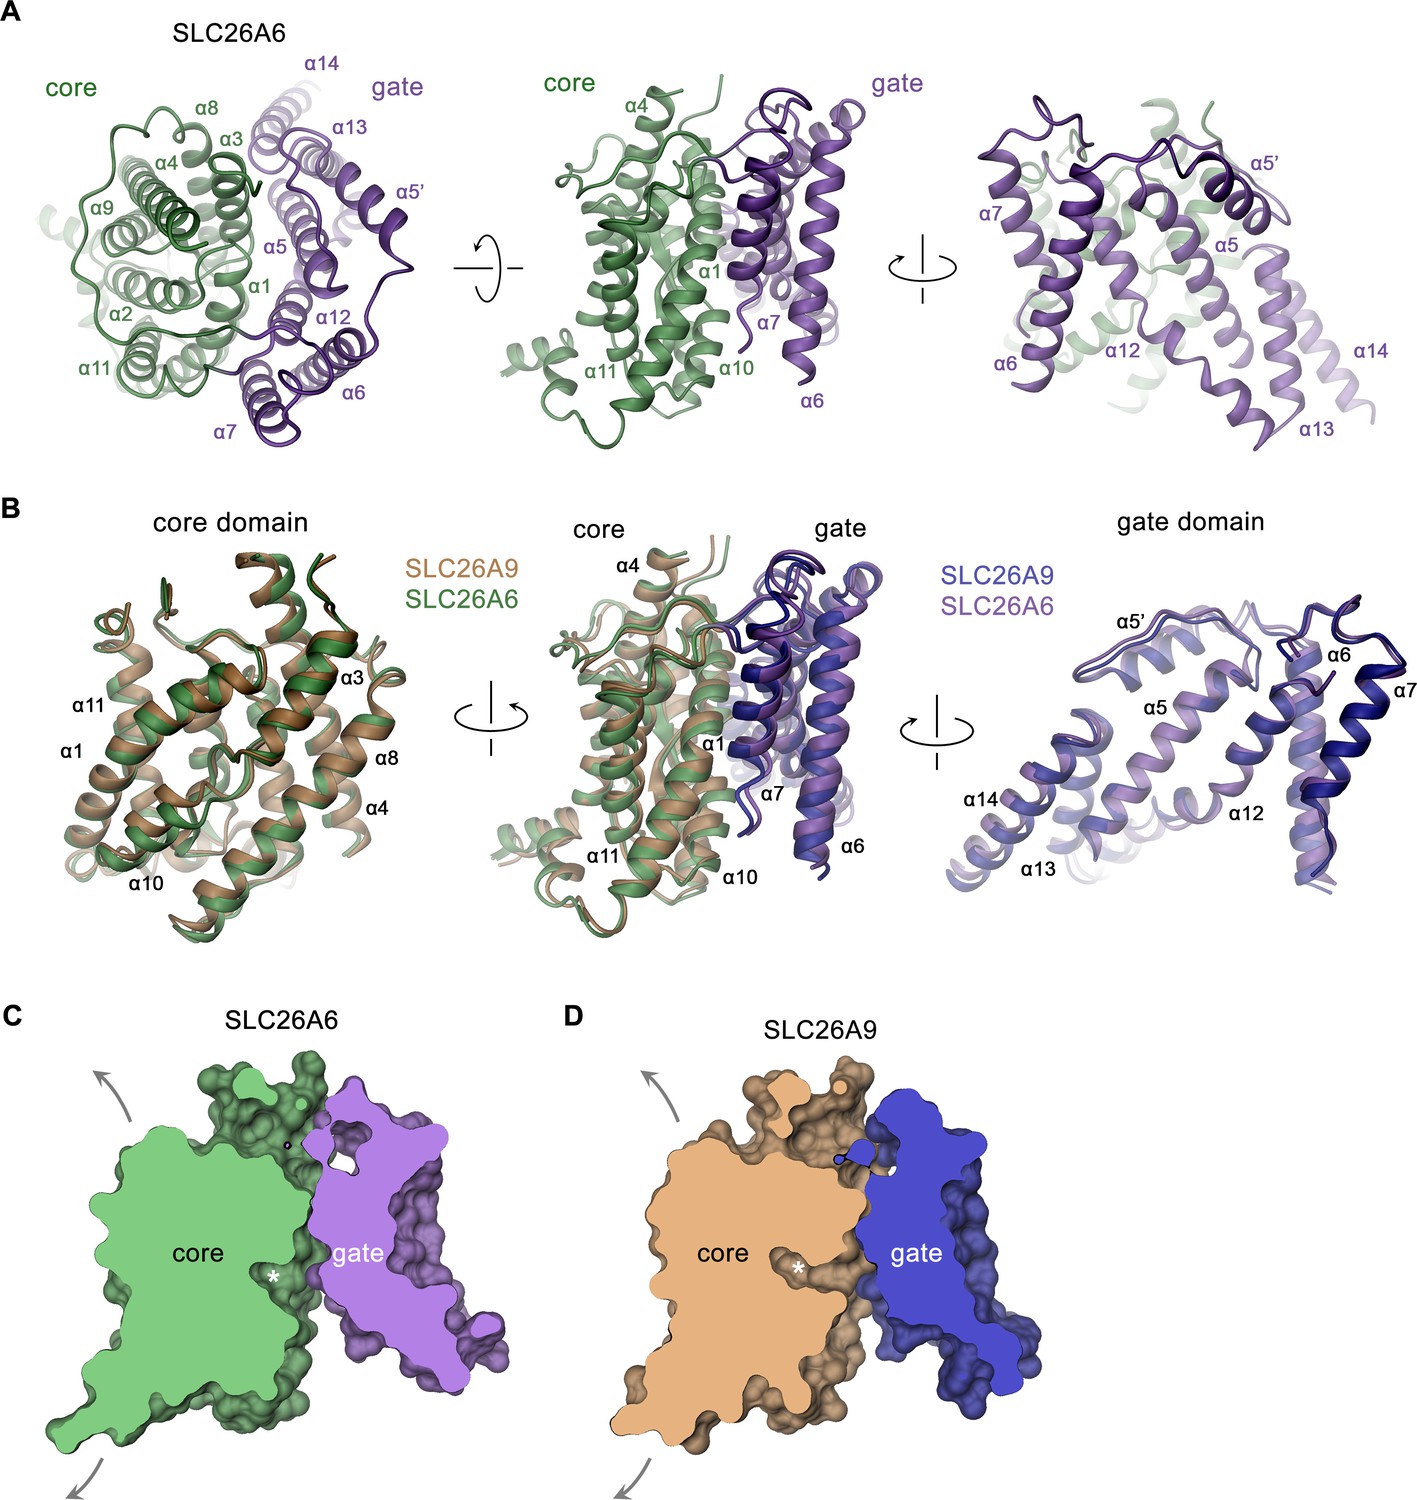
(A) Ribbon representation of the TM unit of SLC26A6 in indicated orientations (left, view is from the outside, center and right, from within the membrane). Core and gate domains are colored in green and violet, respectively. Selected secondary structure elements are labeled. (B) Superposition of elements of the TM between SLC26A6 and SLC26A9 (PDBID: 7CH1). Left, core domains, center, TMs, right, gate domains. Core and gate domains of SLC26A9 are colored in orange and blue, respectively. The view is from within the membrane with relative orientations indicated. (C, D) Slice across a surface of the TM domains of SLC26A6 (C) and SLC26A9 (D) viewed from within the membrane. The spacious aqueous cavity leading to the ion binding site from the cytoplasm is evident. Asterisk indicated the position of the transported ion. Arrows indicate possible movements of the core domain.
Figure 3—figure supplement 1

TM domain features.
(A, B) Open book representation of the molecular surfaces of the TM (left) and its gate (center) and core domain (right) of SLC26A6 (A) and SLC26A9 (B). The coloring refers to the area contacted by the other domain. The position of the bound ion is indicated as green sphere. (C) Molecular surface of the SLC26A6 dimer with gate and STAS domains colored in violet and the core domains in green. (D) Schematic depiction of slices across core and gate domains in the observed inward (left) and a hypothetical outward-facing conformation (right). (C, D) Arrows indicate movements of the mobile core domain. (A–D) Membrane boundaries are indicated.
Figure 4 with 1 supplement
Features of the substrate binding site.
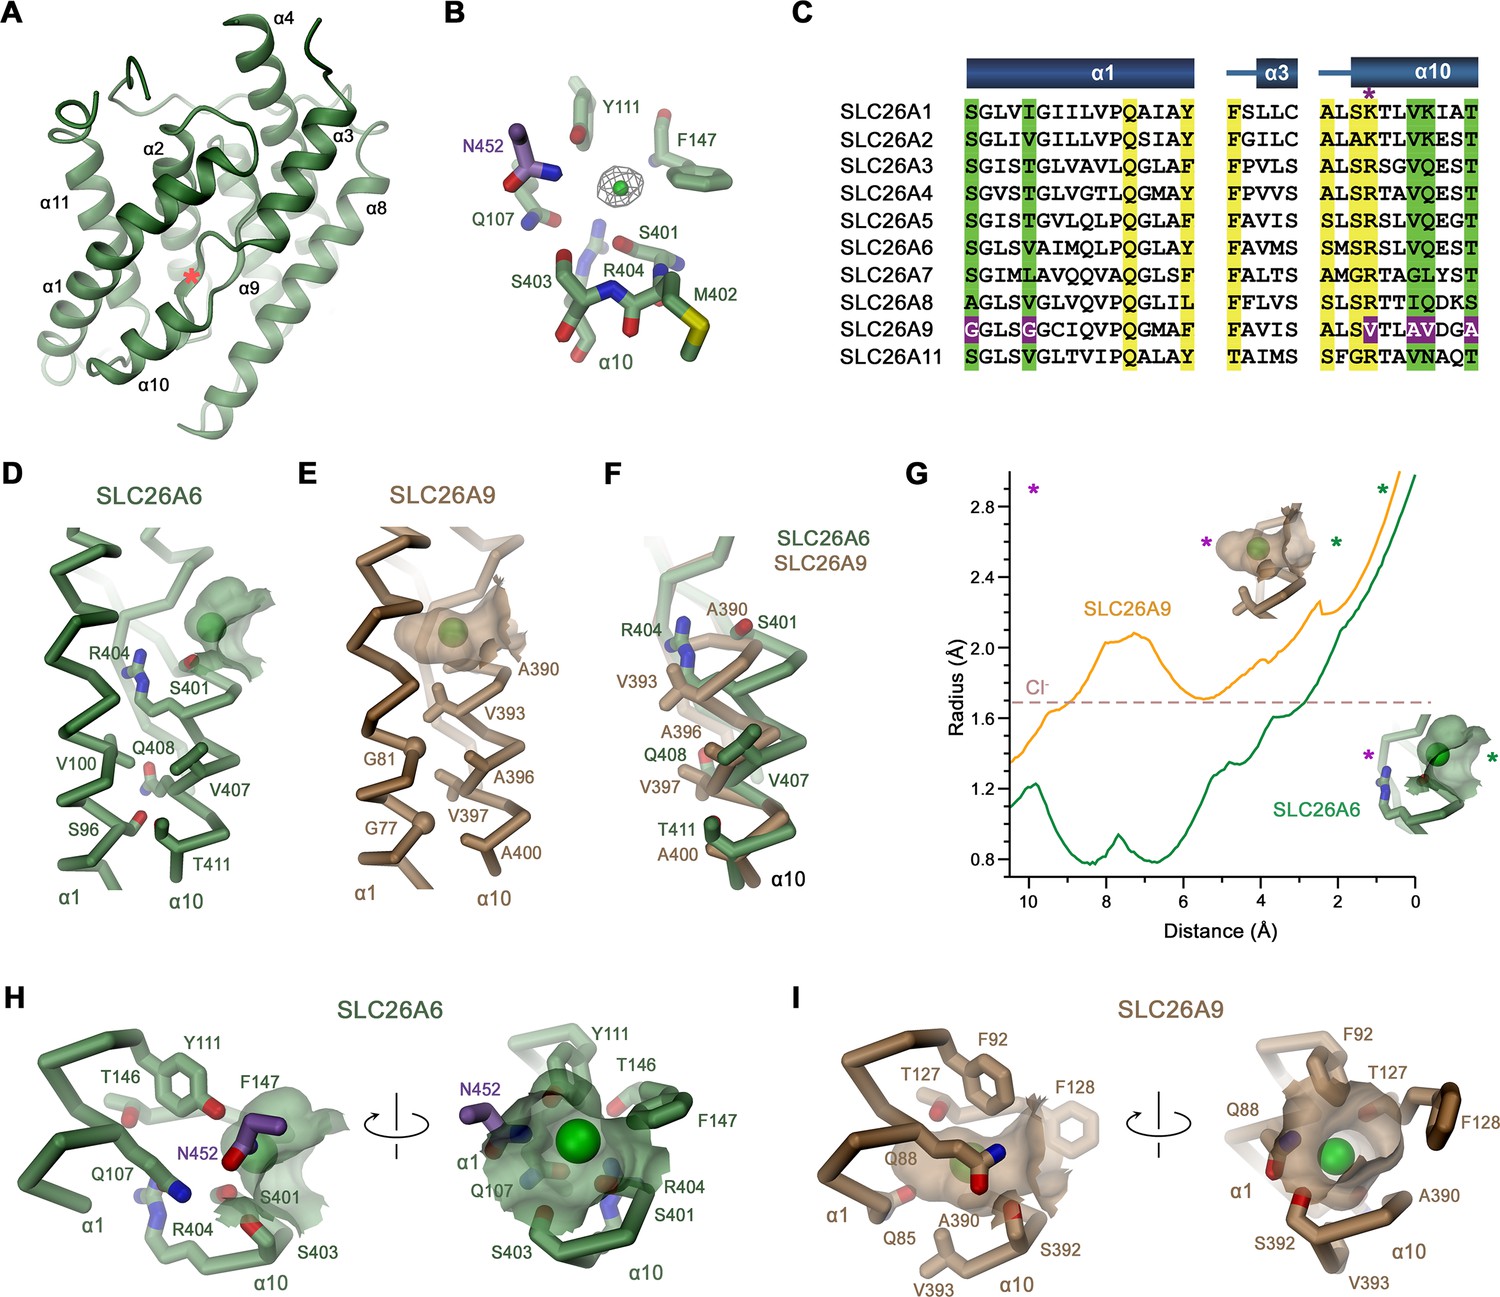
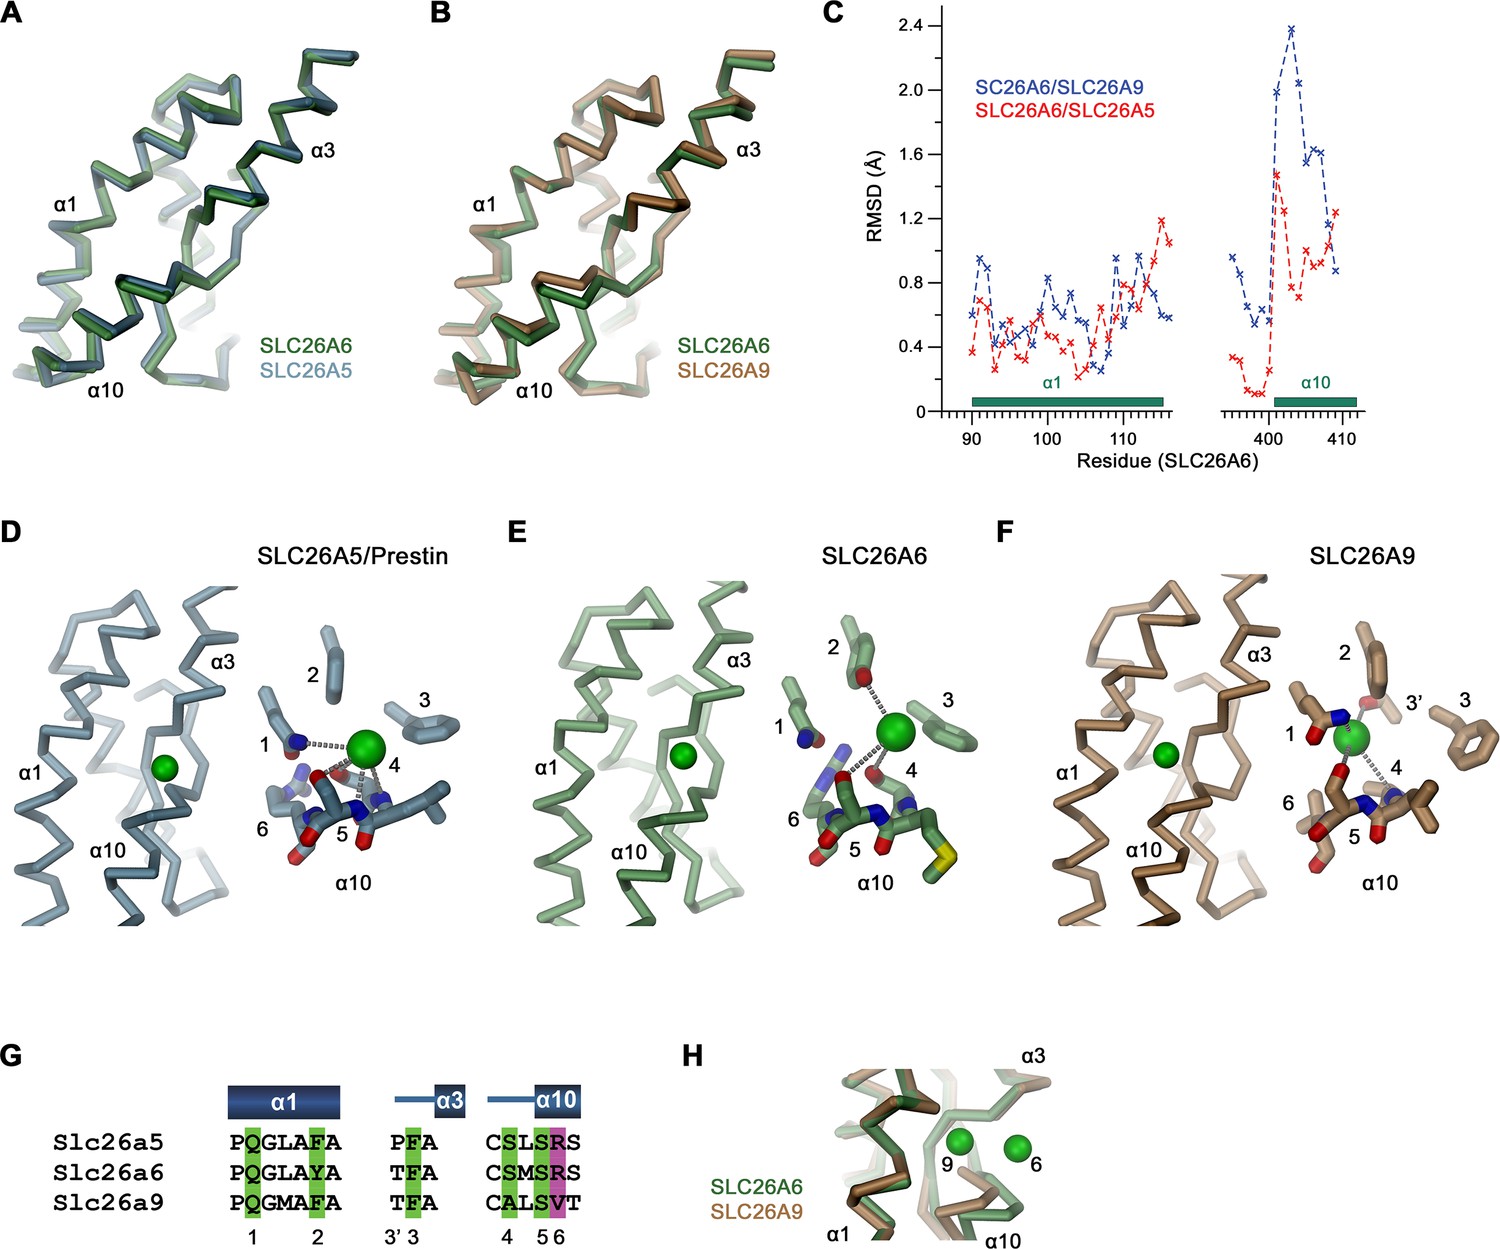
(A) Ribbon representation of the core domain of SLC26A6 viewed from within the membrane from the gate domain. Asterisk indicates the location of the ion binding site, selected secondary structure elements are labeled. (B) Ion binding site with the density of a bound Cl- ion (green) displayed as mesh. (C) Sequence alignment of the region constituting the ion binding site of the ten functional human SLC26 paralogs. Conserved residues in the contact region between α1 and α10 are highlighted in green, residues involved in ion interactions in yellow. Deviating residues in SLC26A9 are highlighted in violet. Asterisk marks position that harbors a basic residue in all family members except for SLC26A9, where the residue is replaced by a valine. Whereas most paralogs, including the ones operating as HCO3- exchangers, carry an arginine at this site, the sulfate transporters SLC26A1 and 2 contain a smaller lysine. Secondary structure elements are shown above. (D, E) Cα-representation of the contact region between α1 and α10 of (D) SLC26A6 and (E) SLC26A9 (PDBID: 7CH1). (F) α10 of both transporters obtained from a superposition of the core domains. (D–F) Side chains of residues of the contact region and selected residues of the binding site are shown as sticks. (G) Size of the substrate cavity of SLC26A6 and SLC26A9 as calculated with HOLE (Smart et al., 1996). The radius of the substrate cavity of either protein is mapped along a trajectory connecting a start position at the entrance of each cavity (distance 0 Å) and an end position located outside of the cavity in the protein region (distance 10 Å). Both points are defined by asterisks in insets showing the substrate cavities for either transporter and they are indicated in the graph (green, cavity entrance towards the aqueous vestibule; violet, protein region). (H, I) Ion binding sites of SLC26A6 (H) and SLC26A9 (I). The relative orientation of views is indicated. (D, E, H, I) The position of bound ions was inferred as detailed in Figure 1. The molecular surface surrounding the bound ions is displayed. Side chains of interacting residues are shown as sticks.
Figure 4—figure supplement 1
Binding site comparisons.
(A, B) Superposition of secondary structure elements constituting the ion binding site of SLC26 transporters. (A) Comparison between SLC26A6 and SLC26A5 and (B) SLC26A9. (C) Positional difference between Cα-atoms in of the superpositions shown in (A, B). Whereas α1 is very similar in all three paralogs, the position of α10 differs between SLC26A6 and SLC26A9. (D–F) Ion interactions in (D) SLC26A5 (PDBID: 7LGU) and (E) SLC26A6 as defined in the respective datasets. (F) The Cl- position in SLC26A9 was derived from residual density in the dataset of the map associated with PDBID 7CH1 (EMD-30368), which was assigned to a water molecule in the structure. (D–F) Shown is the location of the ion in a Cα-trace of the binding site (left) and a close-up of the binding site with presumable interactions to close-by groups indicated by dashed lines. (G) Alignment of residues in the interaction region of the three paralogs. (D–G) Numbers refer to equivalent positions shown in the alignment. ‘6’ indicates the position which contains a basic residue in all family members except for SLC26A9. (H) Difference in the position of a bound ion between SLC26A6 (6) and SLC26A9 (9) obtained from a superposition of the binding regions.
Figure 5
Functional properties of a structure based SLC26A6 construct.
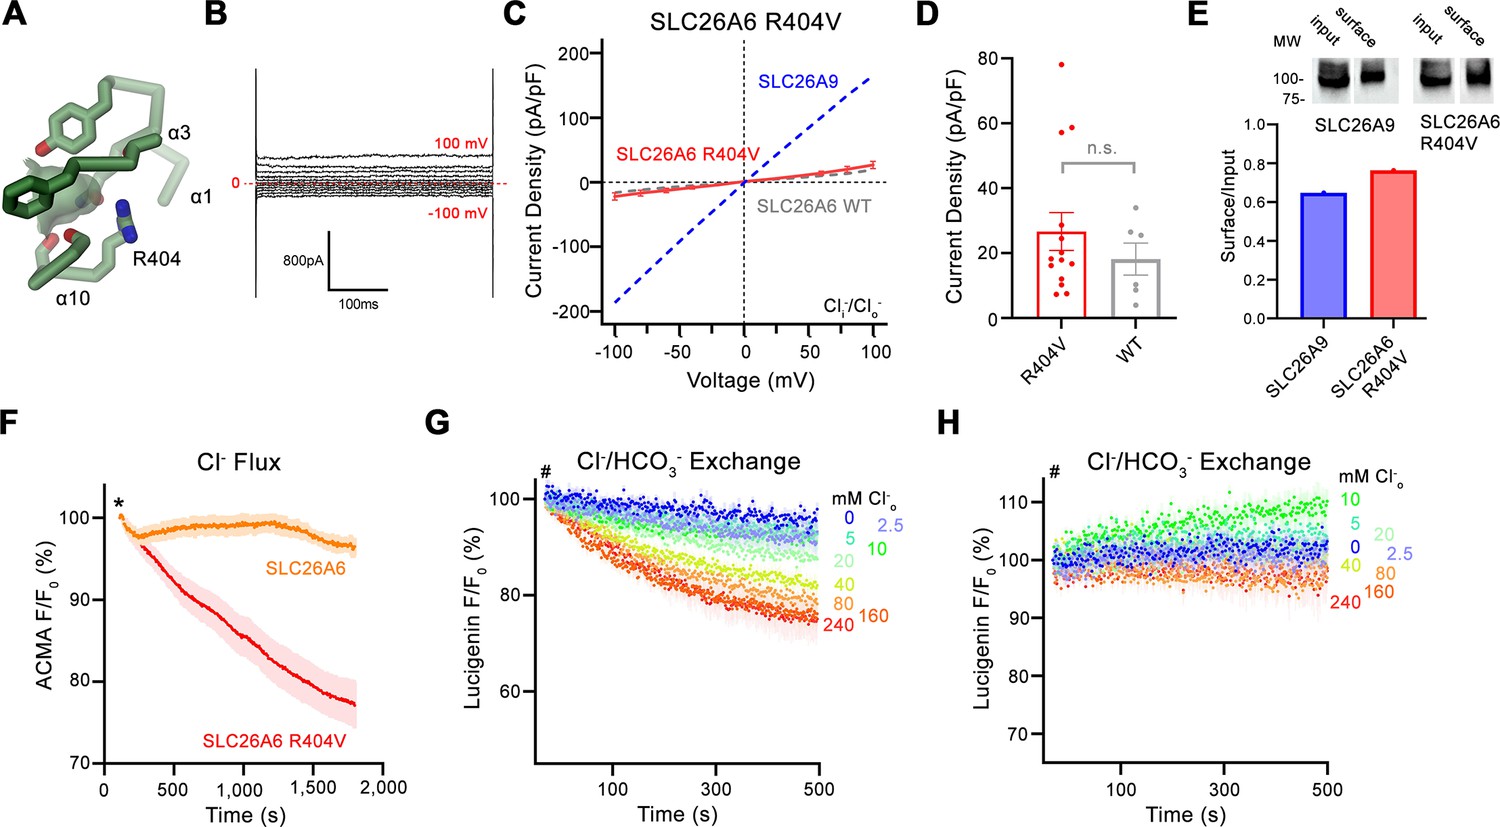
(A) SLC26 ion binding site showing surrounding residues including Arg 404. (B) Representative current trace and (C) current-voltage relationships of HEK 293 cells expressing the SLC26A6 mutant R404V. Data were recorded in the whole-cell configuration at symmetric (150 mM) Cl- concentrations. Values show mean of 14 independent experiments. Dashed lines correspond to SLC26A9 (blue) and SLC26A6 data (grey) displayed in Figure 1A and B. (D) Average current densities of the SLC26A6 mutant R404V (n=14) and SLC26A6 WT (n=6). Values show currents recorded at 100 mV as displayed in C and Figure 1B. Although the currents were consistently larger for the mutant R404V, the difference is not statistically significant (p=0.69). (E) Protein expression of SLC26A6 R404V and SLC26A9 at the surface of HEK cells determined by surface biotinylation. Ratio of biotinylated (right) over total protein (left) as quantified from a Western blot against myc-tag fused to the C-terminus of the respective constructs. (F) Uncoupled Cl- transport mediated by SLC26A6 R404V reconstituted into proteoliposomes, as monitored by the fluorescence change of the pH gradient-sensitive fluorophore ACMA. Traces of SLC26A6 are shown for comparison. Data shows mean of five replicates from two independent reconstitutions for both constructs. (G, H) Coupled Cl-/HCO3- exchange by the SLC26A6 mutant R404V monitored by the time- and concentration- dependent quenching of the fluorophore lucigenin trapped inside proteoliposomes. (G) Uncorrected traces and (H) traces corrected by the background obtained from empty liposomes displayed in Figure 1—figure supplement 1D, which do not show indication of transport. (G, H) Traces show mean of five independent experiments from two reconstitutions. (C, D, F, G, H) errors are s.e.m.
-
Figure 5—source data 1
Transport data and Western blot of the SLC26A6 mutant R404V.
- https://cdn.elifesciences.org/articles/87178/elife-87178-fig5-data1-v1.xlsx
Figure 6
Transport mechanism.
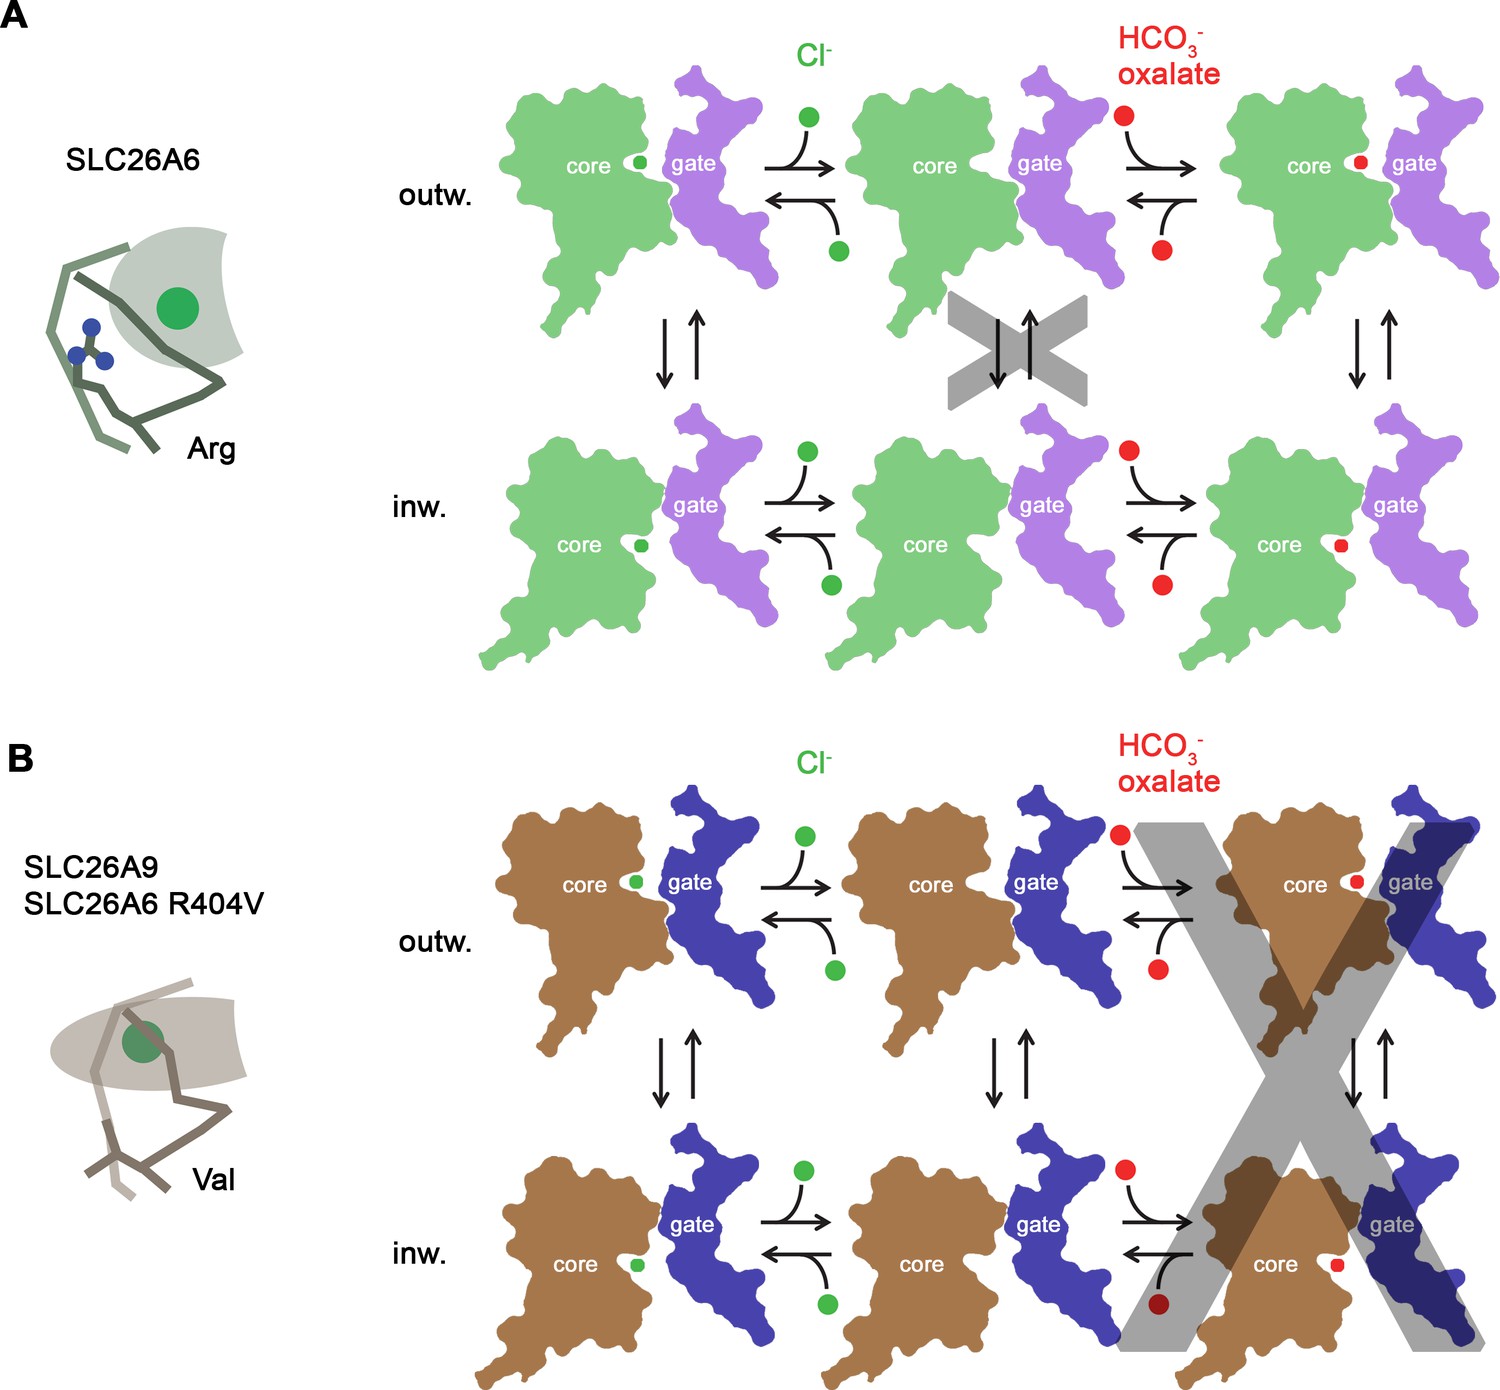
Features of the anion binding site (left) and kinetic schemes (right) of two SLC26 paralogs with distinct functional properties. (A) The coupled antiporter SLC26A6 mediates the strict stoichiometric exchange of Cl- and HCO3- and presumably also of oxalate. The protein readily cycles between inward- and outward-facing conformations in substrate-loaded states, whereas the transition in an unloaded state is kinetically disfavored. The binding of different anions is facilitated by a large but shallow binding site with high field-strength. (B) The uncoupled Cl- transporter SLC26A9 has a narrower substrate selectivity where both oxalate and HCO3- are not among the transported ions. Uncoupled Cl- transport is likely mediated by a mechanism that allows the rapid transition of the unloaded transporter between inward- and outward-facing conformations. The transported ion binds to a site with low field-strength. A similar mechanism, although with slower kinetics, is mediated by a point mutant of SLC26A6 where a conserved Arg of the binding site is replaced by a Val, the corresponding residue found in SLC26A9.
Tables
Table 1
Cryo-EM data collection, refinement, and validation statistics.
| hSLC26A6 in GDN(EMDB-17085) (PDB 8OPQ) | ||
|---|---|---|
| Data collection and processing | Data Set 1 | Data Set 2 |
| Magnification | 130,000 | 130,000 |
| Voltage (kV) | 300 | 300 |
| Electron exposure (e–/Å2) | 61 | 67 |
| Defocus range (μm) | −0.8 to −2.4 | −1 to −2.4 |
| Pixel size (Å)* | 0.3255 (0.651) | 0.3255 (0.651) |
| Symmetry imposed | C2 | |
| Initial particle images (no.) | 1,749,907 | |
| Final particle images (no.) | 93,169 | |
| Map resolution (Å) FSC threshold 0.143 | 3.28 | |
| Map resolution range (Å) | 2.9–4.1 | |
| Refinement | ||
| Model resolution (Å) 0.5 FSC Threshold | 3.3 | |
| Model resolution range (Å) | 1.6–3.3 | |
| Map sharpening b-factor (Å2) | 121.9 | |
| Model composition Non-hydrogen atoms Protein residues Ligands | 10,006 1296 2 | |
| B factors (Å2) Protein Ligands | 58.64 30 | |
| R.m.s. deviations Bond lengths (Å) Bond angles (°) | 0.004 0.907 | |
| Validation MolProbity score Clashscore Poor rotamers (%) | 1.71 8.25 0 | |
| Ramachandran plot Favored (%) Allowed (%) Disallowed (%) | 96.18 3.82 0.0 | |
-
1. *Values in parentheses indicate the pixel size in super-resolution.
Key resources table
| Reagent type (species) or resource | Designation | Source or reference | Identifiers | Additional information |
|---|---|---|---|---|
| Chemical compound, drug | HyClone HyCell TransFx-H medium | Cytiva | SH30939.02 | |
| Chemical compound, drug | 1-palmitoyl-2-oleoyl-sn-glycero-3-phosphoethanolamine (POPE) | Avanti Polar Lipids | 850757 C | |
| Chemical compound, drug | 1-palmitoyl-2-oleoyl-sn-glycero-3-phospho-(1'-rac-glycerol) (POPG) | Avanti Polar Lipids | 840457 C | |
| Chemical compound, drug | 1-palmitoyl-2-oleoyl-glycero-3-phosphocholine (POPC) | Avanti Polar Lipids | 850457 C | |
| Chemical compound, drug | Cholesterol | Sigma | C8667 | |
| Chemical compound, drug | Triton X-100 | Sigma | T9284 | |
| Chemical compound, drug | Pepstatin A | Axon lab | A2205.0100 | |
| Chemical compound, drug | Phenylmethylsulfonyl fluoride (PMSF) | Sigma | PMSF-RO | |
| Chemical compound, drug | Leupeptin | AppliChem | A2183,0100 | |
| Chemical compound, drug | Benzamidine | Sigma | B6506 | |
| Chemical compound, drug | Chloroform | Fluka | 25690 | |
| Chemical compound, drug | Glyco-diosgenin (GDN) | Anatrace | GDN101 | |
| Chemical compound, drug | Diethyl ether | Sigma | 296082 | |
| Chemical compound, drug | DNase I | AppliChem | A3778 | |
| Chemical compound, drug | Glycerin, Glycerol 86% | Roth | 4043.3 | |
| Chemical compound, drug | HCl | Merck Millipore | 1.00319.1000 | |
| Chemical compound, drug | HEPES | Sigma | H3375 | |
| Chemical compound, drug | [Eu.L1]+ | Loughborough University (Dr SJ Butler) | N/A | |
| Chemical compound, drug | ACMA | Thermofischer Scientific | A1324 | |
| Chemical compound, drug | CCCP | Sigma | C2759 | |
| Chemical compound, drug | N,N′-Dimethyl-9,9′-biacridinium-dinitrat (Lucigenin) | Sigma | M8010 | |
| Chemical compound, drug | Phosphate buffered saline | Sigma | D8537 | |
| Chemical compound, drug | Strep-Tactin Superflow high capacity resin | IBA | 2-1208-010 | |
| Chemical compound, drug | D-desthiobiotin | Sigma | D1411 | |
| Chemical compound, drug | Kolliphor P188 | Sigma | K4894 | |
| Chemical compound, drug | L-glutamine | Sigma | G7513 | |
| Chemical compound, drug | Penicillin-streptomycin | Sigma | P0781 | |
| Chemical compound, drug | Fetal bovine serum | Sigma | F7524 | |
| Chemical compound, drug | Polyethylenimine 25 K MW, linear | Polysciences | 23966–1 | |
| Chemical compound, drug | 40 kDa linear PEI MAX | Polysciences | 24765–1 | |
| Chemical compound, drug | Valproic acid | Sigma | P4543 | |
| Chemical compound, drug | Calcium Chloride | Sigma | 223506 | |
| Chemical compound, drug | Magnesium Chloride | Fluka | 63,065 | |
| Chemical compound, drug | Potassium chloride | Sigma | 746346 | |
| Chemical compound, drug | Sodium chloride | Sigma | 71380 | |
| Chemical compound, drug | Terrific broth | Sigma | T9179 | |
| Chemical compound, drug | Mouse-anti-myc primary antibody | Sigma | M4439 | (WB 1:5000) |
| Chemical compound, drug | Peroxidase AffiniPure polyclonal Goat Anti-Mouse IgG (H+L) | Jackson ImmunoResearch | 115-035-003 RRID: AB_10015289 | (WB 1:10000) |
| Commercial assay or kit | 4–20% Mini-PROTEAN TGX Precast Protein Gels, 15-well, 15 µl | BioRad Laboratories | 4561096DC | |
| Commercial assay or kit | Amicon Ultra-4 Centrifugal Filters Ultracel 100 K, 4 ml | Merck Millipore | UFC810024 | |
| Commercial assay or kit | Borosilicate glass capillary with filament | Sutter Instrument | BF150-86-10HP | |
| Commercial assay or kit | 0.22 µm Ultrafree-MC Centrifugal Filtfer | EMD Millipore | UFC30GV | |
| Commercial assay or kit | Biobeads SM-2 adsorbents | BioRad Laboratories | 152–3920 | |
| Commercial assay or kit | Avestin Extruder kit | Sigma | Z373400 | |
| Commercial assay or kit | Pierce Cell Surface Biotinylation and Isolation Kit | Thermofischer Scientific | A44390 | |
| Commercial assay or kit | Amersham ECL Prime Western Blotting Detection Reagent | Cytiva | RPN2232 | |
| Commercial assay or kit | Polycarbonate Membranes 400 nm | Sigma | 610007 | |
| Commercial assay or kit | Polycarbonate Membranes 50 nm | Sigma | 610003 | |
| Commercial assay or kit | 96-well black walled microplates | Thermofischer Scientific | M33089 | |
| Commercial assay or kit | 384-well black microplate flat-bottom | Greiner | 781076 | |
| Commercial assay or kit | Quantifoil R1.2/1.3 Au 200 Mesh | Electron Microscopy Sciences | Q2100AR1.3 | |
| Commercial assay or kit | Superose 6 10/300 GL | Cytiva | 17517501 | |
| Other | BioQuantum Energy Filter | Gatan | N/A | |
| Other | HPL6 | Maximator | N/A | |
| Other | K3 Direct Detector | Gatan | N/A | |
| Other | Titan Krios G3i | ThermoFisher Scientific | N/A | |
| Other | Viber Fusion FX7 imaging system | Witec | N/A | |
| Other | TECAN M1000 Infinite | TECAN | N/A | |
| Other | TECAN SPARK | TECAN | N/A | |
| Other | Vitrobot Mark IV | ThermoFisher Scientific | N/A | |
| Cell line (human) | HEK293S GnTi- & HEK293T | ATCC | CRL-3022 & CRL-1573 | |
| Recombinant DNA reagent | Mammalian expression vector with C-terminal 3 C cleavage site, venus fluorescent tag, myc tag, SBP tag. | Dutzler laboratory | N/A | |
| Recombinant DNA reagent | Mus musculus SLC26A9 ORF shuttle clone | BioScience | GenBank BC160193 | |
| Recombinant DNA reagent | Homo sapiens SLC26A6 cDNA clone | BioScience | GenBank BC017697 | |
| Recombinant protein | HRV 3 C protease | Expressed (pET_3 C) and purified in Dutzler laboratory | N/A | |
| Software, algorithm | ASTRA7.2 | Wyatt Technology | RRID:SCR_016255 https://www.wyatt.com/products/software/astra.html | |
| Software, algorithm | ChimeraX 1.4 | Pettersen et al., 2021 | RRID:SCR_015872 https://www.rbvi.ucsf.edu/chimerax/ | |
| Software, algorithm | Biorender | https://app.biorender.com/biorender-templates | ||
| Software, algorithm | Coot v.0.9.4 | Emsley et al., 2010 | RRID:SCR_014222 https://www2.mrc-lmb.cam.ac.uk/personal/pemsley/coot/ | |
| Software, algorithm | cryoSPARC v3.2.0–4.0 | Structura Biotechnology Inc. | RRID:SCR_016501 https://cryosparc.com/ | |
| Software, algorithm | DINO | RRID:SCR_013497 http://www.dino3d.org | ||
| Software, algorithm | EPU2.9 | Thermo Fisher Scientific | N/A | |
| Software, algorithm | Phenix | Liebschner et al., 2019 | RRID:SCR_014224 https://www.phenix-online.org/ | |
| Software, algorithm | DeepEMhancer | Sanchez-Garcia et al., 2021 | https://github.com/rsanchezgarc/deepEMhancer | |
| Software, algorithm | JALVIEW | Waterhouse et al., 2009 | ||
| Software, algorithm | Muscle | Edgar, 2004 | ||
| Software, algorithm | Axon Clampex 10.6 | Molecular Devices | N/A | |
| Software, algorithm | Axon Clampfit 10.6 | Molecular Devices | N/A | |
| Software, algorithm | Prism 9 | GraphPad | N/A | |
| Strain, strain background (E Coli) | E. coli MC1061 | Thermo Fisher Scientific | C66303 |
Additional files
Download links
A two-part list of links to download the article, or parts of the article, in various formats.
Downloads (link to download the article as PDF)
Open citations (links to open the citations from this article in various online reference manager services)
Cite this article (links to download the citations from this article in formats compatible with various reference manager tools)
Structural and functional properties of the transporter SLC26A6 reveal mechanism of coupled anion exchange
eLife 12:RP87178.
https://doi.org/10.7554/eLife.87178.3


