Age-related differences in the functional topography of the locus coeruleus and their implications for cognitive and affective functions
- Department of Neurobiology, Care Sciences and Society, Division of Clinical Geriatrics, Karolinska Institutet, Sweden
- Department of Physics, Goteborg University, Sweden
- University of Eastern Finland, Finland
- Department of Clinical Neuroscience, Karolinska Institutet, Sweden
- Department of Psychiatry and Neurochemistry, Institute of Neuroscience and Physiology, the Sahlgrenska Academy at the University of Gothenburg, Sweden
- Clinical Neurochemistry Laboratory, Sahlgrenska University Hospital, Sweden
- Department of Neurodegenerative Disease, UCL Institute of Neurology, United Kingdom
- UK Dementia Research Institute at UCL, United Kingdom
- Hong Kong Center for Neurodegenerative Diseases, Clear Water Bay, China
- Wisconsin Alzheimer’s Disease Research Center, University of Wisconsin School of Medicine and Public Health, University of Wisconsin-Madison, United States
- Institute of Cognitive Neurology and Dementia Research (IKND), Otto-von-Guericke University Magdeburg, Germany
- German Center for Neurodegenerative Diseases (DZNE), Otto-von-Guericke University Magdeburg, Germany
- Center for Behavioral Brain Sciences, University of Magdeburg, Germany
- Maastricht University, Netherlands
- Massachusetts General Hospital, United States
- Memory Research Unit, Department of Clinical Sciences Malmö, Lund University, Sweden
Figures
Figure 1 with 2 supplements
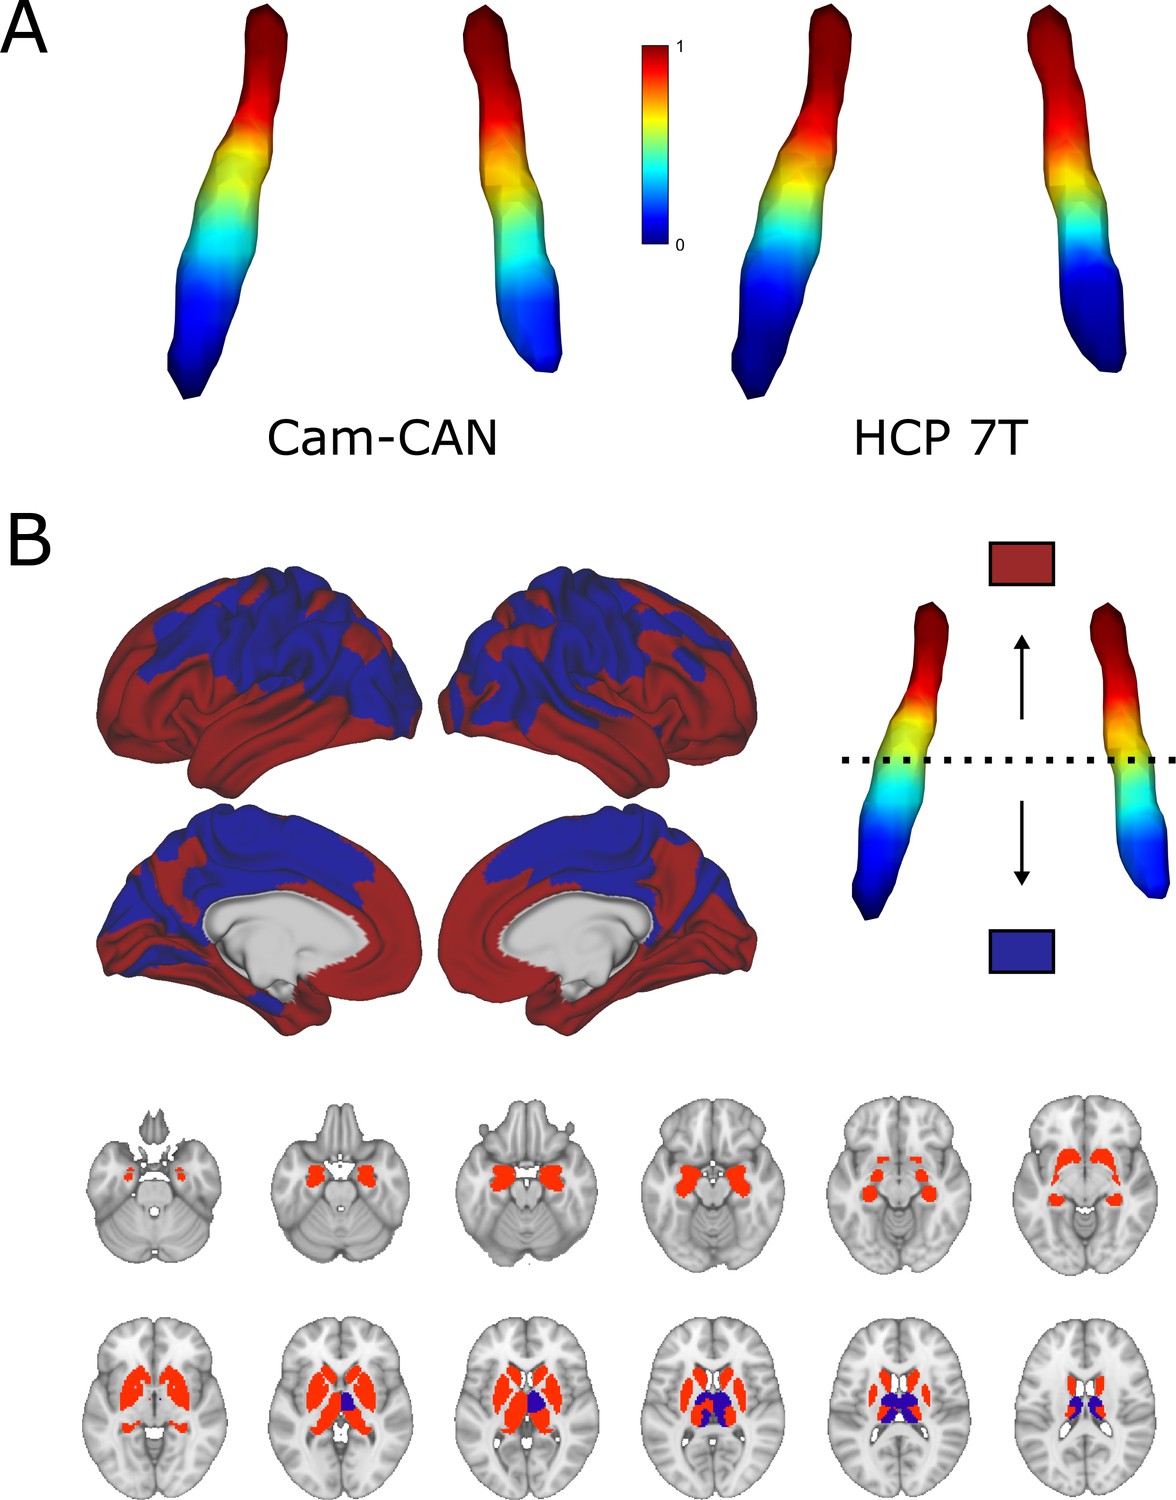
Average functional gradients of the locus coeruleus (LC) in the CamCAN 3T and Human Connectome Project (HCP) 7T datasets.
(A) Average functional gradients from subjects below 40 years of age in the CamCAN and HCP 7T datasets were projected to a surface rendering of the LC region of interest (ROI) mask. We present younger participants from the CamCAN cohort to make it comparable to the demographic characteristics of the HCP cohort. The color bar denotes normalized values of the dominant eigenmap. (B) Projection maps of the LC were calculated as the mode of maximal correlation localization to either the rostral (red) or the caudal (blue) part of the LC in order to show the two extremes of connectivity. Projection maps were overlaid on the average HCP cortical surface and MNI152 template for the subcortical structures.
Figure 1—figure supplement 1
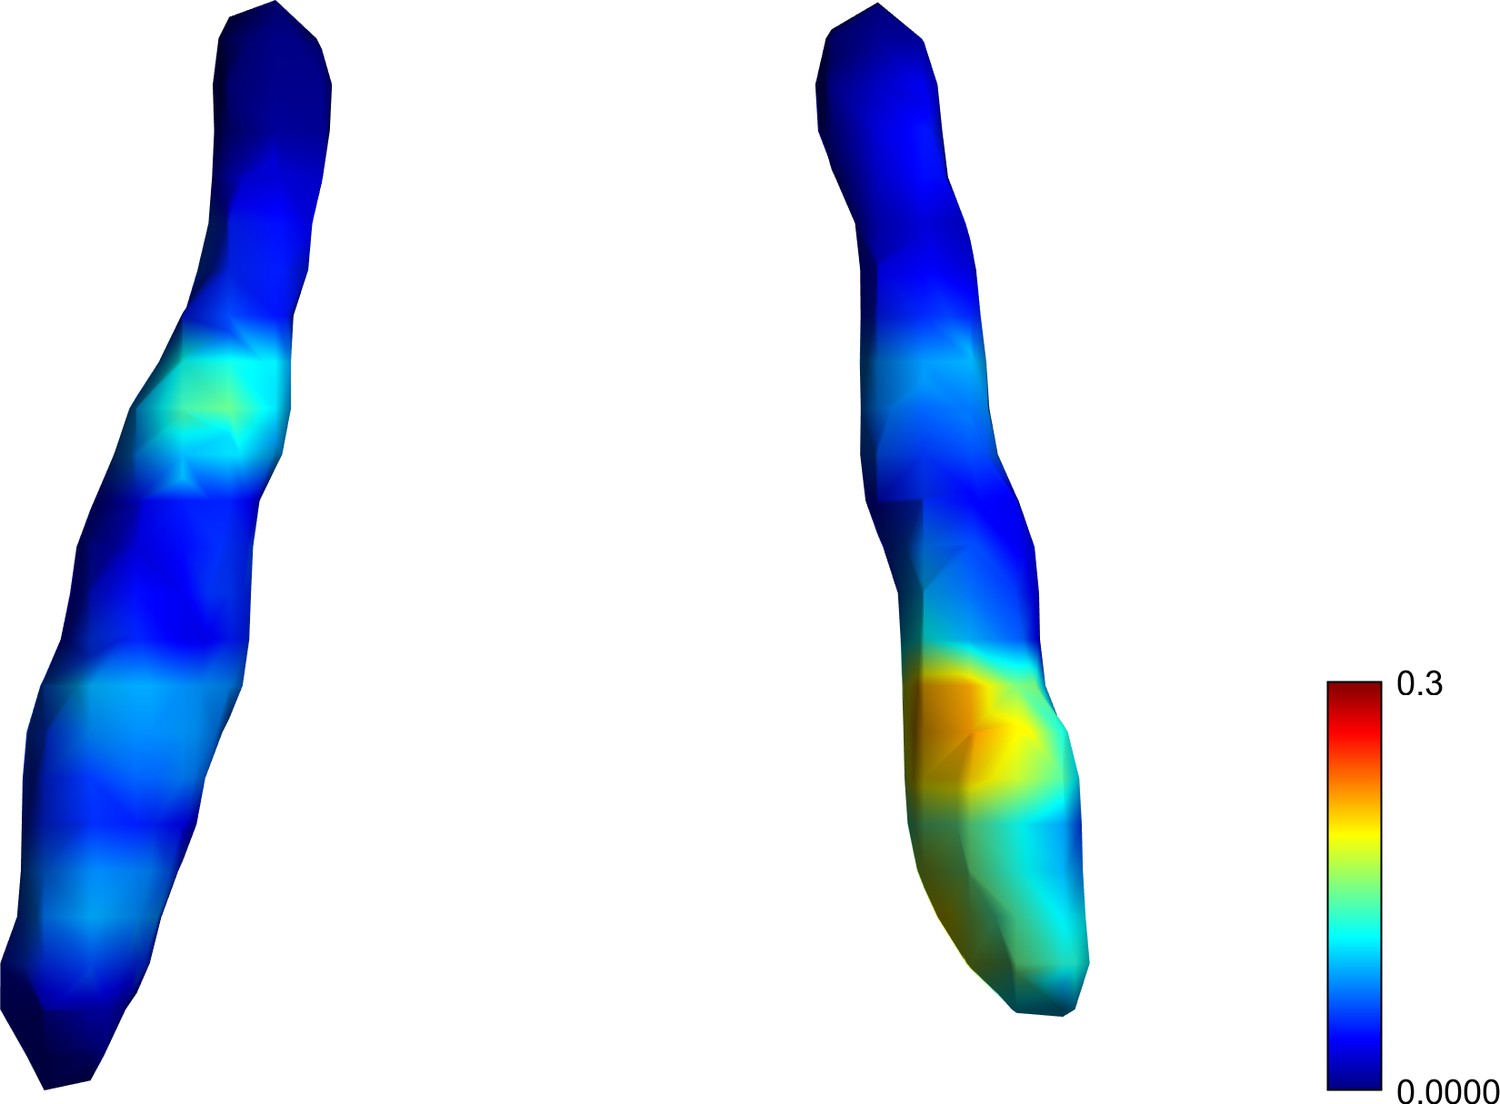
Normalized difference map depicting the similarity of the gradient between subjects below 40 years of age from the CamCAN and the Human Connectome Project (HCP) 7T dataset.
We present younger participants from the CamCAN cohort to make it comparable to the demographic characteristics of the HCP cohort. The difference map was calculated as the absolute difference by subtracting the normalized CamCAN gradient from the normalized HCP gradient.
Figure 1—figure supplement 2
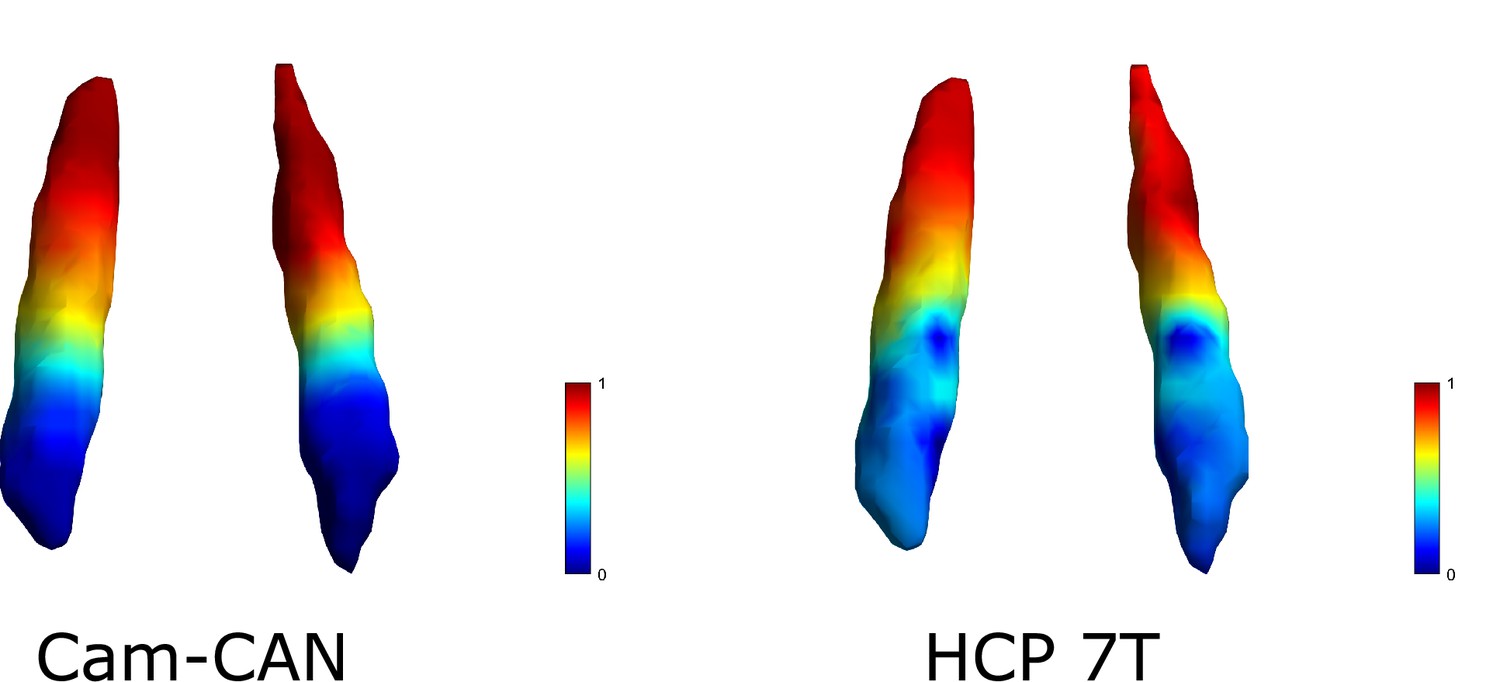
Average functional gradients of the locus coeruleus (LC) in the CamCAN 3T and Human Connectome Project (HCP) 7T datasets using an LC region of interest (ROI) different from the main analysis.
Average functional gradients from subjects below 40 years of age in the CamCAN and HCP 7T datasets were projected to a surface rendering of the LC ROI mask. We present younger participants from the CamCAN cohort to make it comparable to the demographic characteristics of the HCP cohort. The color bar denotes normalized values of the dominant eigenmap.
Figure 2
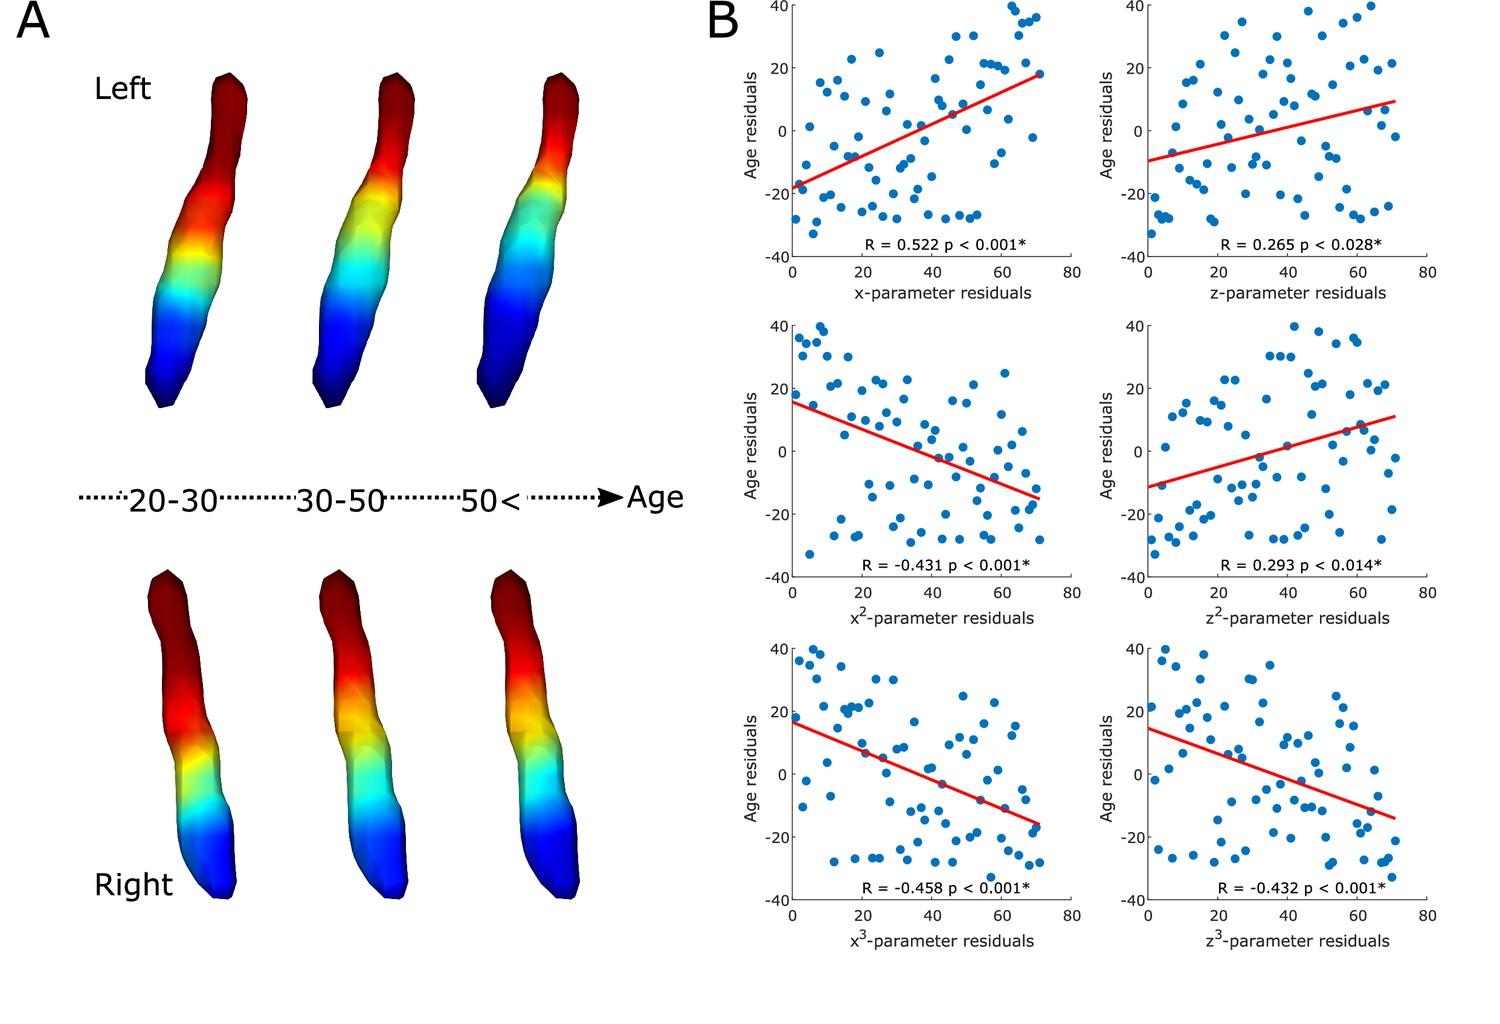
Age-related changes in the locus coeruleus (LC) functional gradient.
Average functional gradients from representative age groups (20–30, 30–50, <50) were projected to a surface rendering of the left and right LC region of interest (ROI) mask (A). The scatter plots show the relationship between age and rank-transformed values of trend surface model (TSM) parameters (after adjusting for effects of sex) describing the spatial features of the gradient (see Materials and methods for more details) with a least-squares line in red (B). Parameter changes correspond to a loss of rostral-like connectivity, increased asymmetry, and more clustered functional organization of the LC in older participants.
Figure 3 with 1 supplement
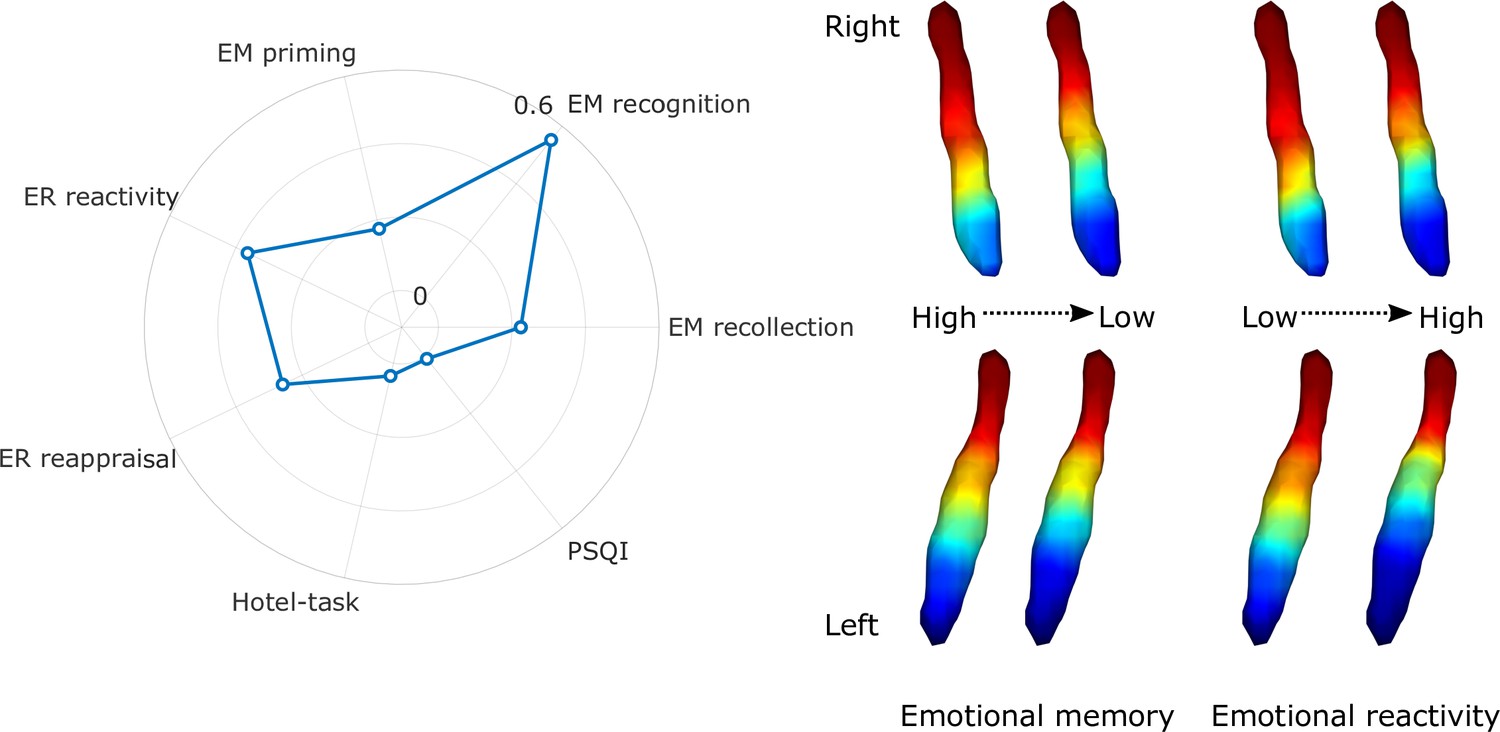
Association of locus coeruleus (LC) functional gradient spatial features and behavioral measures.
The polar plot depicts additional variance explained by spatial features of the LC functional gradient over and above nuisance variables (age, sex, education for the analyses to predict cognitive variables) in emotional memory, emotion regulation, executive function, and sleep quality in terms of adjusted partial R2 values. Example window-averaged gradients from participants with lowest and highest emotional memory scores and emotion regulation scores were projected to a surface rendering of the LC region of interest (ROI) mask, showing that old-like functional gradient spatial features (less extensive rostral-like connectivity and more clustered functional organization) are associated with lower scores in emotional memory and emotion regulation related to stimuli with negative valence. No significant associations were found with executive function and sleep quality. Abbreviations: EM = emotional memory, ER = emotion regulation, PSQI = Pittsburgh Sleep Quality Index.
Figure 3—figure supplement 1
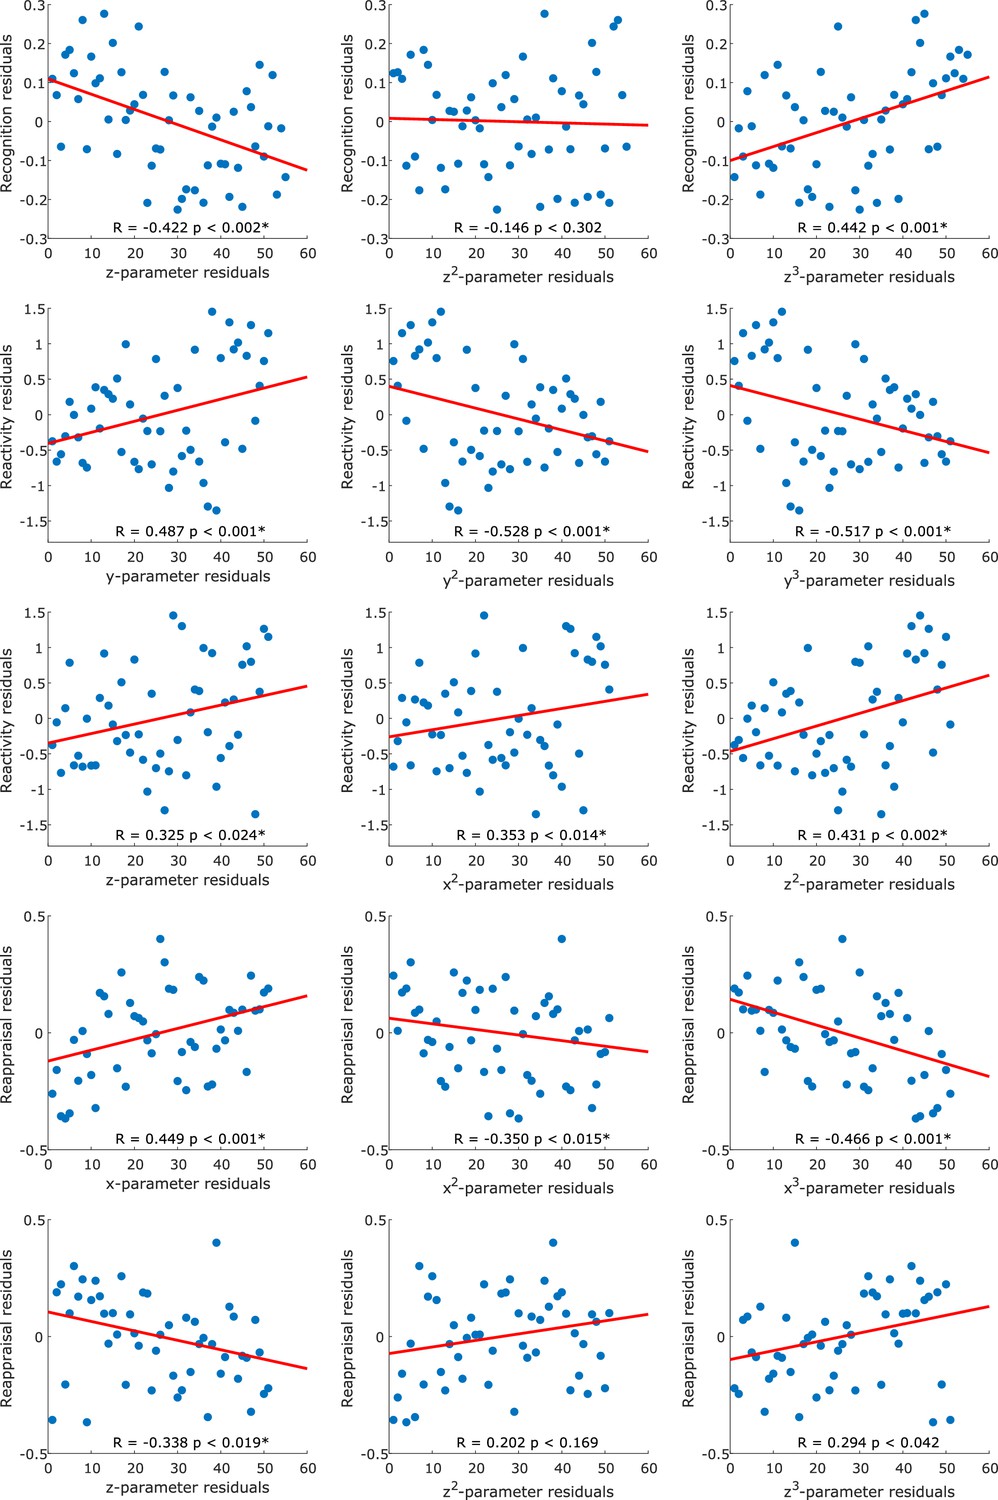
Correlation plots of individual trend surface model parameters and cognitive scores.
The scatter plots depict residuals of rank-transformed gradient parameters and cognitive scores after correcting for age, sex, and education, with a least squares line superimposed in red color.
Figure 4
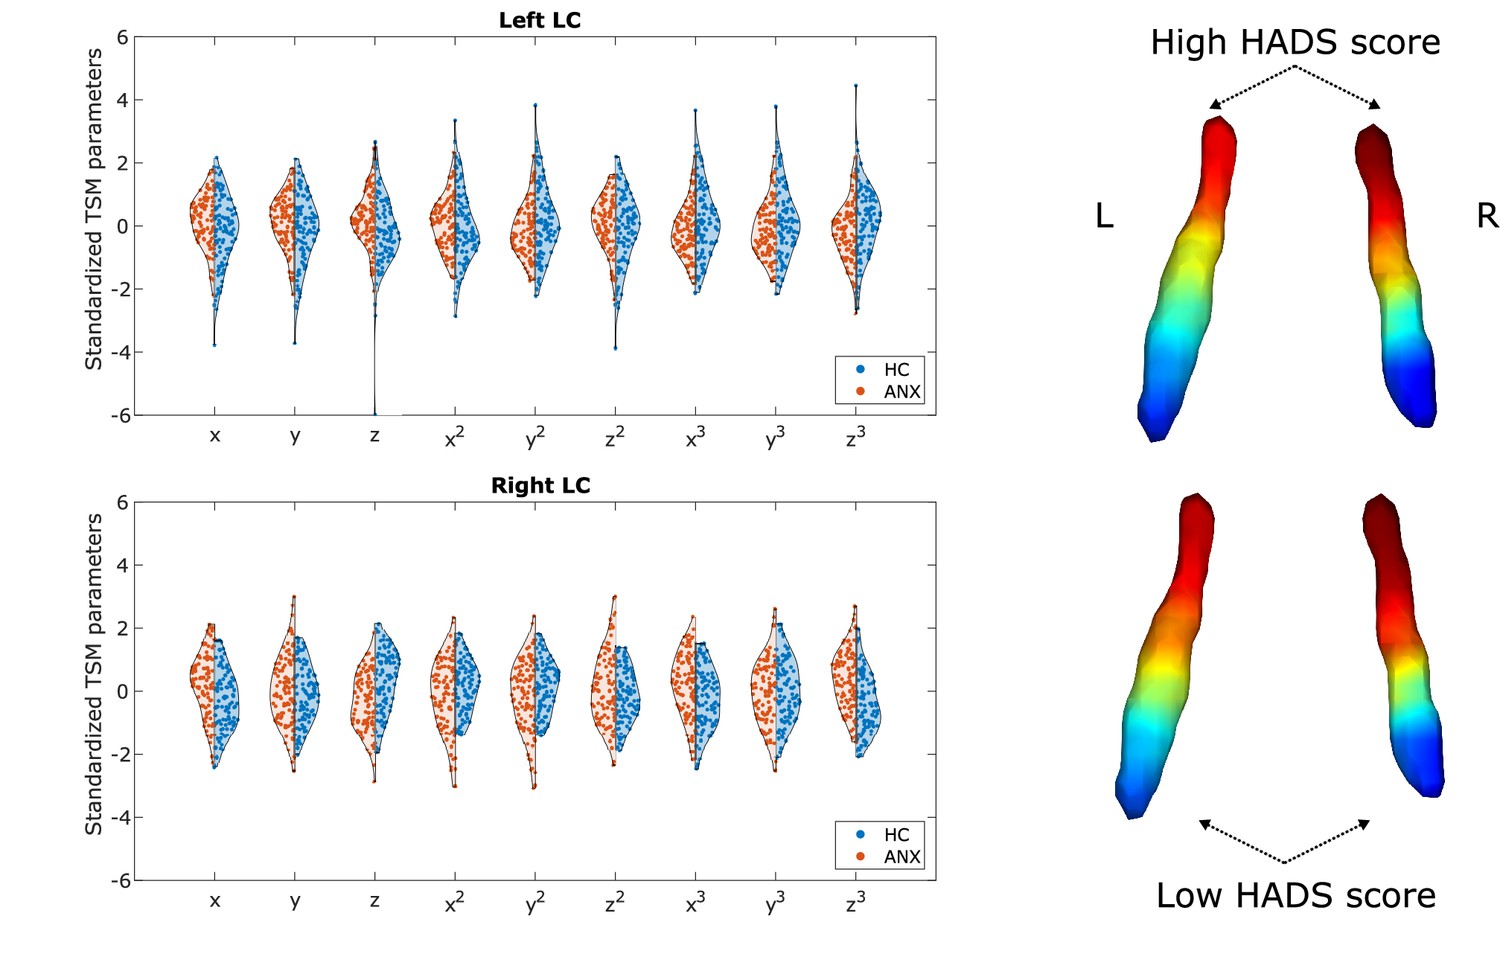
Alterations of the locus coeruleus (LC) functional gradient in participants with abnormal Hospital Anxiety and Depression Scale (HADS) scores.
The violin plots depict gradient spatial model parameter distributions in the two groups. Example gradients from participants with low and high HADS scores were projected to a surface rendering of the LC region of interest (ROI) mask, showing that high HADS scores were associated with a reduction of rostral-like connectivity, as well as a greater asymmetry in the spatial layout of the bilateral LC gradients.
Tables
Table 1
Demographic features of the CamCAN and Human Connectome Project (HCP) 7T cohorts.
Values in the table represent means followed by (standard deviations), except when stated otherwise. Measures from the emotional memory task represent d prime scores, which demonstrate the sensitivity of an individual to detect or correctly categorize stimuli in the given condition. Emotion regulation measures represent rescaled Likert-scale ratings, whereas the Hotel-task is scored as the average time in seconds a participant spends on each subtask. PSQI is a self-reported measure of sleep quality. HADS is a screening tool for anxiety and depression symptoms. Abbreviations: SD=standard deviation, M=male, F=female, PSQI=Pittsburgh Sleep Quality Index, HADS=Hospital Anxiety and Depression Scale.
| CamCAN (n=618) | HCP 7T (n=184) | |
|---|---|---|
| Age range (years) | 18–88 | 22–36 |
| Biological sex (M/F) | 305/313 | 72/112 |
| Education years | 14.56 (4.02) | – |
| Emotional memory – recollection | 1.58 (0.69) | – |
| Emotional memory – recognition | 2.63 (0.55) | – |
| Emotional memory – priming | 0.41 (0.09) | – |
| Emotion regulation – reactivity | 5.29 (1.63) | – |
| Emotion regulation – reappraisal | 0.038 (1.11) | – |
| Hotel-task | 301.93 (172.36) | – |
| PSQI score (median, range) | 4 (0–22) | – |
| HADS score (median, range) | 5 (0–20) | – |
Additional files
Download links
A two-part list of links to download the article, or parts of the article, in various formats.
Downloads (link to download the article as PDF)
Open citations (links to open the citations from this article in various online reference manager services)
Cite this article (links to download the citations from this article in formats compatible with various reference manager tools)
Age-related differences in the functional topography of the locus coeruleus and their implications for cognitive and affective functions
eLife 12:RP87188.
https://doi.org/10.7554/eLife.87188.3


