An observational treatment study of metacognition in anxious-depression
- School of Psychology, Trinity College Dublin, Ireland
- Trinity College Institute of Neuroscience, Trinity College Dublin, Ireland
- Wellcome Centre for Human Neuroimaging, University College London, United Kingdom
- SilverCloud Science, SilverCloud Health Ltd, Ireland
- Department of Psychiatry, Trinity College Dublin, Ireland
- Tallaght Hospital, Trinity Centre for Health Sciences, Tallaght University Hospital, Ireland
- Translational Neuroimaging Unit (TNU), Institute for Biomedical Engineering, University of Zurich, Switzerland
- Max Planck Institute for Metabolism Research, Germany
- Global Brain Health Institute, Trinity College Dublin, Ireland
Figures
Figure 1
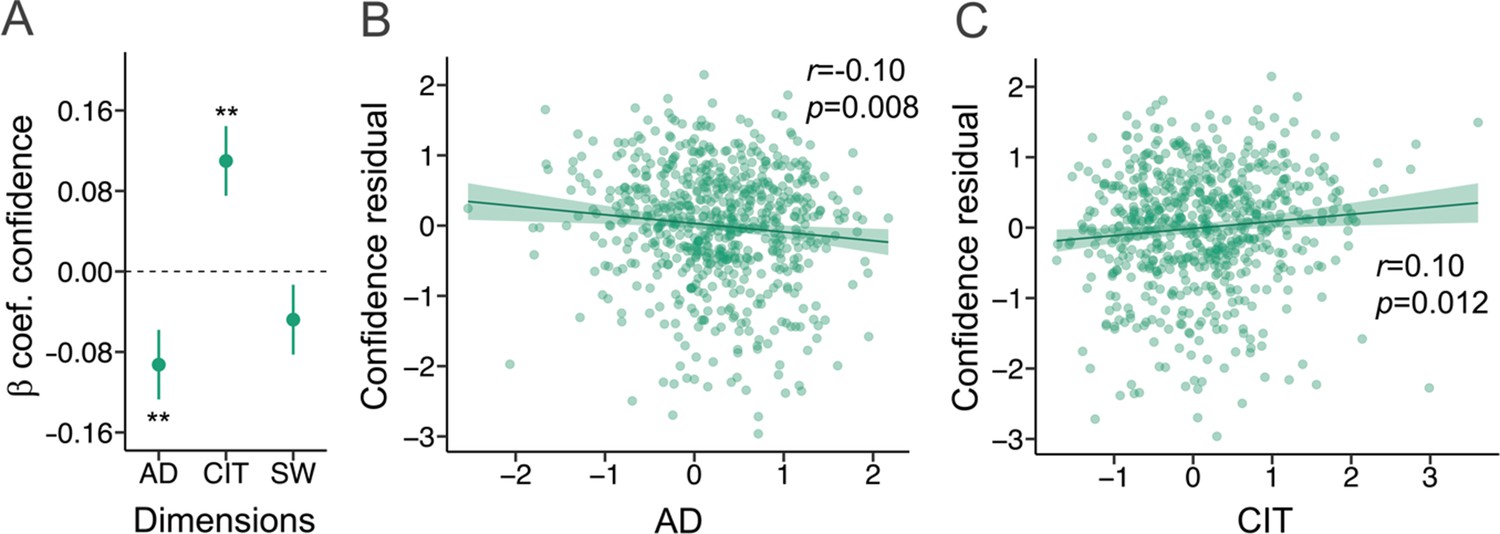
Cross-sectional findings at baseline in the iCBT arm.
β=standardised beta coefficient, r=correlation coefficient, p=p-value, AD = Anxious-Depression, CIT = Compulsivity and Intrusive Thought, SW = Social Withdrawal. The error bars represent the standard error around the standardised beta coefficient. N=649. (A) AD and CIT were associated with metacognitive bias, while SW was not, using linear regression analysis. (B) The residual values for confidence (controlling for age, gender and education) were negatively correlated with AD. (C) The residual values for confidence (controlling for age, gender and education) were positively correlated with CIT.
Figure 2 with 2 supplements
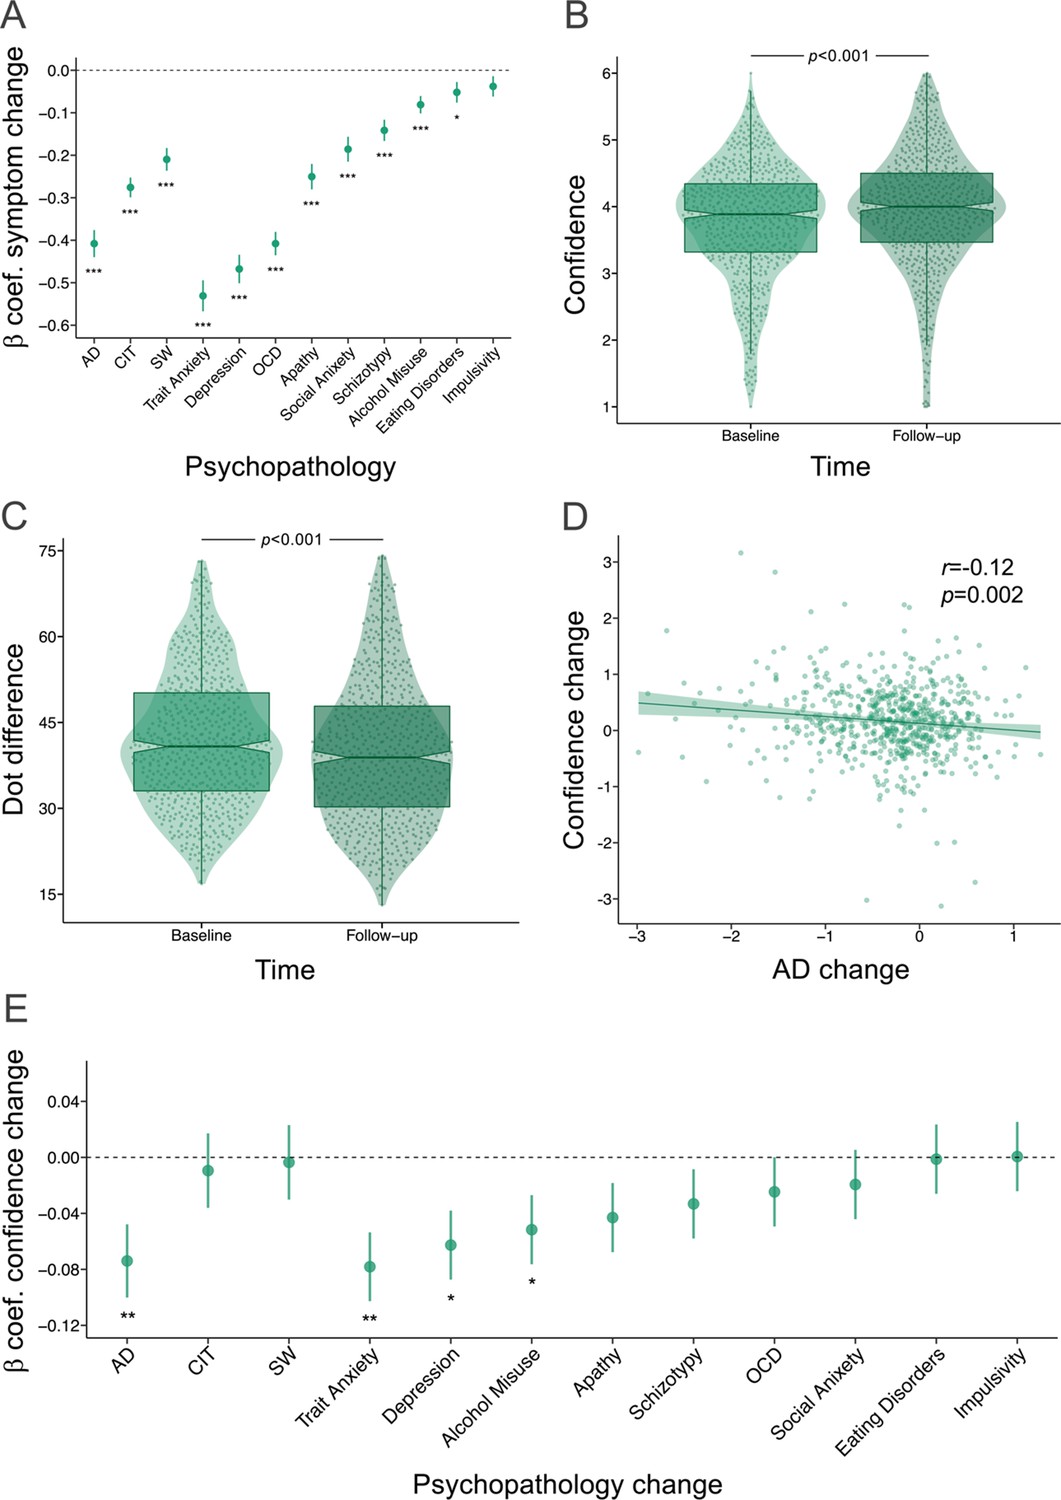
Treatment findings in the iCBT arm.
β=standardised beta coefficient, AD = Anxious-Depression, CIT = Compulsivity and Intrusive Thought, SW = Social Withdrawal, OCD = Obsessive compulsive disorder, r=correlation coefficient, p=p-value (unadjusted), ***=p < 0.001, **=p < 0.01, *=p < 0.05. The error bars represent the standard error around the standardised beta coefficient. Regression analyses were used for all tests. N=649. (A) Psychopathology symptoms improved with four weeks of iCBT. (B) Confidence was significantly higher and, (C) the task was more difficult at 4-week follow-up. (D) Those with the largest improvements in AD had the greater increases in confidence. (E) Change in confidence also scaled with improvements in trait anxiety, depression and alcohol misuse.
Figure 2—figure supplement 1
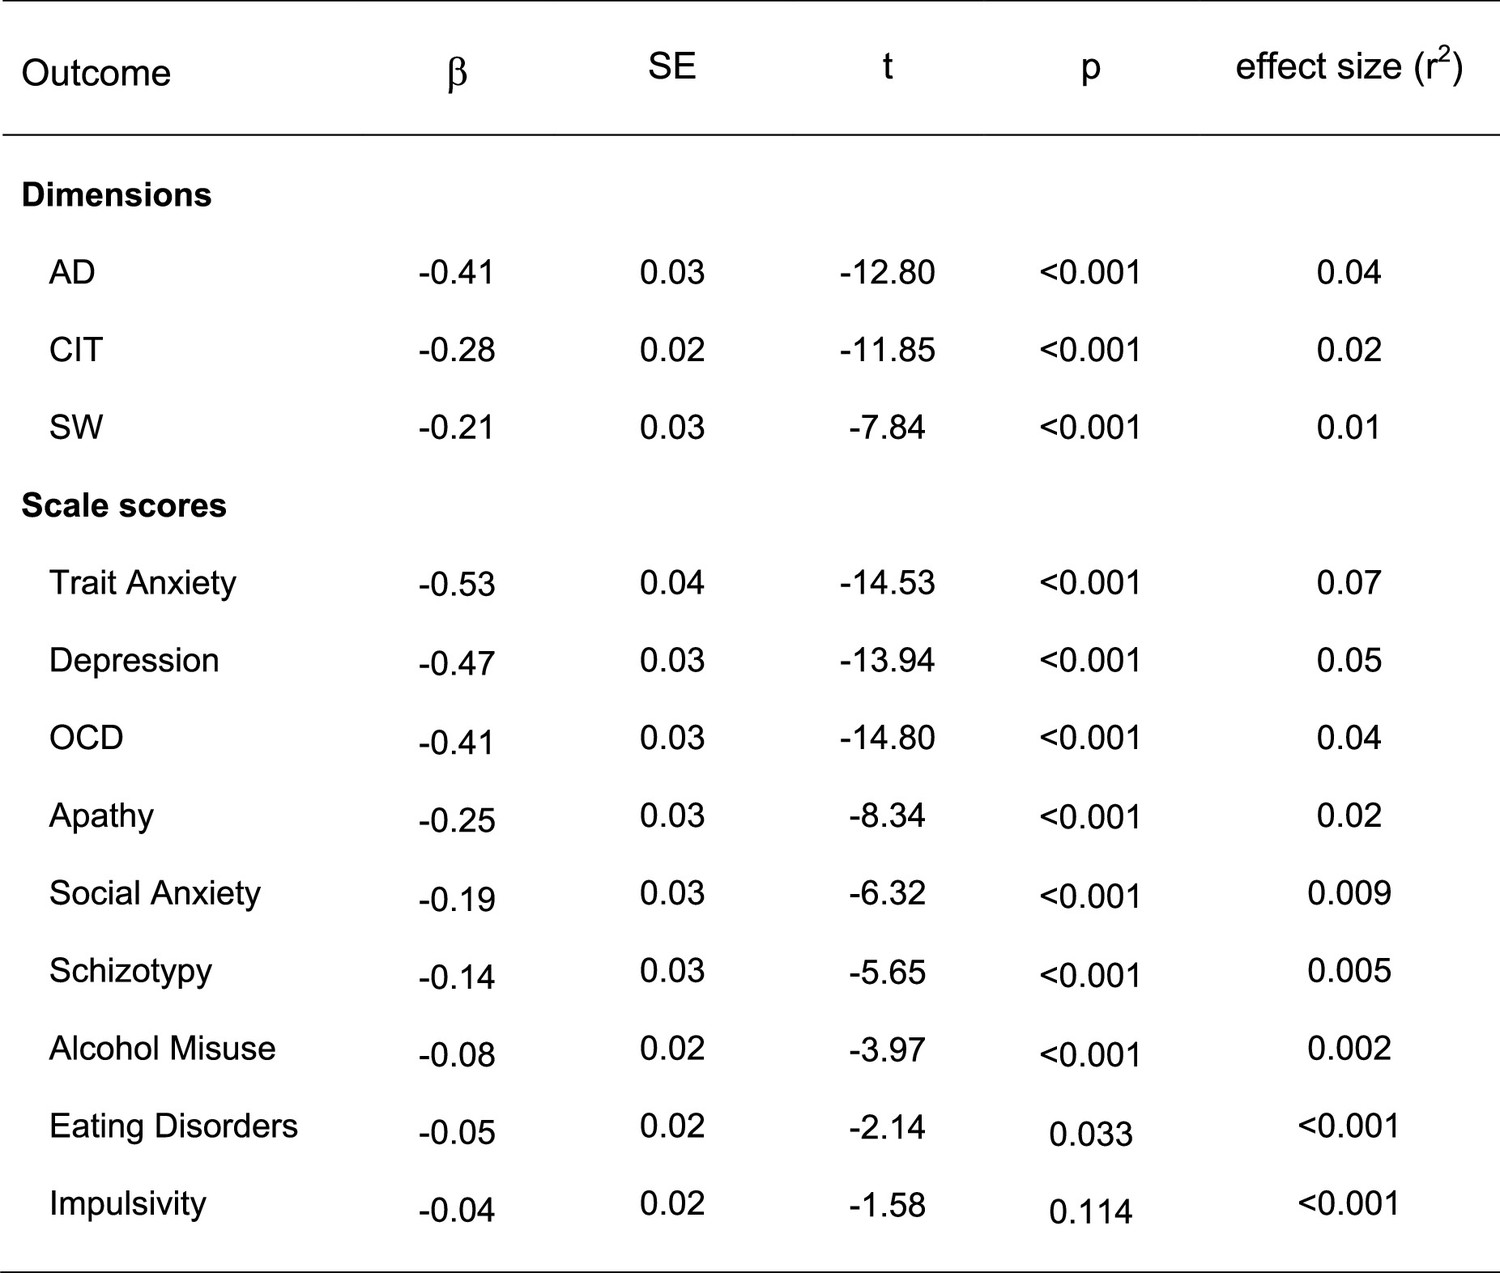
Changes in psychiatric dimensions and scale scores from baseline to follow-up in the iCBT arm (N=649) using regression analyses.
β = standardised beta coefficient, SE = standardised error, t = t-value, p = p-value (unadjusted), AD = Anxious-depression, CIT = Compulsivity and intrusive thought, SW = Social withdrawal, OCD = Obsessive compulsive disorder.
Figure 2—figure supplement 2
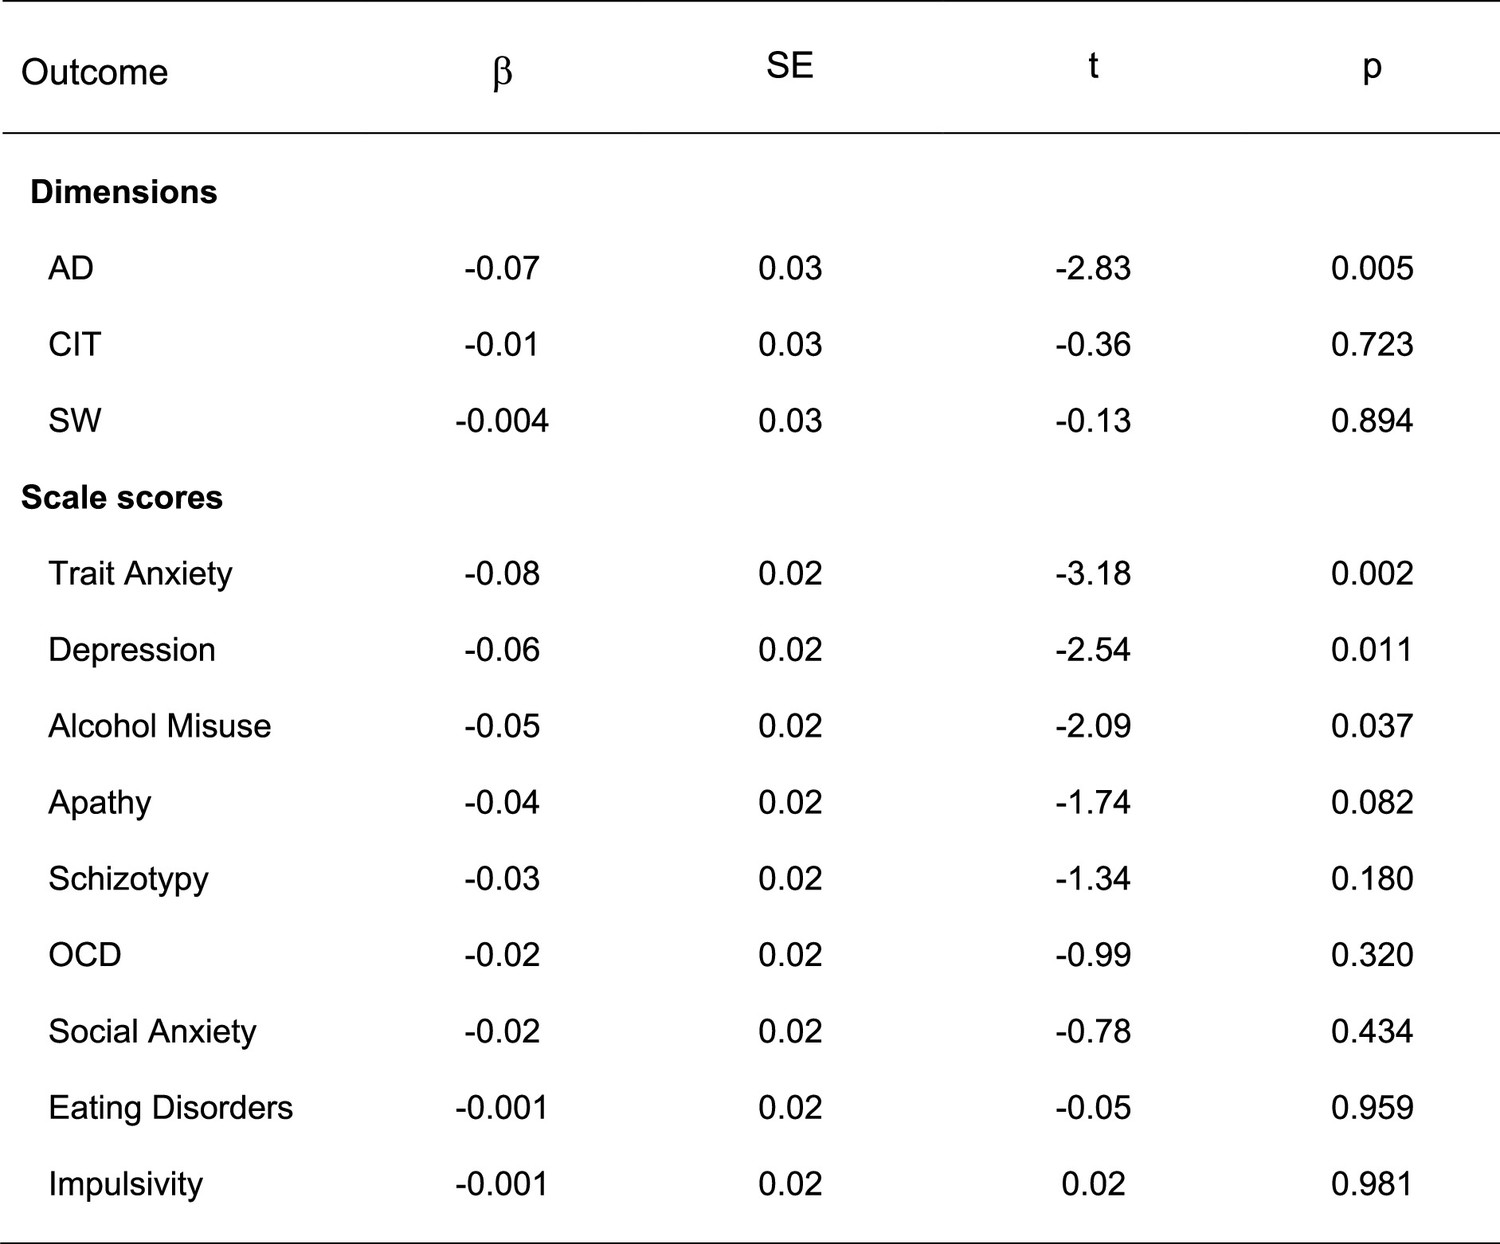
The interaction effect of time and psychiatric dimension/scale change on mean confidence in the iCBT arm (N=649) using regression analyses.
β=standardised beta coefficient, SE = standardised error, t=t-value, p=p-value (unadjusted), AD = Anxious-depression, CIT = Compulsivity and intrusive thought, SW = Social withdrawal, OCD = Obsessive compulsive disorder.
Figure 3 with 1 supplement
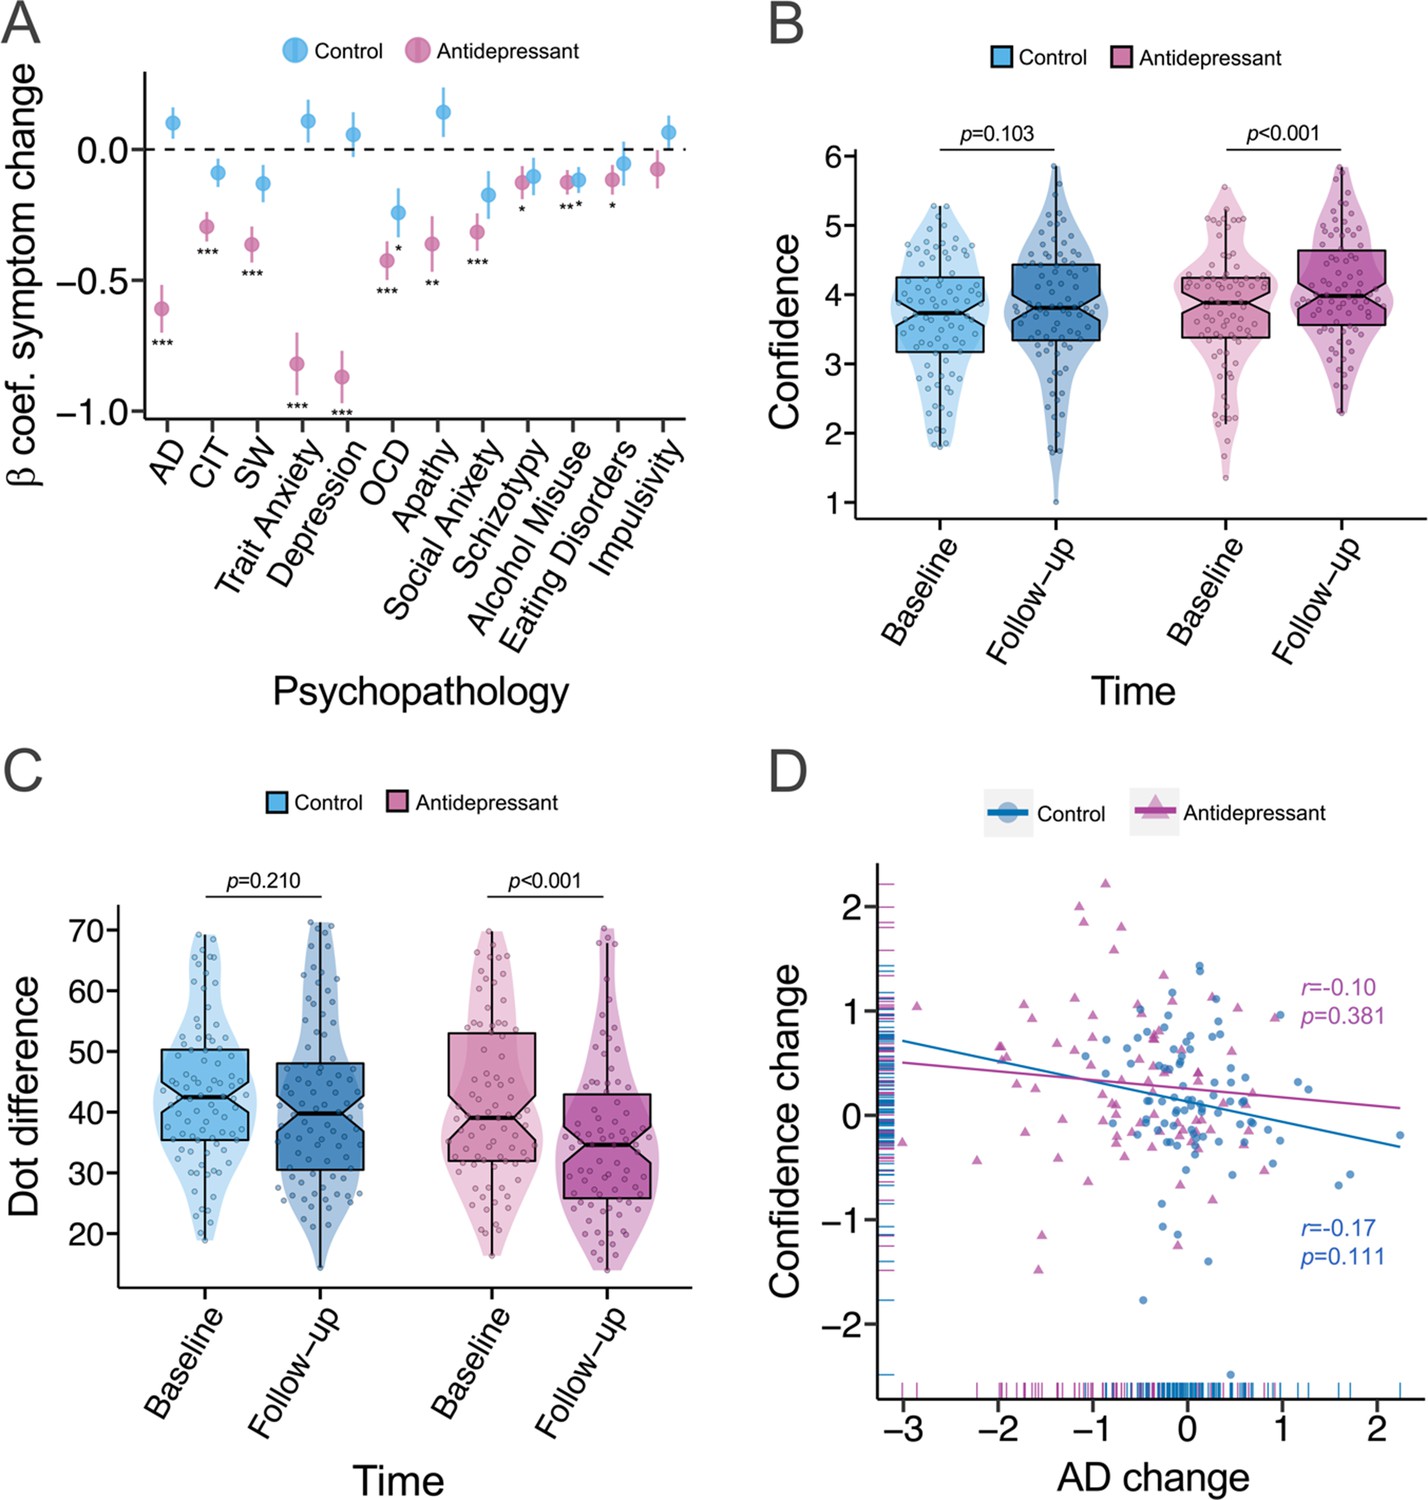
Comparing iCBT, antidepressant and control groups.
β=standardised beta coefficient, AD = Anxious-Depression, CIT = Compulsivity and Intrusive Thought, SW = Social Withdrawal, OCD = Obsessive compulsive disorder, r=correlation coefficient, p=p-value, ***=p < 0.001, **=p < 0.01, *=p < 0.05. The error bars represent the standard error around the standardised beta coefficient. Regression analyses were used for tests. (A) The majority of psychiatric scales improved in the antidepressant arm (N=82) after 4 weeks of treatment, while the controls (N=88) only had significant reductions in OCD symptoms and alcohol misuse at follow-up. (B) While confidence increased in the antidepressant arm, there was no significant change in confidence among controls. The larger increase in confidence in the antidepressant arm compared to controls was trended towards significant. (C) The antidepressant arm had a greater increase in task difficulty (a reduction in dot difference across stimuli) from baseline to follow-up, relative to controls. (D) Although not significant, the association between change in confidence and change in anxious-depression was in the expected negative direction in the antidepressant arm and among controls.
Figure 3—figure supplement 1
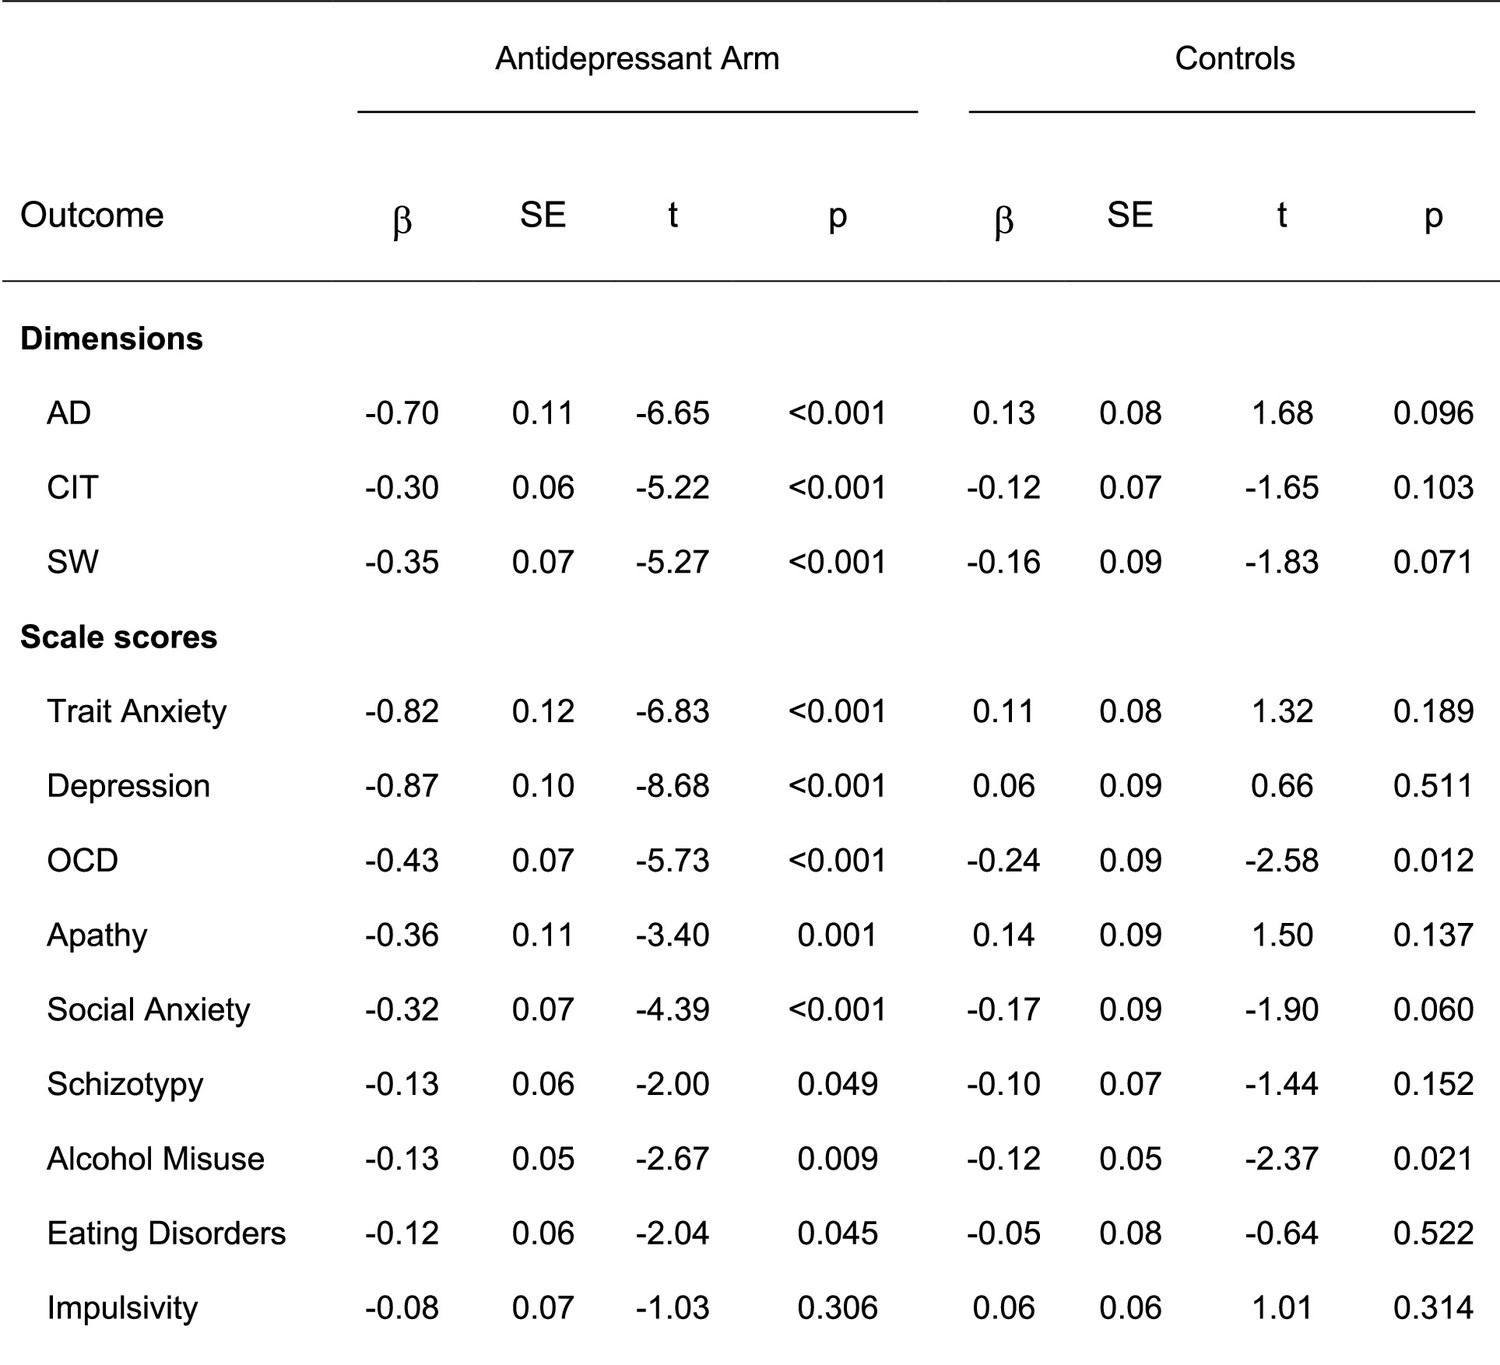
Changes in psychiatric dimensions and scale scores from baseline to follow-up in antidepressant (N=82) and control (N=88) arms using regression analyses.
β=standardised beta coefficient, SE = standardised error, t=t-value, p=p-value (unadjusted), AD = Anxious-depression, CIT = Compulsivity and intrusive thought, SW = Social withdrawal, OCD = Obsessive Compulsive Disorder.
Figure 4
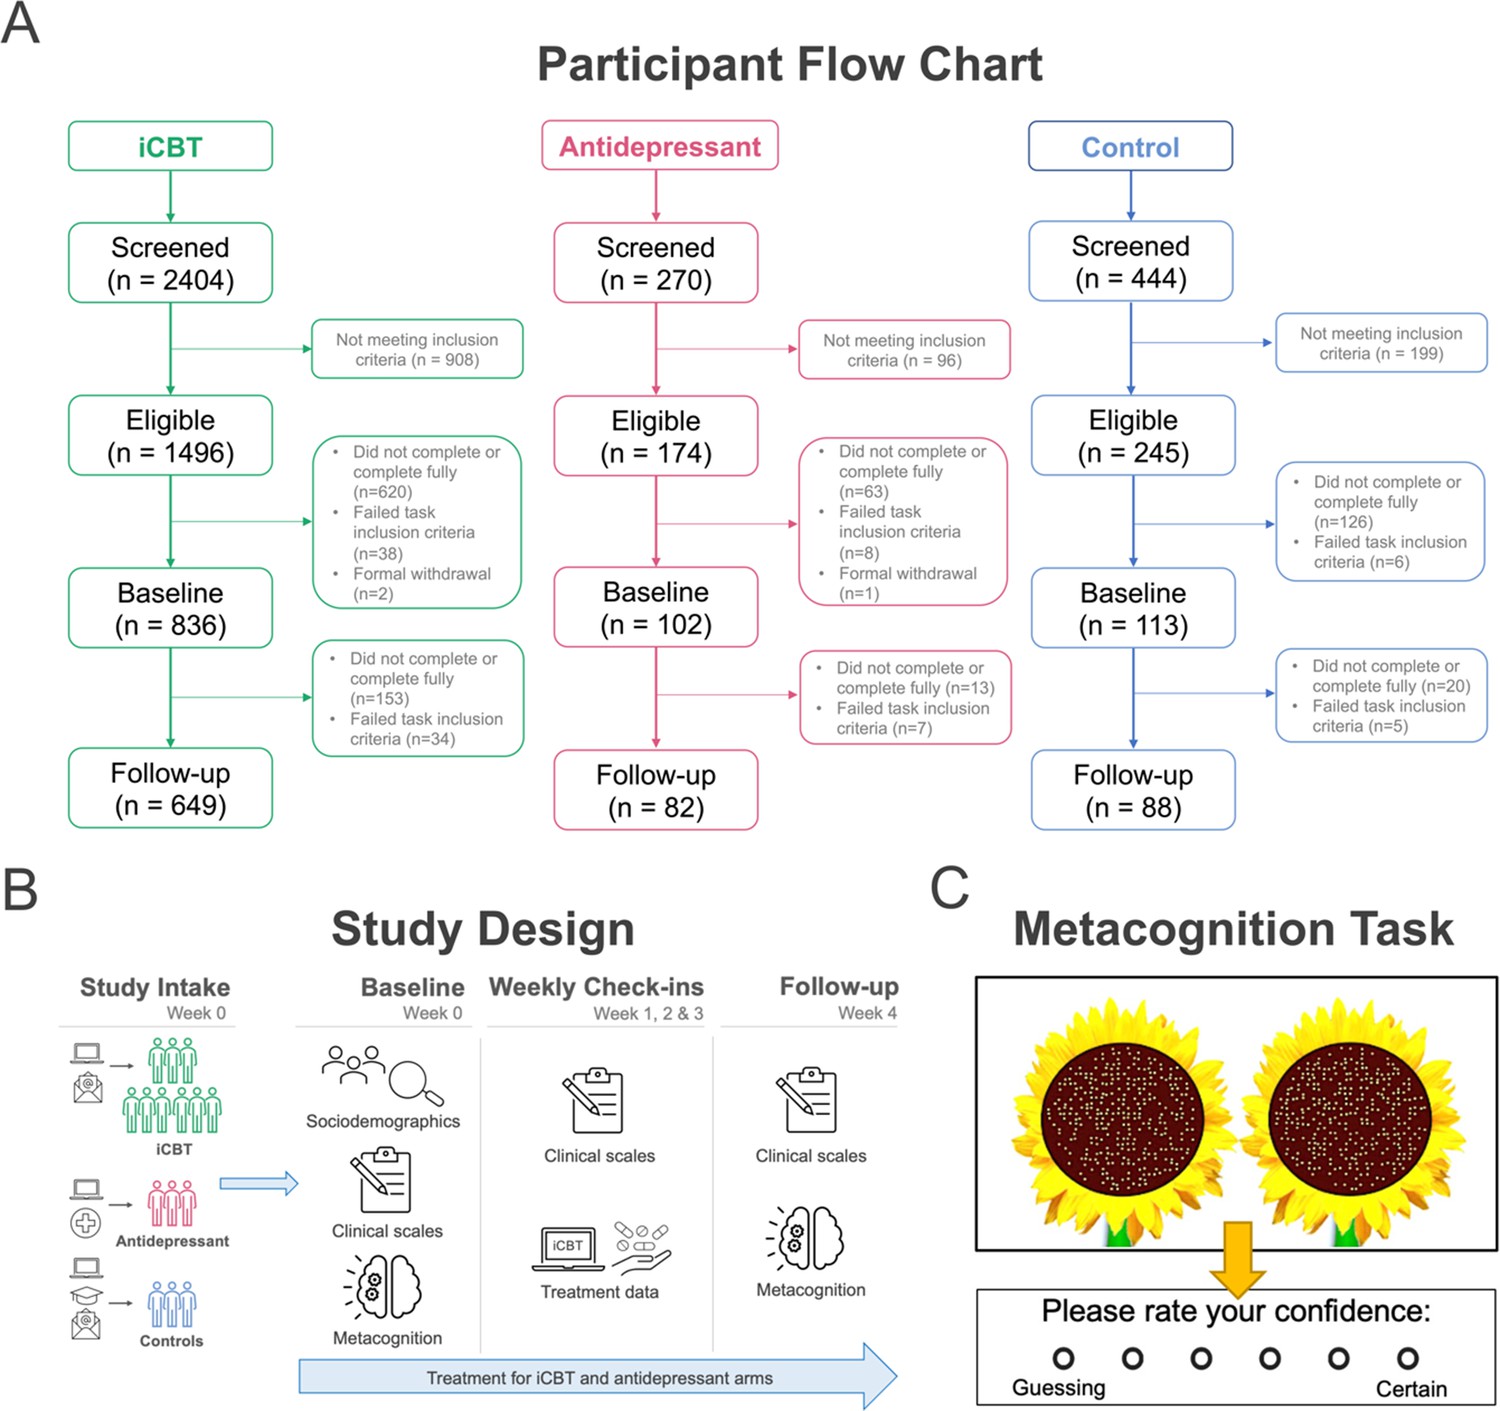
Study methods.
(A) Participant flow chart (CONSORT chart). Participants were considered ‘completers’ if they had metacognitive and transdiagnostic psychiatric dimension data at baseline and follow-up and met task inclusion criteria. (B) Overview of study design from study intake (week 0) to follow-up (week 4) assessments across groups. (C) Metacognitive (visuo-perceptual decision-making) task design (N=210 trials). On each trial, participants were asked to judge and choose the sunflower that contained more seeds (i.e. higher number of dots) and then provide a confidence rating on their decision.
Tables
Table 1
Baseline sociodemographic characteristics of participants.
| Characteristic | iCBT (n=649)* | Antidepressant (n=82) | Control (n=88) | F/X2 (df) | p |
|---|---|---|---|---|---|
| Gender, No. (%) | 0.414† | ||||
| Male | 141 (21.8) | 20 (24.4) | 22 (25.0) | ||
| Female | 501 (77.4) | 60 (73.2) | 66 (75.0) | ||
| Other | 5 (0.8) | 2 (2.4) | 0 (0.0) | ||
| Age, M (SD) | 32.2 (11.0) | 30.5 (10.5) | 29.1 (12.0) | 3.68 (2, 813) | 0.026 |
| Country of residence, No. (%) | 211.73 (4) | <0.001 | |||
| Ireland | 89 (13.8) | 32 (39.0) | 58 (65.9) | ||
| United Kingdom | 546 (84.4) | 34 (41.5) | 24 (27.3) | ||
| Other | 12 (1.9) | 16 (19.5) | 6 (6.8) | ||
| Highest level of education, No. (%) | 7.11 (4) | 0.130 | |||
| Below undergraduate | 147 (22.7) | 12 (14.6) | 13 (14.8) | ||
| Some/completed undergraduate | 342 (52.9) | 49 (59.8) | 57 (64.8) | ||
| Above undergraduate | 158 (24.4) | 21 (25.6) | 18 (20.5) |
-
*
Two participants in the iCBT arm were missing data for age, gender, country of residence and highest level of education.
-
†
Gender proportions were compared using Fisher’s exact due to cell count <5 in the ‘Other’ group.
Additional files
Download links
A two-part list of links to download the article, or parts of the article, in various formats.
Downloads (link to download the article as PDF)
Open citations (links to open the citations from this article in various online reference manager services)
Cite this article (links to download the citations from this article in formats compatible with various reference manager tools)
An observational treatment study of metacognition in anxious-depression
eLife 12:RP87193.
https://doi.org/10.7554/eLife.87193.3


