An ecological network approach for detecting and validating influential organisms for rice growth
- Hakubi Center, Kyoto University, Japan
- Center for Ecological Research, Kyoto University, Japan
- Department of Ocean Science, The Hong Kong University of Science and Technology, Clear Water Bay, Kowloon, China
- Tropical Agriculture Research Front, Japan International Research Center for Agricultural Sciences, Japan
- Graduate School of Agriculture, Osaka Metropolitan University, Japan
- Faculty of Agriculture, Ryukoku University, Japan
- Institute for Advanced Biosciences, Keio University, Japan
Figures
Figure 1 with 2 supplements
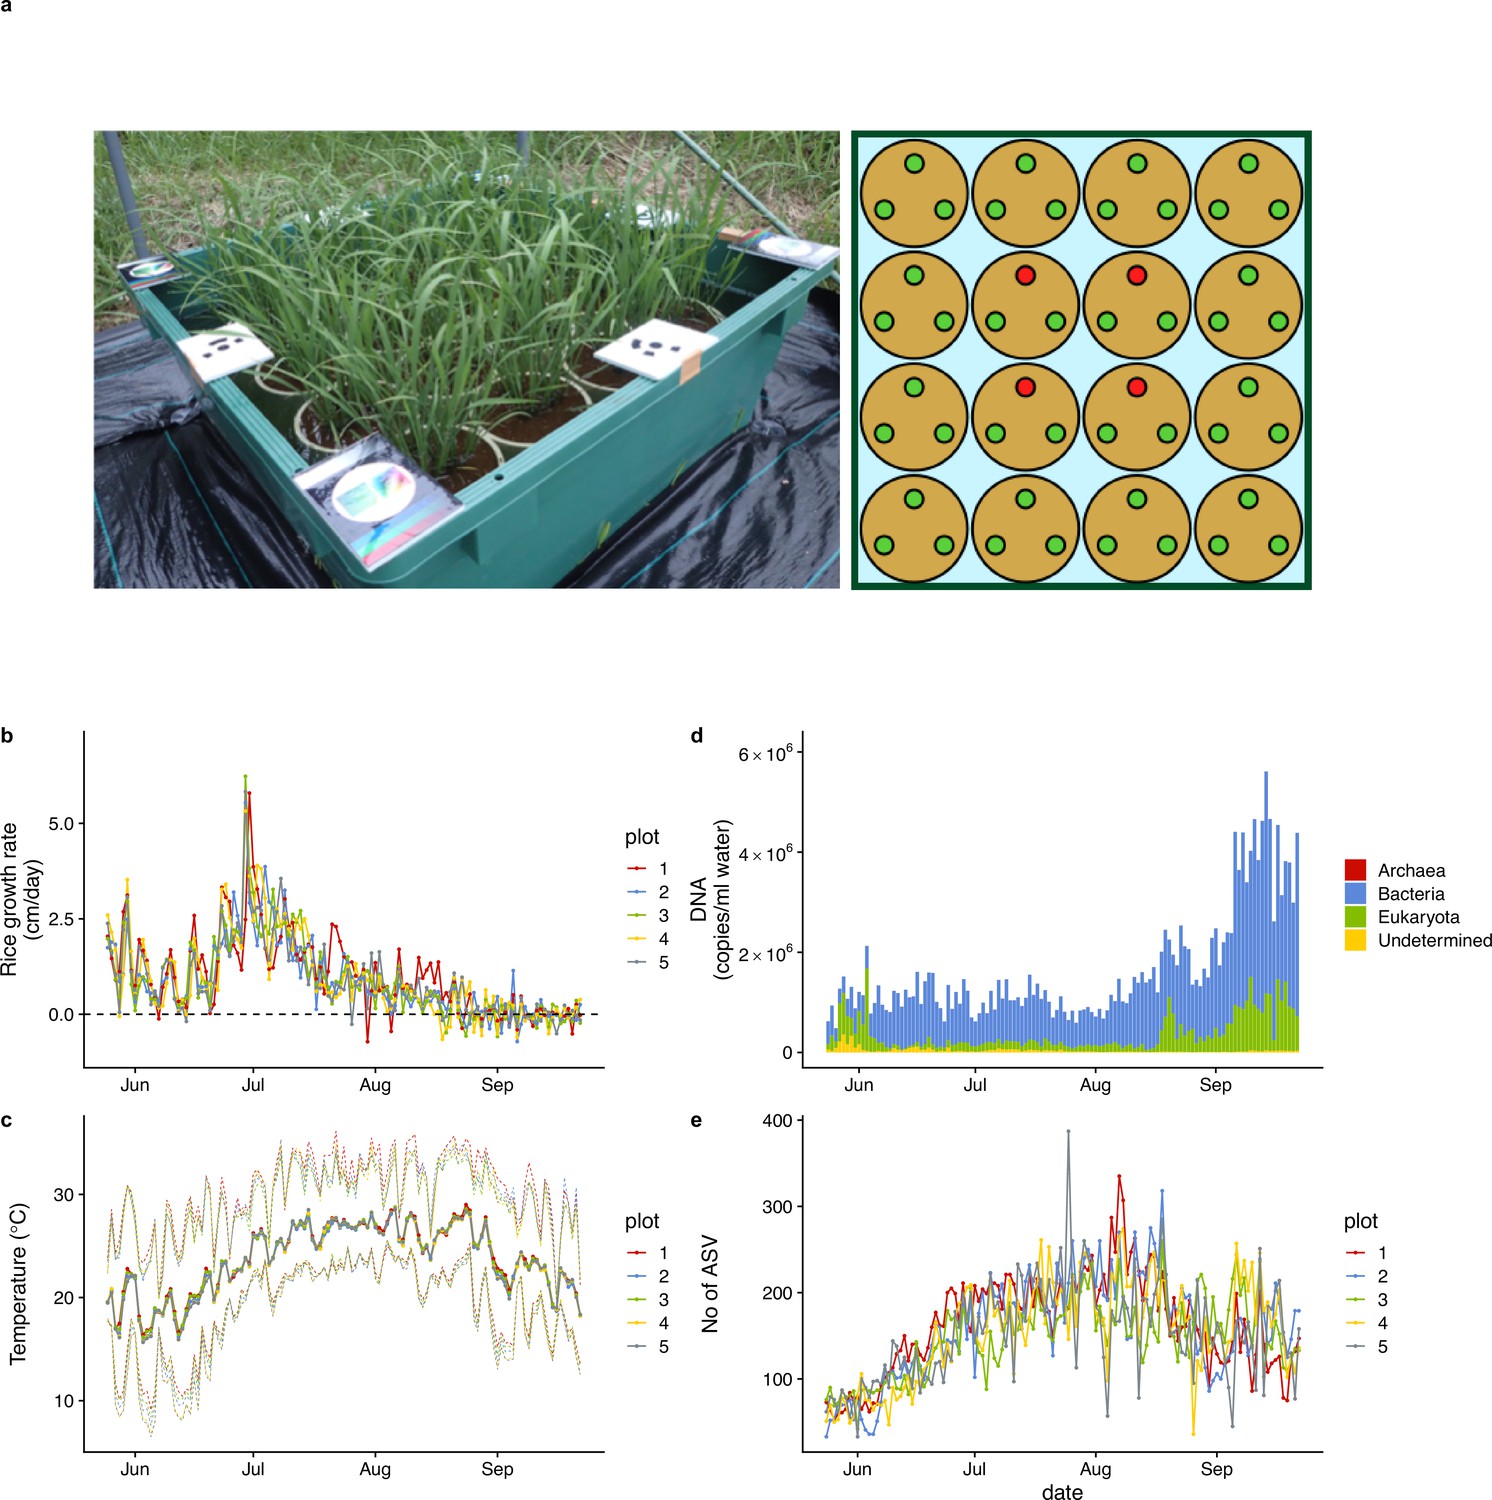
Rice plot, growth rate, air temperature, and ecological community dynamics.
(a) 90 cm × 90 cm rice plot and Wagner pot alignments. Three rice individuals were grown in each pot. Heights and SAPD of the four red individuals in each plot were measured every day during the monitoring period, and the average values of the four individuals were regarded as representative values for each plot. (b) Rice growth rate (cm/day). (c) Daily mean air temperature measured at each rice plot. Upper and lower dotted lines indicate daily maximum and minimum air temperature. (d) Ecological community compositions and average DNA copy numbers per ml water (reported in Ushio, 2022). (e) The number of amplicon sequence variants (ASVs) from each water sample (reported in Ushio, 2022). For (b), (c), and (e), different colors indicate data from different rice plots.
Figure 1—figure supplement 1
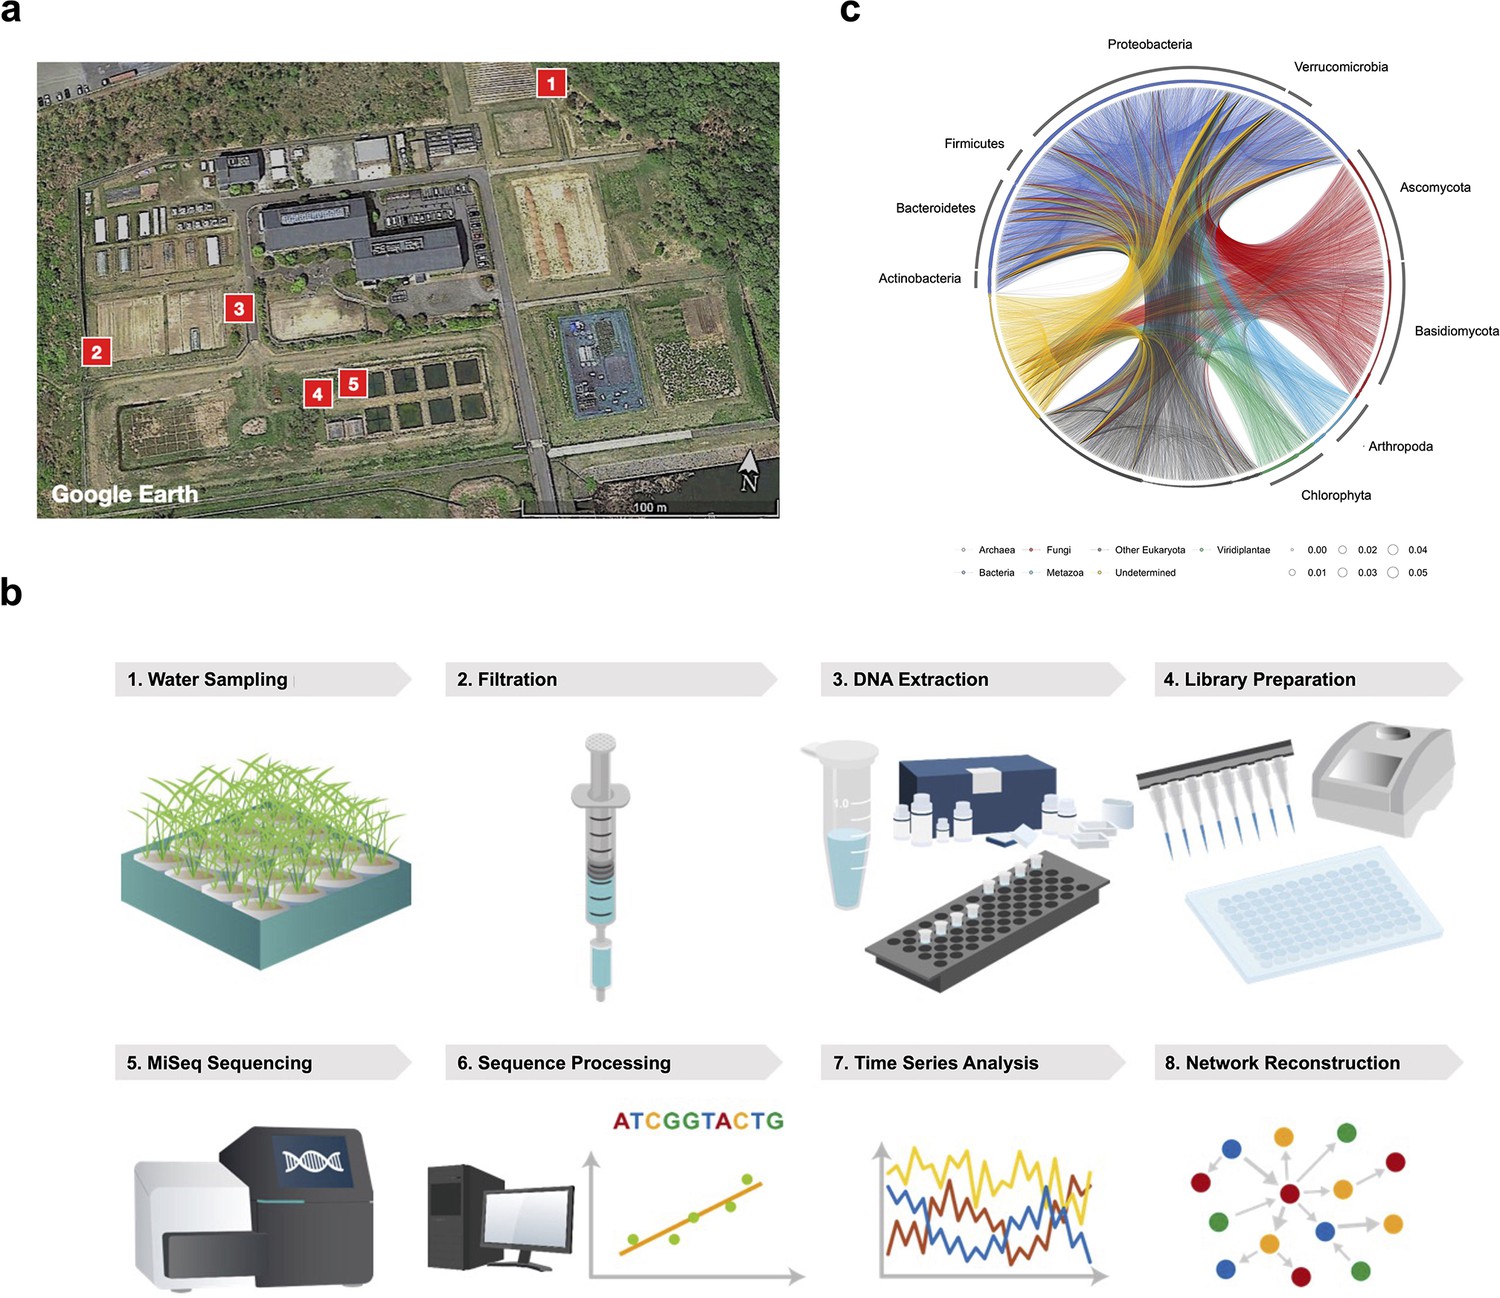
Monitoring framework of ecological community (as in Ushio, 2022).
(a) Locations of the five rice plots in 2017. Map image was modified from Google Earth. (b) Research framework to generate quantitative environmental DNA time series and network reconstruction. (c) Ecological community network reconstructed by non- linear time series. These figures were reproduced from Ushio, 2022.
Figure 1—figure supplement 2
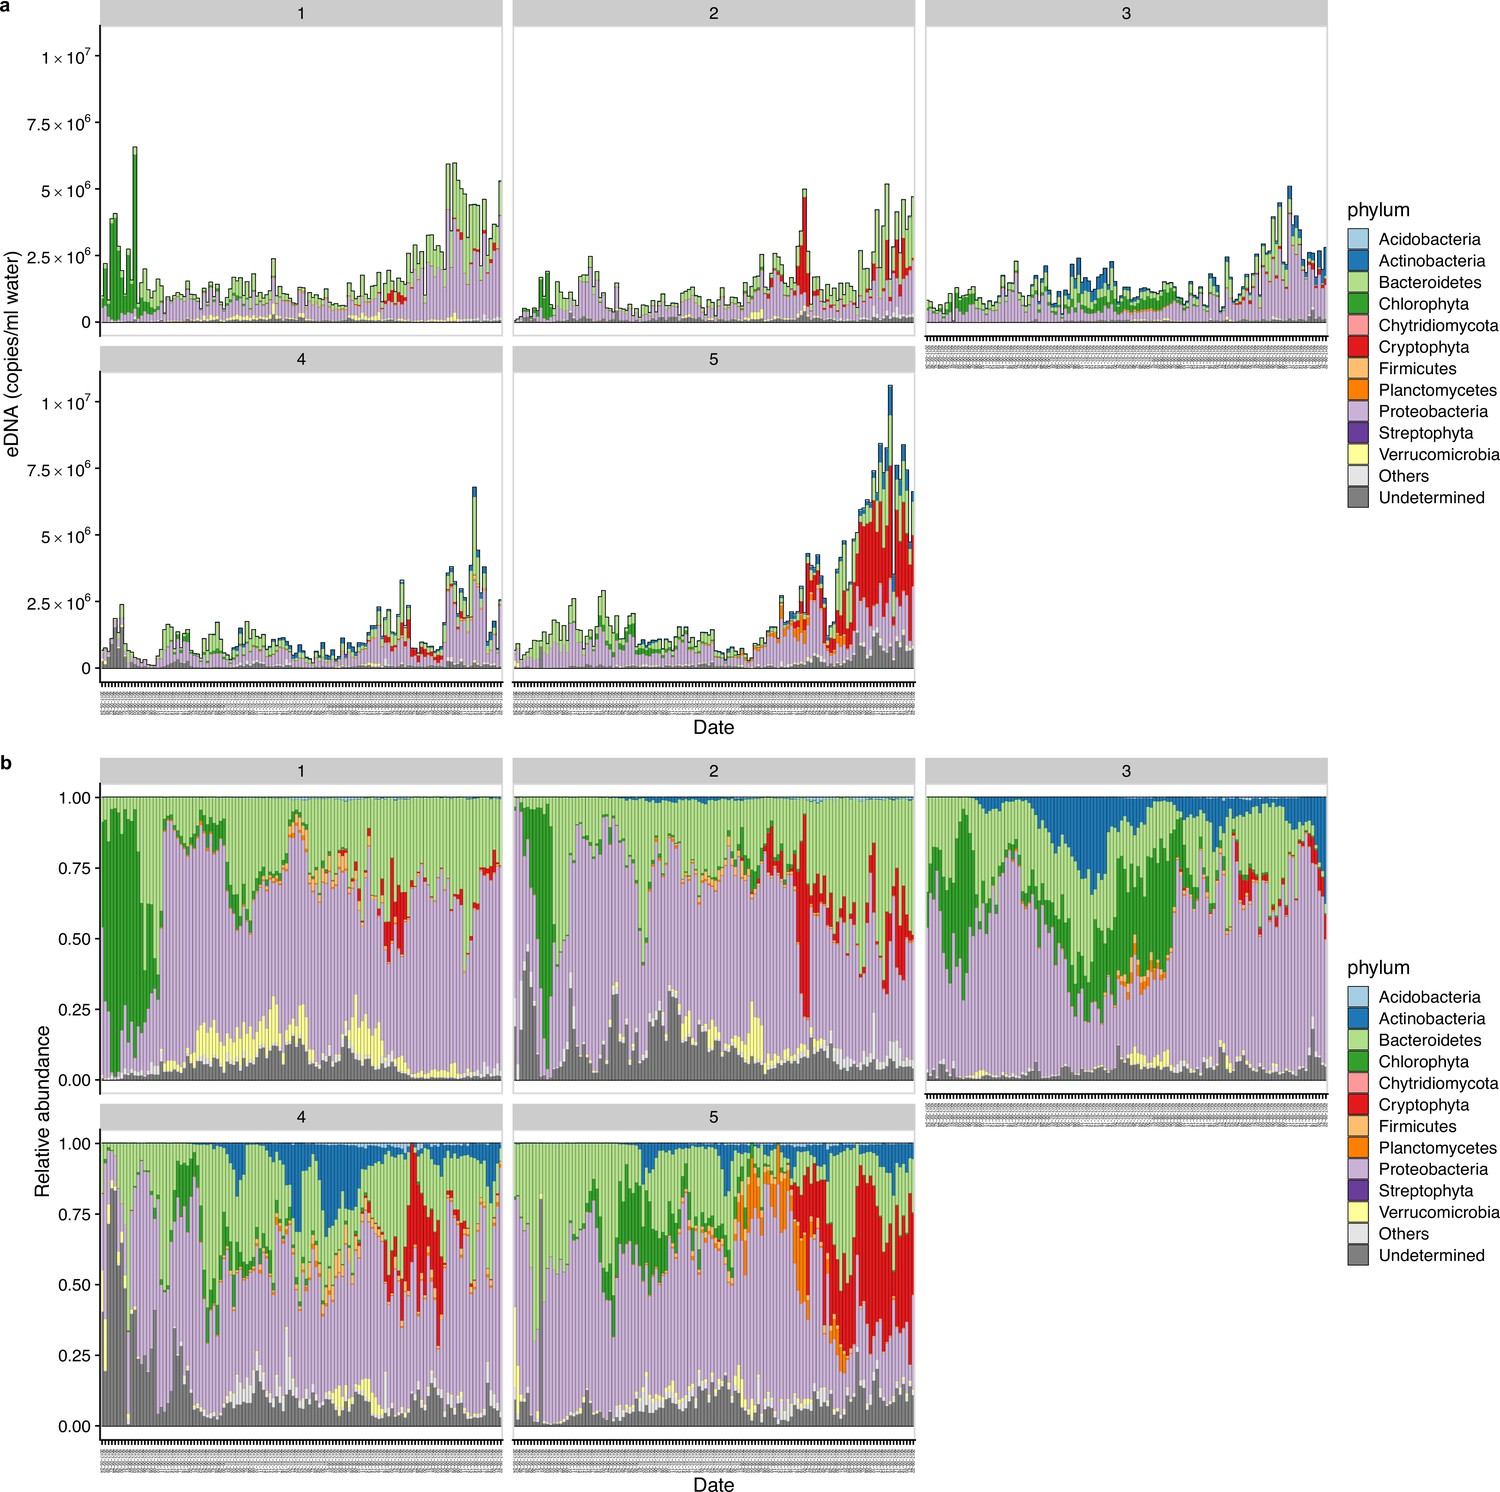
Environmental DNA (eDNA)-based monitoring of ecological communities in 2017.
(a) eDNA concentrations of ecological communities. The number on each panel indicates each plot. (b) Relative abundance of ecological communities. The data was reported in Ushio, 2022.
Figure 2
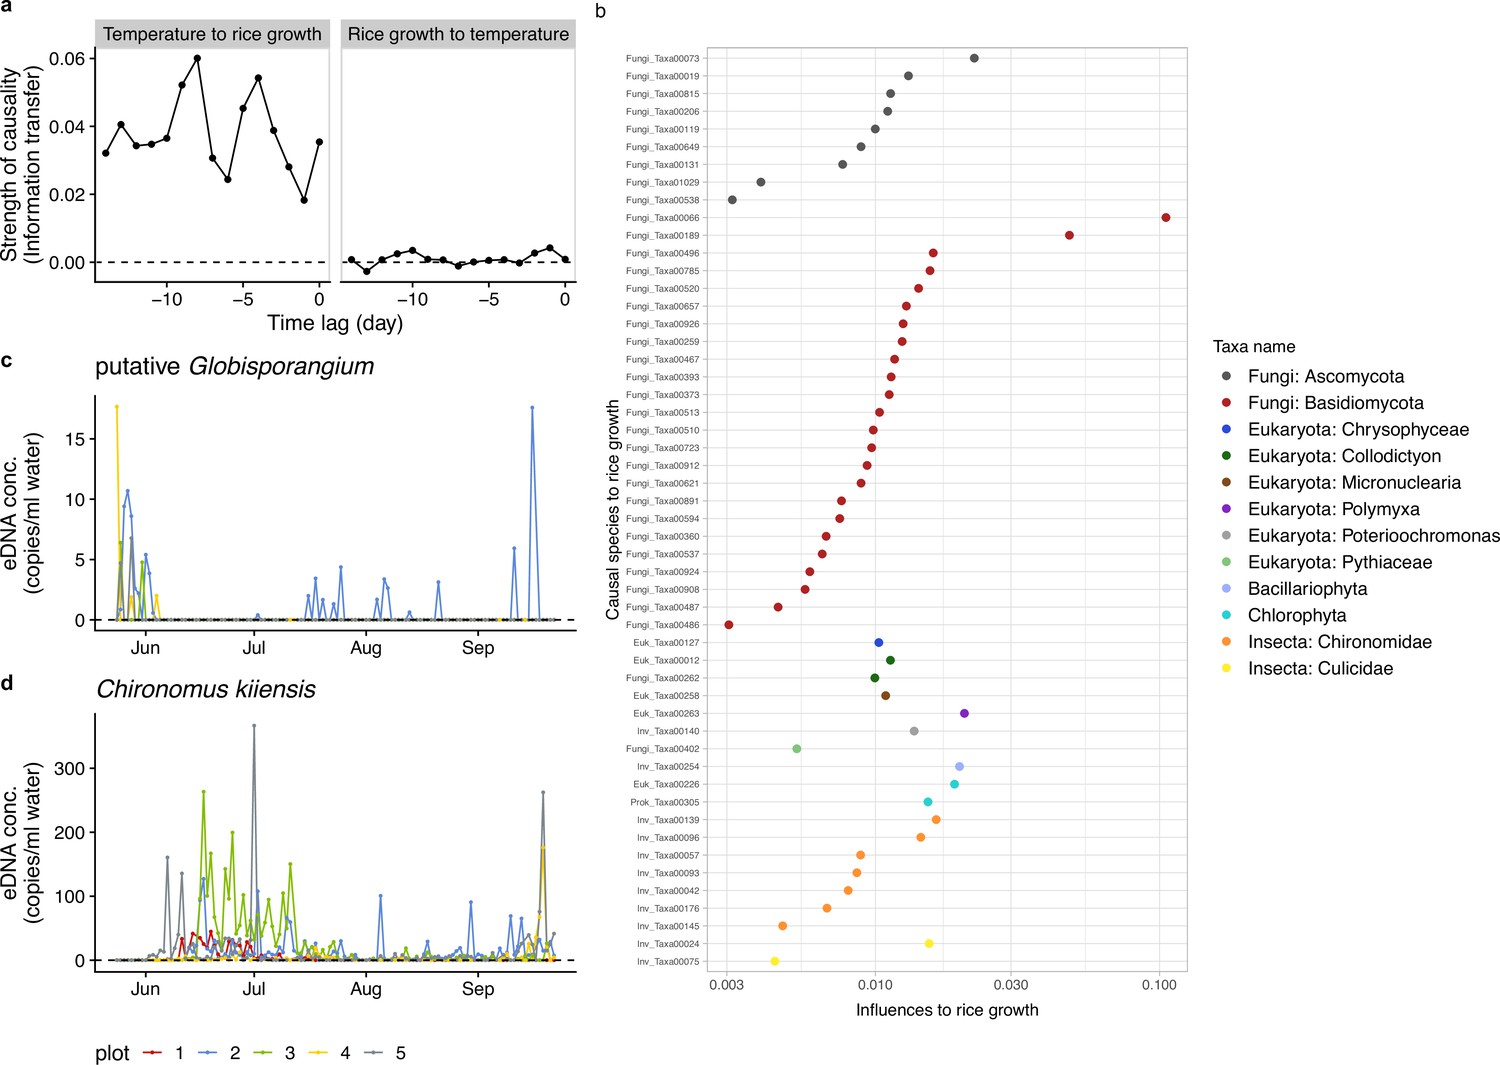
Information transfer between rice growth and ecological community members.
(a) An example of the results of the unified information-theoretic causality (UIC) analysis. Information transfer between air temperature and rice growth rates was quantified. Much higher information transfer was detected from air temperature to rice growth (left panel) compared with the opposite direction (right panel). (b) Strength of causal influence from ecological community members to rice growth. Transfer entropy (TE) quantified by the UIC method was used as an index of causal influence. Colors indicate taxa assigned to ASVs. y-axis indicates ASV ID. Note that the prefix (e.g. ‘Fungi_’) of the IDs corresponds a major target group of the primer and does not necessarily indicate a taxonomic group assigned to the ASV (see Supplementary file 1). (c) eDNA dynamics of putative Globisporangium nunn (Fungi_Taxa00402 in Supplementary file 1). (d) eDNA dynamics of Chironomus kiiensis (total DNA copy numbers of five midge ASVs). For (c) and (d), different colors indicate data from different rice plots.
Figure 3 with 2 supplements
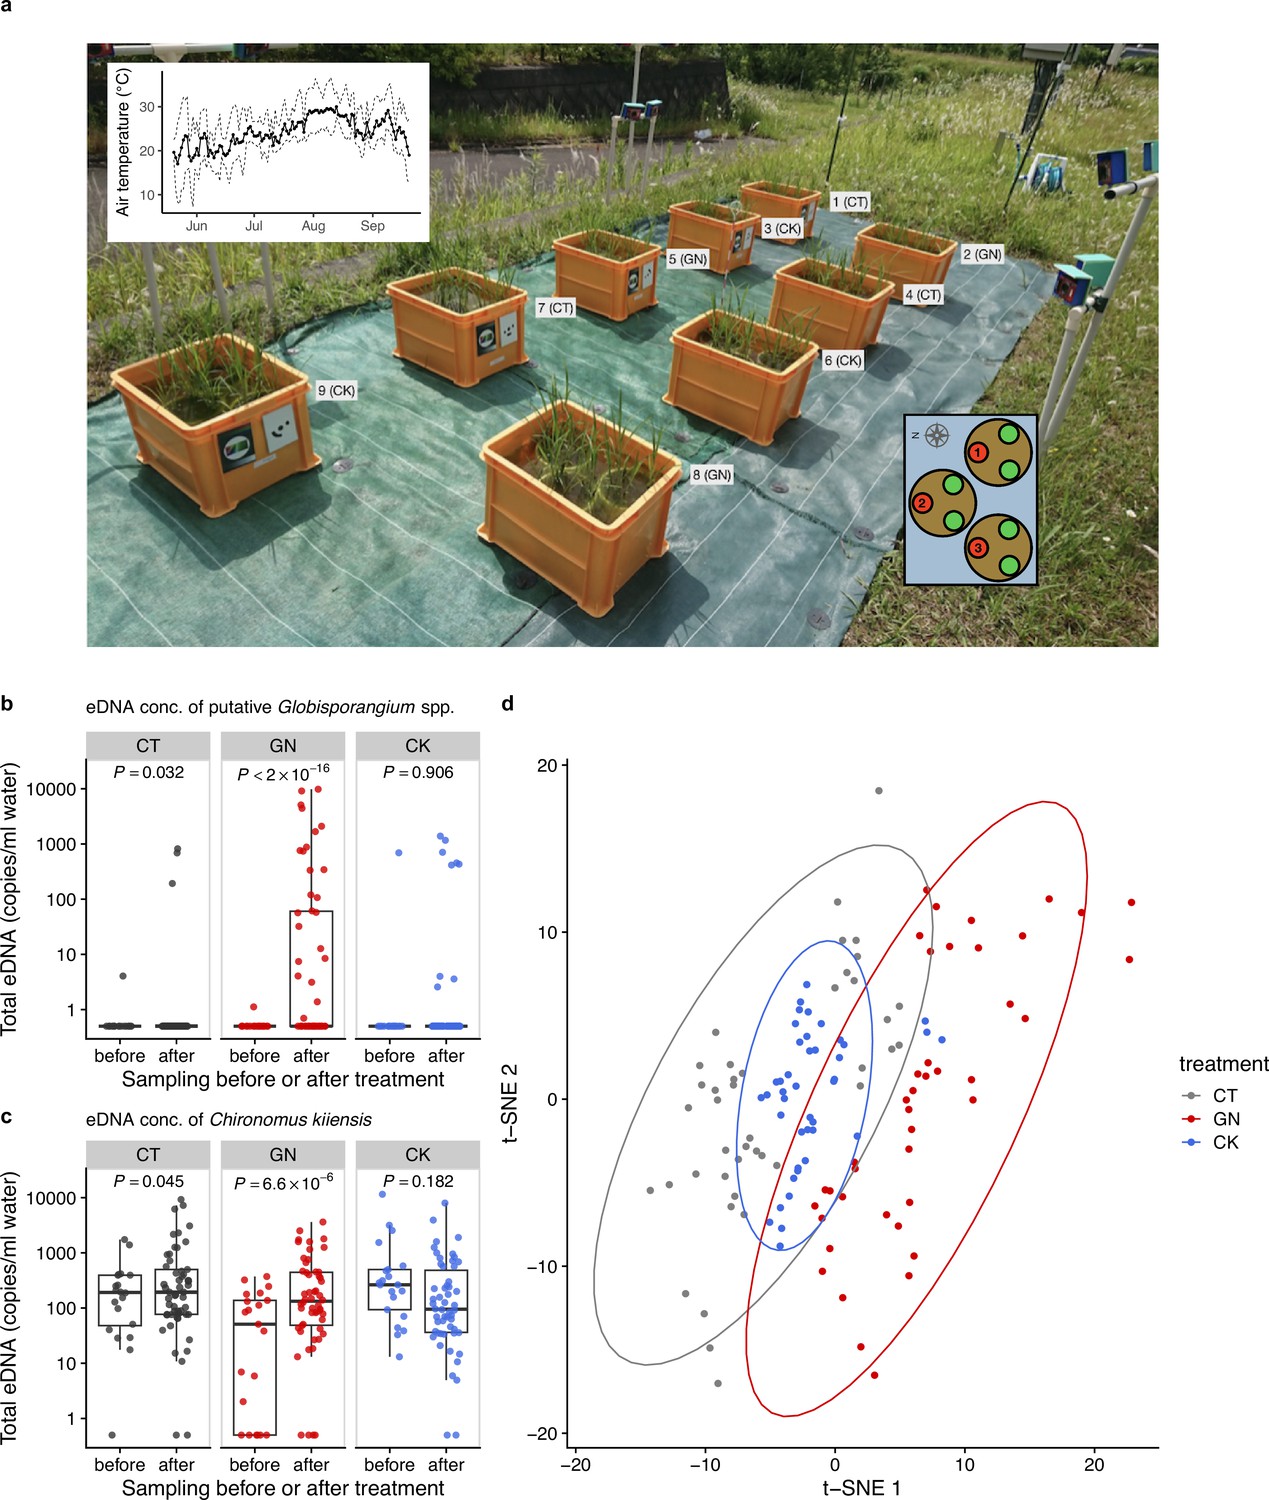
The manipulation experiment performed in 2019 and ecological community compositions before and after the manipulation.
(a) Setting of the manipulation experiment in 2019. The number and characters next to each plot indicate the plot number and treatment. The left-top inset shows daily mean air temperature (thick line) and daily maximum and minimum air temperature (dashed lines). The right-bottom inset shows three individuals (red and green points) in each Wagner pot, and the number in each red individual indicates the pot location number. Heights and SPAD of the red individuals were measured. Total eDNA copy numbers of (b) putative Globisporangium spp. and (c) midge (Chironomus kiiensis) in the rice plots. ‘before’ and ‘after’ indicate ‘from 18 June to 24 June’ and ‘from 25 June to 12 July’, respectively. (d) Overall community compositions after the manipulation. Gray, red, and blue indicate CT (control), GN (Globisporangium nunn added), and CK (Chironomus kiiensis removed) treatments, respectively.
Figure 3—figure supplement 1
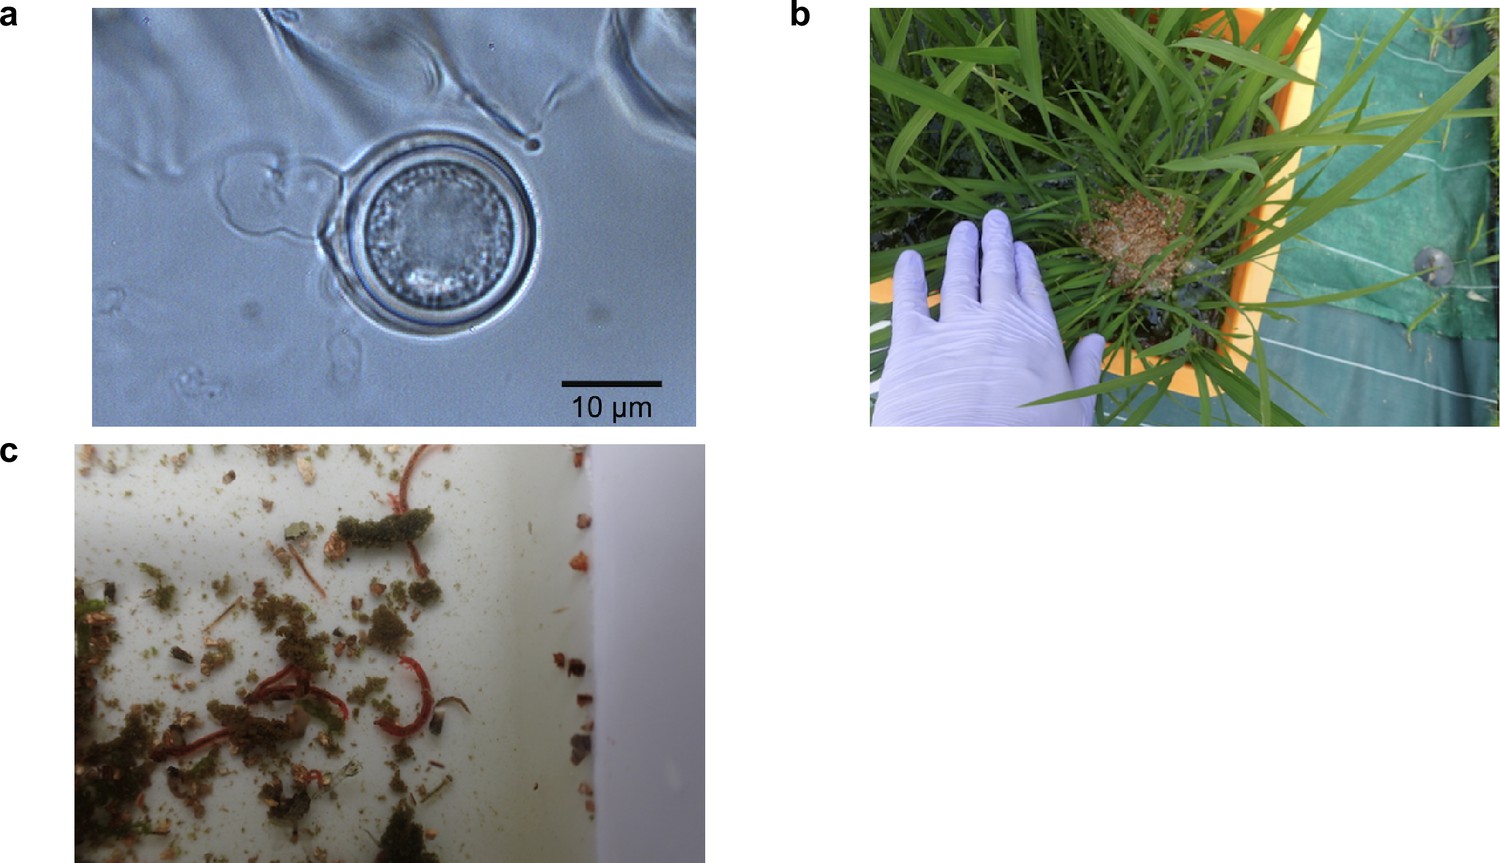
Globisporangium nunn and Midge (Chironomus kiiensis) used in the manipulation experiment in 2019.
(a) Microscopic image of G. nunn (photo by M. Tojo). (b) G. nunn was incubated in vermiculite and added to the rice plots. For the control and midge-removed treatments, vermiculite without G. nunn was added. (c) Larvae of midge (C. kiiensis) naturally colonized in the rice plots (the larvae in the photo are mostly 0.5–2 cm). The larvae were manually removed by a commercial net with φ1 mm mesh.
Figure 3—figure supplement 2

Environmental DNA (eDNA)-based monitoring of ecological communities in 2019.
(a) eDNA concentrations of ecological communities. The number on each panel and characters in the parenthesis indicates the plot number and treatment, respectively. The blue line in each panel indicates the intensive monitoring period (i.e. daily monitoring from 18 June to 12 July). (b) Relative abundance of ecological communities.
Figure 4 with 1 supplement
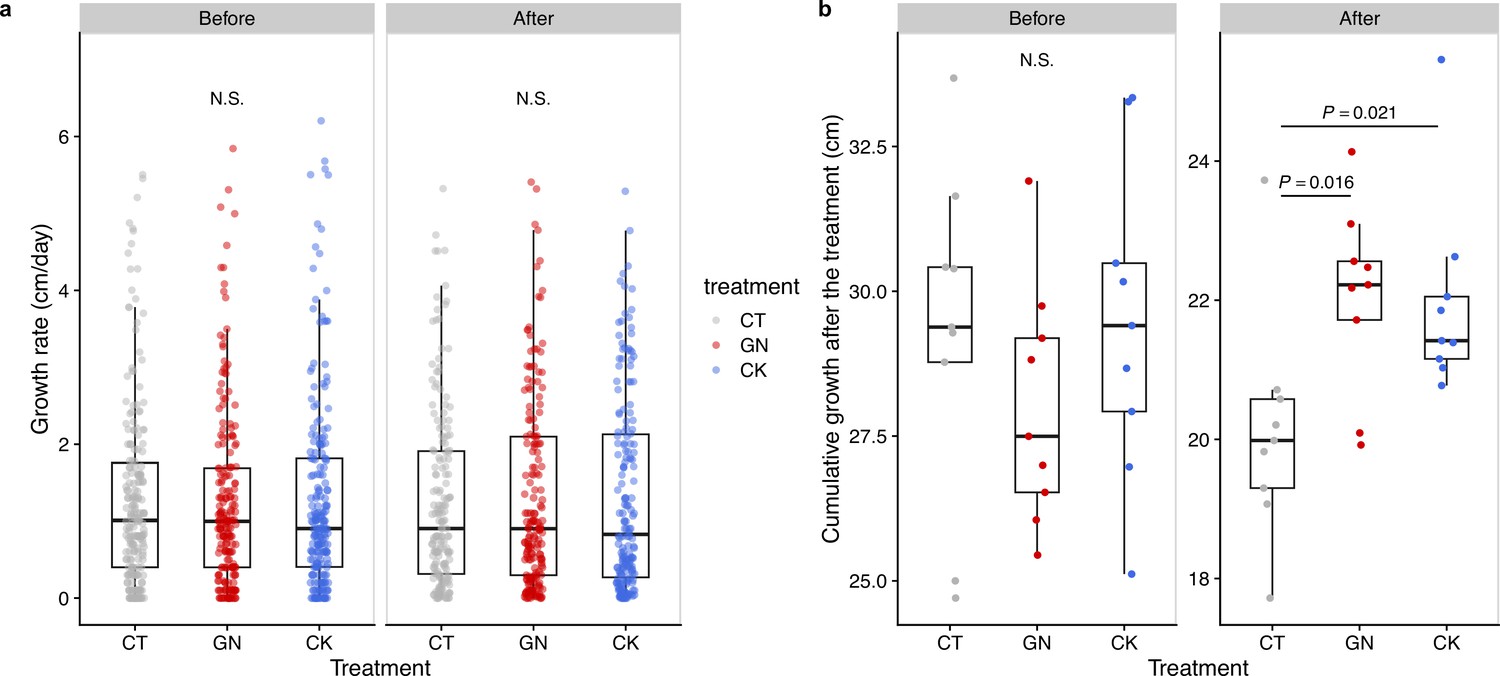
Rice growth rate and cumulative growth before and after the manipulation experiment in 2019.
(a) Growth rates and (b) cumulative growth of the rice individuals in the three treatments (CT = control; GN = Globisporangium nunn added; CK = Chironomus kiiensis removed) before and after the manipulation (cumulative growth was calculated by summing up height growth before the third manipulation or during 10 days after the third manipulation).
Figure 4—figure supplement 1
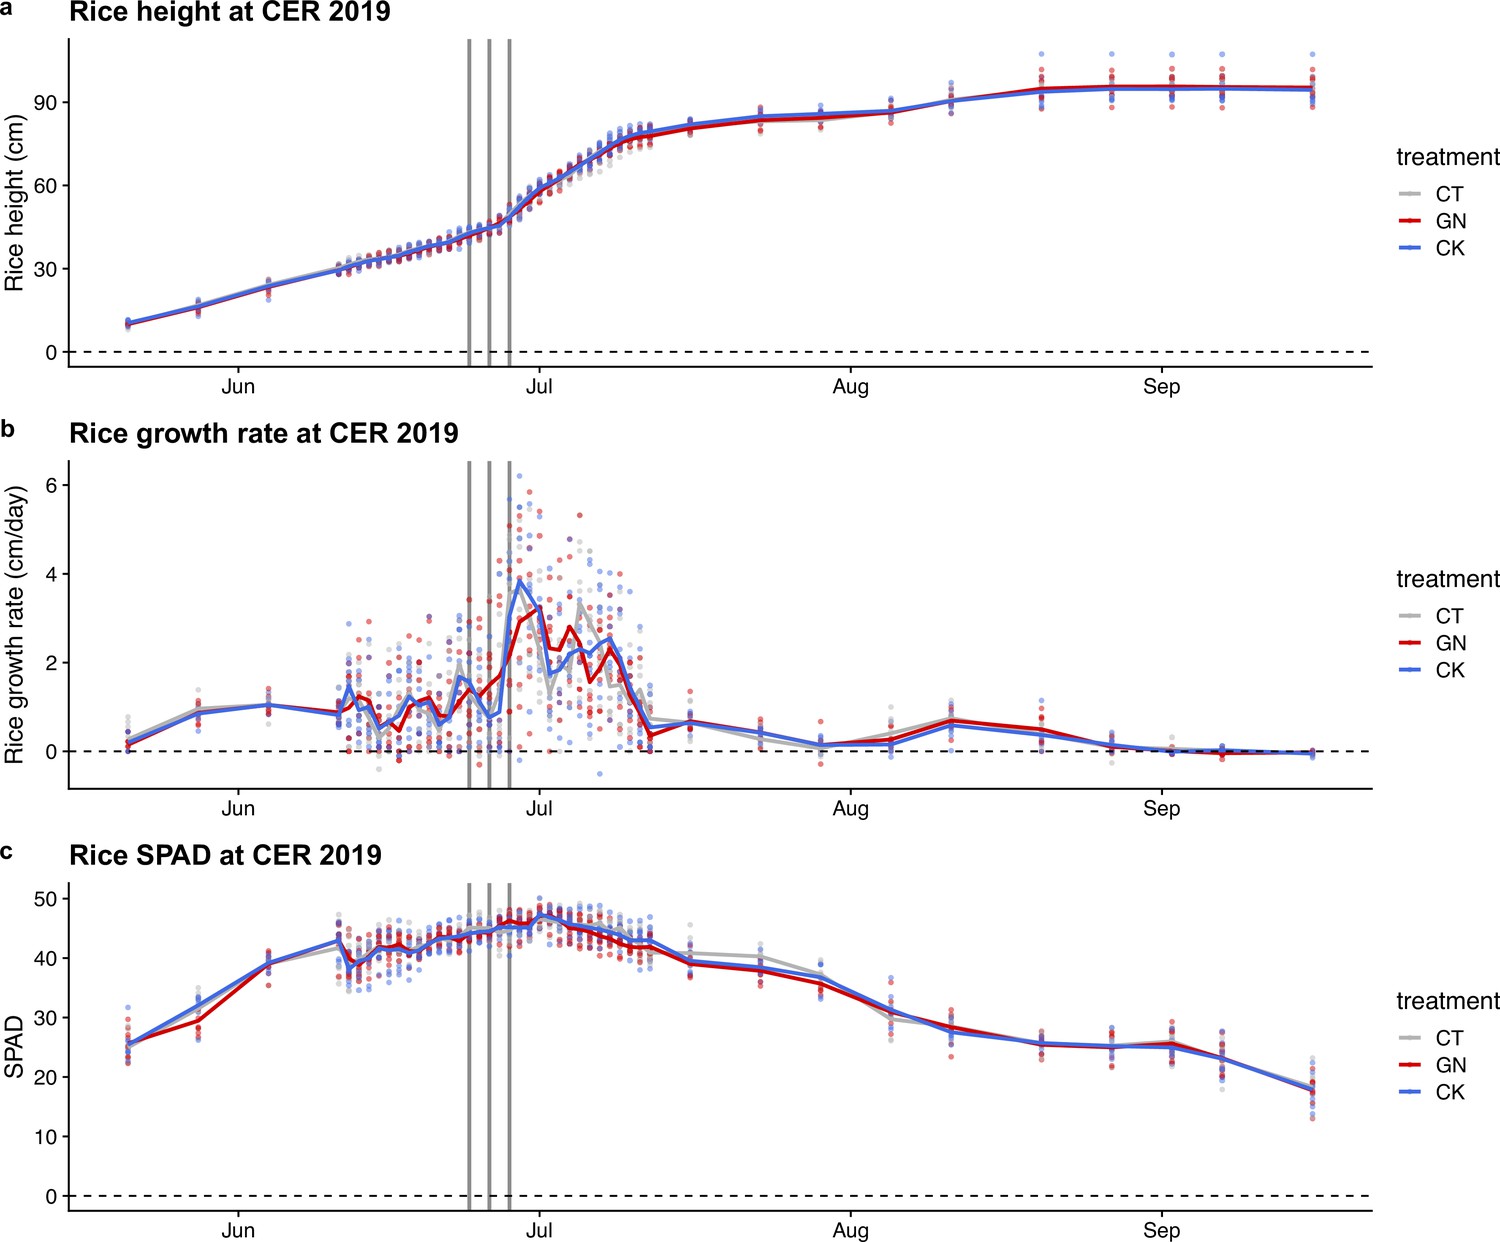
Rice growth trajectory in 2019.
(a) Rice height, (b) growth rate, and (c) SPAD values of the rice during the growing season in 2019. Points indicate observed values, lines indicate mean trends, and gray lines indicate the field manipulation experiments. Colors indicate the treatments.
Figure 5 with 1 supplement
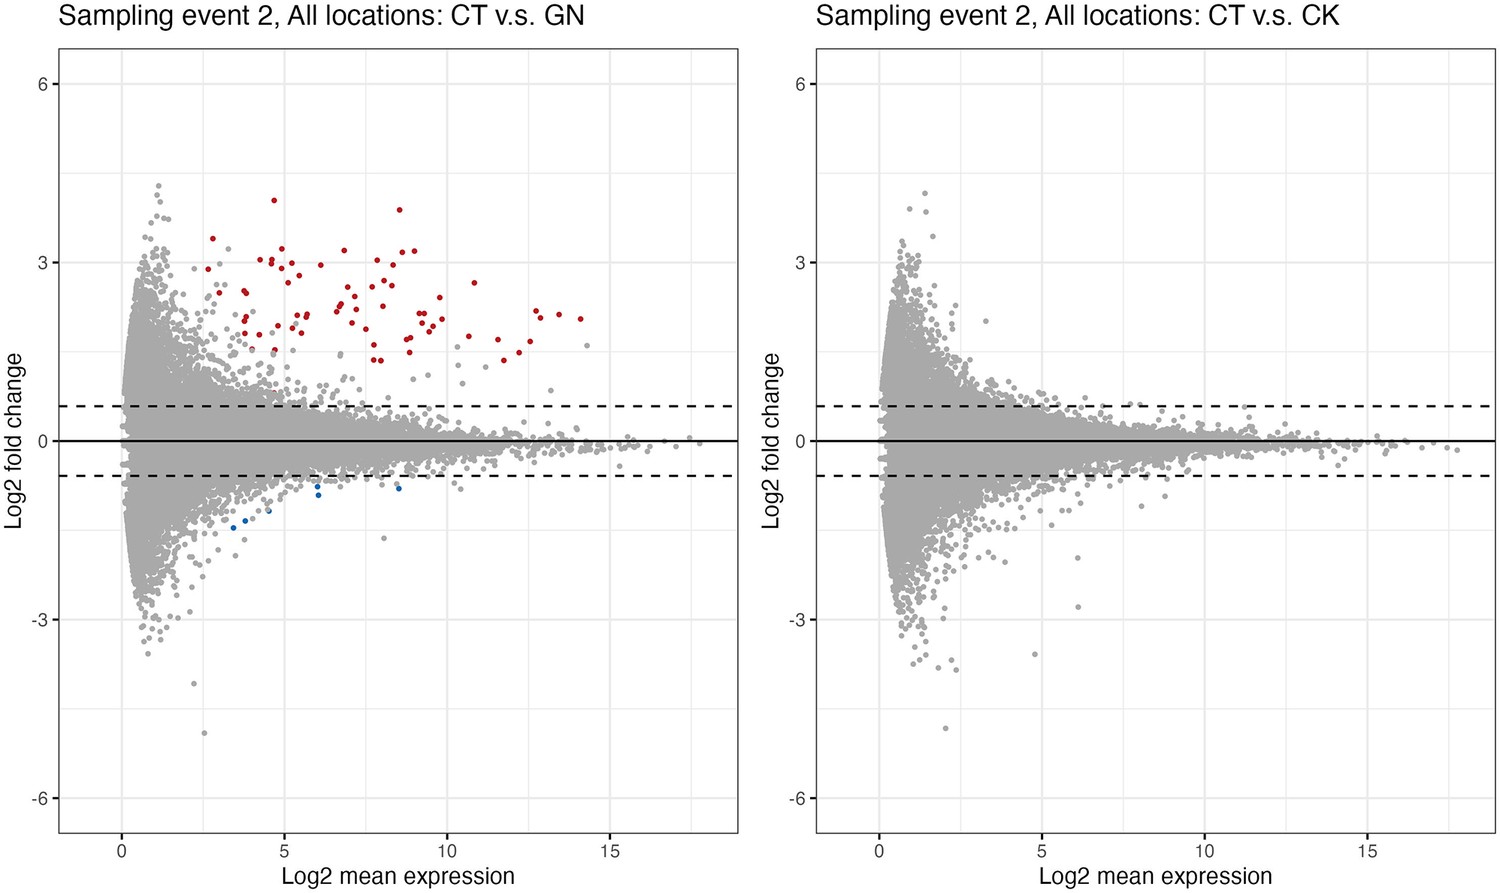
Differential expression genes analysis.
(a)Globisporangium nunn-added and (b)Chironomus kiiensis-removed treatment. Red and blue points indicate significant up- and down-regulated genes, respectively. Upper and lower dashed lines indicate lo2(1.5) and −log2(1.5), respectively.
Figure 5—figure supplement 1
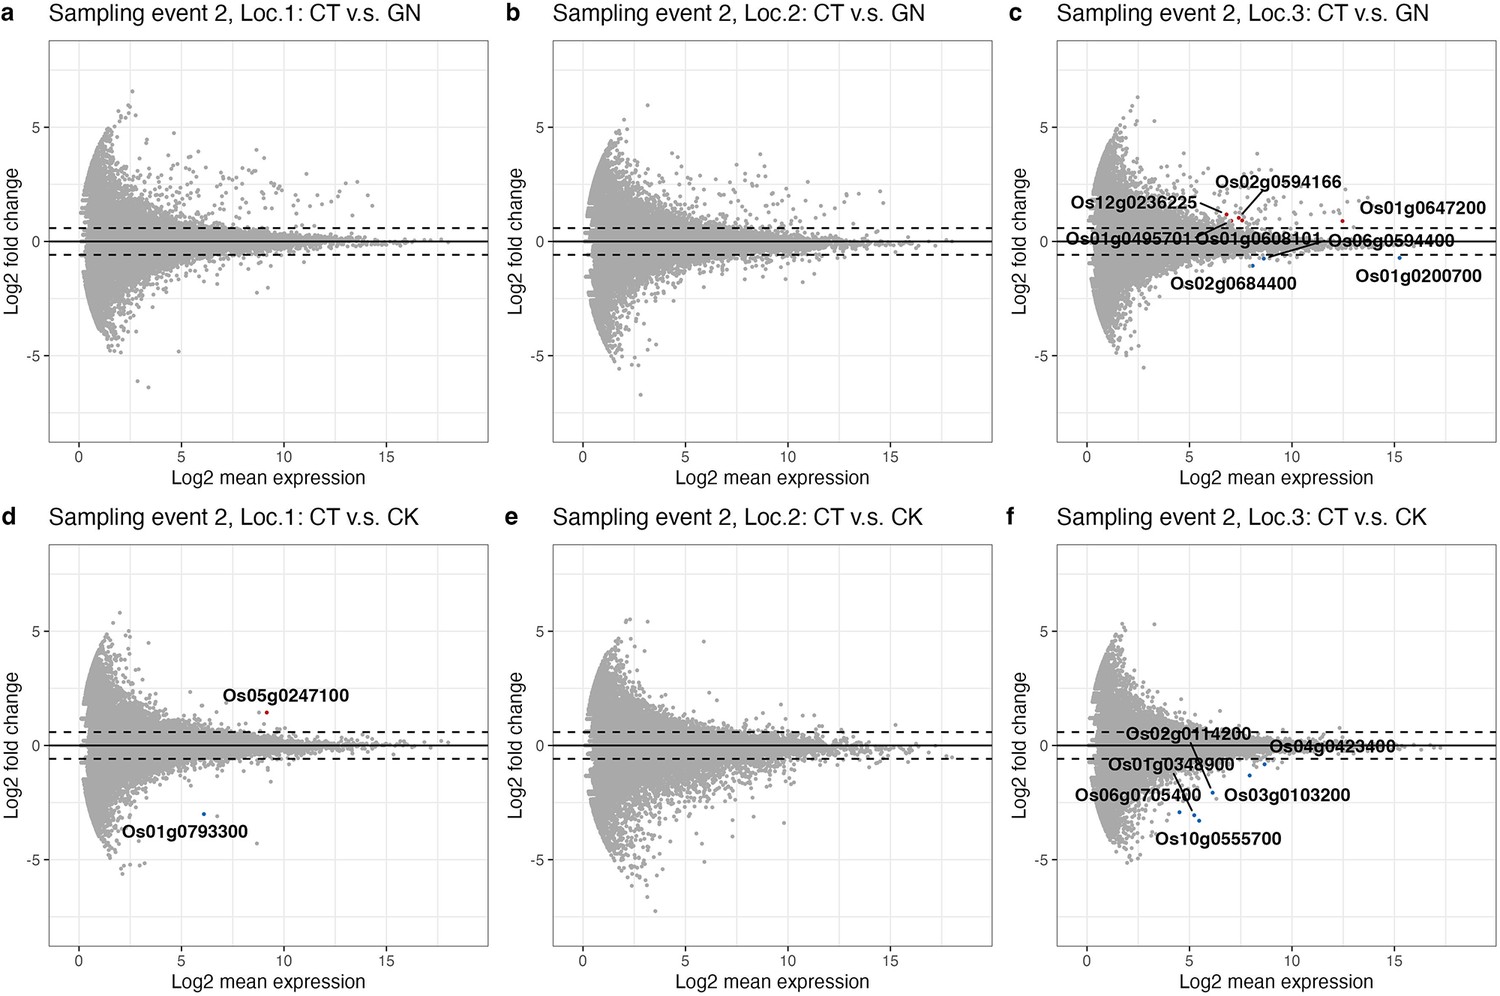
Differential expression gene (DEG) patterns for each Wagner pot (Pot location-specific analysis).
DEG for (a) location 1, (b) location 2, and (c) location 3 for the control (CT) versus Globisporangium nunn-added (GN) treatments. (d-f) DEG analysis for the control versus Chironomus kiiensis-removed (CK) treatments for rice grown at locations 1–3. Red and blue points indicate significant up- and down-regulated genes, respectively. Upper and lower dashed lines indicate log2(1.5) and − log2 (1.5), respectively.
Figure 6
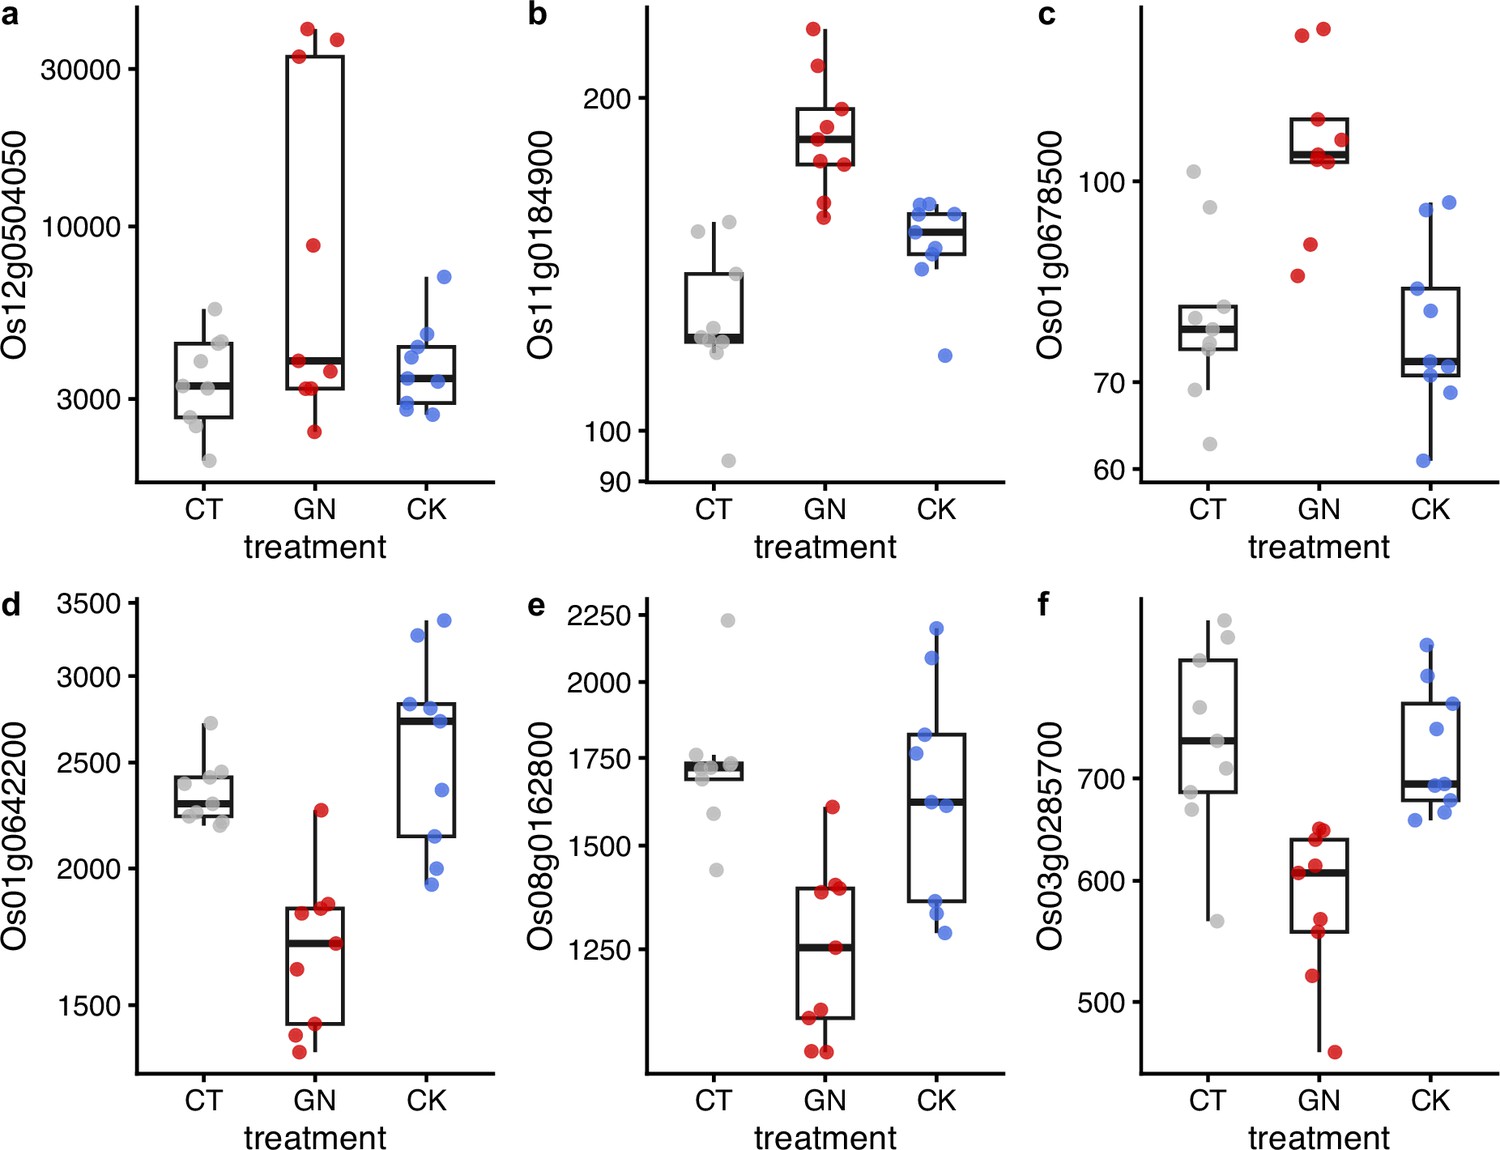
Examples of differentially expressed genes after the manipulation experiment.
Results of (a) Os12g0504050, (b) Os01g0642200, (c) Os08g0162800, (d) Os11g0184900, (e) Os03g0285700, and (f) Os01g0678500 are presented. y-axis represents DESeq2-normalized read counts. Gray, red, and blue indicate CT (control), GN (Globisporangium nunn added), and CK (Chironomus kiiensis removed) treatments, respectively. The gene expressions of the GN treatment in all six genes are statistically clearly different from those of the other two treatments (p<0.0001) except for the panel GN vs. CK in c (p=0.00014) and GN vs. CK in (d) (p=0.0087).
Additional files
-
Supplementary file 1
Potential causal species for the rice growth.
- https://cdn.elifesciences.org/articles/87202/elife-87202-supp1-v2.xlsx
-
Supplementary file 2
Notes on Globiosporangium nunn.
- https://cdn.elifesciences.org/articles/87202/elife-87202-supp2-v2.xlsx
-
Supplementary file 3
Field monitoring schedule in 2019.
- https://cdn.elifesciences.org/articles/87202/elife-87202-supp3-v2.xlsx
-
Supplementary file 4
Effects of the field manipulations on eDNA concentrations of target species using an alternative model.
- https://cdn.elifesciences.org/articles/87202/elife-87202-supp4-v2.xlsx
-
Supplementary file 5
Effects of the field manipulations on the rice growth using an alternative model.
- https://cdn.elifesciences.org/articles/87202/elife-87202-supp5-v2.xlsx
-
Supplementary file 6
Rice yield data.
- https://cdn.elifesciences.org/articles/87202/elife-87202-supp6-v2.xlsx
-
Supplementary file 7
Meta-data for rice leaf samples for RNA expression analysis.
- https://cdn.elifesciences.org/articles/87202/elife-87202-supp7-v2.xlsx
-
Supplementary file 8
List of differentially expressed genes in the GN treatment.
- https://cdn.elifesciences.org/articles/87202/elife-87202-supp8-v2.xlsx
-
Supplementary file 9
List of location-specific differentially expressed genes.
- https://cdn.elifesciences.org/articles/87202/elife-87202-supp9-v2.xlsx
-
MDAR checklist
- https://cdn.elifesciences.org/articles/87202/elife-87202-mdarchecklist1-v2.pdf
Download links
A two-part list of links to download the article, or parts of the article, in various formats.
Downloads (link to download the article as PDF)
Open citations (links to open the citations from this article in various online reference manager services)
Cite this article (links to download the citations from this article in formats compatible with various reference manager tools)
An ecological network approach for detecting and validating influential organisms for rice growth
eLife 12:RP87202.
https://doi.org/10.7554/eLife.87202.3


