Acute stress reduces effortful prosocial behaviour
- Department of Cognition, Emotion, and Methods in Psychology, Faculty of Psychology, University of Vienna, Austria
- Zurich Center for Neuroeconomics, Department of Economics, University of Zurich, Switzerland
- Vienna Cognitive Science Hub, University of Vienna, Austria
- Centre for Microbiology and Environmental Systems Science, University of Vienna, Austria
- Centre for Human Brain Health, Institute of Mental Health and School of Psychology, University of Birmingham, United Kingdom
- Institute for Mental Health, School of Psychology, University of Birmingham, United Kingdom
Figures
Figure 1 with 1 supplement
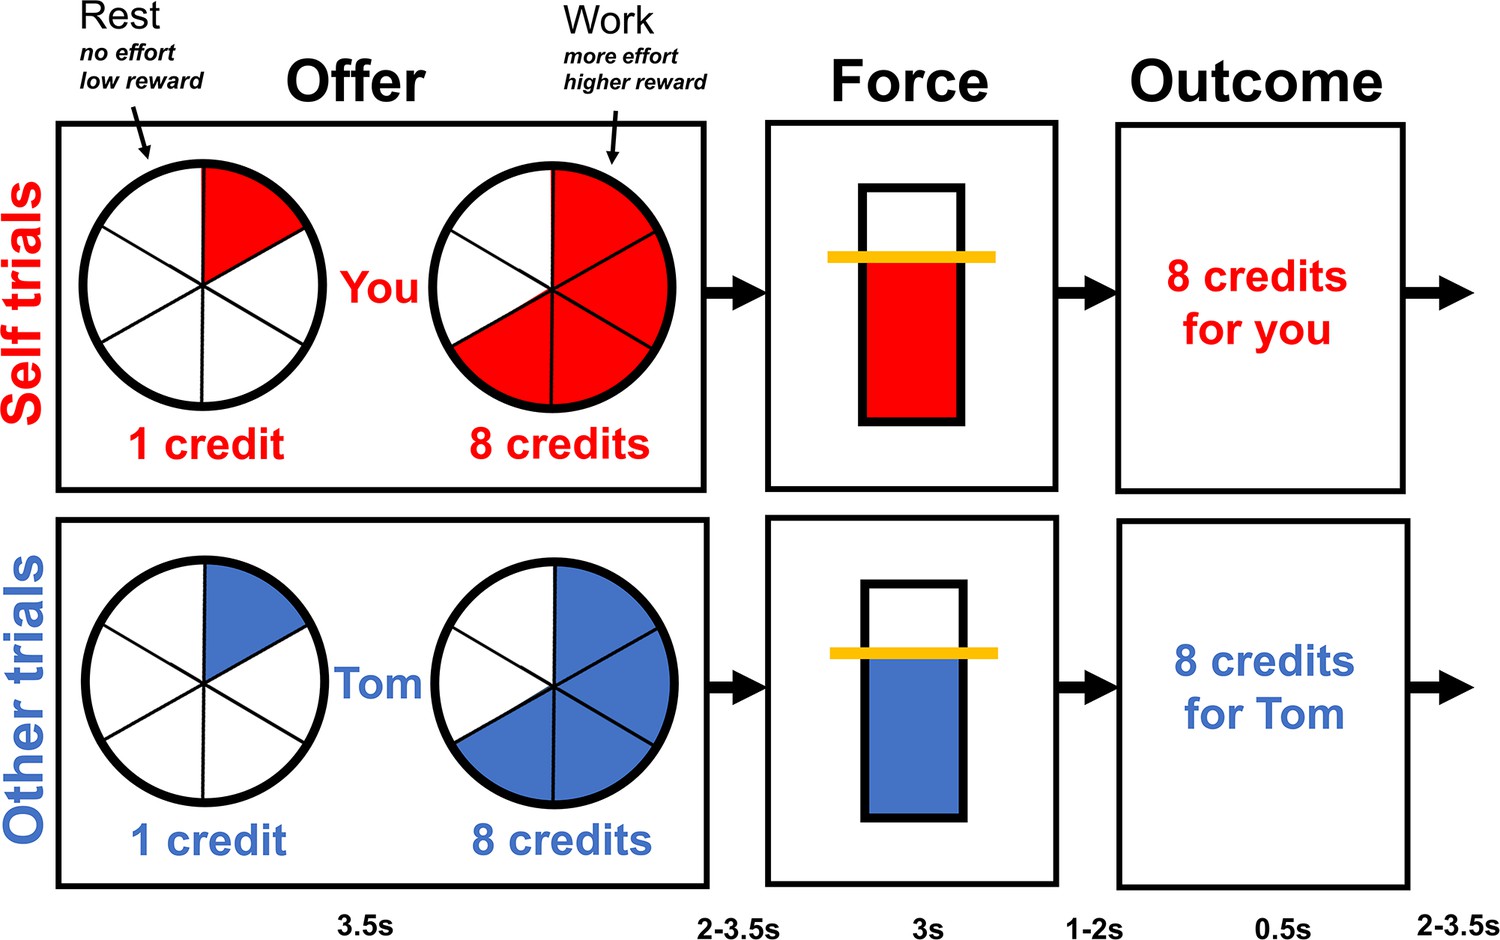
Overview of the task structure.
During the offer phase, participants made choices between rest, a fixed low reward (1 credit) involving no effort, and work, a variable higher reward (2, 4, 6, 8, or 10 credits) involving more effort (30, 40, 50, 60, or 70% of participant’s individual maximum voluntary contraction [MVC]). Higher effort levels were indicated by a more filled in circle. Participants had 3.2 s to make their choice, and the chosen option was then highlighted with a box for 0.3 s. If participants decided to work, then during the force phase, they had to squeeze the hand dynamometer at the required effort level (shown by the yellow line) for 1 s during a 3-s window. If they decided to rest, then the yellow line was displayed at the bottom of the bar and participants did not have to squeeze. During the outcome phase, the number of credits participants earned either for themselves or the next participant was displayed. Each phase of each trial was separated by a variable jitter shown at the bottom of the diagram.
Figure 1—figure supplement 1
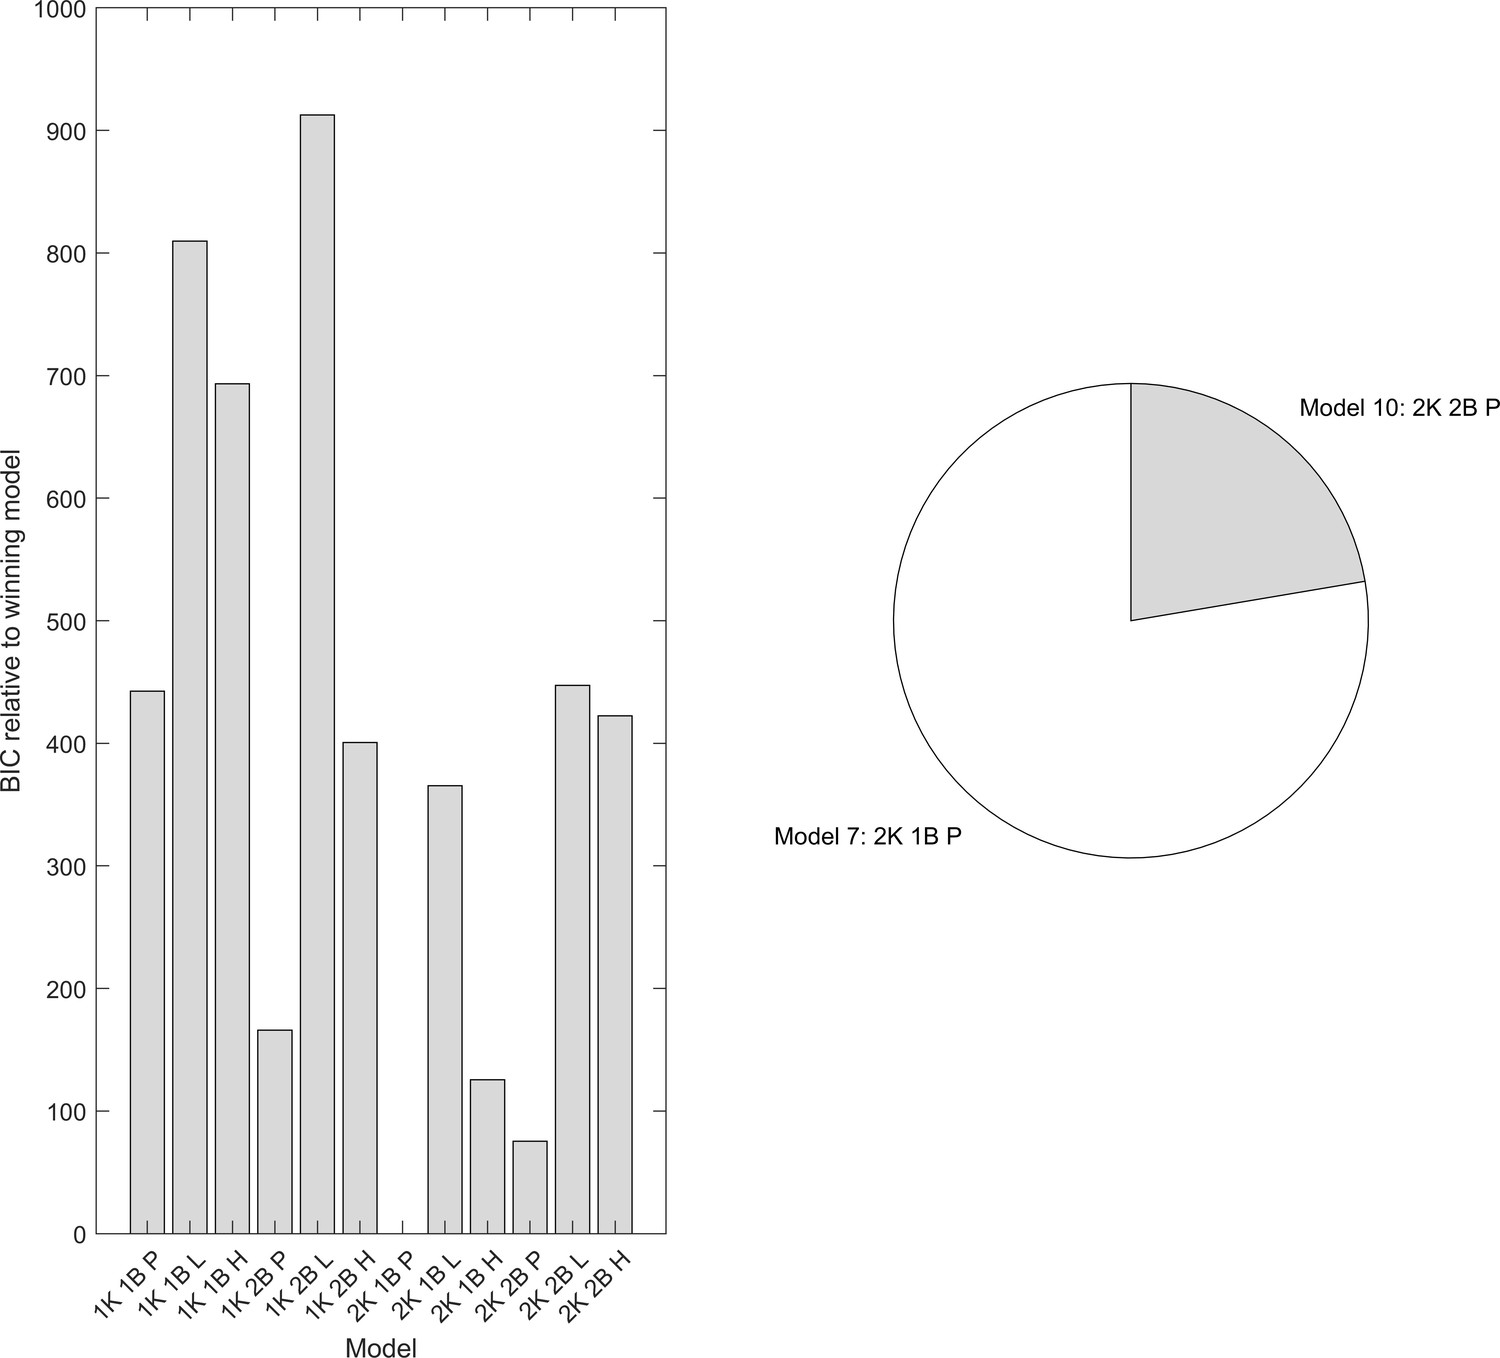
The relative summed Bayesian information criterion (BIC) values for each model.
Left panel: we used maximum likelihood estimation and a model comparison approach to determine which model best characterised participants’ choices. Twelve models were compared which included either one (1K) or two discount parameters (2K: Kself, Kother), either one (1B) or two (2B: βself, βother) temperature parameters, and either a parabolic (P), linear (L), or hyperbolic (H) discount function. Model 7 (2K 1B parabolic) had the lowest BIC across the whole sample. Model 10 (2K 2B parabolic) had the lowest BIC in the stress group. Right panel: across the whole sample, model 7 (for 77.66% of participants) was a better fit compared to model 10 (22.34%), so it was chosen for all analyses.
Figure 2 with 1 supplement
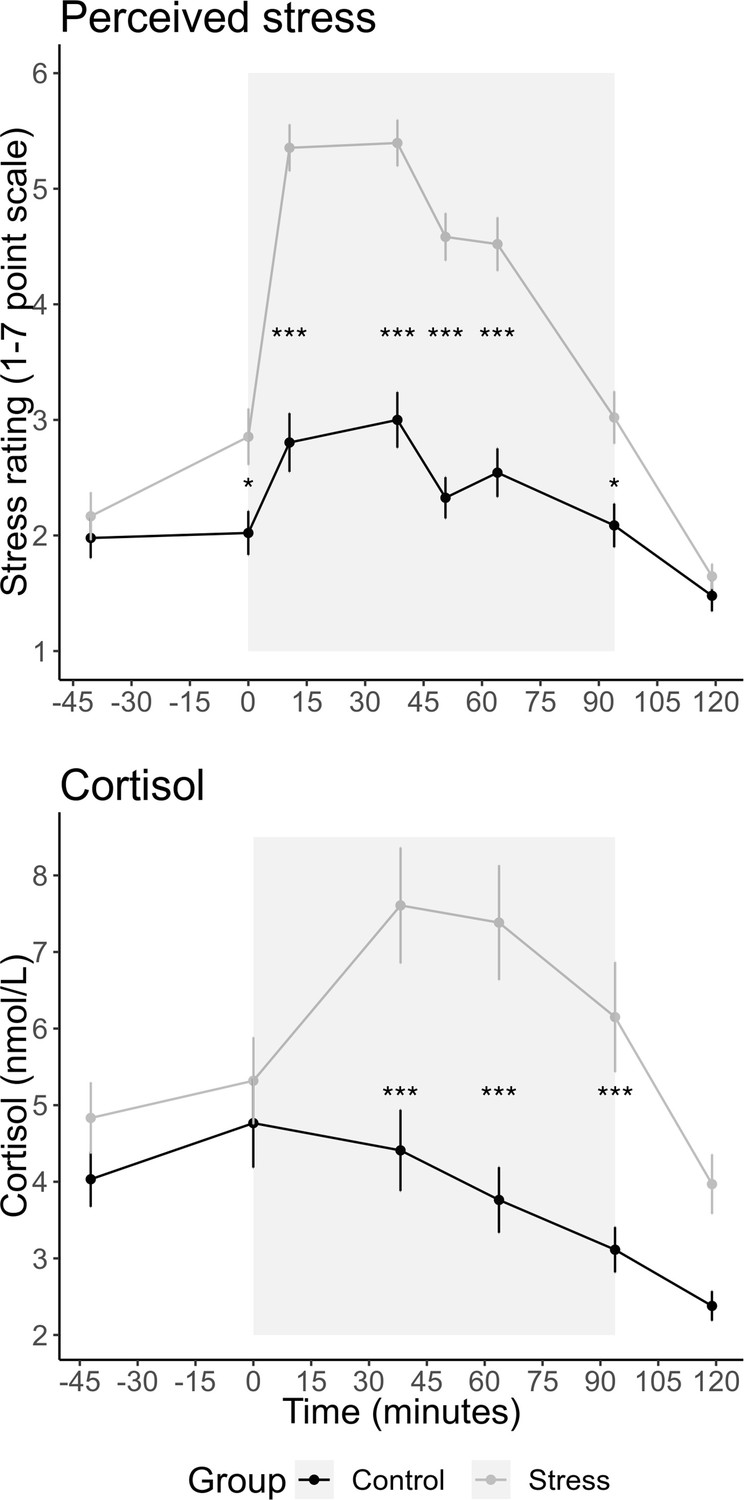
Mean (± SEM) salivary cortisol and stress ratings at each sample timepoint.
The grey box indicates the time participants spent in the scanner doing the tasks. Participants completed six runs of 25 trials for the prosocial effort task. Before each run, participants experienced either an adapted version of the Montreal Imaging Stress Test (MIST; Dedovic et al., 2005) or the counting task from the Trier Social Stress Test (Kirschbaum et al., 1993). The asterisks indicate the significant level for the pairwise tests having corrected for multiple comparisons (*p<0.05; ***p<0.001).
Figure 2—figure supplement 1
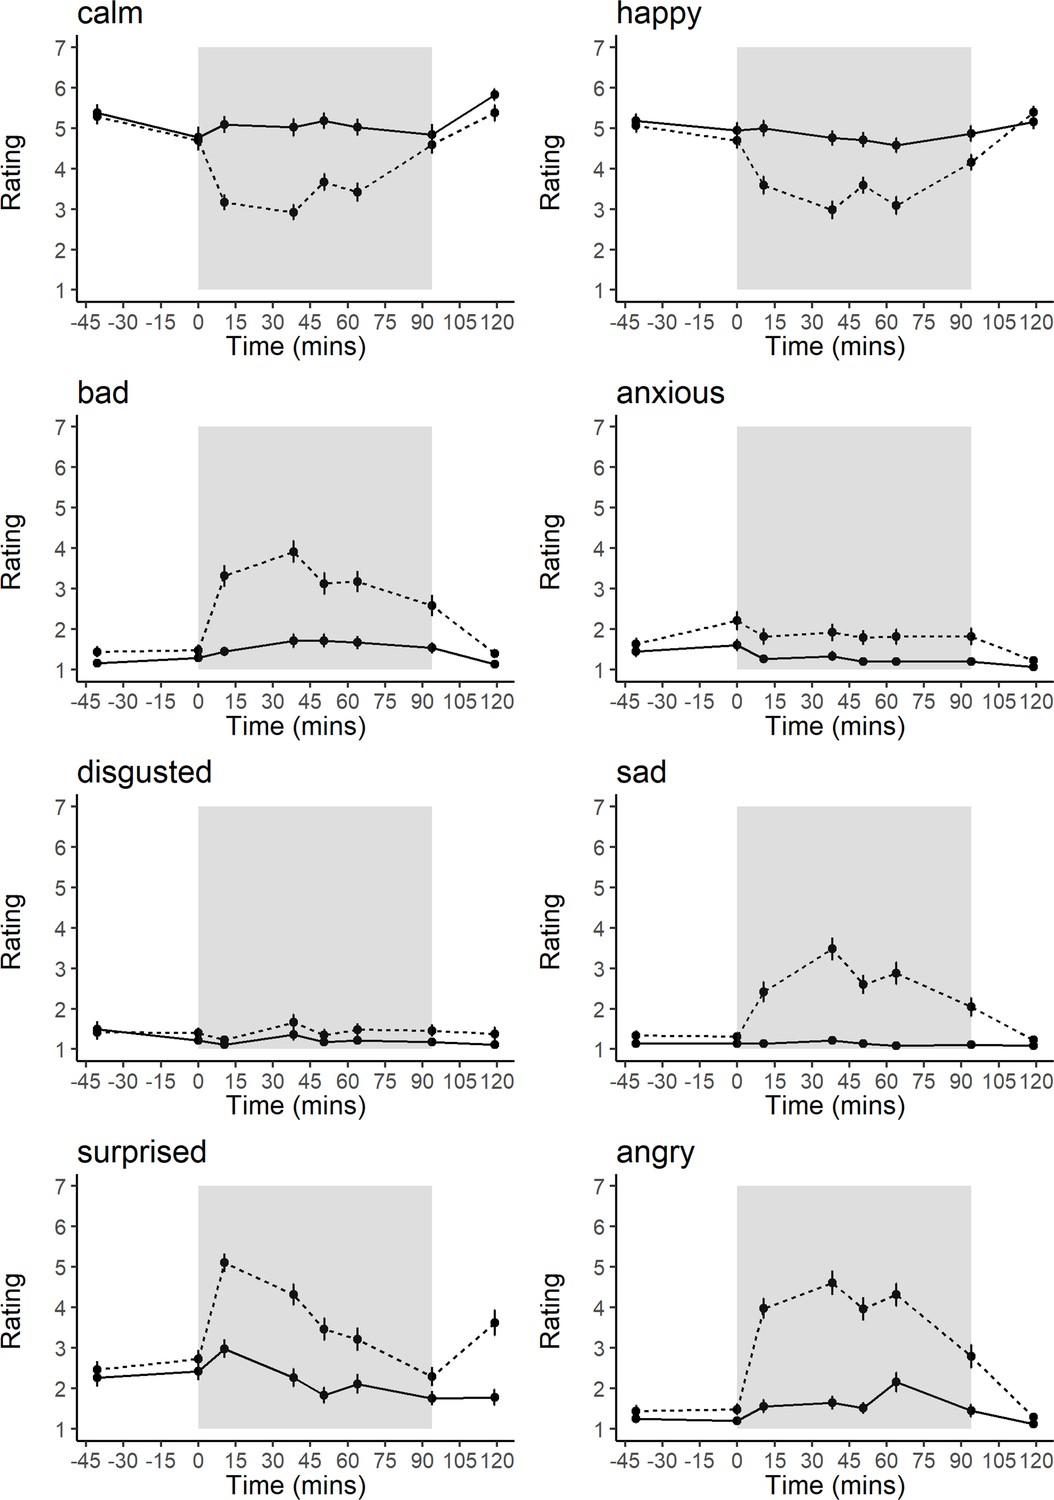
Mean (± SEM) ratings at each sample timepoint for each emotion for the control group (solid line) and stress group (dashed line).
The grey box indicates the time participants spent in the scanner doing the tasks. Apart from the emotions anxious and disgusted, all emotions showed a significant sample (1:8) by group (stress, control) interaction (all ps<0.001) when subjected to an ANOVA. This mirrored the results for the perceived stress ratings.
Figure 3 with 2 supplements
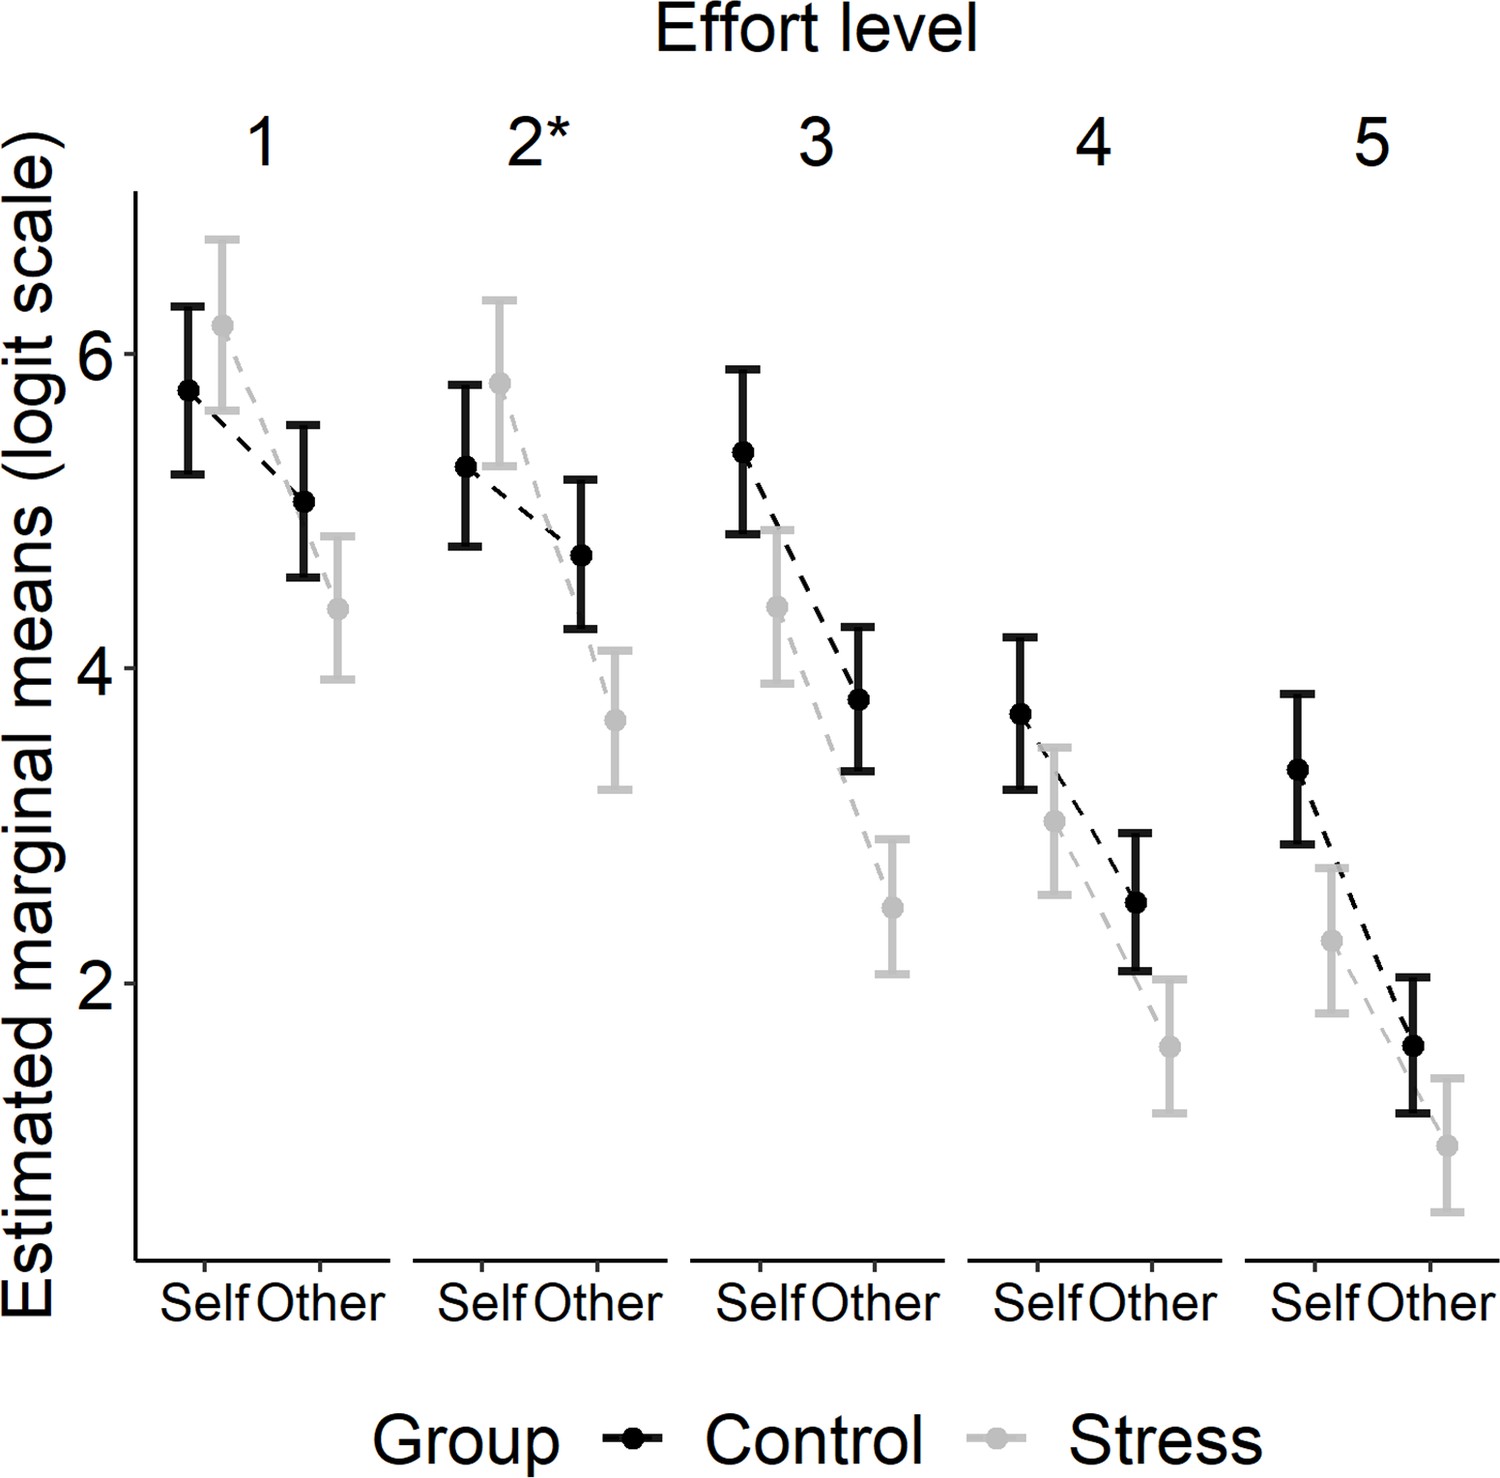
Estimated marginal means (± SEM) are plotted on a logit scale and were extracted using the emmeans package in R (Lenth, 2022).
Follow-up tests showed that the three-way interaction between Group, Recipient, and Effort (type III Wald test, χ2[4] = 21.48, p<0.001) was driven by a significant interaction between Group and Recipient at effort level 2 (*p<0.05).
Figure 3—figure supplement 1
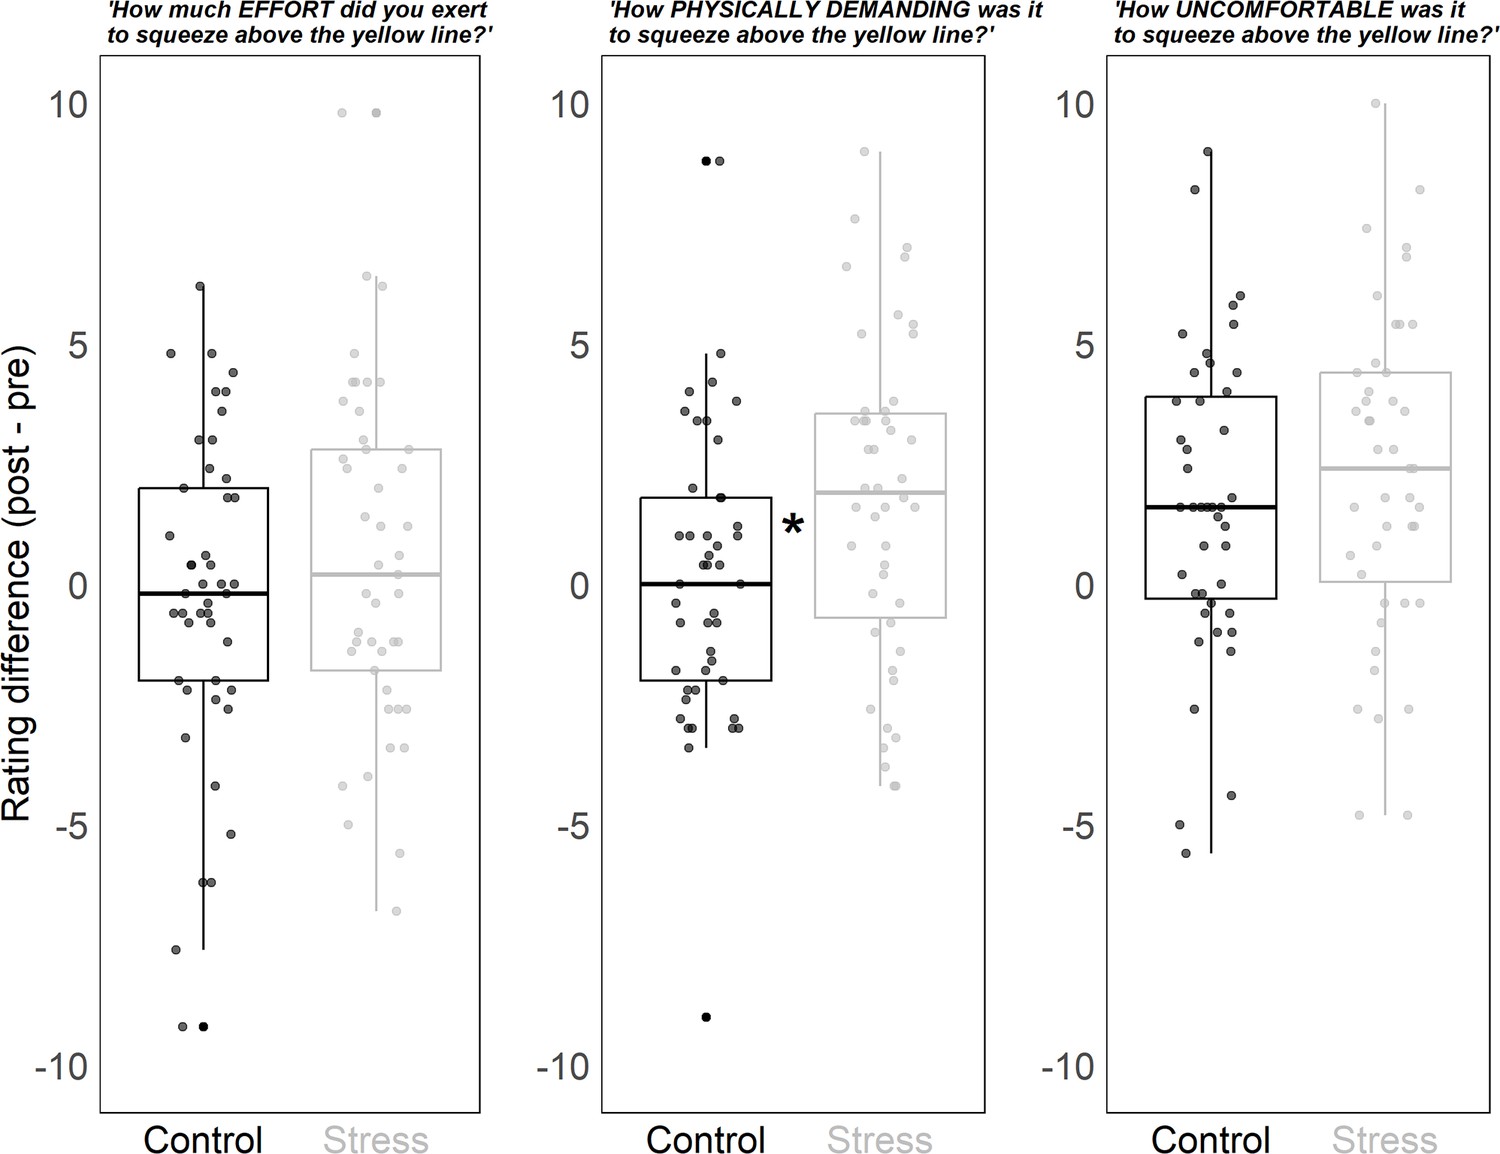
Immediately before and after the experiment, participants squeezed the hand dynamometer to each effort level and, on a 21-point Likert scale, rated (1) how much effort they exerted, (2) how physically demanding it was, and (3) how uncomfortable it was to squeeze to the required effort level.
For each participant, we took the average of the ratings across all five effort levels and calculated the difference after the experiment (post) relative to before the experiment (pre). This produced three difference scores indicating how much more effortful, physically demanding, and uncomfortable it was to squeeze the hand dynamometer to the required effort levels after the experiment relative to before. We conducted Mann–Whitney U tests on each difference score to test for any differences between the stress group and control group. This revealed that following the experiment, participants in the stress group rated squeezing to the required effort levels as more physically demanding compared to the control group (medians: stress = 1.80, control = 0.00; p=0.037). There were no group differences in how much effort they reported exerting (p=0.824) or how uncomfortable it was (p=0.351). The results are shown in the box plot. Next, we determined whether changes in how physically demanding participants found squeezing to the required effort level were correlated with how often participants decided to exert effort (i.e. ‘work’ rather than ‘rest’) on self trials, other trials, and across all trials (total effortful choices). Across the whole sample or when analysing the stress group and control group individually, we did not find any significant correlations (see Supplementary file 1b). Moreover, changes in how physically demanding participants found squeezing to the required effort level did not correlate with the proportion of effortful prosocial choices participants made relative to the total number of effortful choices they made (% prosocial choices). Together, this suggests that whilst stressed participants found squeezing to the required effort level more physically demanding following the task relative to before, this was not related to how often participants exerted effort for self rewards or other rewards, nor the proportion of prosocial choices (% prosocial choices).
Figure 3—figure supplement 2
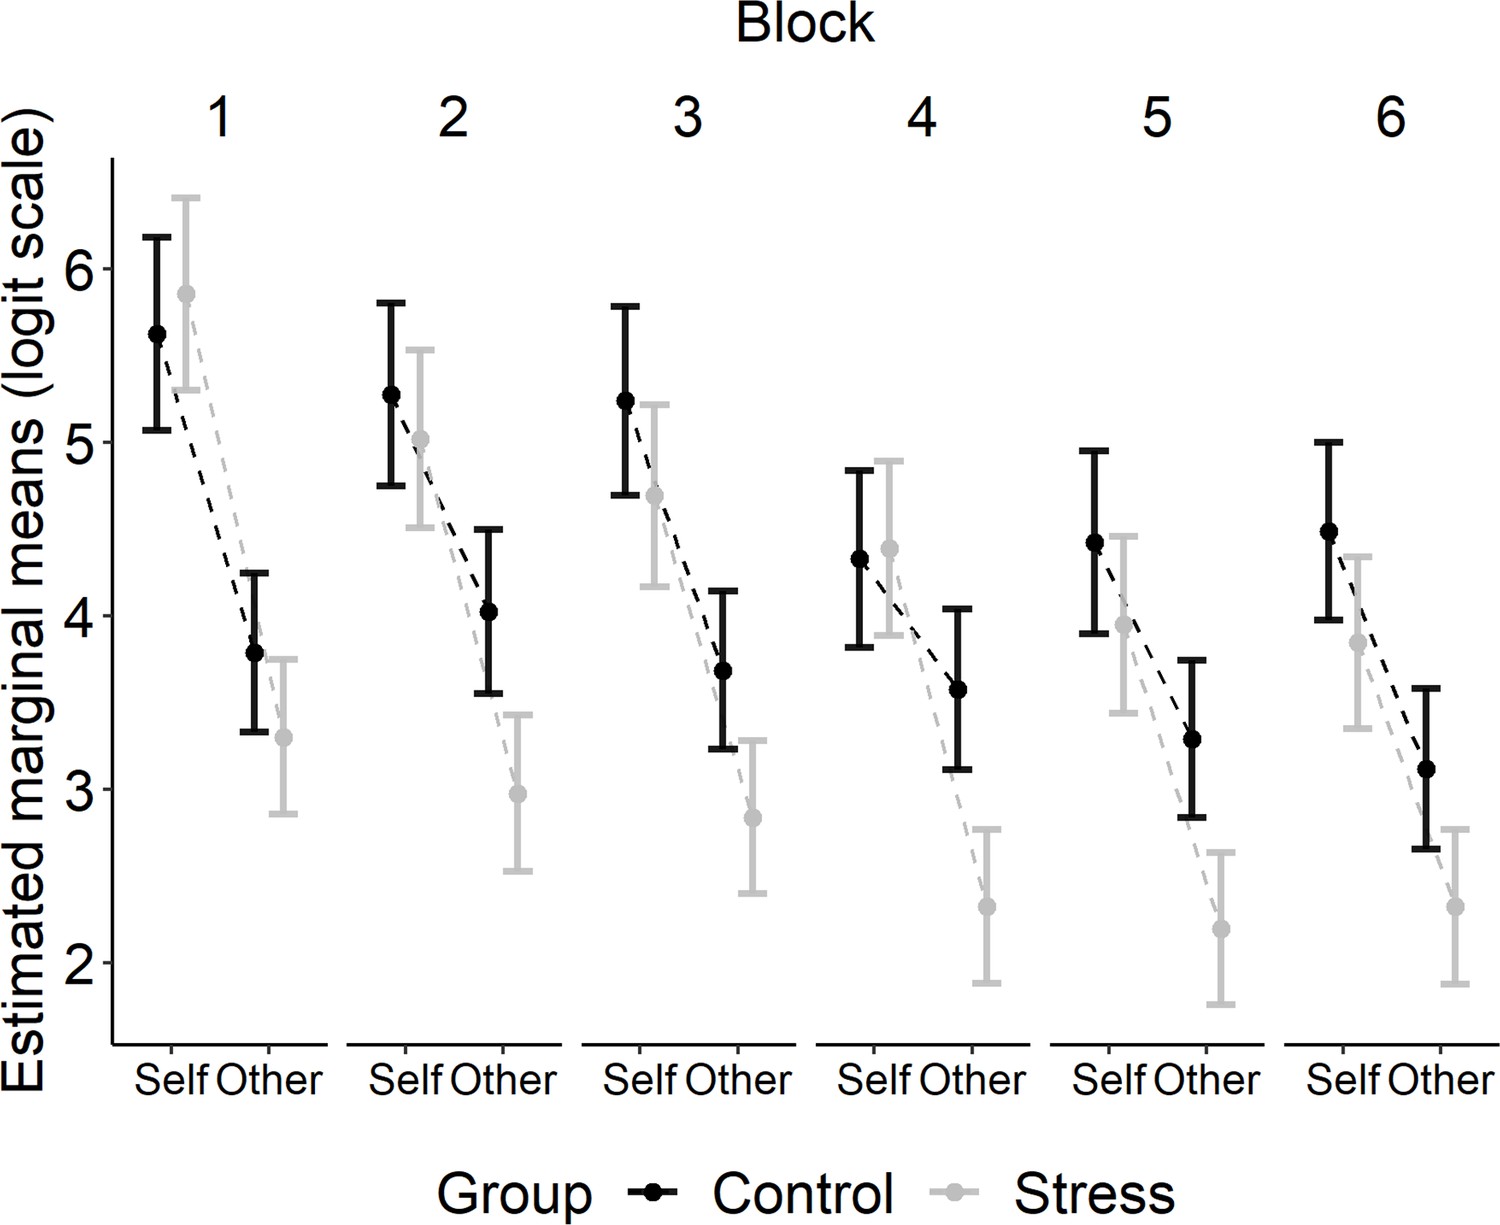
Estimated marginal means (± SEM) for each block of the prosocial effort task for the stress group and control group.
Estimated marginal means are plotted on a logit scale and were extracted using the emmeans package in R (Lenth, 2022). We ran the same model on the choices as for the main analysis (work = 1; rest = 0) but included the three-way interaction between the factors Group, Recipient, and Block (1:6). Although both groups showed a decline in the number of effortful choices during the experiment (main effect of Block: type III Wald test χ2[5] = 150.28, p<0.001), the two-way interaction between Group and Block (p=0.188) nor the three-way interaction between Group, Recipient, and Block were significant (p=0.138). Additionally, the three-way interaction between Group, Recipient, and Effort was unaffected when controlling for potential block effects (χ2[4]=22.06, p<0.001). This shows that whilst there was a decline in the number of effortful choices throughout the experiment, this was not more pronounced in the stress group, nor was it more pronounced in the stress group for self effortful choices relative to other effortful choices compared to the control group. Note that blocks 1, 3, and 5 were performed following a 6-min run of the Montreal Imaging Stress Test (MIST), and blocks 2, 4, and 6 were performed following the 2-min backwards counting task.
Figure 4
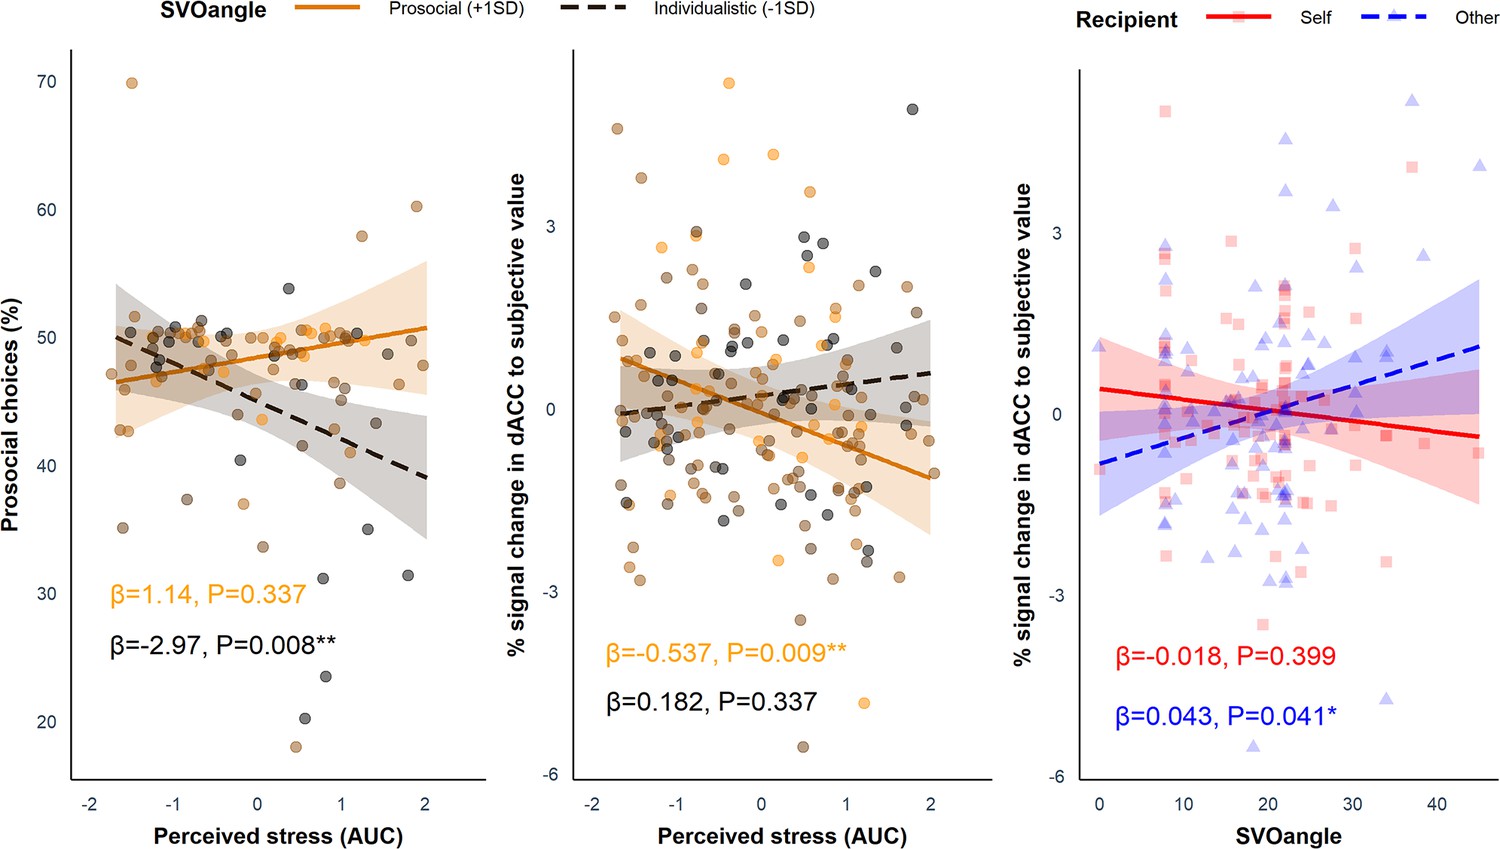
Simple slopes analyses showing the effects of perceived stress and SVO angle on behavioural and neural responses.
Left panel: the interaction between social value orientation (SVO) angle and perceived stress for the proportion of prosocial choices (B = 0.246, SE = 0.103, p=0.020). Participants with a more individualistic SVO angle (–1 SD; black dashed line) became more selfish (reduced proportion of prosocial choices) at increasing levels of perceived stress; this was not seen in more prosocial participants (+1 SD; orange solid line). Middle panel: the interaction between SVO angle and perceived stress (B = −0.044, SE = 0.018, p=0.017) for dorsal anterior cingulate cortex (dACC) activation to subjective value (SV). Participants with a more prosocial SVO angle showed reduced activation in the dACC to SV (collapsed across self and other trials) at increasing levels of perceived stress; this was not seen in participants with a more individualistic SVO angle. Right panel: interaction between SVO angle and Recipient for dACC activation to SV (B = 0.061, SE = 0.028, p=0.034). Participants with a more prosocial SVO angle showed increased activation to SVother (blue dashed line). Responses to SVself (red solid line) did not change at increasing SVO angle. The ribbons represent the 95% confidence intervals and each point represents the individual data points from the participants (note, in the middle and right panel each participant provided two data points - one for the self condition and one of the other condition).
Figure 5
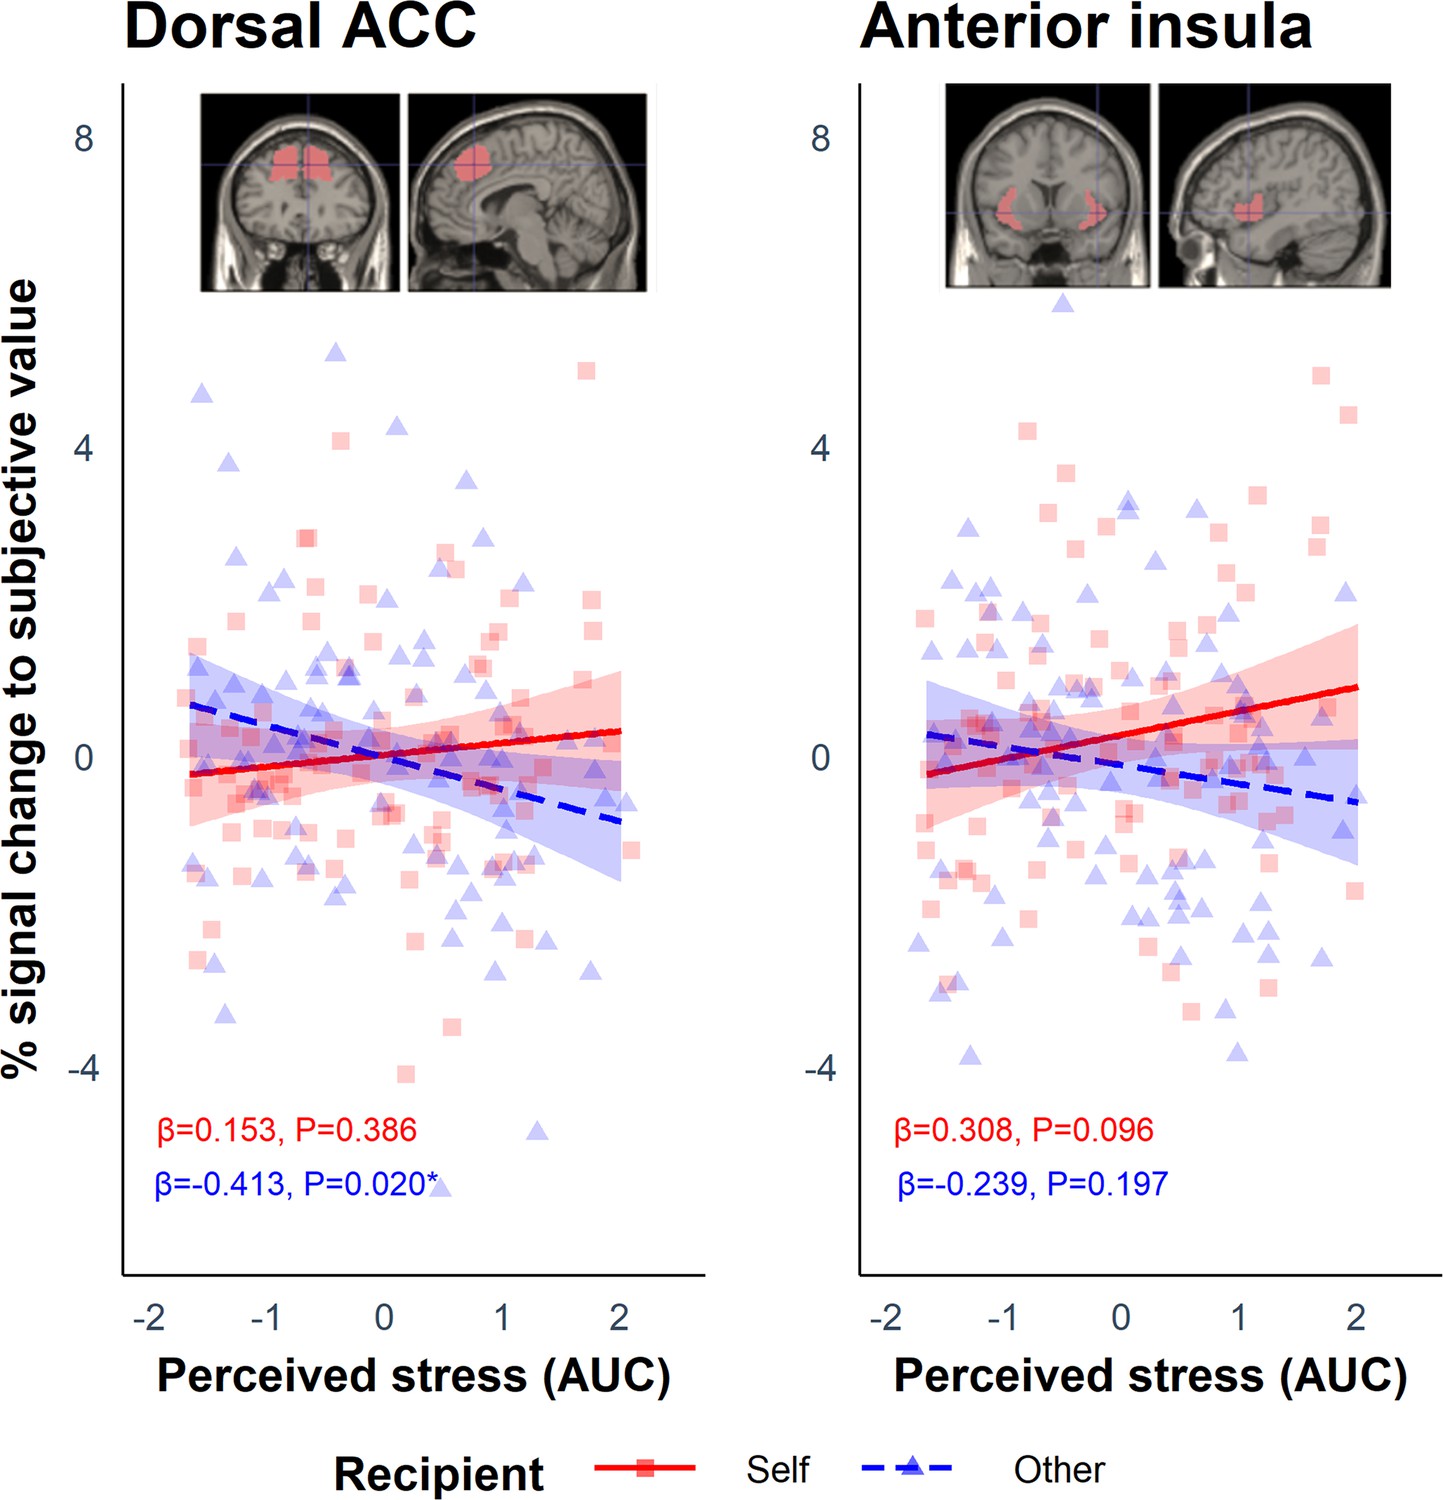
Results from the regions of interest (ROI) analysis which showed a significant interaction between Recipient and Perceived stress in the dorsal anterior cingulate cortex (dACC: B = −0.566, SE = 0.237, p=0.019) and anterior insula (AI: B = −0.547, SE = 0.247, p=0.029).
These show the percentage signal change to subjective value (SV) during the offer phase associated with perceived stress on self and other trials. For the dACC, simple slopes analysis revealed a negative association between perceived stress and SVother (blue dashed line) but not between perceived stress and SVself (red solid line). The ribbons represent the 95% confidence intervals. Each point represents the individual data points from the participants for the self (red squares) and other (blue triangles) condition.
Tables
Table 1
Regions resulting from a whole-brain analysis in which activity scaled more with SVself compared to SVother that covaried with perceived stress (using a statistical threshold of p<0.05 FWE corrected at the cluster level having thresholded at p<0.001 across the whole brain).
| Peak voxel | |||||
|---|---|---|---|---|---|
| Brain region | x | y | z | Cluster size (k) | Z |
| SVself > SVother covarying with perceived stress | |||||
| R inferior frontal gyrus (pars opercularis) | 44 | 18 | 34 | 430 | 4.61 |
| R midcingulate cortex | 12 | -6 | 44 | 157 | 4.57 |
| L middle occipital gyrus | –38 | –84 | 28 | 135 | 4.23 |
| L thalamus | –10 | –14 | 6 | 124 | 4.14 |
| L middle frontal gyrus | –46 | 20 | 40 | 327 | 3.99 |
| L middle temporal gyrus | –46 | –58 | 14 | 187 | 3.98 |
| R middle occipital gyrus | 44 | –86 | 16 | 144 | 3.91 |
-
FWE, family-wise error; L, left; R, right; SV, subjective value.
Additional files
-
Supplementary file 1
Parameter recovery, effort rating correlations, and full output of the mixed models.
(a) Parameter recovery. We stimulated data based on our trial structure and determined whether the parameters were recoverable for the best-fitting model. There was excellent recovery as showed by the strong relationship between fitted and simulated (or ‘true’) parameters. (b) Spearman’s rho correlations between the difference in how physically demanding participants rated the effort levels after the experiment relative to before and the number of effortful choices in each group for each recipient. p-Values are shown in brackets. There were no significant correlations. (c) Type III Wald test on choice data from the GLMM. The binary dependent variable was choice (0 = rest, 1 = work). Group, Recipient, Effort, Reward, and their interactions were fixed effects. We included a subject-level random intercept and a random slope for Recipient. Significant results are shown in bold. (d) Post hoc comparisons of choice data. The interaction between Group and Effort, and the interaction between Group, Recipient, and Effort, is shown. All p-values are Bonferroni corrected, and significant results are shown in bold. Means were extracted using the emmeans package in R (Lenth, 2022). (e). Type III Wald test on force data from the LMM. Group, Recipient, Effort, Reward, and their interactions were fixed effects, and force was the dependent variable – area under the curve during the force period relative to each participants’ MVC. We included a subject-level random intercept and a random slope for Recipient. Significant results are shown in bold.
- https://cdn.elifesciences.org/articles/87271/elife-87271-supp1-v1.docx
-
MDAR checklist
- https://cdn.elifesciences.org/articles/87271/elife-87271-mdarchecklist1-v1.pdf
Download links
A two-part list of links to download the article, or parts of the article, in various formats.
Downloads (link to download the article as PDF)
Open citations (links to open the citations from this article in various online reference manager services)
Cite this article (links to download the citations from this article in formats compatible with various reference manager tools)
Acute stress reduces effortful prosocial behaviour
eLife 12:RP87271.
https://doi.org/10.7554/eLife.87271.3


