CTLA-4 antibody-drug conjugate reveals autologous destruction of B-lymphocytes associated with regulatory T cell impairment
- Division of Immunotherapy, Institute of Human Virology, University of Maryland School of Medicine, United States
- Department of Pharmacology, University of Maryland School of Medicine, United States
- Key Laboratory of Infection and Immunity of Shandong Province & Department of Immunology, School of Basic Medical Sciences, Shandong University, China
- OncoC4, Inc, United States
- Division of Virology, Pathogenesis and Cancer, Institute of Human Virology, University of Maryland School of Medicine, United States
- Department of Microbiology & Immunology, University of Maryland School of Medicine, United States
Figures
Figure 1 with 7 supplements
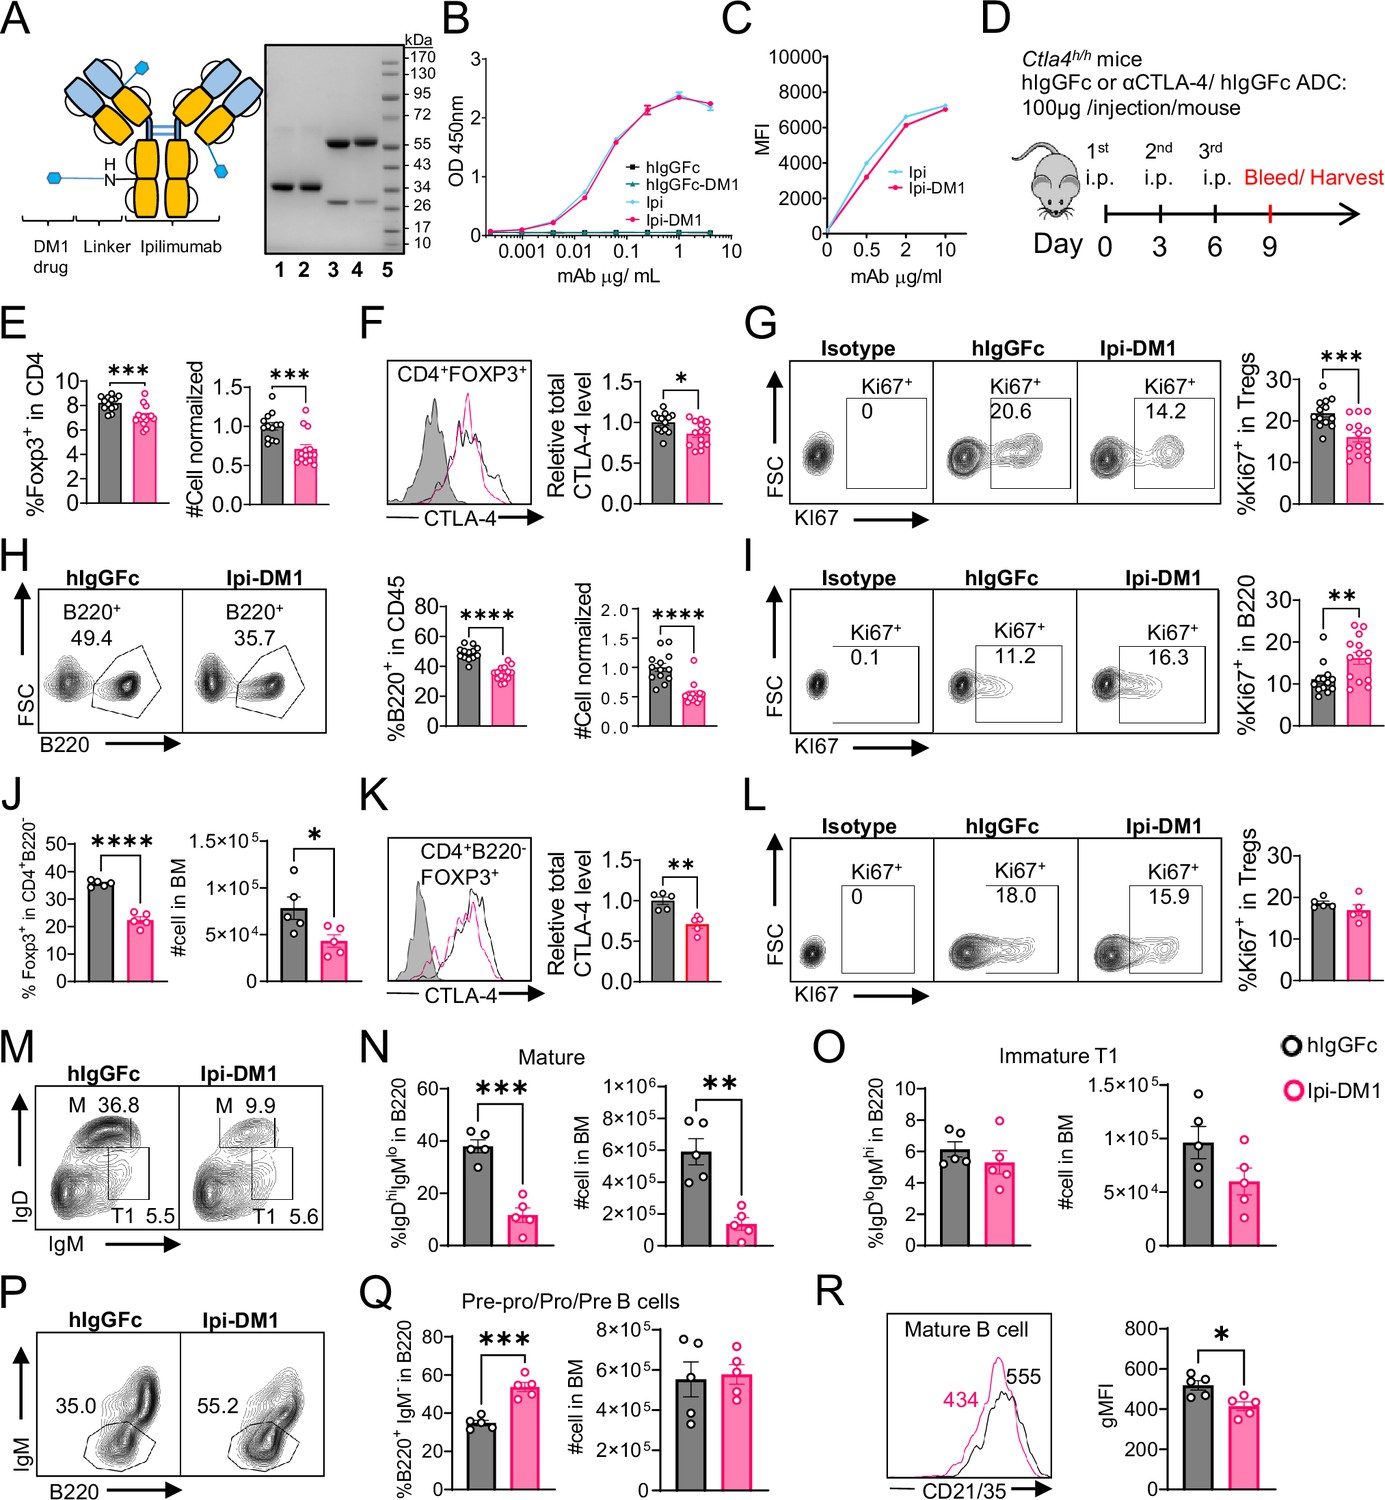
CTLA-4 antibody-drug conjugate impairs regulatory T-cell and leads to B-cell depletion.
(A) SDS-Reducing gel showing size shift after DM1 conjugation. Lanes (left to right) are 1 hIgGFc, 2 hIgGFc-DM1 antibody-drug conjugate (ADC), 3 Ipilimumab (Ipi), 4 Ipilimumab-DM1 (Ipi-DM1) antibody-drug conjugate (ADC), and 5 Ladder. (B) ELISA binding of hIgGFc, hIgGFc-DM1, Ipi, and Ipi-DM1 to pre-coated 1 μg/mL His-hCTLA-4 and detected with anti-hIgG-HRP (n=2). (C) Flow cytometry binding of Ipi and Ipi-DM1 to hCTLA-4 expressing CHO cells (CHO-hCTLA-4) and detected with anti-hIgG-AF488 (n=1). (D) Diagram of experimental design, Ctla4h/h mice were treated intraperitoneally (i.p.) (100 μg/mouse) with hIgGFc or Ipi-DM1 every 3 days and mice were bled or harvested for bone marrow extraction on day 9 for downstream flow analysis. (E–I) flow data analysis of day 9 peripheral blood, Tregs defined (CD45+ CD4+ Foxp3+) and B cells defined (CD45+ B220+). (E) % Foxp3+ in CD4 and normalized cell number. (F) Relative CTLA-4 Level in Tregs. (G) % Ki67+ in Tregs. (H) FACS profiles depicting gating strategy after gating on CD45+ and data summaries of % B220+ in CD45 and normalized cell number. (I) % Ki67+ in B cells. (J–R) Flow data analysis of day 9 bone marrow, Tregs defined (CD4+B220-Foxp3+) and B220+ B cell subtypes defined mature (M) (IgDhi IgMlow), immature transitional type 1 (T1) (IgDlowIgM+), and Pre-pro/Pro/Pre B (B220+IgM-). (J) % Foxp3+ in CD4+B220- and absolute cell number. (K) Relative CTLA-4 Level in Tregs. (L) % Ki67+ in Tregs. (M) FACS profile gating of M and T1 B cells, (N) % of mature B cells in B220 and absolute cell number summaries, (O) % of T1 immature B cells in B220 and absolute cell number summaries. (P) FACS profile gating of Pre-pro/Pro/Pre B cells, (Q) % of Pre-pro/Pro/Pre B cells in B220 and absolute cell number summaries. (R) CD21/35 expression in mature B cells in bone marrow. (B, C) Representative data of two or more repeats. (E–I) Data combined from two independent experiments (n=13–14). (J–R) Data representative of two independent experiments (n=5). Data analyzed using an unpaired two-tailed Student’s t test and represented as mean ± SEM. *p<0.05, **p<0.01, ***p<0.001, ****p < 0.0001.
-
Figure 1—source data 1
Data 1. Panel A. SDS-gel; Data 2. Panel B. ELISA binding; Data 3. Panel C. Flow binding; Data 4. Panel E. Tregs; Data 5. Panel F. CTLA-4; Data 6. Panel G. Ki67; Data 7. Panel H. B cells; Data 8. Panel I. Ki67; Data 9. Panel J. Tregs; Data 10. Panel K. CTLA-4; Data 11. Panel L. Ki67; Data 12. Panel N. Mature B cells; Data 13. Panel O. Immature T1 B cells; Data 14. Panel Q. Progenitor B cells; Data 15. Panel R. CD21/CD35.
- https://cdn.elifesciences.org/articles/87281/elife-87281-fig1-data1-v1.zip
Figure 1—figure supplement 1

CTLA-4 antibody-drug conjugate killing is CTLA-4 specific.
Cell viability of CHO-hCTLA-4 cells and wild type CHO cells after 72 hr incubation with Ipi or Ipi-DM1 as measured by MTT assay (n=2). Data representative of two or more repeats.
-
Figure 1—figure supplement 1—source data 1
Data 1. ADC hCTLA-4 specific cell killing.
- https://cdn.elifesciences.org/articles/87281/elife-87281-fig1-figsupp1-data1-v1.zip
Figure 1—figure supplement 2

Gating strategy for T cells.
(A) Tregs (CD4+ Foxp3+) and CD4-nonTreg (CD4+ Foxp3-) in blood. (B) CD8-T (CD4+B220-), CD4-T (CD4+B220-), Tregs (CD4+B220-Foxp3+) and CD4-nonTreg (CD4+B220-Foxp3-) in bone marrow.
Figure 1—figure supplement 3

CD4-nonTregs and CTLA-4 expression.
(A, B) Blood, (A) % CD4+ Foxp3- in CD45 and normalized cell number, (B) relative CTLA-4 level in CD4-nonTregs. (C, D) Bone marrow, (C) % CD4+B220-Foxp3- in CD45 and absolute cell number, (B) relative CTLA-4 level in CD4-nonTregs (CD4+B220- Foxp3-). (A, B) Data combined from two independent experiments (n=13–14). (C, D) Data representative of two independent experiments (n=5). Data analyzed using an unpaired two-tailed Student’s t test and represented as mean ± SEM. *p<0.05, **p<0.01, ***p<0.001, ****p < 0.0001.
-
Figure 1—figure supplement 3—source data 1
Data 1. Panel A. CD4-nonTregs; Data 2. Panel B. CTLA-4; Data 3. Panel C. CD4-nonTregs; Data 4. Panel D. CTLA-4.
- https://cdn.elifesciences.org/articles/87281/elife-87281-fig1-figsupp3-data1-v1.zip
Figure 1—figure supplement 4
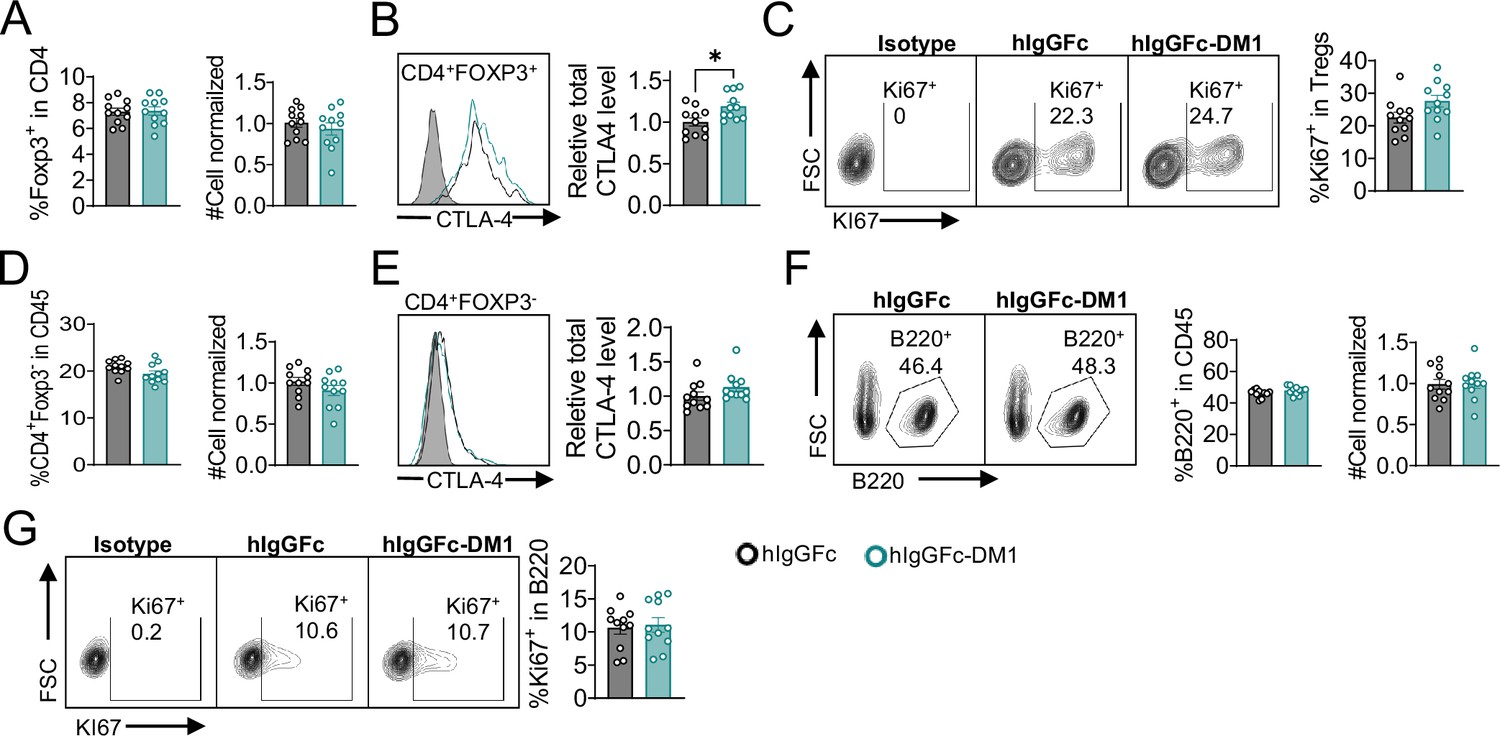
B-cell depletion is not mediated by DM1 payload off-target release.
Mice treated with hIgGFc or hIgGFc-DM1, blood flow analysis on day 9. (A) % Foxp3+ in CD4 and normalized cell number. (B) Relative CTLA-4 level in Tregs. (C) % Ki67+ in Tregs. (D) % CD4+ Foxp3- in CD45 and normalized cell number. (E) Relative CTLA-4 level in CD4-nonTregs. (F) FACS profiles depicting gating strategy after gating on CD45+ and data summaries of % B220+ in CD45 and normalized cell number. (G) % Ki67+ in B cells. Data combined from two independent experiments (n=11) and analyzed using an unpaired two-tailed Student’s t test and represented as mean ± SEM. *p<0.05, **p<0.01, ***p<0.001, ****p < 0.0001.
-
Figure 1—figure supplement 4—source data 1
Data 1. Panel A. Tregs; Data 2. Panel B. CTLA-4; Data 3. Panel C. Ki67; Data 4. Panel D. CD4-nonTregs; Data 5. Panel D. CTLA-4; Data 6. Panel F. B cells; Data 7. Panel G. Ki67.
- https://cdn.elifesciences.org/articles/87281/elife-87281-fig1-figsupp4-data1-v1.zip
Figure 1—figure supplement 5
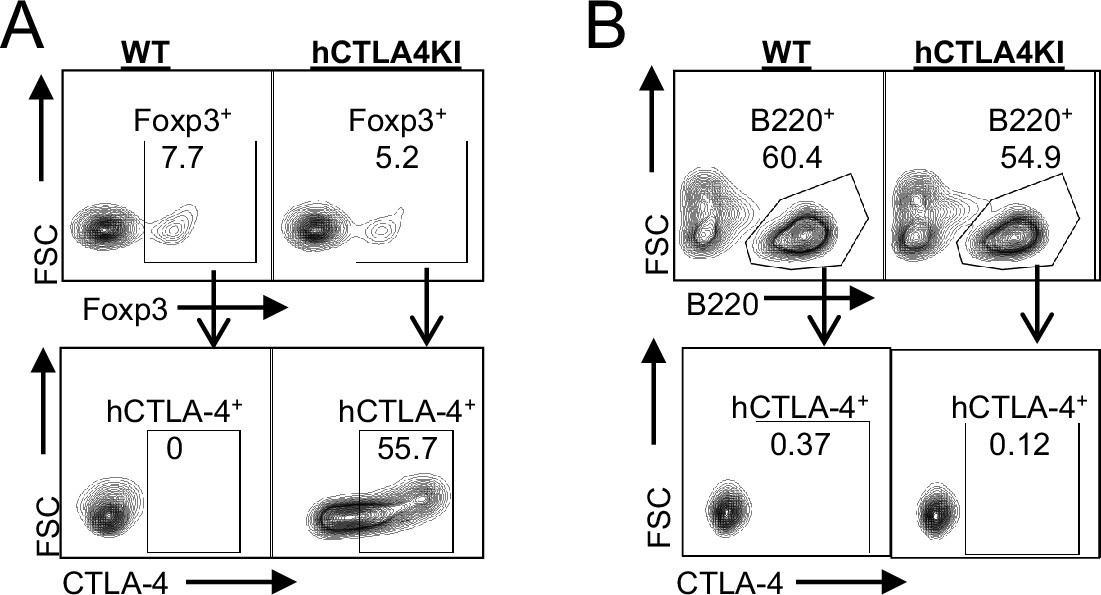
B-cells do not express CTLA-4.
FACS profile of human CTLA-4 in wild-type and human CTLA-4 knock-in mice peripheral blood, (A) % CTLA-4+ in Tregs (CD45+ CD4+ Foxp3+), and (B) % CTLA-4+ in B cells (CD45+ B220+). Data representative of two mice.
Figure 1—figure supplement 6
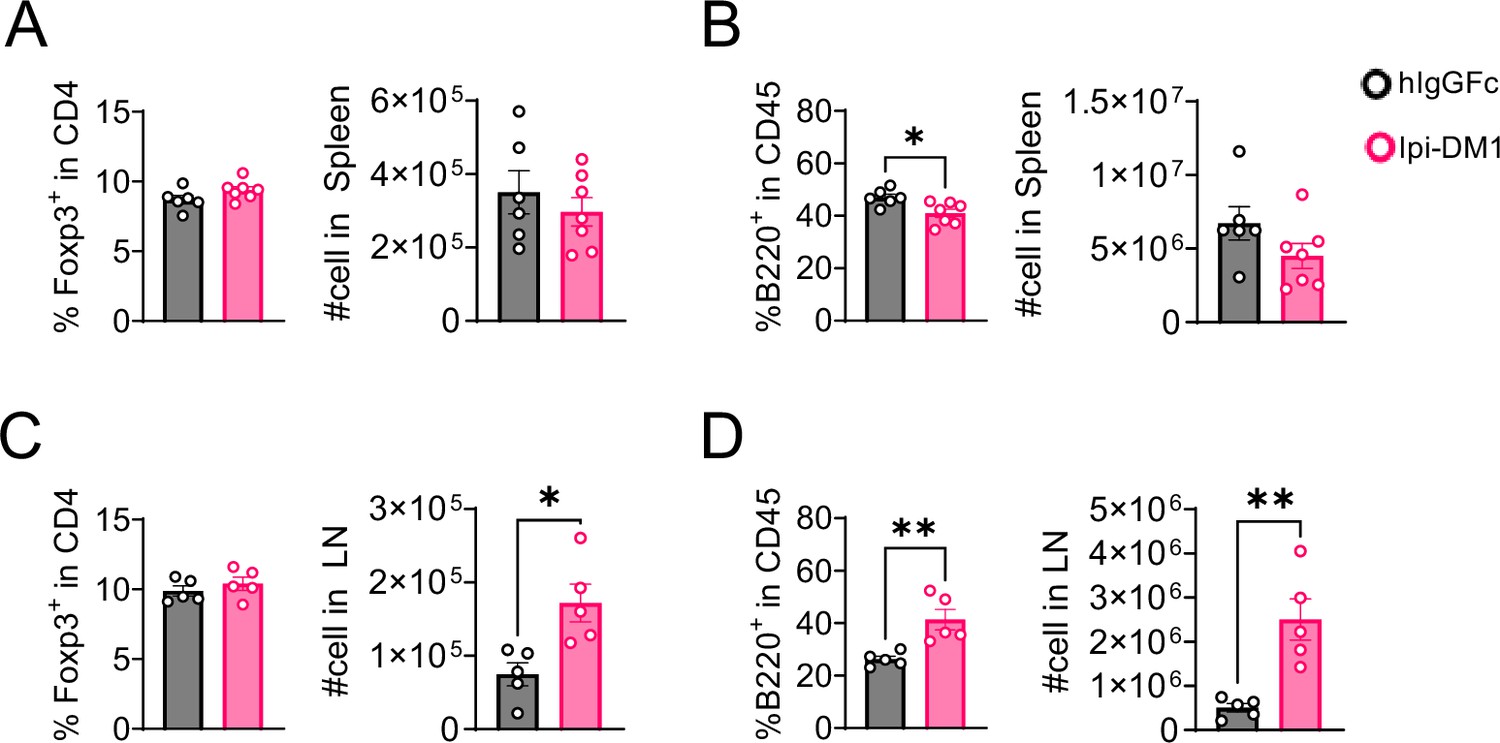
Tregs and B cells in spleen and lymph nodes.
Analysis of spleen and lymph nodes from Ctla4h/h mice on day 9 after treatment with hIgGFc or Ipi-DM1 ADC. (A, B) Spleen, (A) % Foxp3+ in CD4 and absolute cell number, (B) % B220+ in CD45 and absolute cell number. (C, D) combined inguinal and cervical lymph nodes, (C) % Foxp3 +in CD4 and absolute cell number, (D) % B220 +in CD45 and absolute cell number. Data representative of two independent experiments (n=5–7) and analyzed using an unpaired two-tailed Student’s t test and represented as mean ± SEM. Non-significant [ns], *p<0.05, **p<0.01, ***p<0.001, ****p < 0.0001.
-
Figure 1—figure supplement 6—source data 1
Data 1. Panel A. Spleen Tregs; Data 2. Panel B. Spleen B cells; Data 3. Panel C. Lymph node Tregs; Data 4. Panel D. Lymph node B cells.
- https://cdn.elifesciences.org/articles/87281/elife-87281-fig1-figsupp6-data1-v1.zip
Figure 1—figure supplement 7
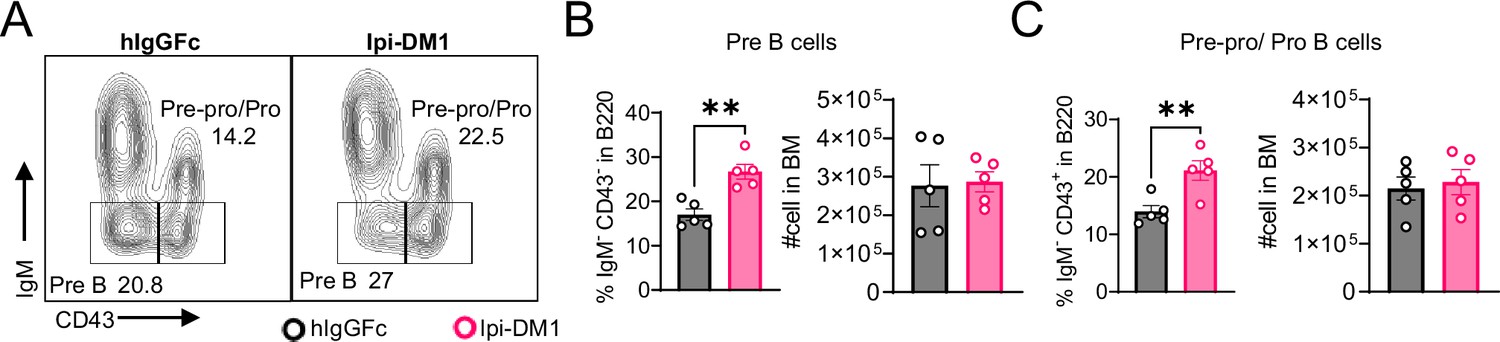
IgM negative B-cell subtypes in bone marrow.
(A) FACS profile gating of Pre B (IgM-CD43-) and Pre-pro/Pro (IgM-CD43+) cells in B220. (B–C) % of B cell subtype in B220 and absolute cell numbers, (B) Pre B cells, (C) Pre-pro/Pro B cells. Data representative of two independent experiments (n=5) and analyzed using an unpaired two-tailed Student’s t test and represented as mean ± SEM. *p<0.05, **p<0.01, ***p<0.001, ****p < 0.0001.
-
Figure 1—figure supplement 7—source data 1
Data 1. Panel B. Pre B Cells; Data 2. Panel C. Pre-pro/pro B cells.
- https://cdn.elifesciences.org/articles/87281/elife-87281-fig1-figsupp7-data1-v1.zip
Figure 2 with 1 supplement

CTLA-4 antibody-drug conjugate increases apoptosis in mature B cells in bone marrow.
Flow analysis of B cell apoptosis on day 9 after treatment with hIgGFc or Ipi-DM1 ADC. (A) FACS profile defining B220hi and B220lo B cell populations in bone marrow (B) Gating strategy for B220hi (mature B cells) and B220lo (progenitor/immature B cells) for apoptosis analysis. (C, D) FACS profiles and summaries depicting apoptosis of B cells in (C) B220hi bone marrow cells, (D) B220lo bone marrow cells. Data representative of two independent experiments (n=5) and analyzed using an unpaired two-tailed Student’s t test and represented as mean ± SEM. Non-significant (ns) *p<0.05, **p<0.01, ***p<0.001, ****p < 0.0001.
-
Figure 2—source data 1
Data 1. Panel C. B220hi apoptosis; Data 2. Panel D. B220lo apoptosis.
- https://cdn.elifesciences.org/articles/87281/elife-87281-fig2-data1-v1.zip
Figure 2—figure supplement 1

B cell apoptosis in blood and lymphoid organs.
B cell apoptosis on day 9 after treatment with hIgGFc or Ipi-DM1 ADC. (A) B220+ blood cells. (B) B220+ spleen cells. (C) B220+ lymph node cells. Data representative of two independent experiments (n=5) and analyzed using an unpaired two-tailed Student’s t test and represented as mean ± SEM. Non-significant [ns], *p<0.05, **p<0.01, ***p<0.001, ****p < 0.0001.
-
Figure 2—figure supplement 1—source data 1
Data 1. Panel A. Blood B cell apoptosis; Data 2. Panel B. Spleen B cell apoptosis; Data 3. Panel C. Lymph node B cell apoptosis.
- https://cdn.elifesciences.org/articles/87281/elife-87281-fig2-figsupp1-data1-v1.zip
Figure 3 with 2 supplements
B-cell depletion is transient and correlated with a decrease in regulatory T-cell.
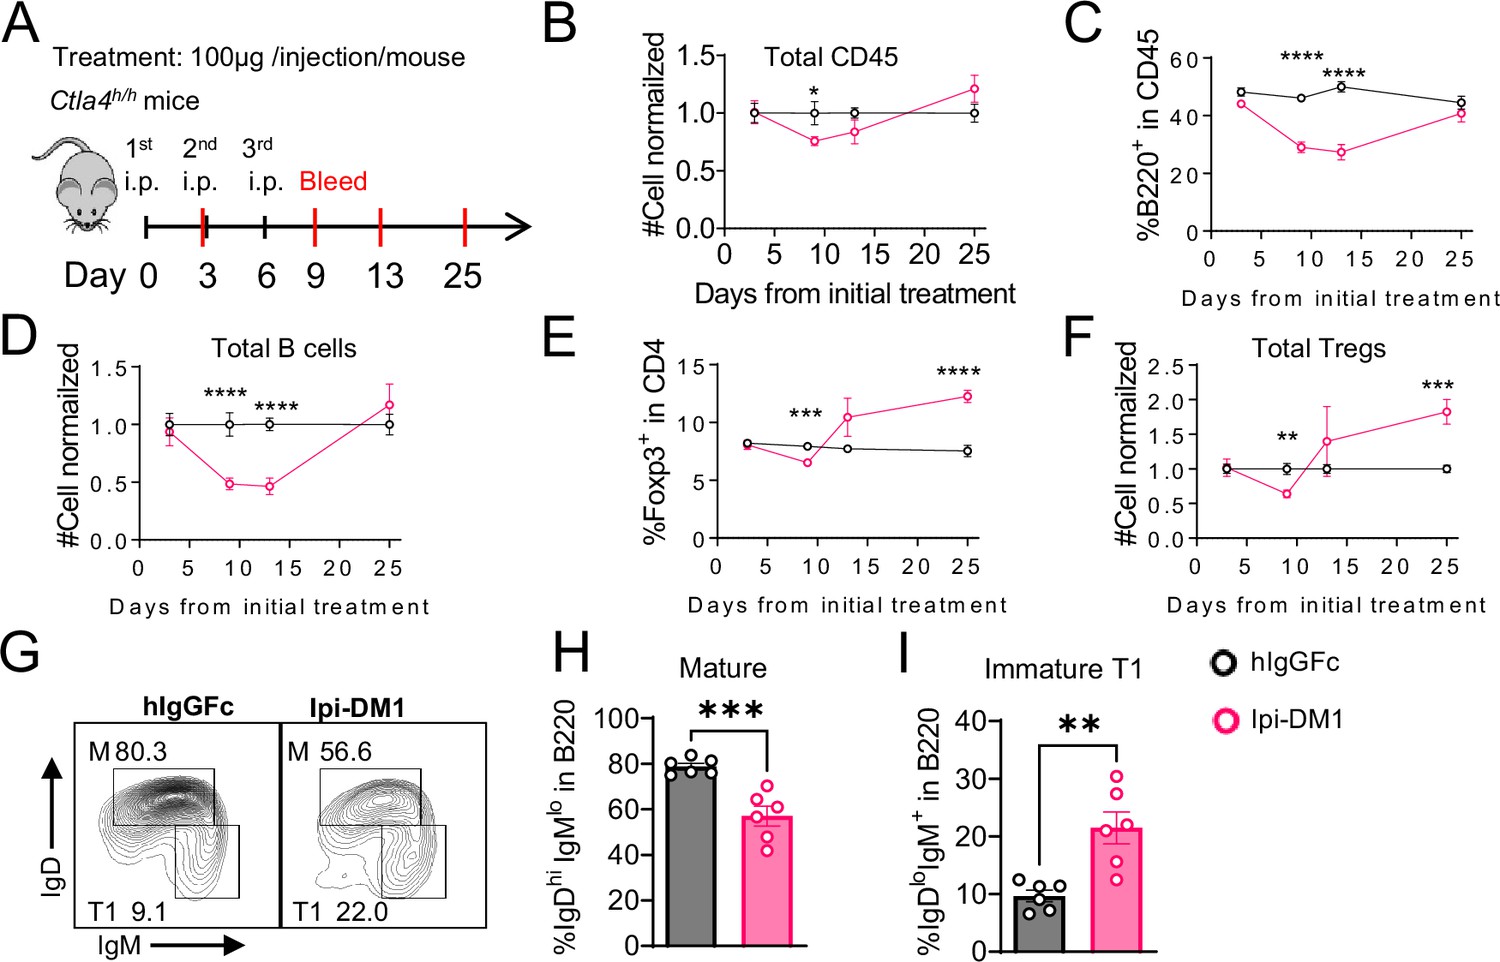
(A) Diagram of experimental design, Ctla4h/h mice were treated intraperitoneal (i.p.) (100 μg/mouse) with hIgGFc or Ipi-DM1 every three days and mice were bled on day 3,9,13, 25 for downstream flow analysis. (B–F) Flow data of time course of CD45, B, and Treg cells in peripheral blood, (B) CD45 normalized cell number, (C) % of B-cells in CD45, (D) B-cell normalized cell number, (E) % Foxp3+ Tregs in CD4, (F) Treg normalized cell number. (G–J) Flow analysis of B-cell subtypes from day 13 peripheral blood. (G) FACS profile of Mature (M) (IgDhi IgMlow), and immature Transitional type 1 (T1) (IgDlow IgM+) B cell subtypes after gating on CD45+B220+ B cells. (H) % of mature B cells in B220. (I) % of T1 B cells in B220. (B–F) Data combined from two independent experiments (n=10). (G–I) Data representative of two independent experiments (n=6). Data were analyzed by an unpaired two-tailed Student’s t test and represented as mean ± SEM. *p<0.05, **p<0.01, ***p<0.001, ****p < 0.0001.
-
Figure 3—source data 1
Data 1. Panel B. Time course CD45 cell number; Data 2. Panel C. Time course % B220 cells. Data 3. Panel D. Time course B cell number; Data 4. Panel E. Time course % Foxp3 cells; Data 5. Panel F. Time course Treg cell number; Data 6. Panel H. % Mature B cells; Data 7. Panel I. % Immature T1 B cells.
- https://cdn.elifesciences.org/articles/87281/elife-87281-fig3-data1-v1.zip
Figure 3—figure supplement 1

Treg impairment increases plasma immunoglobulins.
Mice treatment with hIgGFc or Ipi-DM1 ADC and plasma collected on days 9, 13, 25 for ELISA Ig level quantification. (A) IgG. (B) IgM. (C) IgA. (D) IgE. Data representative of two independent experiments (n=5) and analyzed using ordinary two-way Anova with Bonferroni’s multiple comparisons test and as mean ± SEM. Non-significant [ns], *p<0.0332, **p<0.0021, ***p<0.0002, ****p < 0.0001.
-
Figure 3—figure supplement 1—source data 1
Data 1. Panel A. Serum IgG; Data 2. Panel B. Serum IgM; Data 3. Panel C. Serum IgA; Data 4. Panel D. Serum IgE.
- https://cdn.elifesciences.org/articles/87281/elife-87281-fig3-figsupp1-data1-v1.zip
Figure 3—figure supplement 2
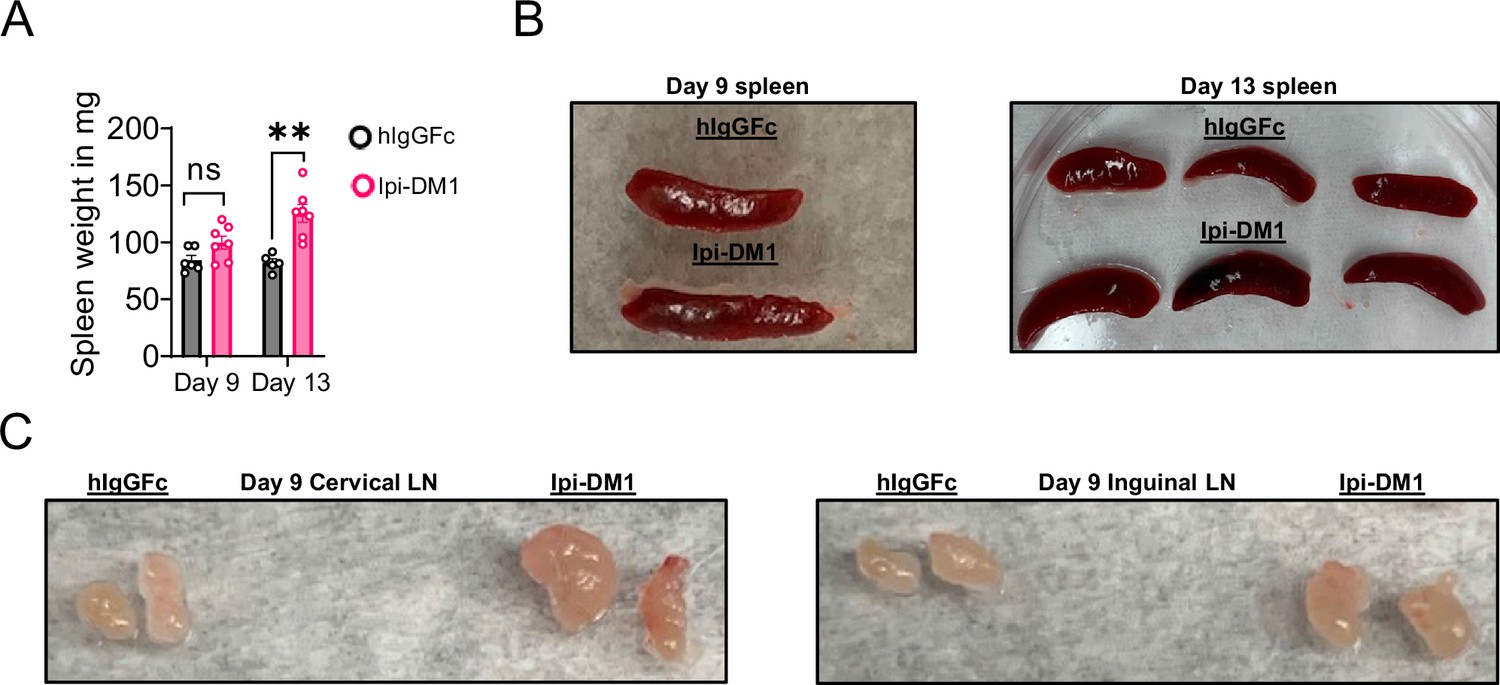
CTLA-4 antibody-drug conjugate leads to enlarged spleen and lymph nodes.
Day 9 or 13 after treatment with hIgGFc or Ipi-DM1 ADC. (A) Spleen weight. (B) Splenomegaly. (C) Lymphadenopathy. (A) Data representative of two independent experiments (n=5–7) and analyzed using an unpaired two-tailed Student’s t test and represented as mean ± SEM. Non-significant [ns], *p<0.05, **p<0.01, ***p<0.001, ****p < 0.0001.
-
Figure 3—figure supplement 2—source data 1
Data 1. Panel A. Spleen weight.
- https://cdn.elifesciences.org/articles/87281/elife-87281-fig3-figsupp2-data1-v1.zip
Figure 4 with 3 supplements
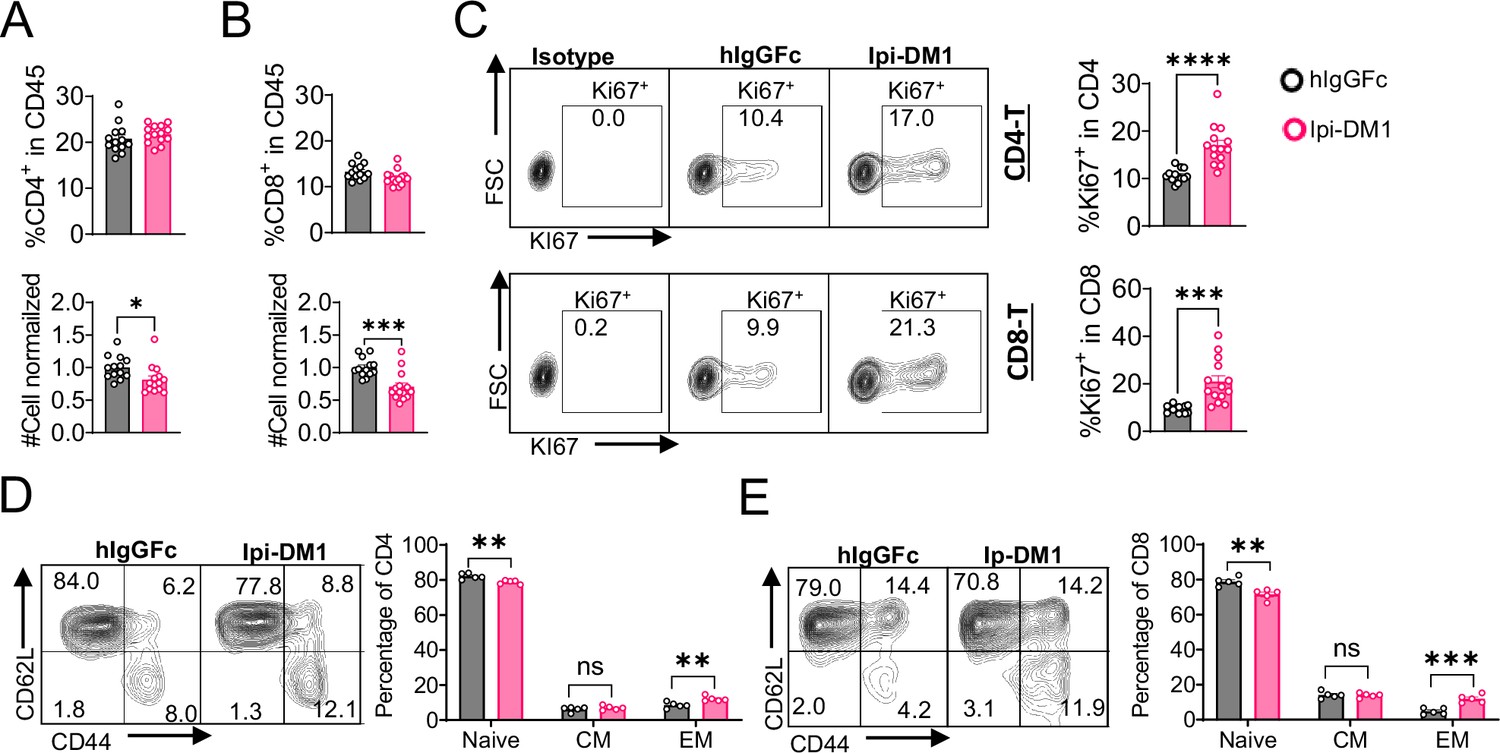
CTLA-4 antibody-drug conjugate leads to T-cell activation.
Flow data analysis of peripheral blood from Ctla4h/h mice on day 9 after treatment with hIgGFc or Ipi-DM1 ADC. (A) % CD4+ in CD45 and normalized cell number. (B) % CD8+ in CD45 and normalized cell number. (C) % Ki67+ in CD4 and CD8 T cells. (D, E) FACS profiles and summaries depicting the increase in effector T-cells after Ipi-DM1 treatment, naïve (Q1: CD44low CD62Lhi), central memory (Q2: CD44hi CD62Lhi) and effector (Q3: CD44hi CD62Llow), phenotype of CD4+ T cells (D), and CD8+ T cells (E). (B–C) Data combined from two independent experiments (n=13–14). (D–E) Data representative of two independent experiments (n=5). Data analyzed using an unpaired two-tailed Student’s t test and represented as mean ± SEM. Non-significant [ns], *p<0.05, **p<0.01, ***p<0.001, ****p < 0.0001.
-
Figure 4—source data 1
Data 1. Panel A. CD4 T-cells; Data 2. Panel B. CD8 T-cells; Data 3. Panel C. Ki67; Data 4. Panel D. CD4 T-cell activation; Data 5. Panel E. CD8 T-cell activation.
- https://cdn.elifesciences.org/articles/87281/elife-87281-fig4-data1-v1.zip
Figure 4—figure supplement 1
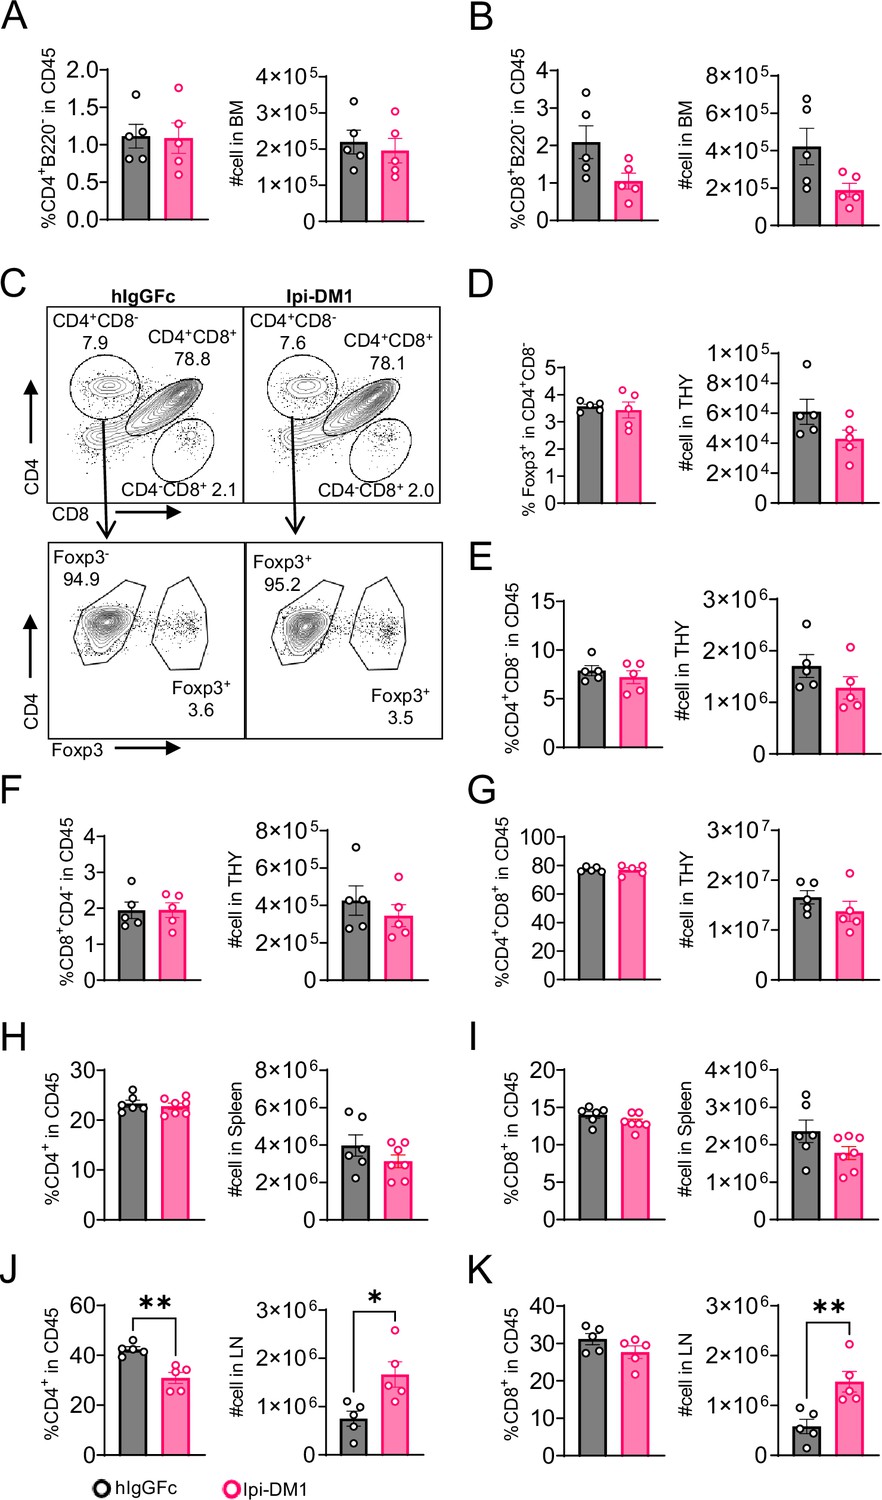
CTLA-4 antibody-drug conjugate impact on T cells in lymphoid organs.
Flow analysis of T cells at day 9 after treatment with hIgGFc or Ipi-DM1 ADC. (A, B) Bone marrow, (C–G) thymus, (H, I) spleen, (J, K) combined inguinal and cervical lymph nodes. (A) % CD4+B220- in CD45 and absolute cell number. (B) % CD8+B220- in CD45 and absolute cell number. (C) Gating strategy defining T-cell types in CD45+ cells in thymus. (D) Tregs (% Foxp3+ in CD4+CD8-) and absolute cell number. (E) % CD4+CD8- in CD45 and absolute cell number. (F) % CD8+CD4- in CD45 and absolute cell number. (G) % CD4+CD8+ in CD45 and absolute cell number. (H, J) % CD4+ in CD45 and absolute cell number. (I, K) % CD8+ in CD45 and absolute cell number. Data representative of two independent experiments (n=5–7) and analyzed using an unpaired two-tailed Student’s t test and represented as mean ± SEM. *p<0.05, **p<0.01, ***p<0.001, ****p < 0.0001.
-
Figure 4—figure supplement 1—source data 1
Data 1. Panel A. BM CD4 T-cell; Data 2. Panel B. BM CD8 T-cell; Data 3. Panel D. THY Tregs; Data 4. Panel E. THY CD4+CD8- T-cell; Data 5. Panel F. THY CD8+CD4- T-cell; Data 6. Panel G. THY CD4+CD8+ T-cell; Data 7. Panel H. Spleen CD4 T-cell; Data 8. Panel I. Spleen CD8 T-cell; Data 9. Panel J. Lymph node CD4 T-cell; Data 10. Panel K. Lymph node CD8 T-cell.
- https://cdn.elifesciences.org/articles/87281/elife-87281-fig4-figsupp1-data1-v1.zip
Figure 4—figure supplement 2
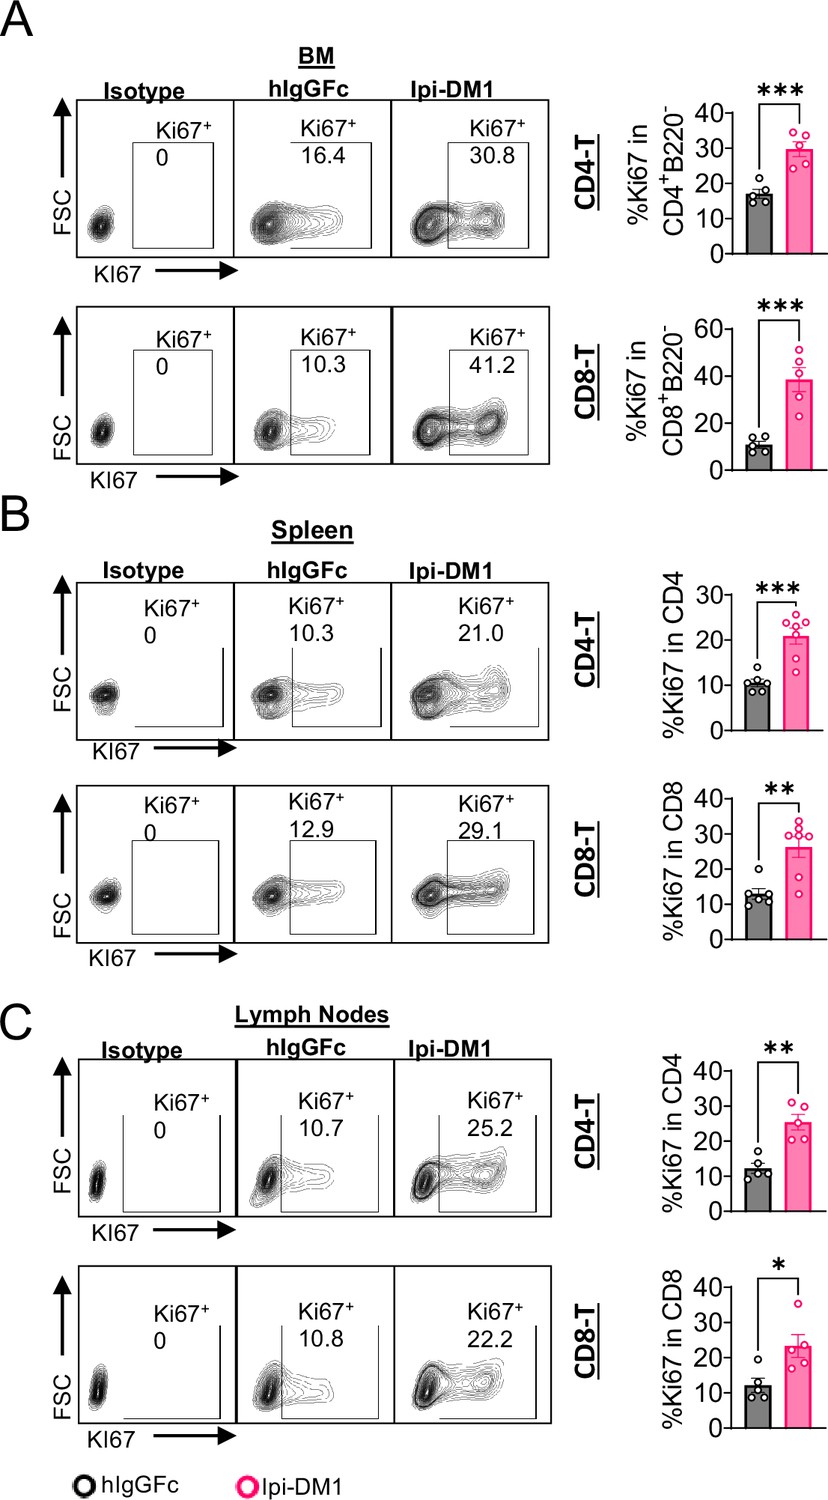
CTLA-4 antibody-drug conjugate increase T cell proliferation in lymphoid organs.
Flow analysis at day 9 after treatment with hIgGFc or Ipi-DM1 ADC. (A) % Ki67+ in CD4+B220- and CD8+B220- T cells in bone marrow. (B) % Ki67+ in CD4 and CD8 T cells in spleen. (C) % Ki67+ in CD4 and CD8 T cells in lymph nodes. Data representative of two independent experiments (n=5–7) and analyzed using an unpaired two-tailed Student’s t test and represented as mean ± SEM. *p<0.05, **p<0.01, ***p<0.001, ****p < 0.0001.
-
Figure 4—figure supplement 2—source data 1
Data 1. Panel A. BM T-cell Ki67; Data 2. Panel B. Spleen T-cell Ki67; Data 3. Panel C. Lymph Nodes T-cell Ki67.
- https://cdn.elifesciences.org/articles/87281/elife-87281-fig4-figsupp2-data1-v1.zip
Figure 4—figure supplement 3
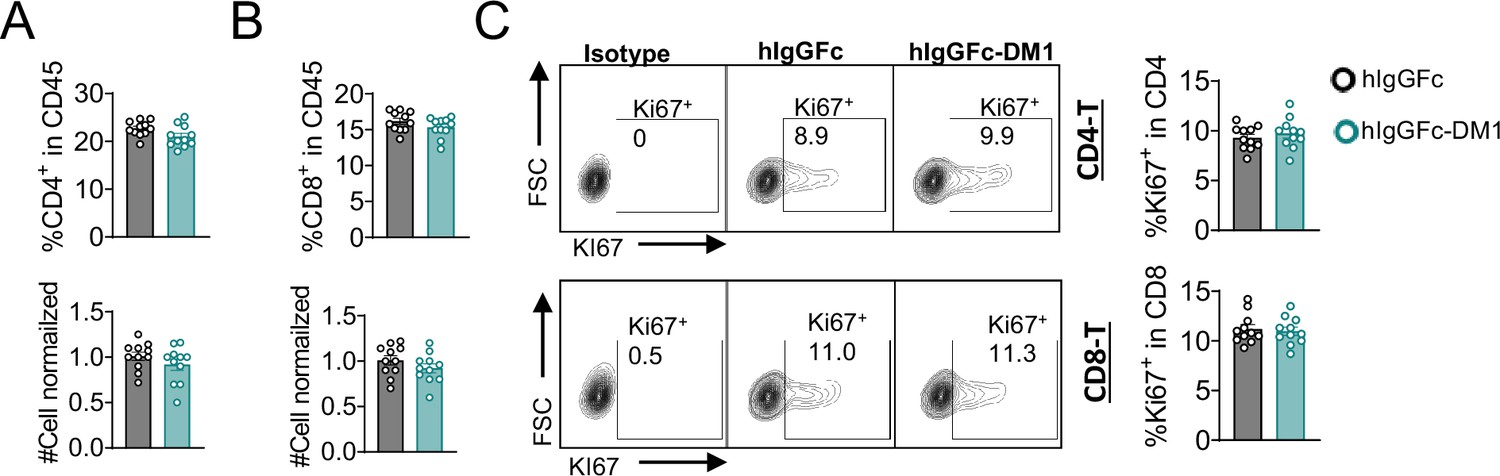
T-cell quantity and proliferation are not impacted by IgG-DM1 treatment.
Mice treated with hIgGFc or hIgGFc-DM1, blood flow analysis on day 9. (A) % CD4+ in CD45 and normalized cell number. (B) % CD8+ in CD45 and normalized cell number. (C) % Ki67+ in CD4 and CD8 T cells. Data combined from two independent experiments (n=11) and analyzed using an unpaired two-tailed Student’s t test and represented as mean ± SEM. *p<0.05, **p<0.01, ***p<0.001, ****p < 0.0001.
-
Figure 4—figure supplement 3—source data 1
Data 1. Panel A. CD4 T-cells; Data 2. Panel B. CD8 T-cells; Data 3. Panel C. Ki67.
- https://cdn.elifesciences.org/articles/87281/elife-87281-fig4-figsupp3-data1-v1.zip
Figure 5
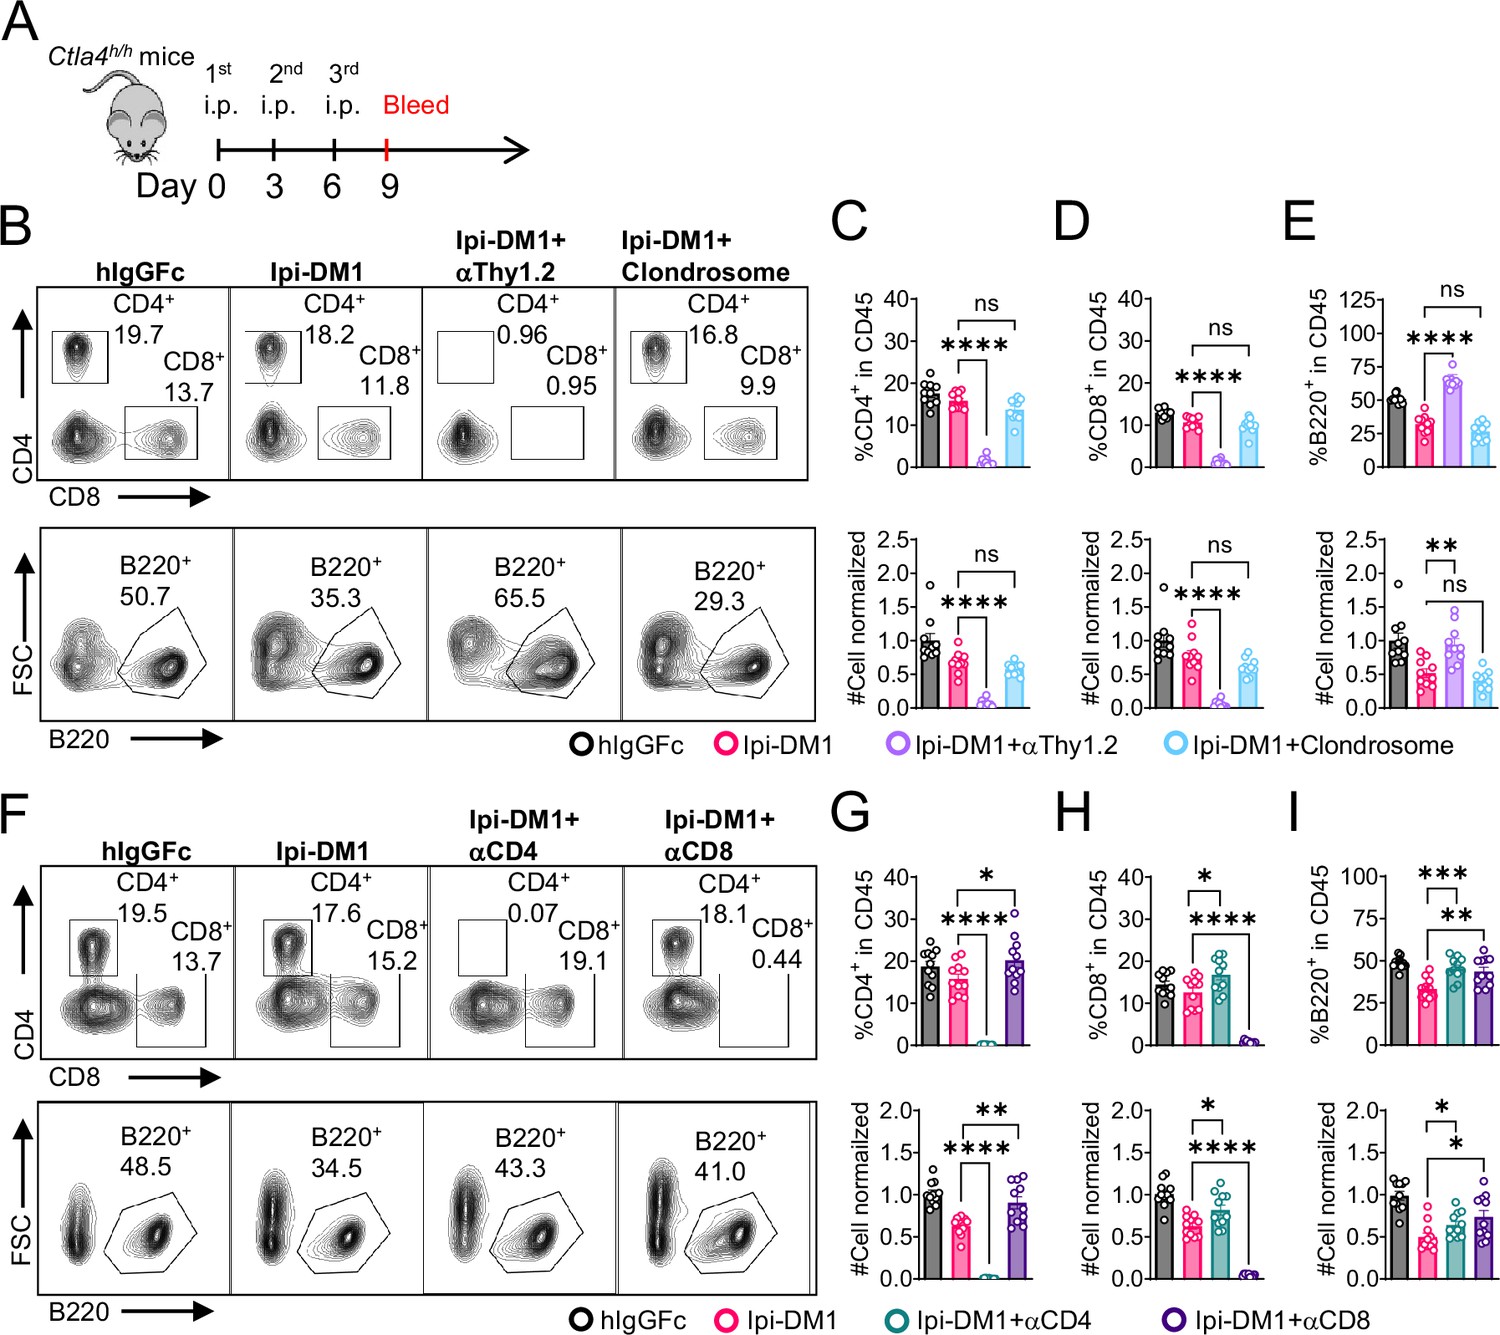
B-cell depletion depends on T-cells but not macrophage.
(A) Diagram of experimental design, male or female Ctla4h/h mice were treated intraperitoneal (i.p.) (100 μg/mouse) with hIgGFc or Ipi-DM1 with/out (T-cell depleting antibody 100 μg/mouse of anti-Thy1.2 or 150 μL/mouse of clondrosome or depleting antibody CD4 or CD8 100 μg/mouse) every 3 days and mice were bled on day 9 for downstream flow analysis. (B) FACS profiles depicting gating strategy after gating on CD45 for CD8 & CD4 T (top panel) and B cells (bottom panel). (C–E) Data summaries from FACS profile(panel B), (C) % CD4+ in CD45 and normalized cell number, (D) % CD8+ in CD45 and normalized cell number, and (E) % B220+ in CD45 and normalized cell number. (F) FACS profiles depicting gating strategy after gating on CD45 for CD8 & CD4 T (top panel) and B cells (bottom panel). (G–I) Data summaries from FACS profile(panel F), (G) % CD4+ in CD45 and normalized cell number, (H) % CD8+ in CD45 and normalized cell number, and (I) % B220+ in CD45 and normalized cell number. (B–E) Data combined from two independent experiments (n=10) and analyzed by ordinary one-way ANOVA with Tukey’s multiple comparisons test and represented as mean ± SEM. Non-significant [ns], *p < 0.05, **p < 0.01, ***p < 0.001, ****p < 0.0001. (F–I) Data combined from two independent experiments (n=11) and analyzed by unpaired two-tailed Student’s t test and represented as mean ± SEM. *p<0.05, **p<0.01, ***p<0.001, ****p < 0.0001.
-
Figure 5—source data 1
Datat 1. Panel C. CD4 T-cells; Data 2. Panel D. CD8 T-cells; Data 3. Panel E. B cells; Data 4. Panel G. CD4 T-cells; Data 5. Panel H. CD8 T-cells; Data 6. Panel I. B cells.
- https://cdn.elifesciences.org/articles/87281/elife-87281-fig5-data1-v1.zip
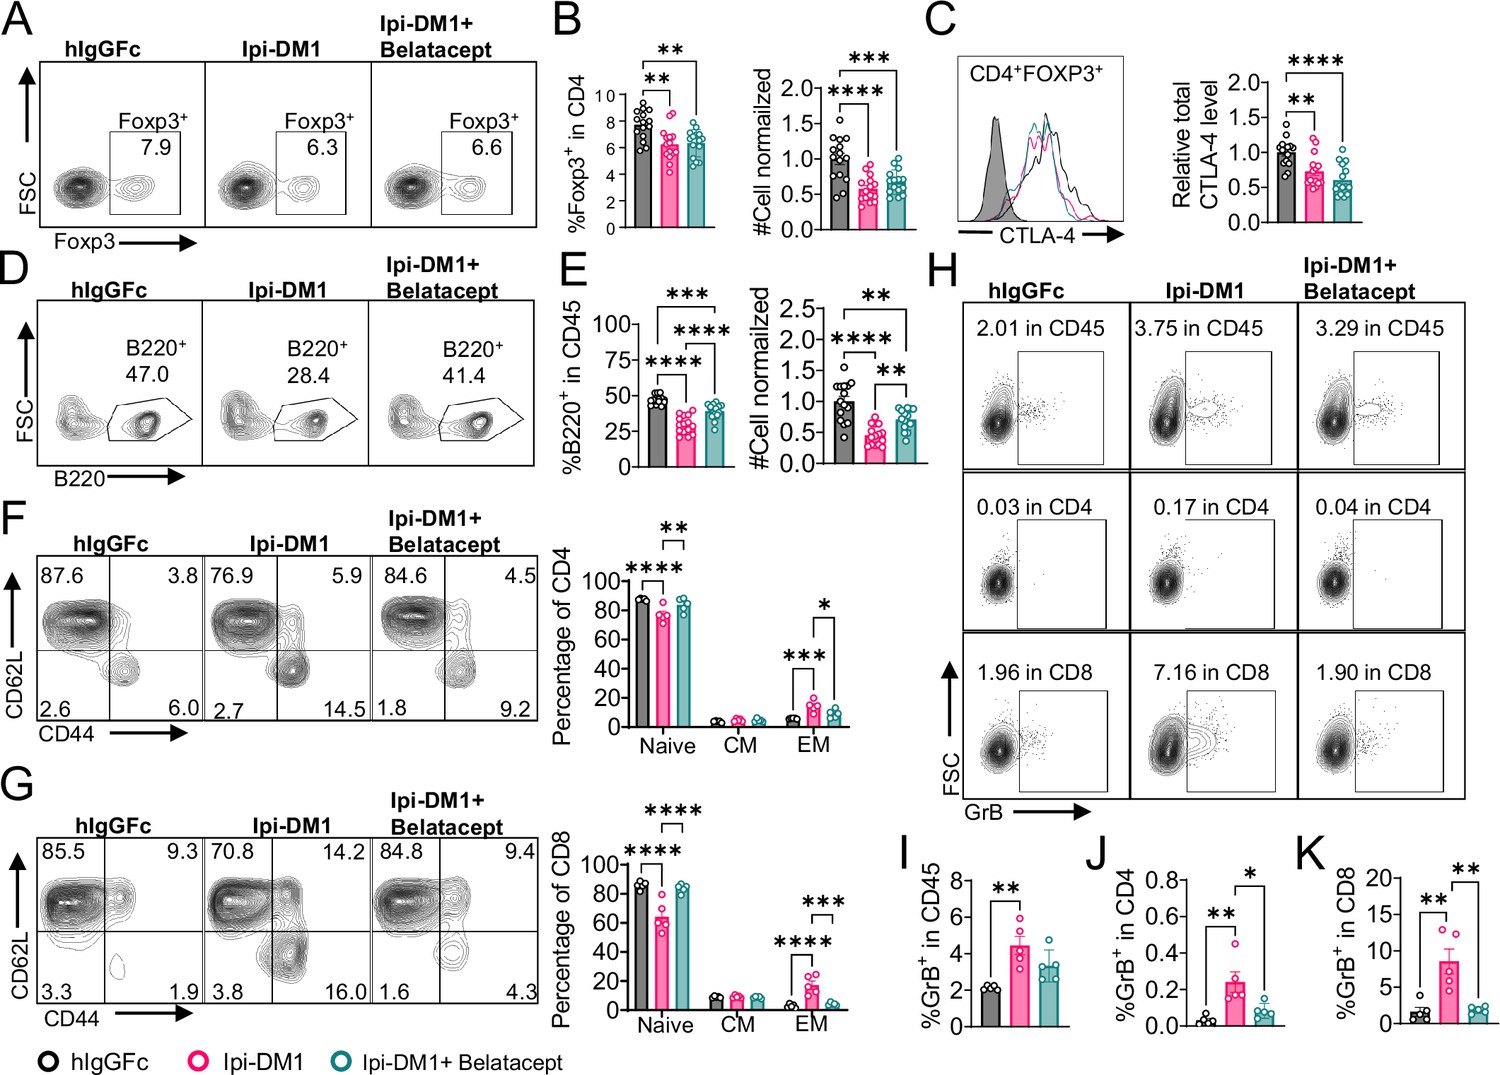
Figure 6 with 2 supplements
Mutant soluble CTLA-4-Ig rescues B-cell.
Ctla4h/h mice were treated intraperitoneal (i.p.) (100 μg/mouse) with hIgGFc or Ipi-DM1 with/out (100 μg/mouse of Belatacept) every 3 days for total of three doses and mice were bled on day 9 for downstream flow analysis.(A, D) FACS profiles depicting gating strategy after gating on CD45 for (A) Tregs (% Foxp3+ in CD4 T cells) and (D) B cells (% B220+ in CD45). (B) % Foxp3+ (Tregs) in CD4 and normalized cell number. (C) Representative FACS profile of CTLA-4 expression in Tregs (CD4+ Foxp3+) and Relative CTLA-4 summary. (E) % B220+ in CD45 and normalized cell number. (F–G) FACS gate and summaries showing mutant CTLA-4-Ig can decrease effector memory T-cells associated with Ipi-DM1 treatment, naïve (Q1: CD44low CD62Lhi), central memory (Q2: CD44hi CD62Lhi) and effector (Q3: CD44hi CD62Llow), phenotype of CD4+ T cells (F), and CD8+ T cells (G). (H) FACS of GranzymeB gating in CD45 (Top panel), CD4 (middle panel), and CD8 (bottom panel). (I–K) GranzymeB expression summaries in (I) CD45, (J) CD4, and (K) CD8 cells. (A–E) Data combined from three independent experiments (n=15). (F–K) Data representative of two independent experiments (n=5). Data analyzed by ordinary one-way ANOVA with Tukey’s multiple comparisons test and represented as mean ± SEM. Non-significant [ns], *p < 0.05, **p < 0.01, ***p < 0.001, ****p < 0.0001.
-
Figure 6—source data 1
Data 1. Panel B. Tregs; Data 2. Panel C. CTLA-4; Data 3. Panel E. B cells; Data 4. Panel F. CD4 T-cell activation; Data 5. Panel G. CD8 T-cell activation; Data 6. Panel I. GranzymeB in CD45; Data 7. Panel J. GranzymeB in CD4; Data 8. Panel K. GranzymeB in CD8.
- https://cdn.elifesciences.org/articles/87281/elife-87281-fig6-data1-v1.zip
Figure 6—figure supplement 1

Mutant soluble CTLA-4-Ig does not neutralize Ipilimumab or its drug-conjugate.
(A) Detached CHO cells expressing hCTLA-4 were incubated with serial dilution of Ipi or Ipi-DM1 in the presence of given dose of Abatacept or Belatacept on ice for 30 min followed by FACS detection using mouse anti-human IgG AF488, mean fluorescence intensity (MFI) (n=1). (B) MTT cell viability of CHO-hCTLA-4 cells after 72 hr incubation with Ipi or Ipi-DM1 in the presence of given dose of Abatacept or Belatacept (n=3). Data representative of two independent experiments.
-
Figure 6—figure supplement 1—source data 1
Data 1. Panel A. Mutant soluble hCTLA-4-Ig blocking of anti-CTLA-4/ADC; Data 2. Panel B. Mutant soluble hCTLA-4-Ig neutralization of anti-CTLA-4/ADC.
- https://cdn.elifesciences.org/articles/87281/elife-87281-fig6-figsupp1-data1-v1.zip
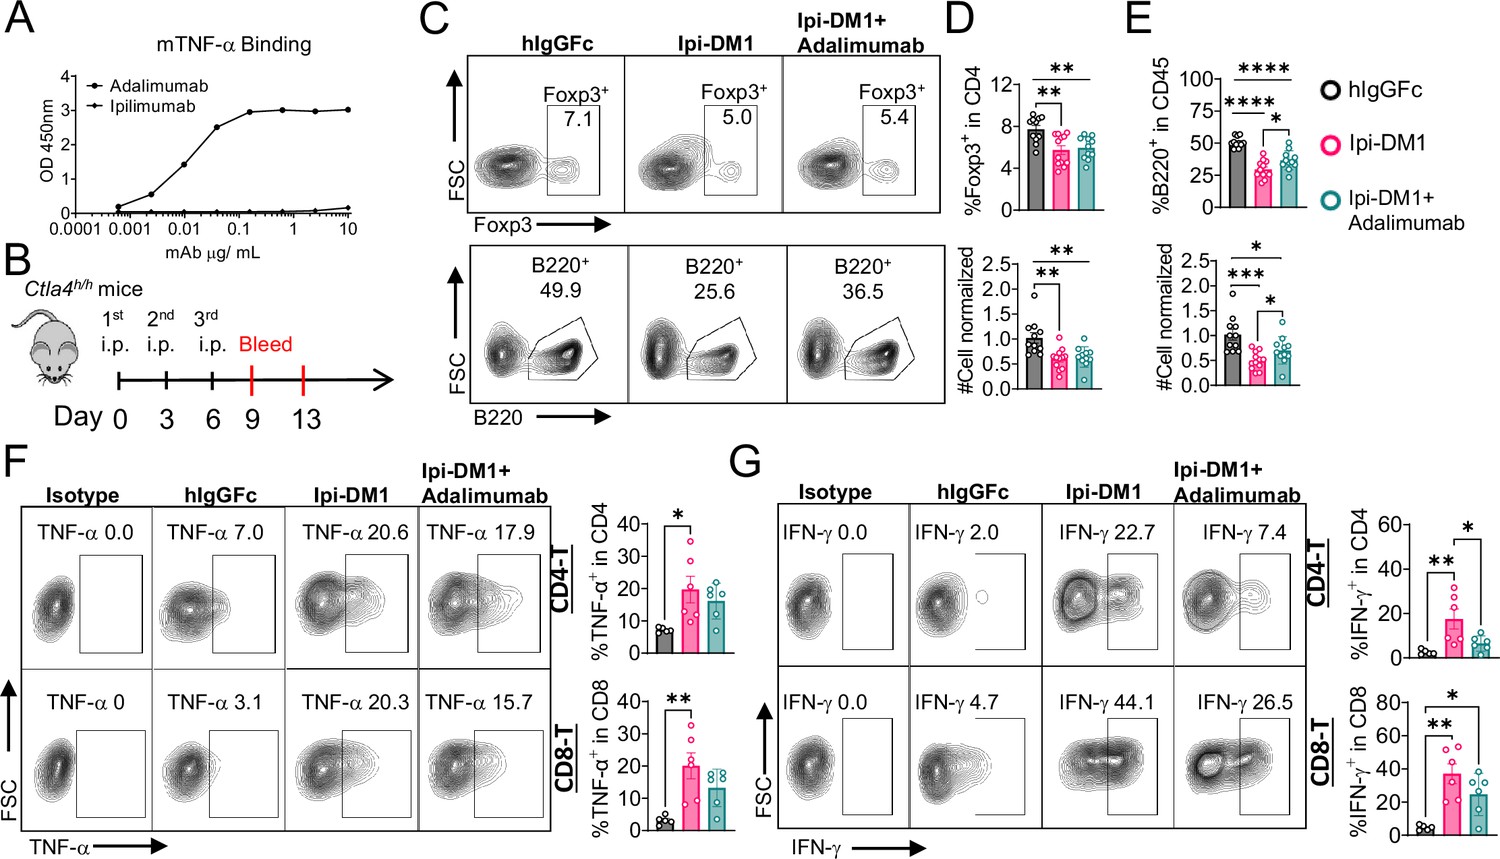
Figure 6—figure supplement 2

T-cell cytokine production.
Day 13 peripheral blood samples from treated (hIgGFc or Ipi-DM1 with/out Belatacept) mice post ACK buffer red blood lysis were cultured and stimulated in the presence of Iononmycin/PMA, and GolgiPlug for 4 hr followed by intracellular cytokine detection (TNF-alpha, IFN-gamma) in CD4 and CD8 T cells. Data is representative of two independent experiments (n=5) analyzed by ordinary one-way ANOVA with Tukey’s multiple comparisons test and represented as mean ± SEM. *p < 0.05, **p < 0.01, ***p < 0.001, ****p< 0.0001.
-
Figure 6—figure supplement 2—source data 1
Data 1. Cytokine production in T-cells.
- https://cdn.elifesciences.org/articles/87281/elife-87281-fig6-figsupp2-data1-v1.zip
Figure 7 with 1 supplement
B-cell depletion is partially rescued by anti-TNF-alpha.
(A) ELISA binding of clinical grade drug Adalimumab (Humira) to pre-coated 1 μg/mL mouse-TNF-alpha and detected with anti-hIgG-HRP, Ipilimumab negative control (n=2). (B) Diagram of experimental design, male Ctla4h/h mice were treated intraperitoneal (i.p.) (100 μg/mouse) with hIgGFc or Ipi-DM1 with/out (100 μg/mouse of Adalimumab) every three days for total of three doses and mice were bled on days 9 and 13. (C) FACS profiles depicting gating strategy after gating on CD45 for Tregs (% Foxp3+ in CD4) (top panel) and B cells (% B220+ in CD45) (bottom panel) from day 9 peripheral blood. (D) % Foxp3+ (Tregs) in CD4 and normalized cell number. (E) % B220+ in CD45 and normalized cell number. (F, G) Day 13 peripheral blood post red blood lysis by ACK buffer were cultured and stimulated in the presence of Iononmycin/PMA, and GolgiPlug for 4 hr followed by intracellular cytokine detection (TNF-alpha, IFN-gamma) in CD4 and CD8 T cells, (F) TNF-alpha, and (G) IFN-gamma. (C–E) Data combined from two independent experiments (n=11–12) and analyzed using an unpaired two-tailed Student’s t test and represented as mean ± SEM. *p<0.05, **p<0.01, ***p<0.001, ****p < 0.0001. (F, G) Data representative of two independent experiments (n=5–6) and analyzed by ordinary one-way ANOVA with Tukey’s multiple comparisons test and represented as mean ± SEM. *p < 0.05, **p < 0.01, ***p < 0.001, ****p < 0.0001.
-
Figure 7—source data 1
Data 1. Panel A. Elisa binding; Data 2. Panel D. Tregs; Data 3. Panel E. B cells; Data 4. Panel F. T-cell TNF-alpha; Data 5. Panel G. T-cell interferon-gamma.
- https://cdn.elifesciences.org/articles/87281/elife-87281-fig7-data1-v1.zip
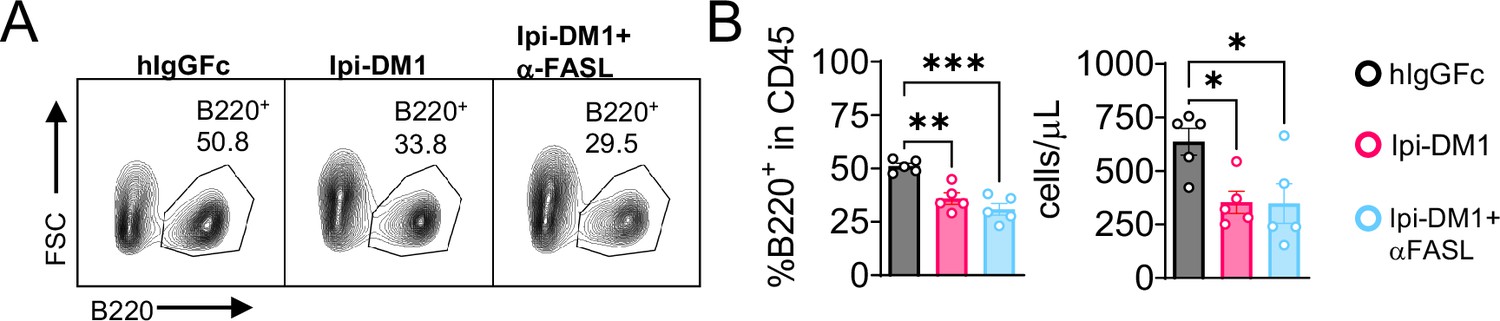
Figure 7—figure supplement 1
Anti-FASL fails to rescue B cell.
Ctla4h/h mice were treated intraperitoneally (i.p.) (100 μg/mouse) with hIgGFc or Ipi-DM1 with/out (100 μg/mouse of anti-FASL) every three days for a total of three doses and mice were bled on day 9. (A) FACS profile after gating on CD45 for B cells. (B) % B220+ in CD45 and absolute B cell number summaries. Data representative of one experiment (n=5) analyzed by ordinary one-way ANOVA with Tukey’s multiple comparisons test and represented as mean ± SEM. *p < 0.05, **p < 0.01, ***p < 0.001, ****p < 0.0001.
-
Figure 7—figure supplement 1—source data 1
Data 1. Panel B. B cells.
- https://cdn.elifesciences.org/articles/87281/elife-87281-fig7-figsupp1-data1-v1.zip
Additional files
-
MDAR checklist
- https://cdn.elifesciences.org/articles/87281/elife-87281-mdarchecklist1-v1.docx
-
Supplementary file 1
Table S1.
Drug to antibody ratio (DAR).
- https://cdn.elifesciences.org/articles/87281/elife-87281-supp1-v1.docx
Download links
A two-part list of links to download the article, or parts of the article, in various formats.
Downloads (link to download the article as PDF)
Open citations (links to open the citations from this article in various online reference manager services)
Cite this article (links to download the citations from this article in formats compatible with various reference manager tools)
CTLA-4 antibody-drug conjugate reveals autologous destruction of B-lymphocytes associated with regulatory T cell impairment
eLife 12:RP87281.
https://doi.org/10.7554/eLife.87281.3


