Brain age has limited utility as a biomarker for capturing fluid cognition in older individuals
- Department of Psychology, University of Otago, New Zealand
Figures
Figure 1
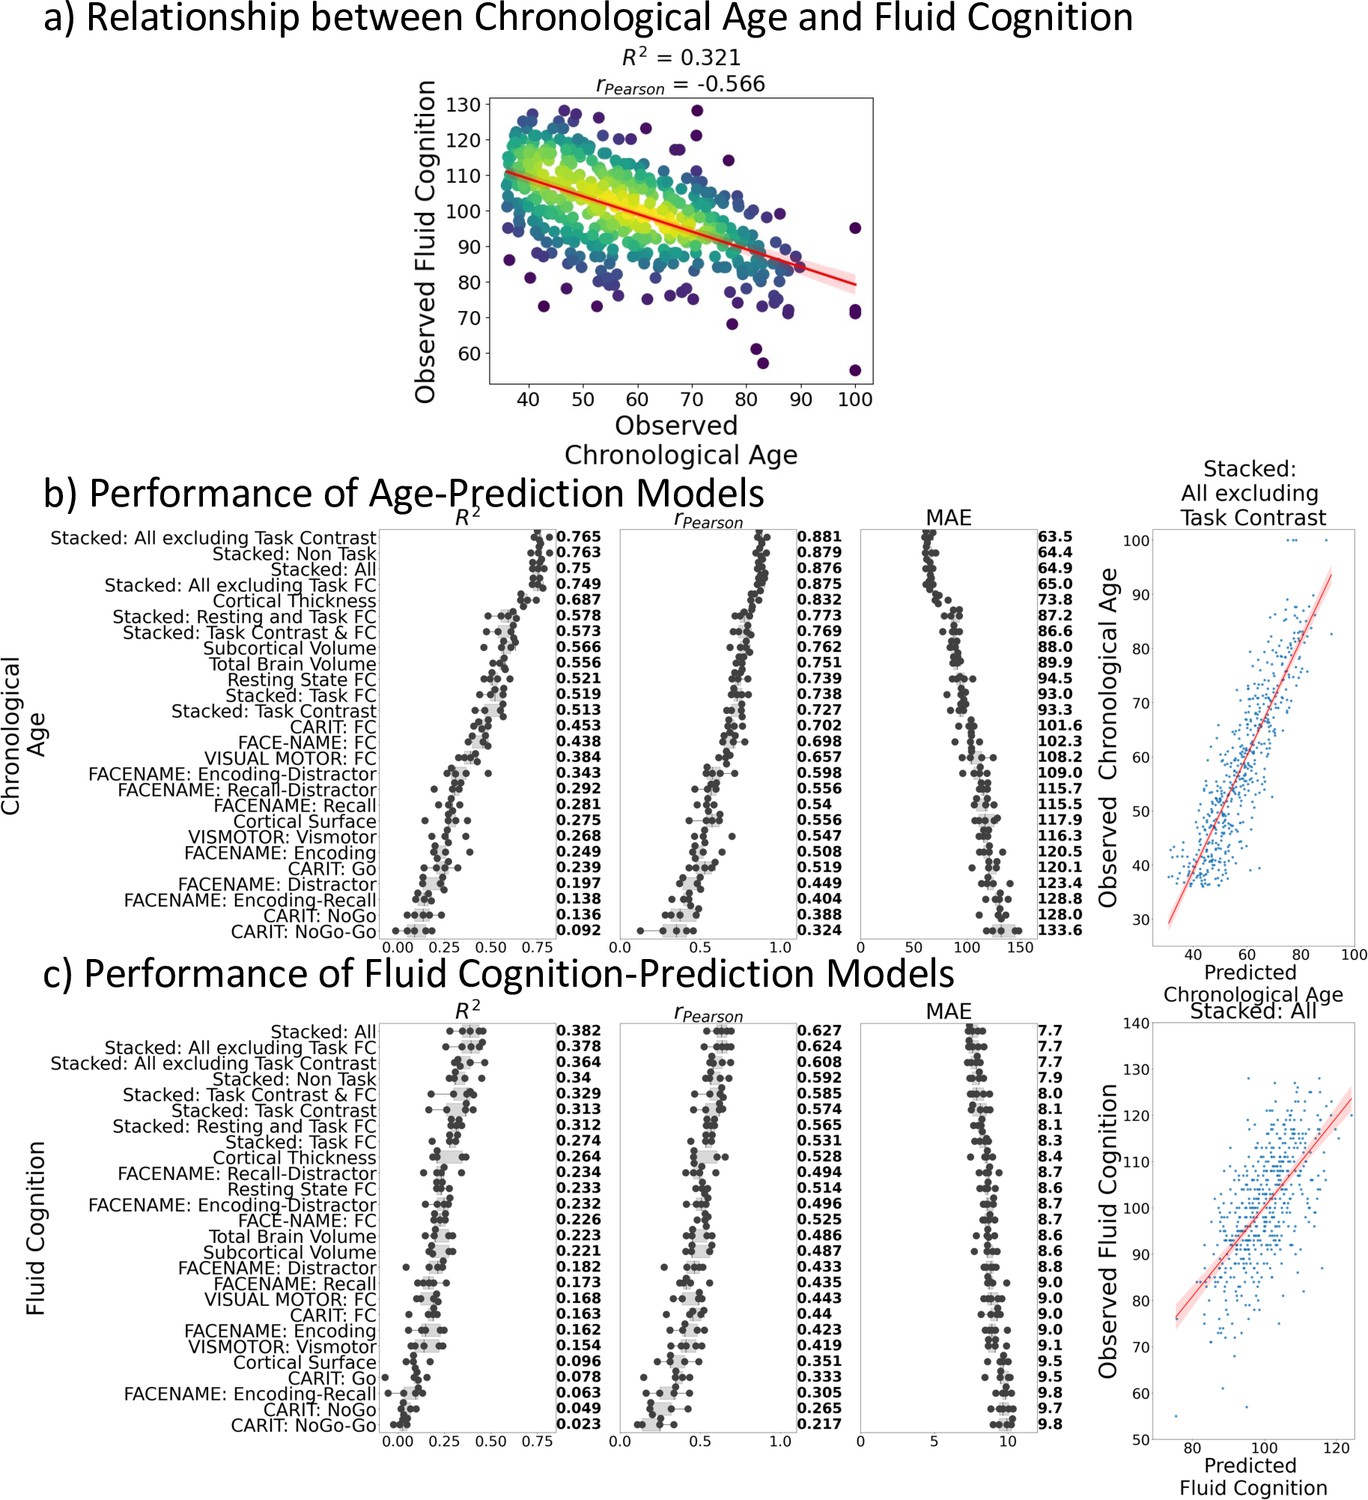
Relationship between chronological age and fluid cognition.
(a) and predictive performance of prediction models using Brain MRI from different sets of MRI features to predict chronological age (b) and fluid cognition (c). Each dot in (b) and (c) represents predictive performance at each of the five outer-fold test sets. The numbers to the right of the predictive performance plots indicate the mean of predictive performance across the five outer-fold test sets. Note we only provided the scatter plots between observed and predicted values in the outer-fold test sets from the best prediction models for each target (age in years and fluid cognition in points) in this figure. See Figure 2—figure supplement 1 and Figure 2—figure supplement 2 for the scatter plots from other prediction models.
Figure 2 with 2 supplements
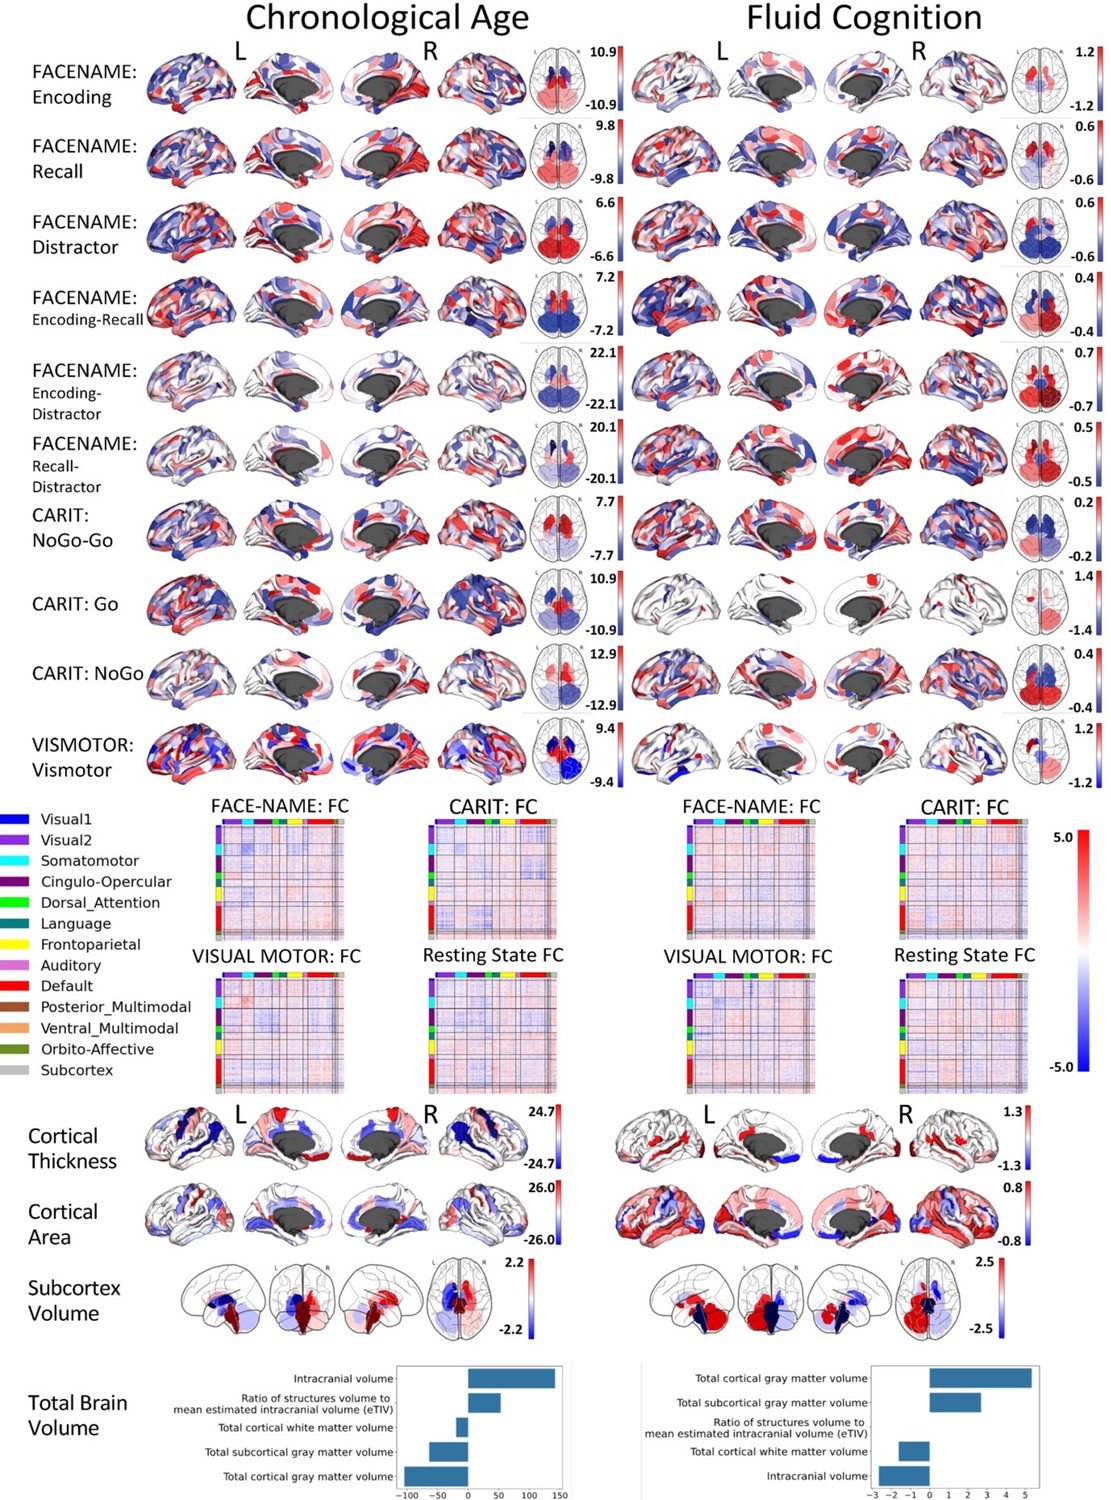
Feature importance (i.e. Elastic Net Coefficients) of prediction models based on each of the 18 sets of features.
Figure 2—figure supplement 1
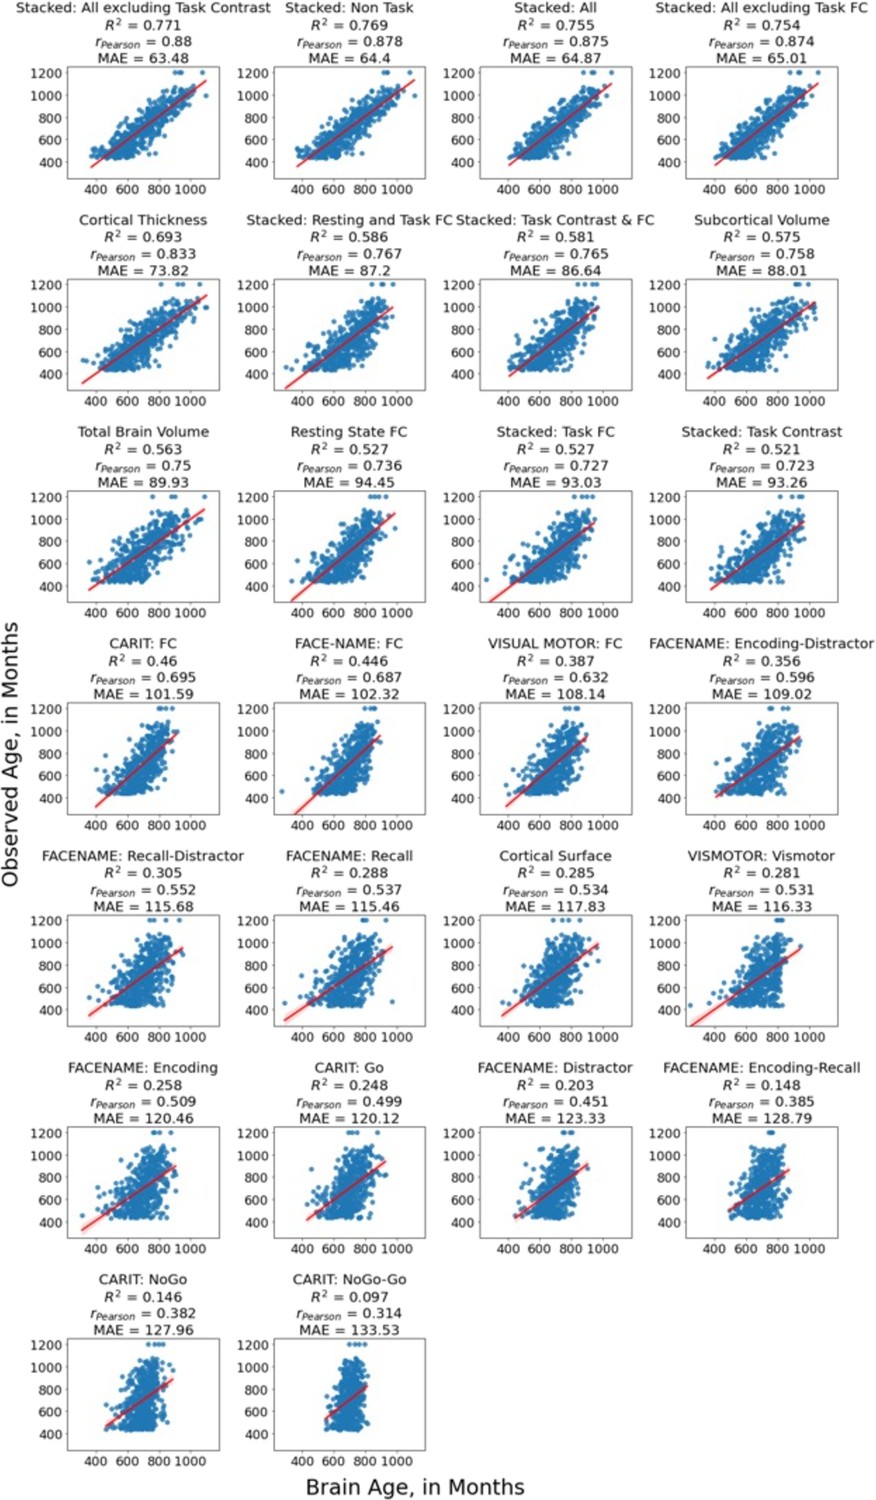
The scatter plots between observed and predicted values in the outer-fold test sets from age-prediction models.
Figure 2—figure supplement 2
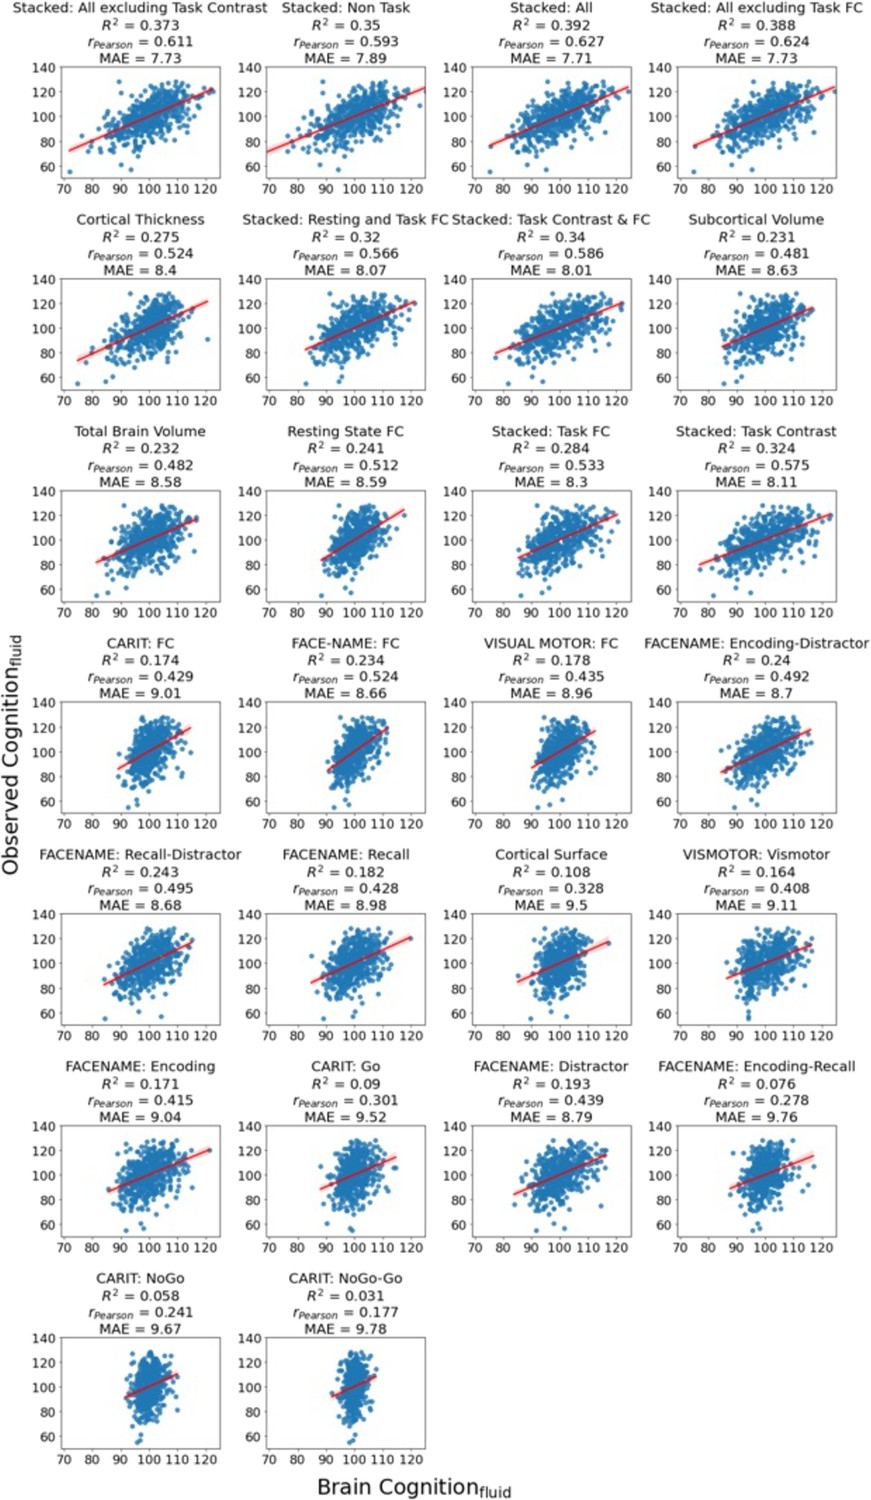
The scatter plots between observed and predicted values in the outer-fold test sets from cognition-prediction models.
Figure 3
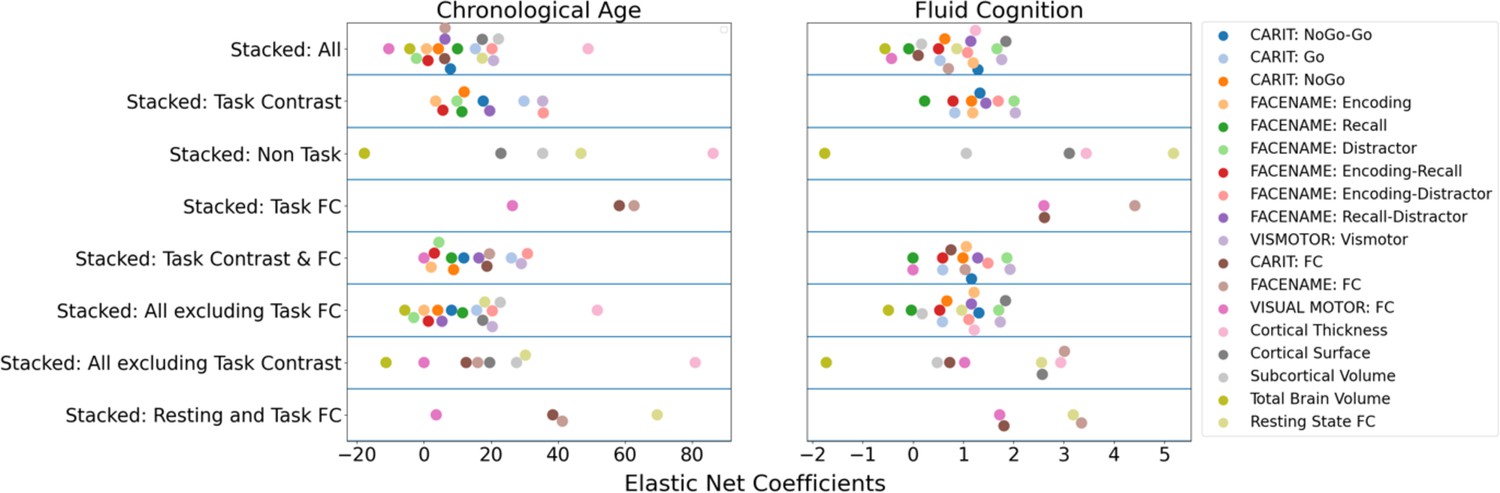
Feature importance (i.e. Elastic Net Coefficients) of the eight stacked prediction models.
Figure 4
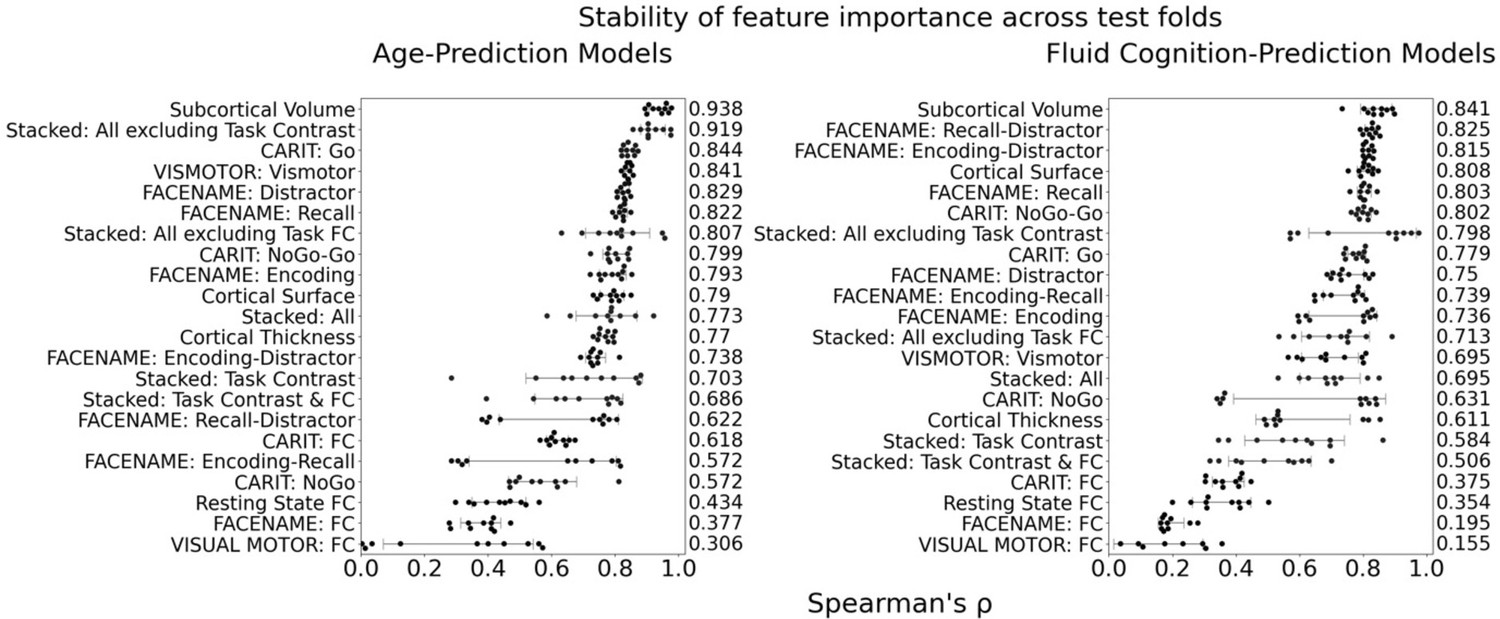
Stability of feature importance (i.e. Elastic Net Coefficients) of prediction models.
Each dot represents rank stability (reflected by Spearman’s ρ) in the feature importance between two prediction models of the same features, used in two different outer-fold test sets. Given that there were five outer-fold test sets, there were 10 Spearman’s ρs for each prediction model. The numbers to the right of the plots indicate the mean of Spearman’s ρ for each prediction model.
Figure 5
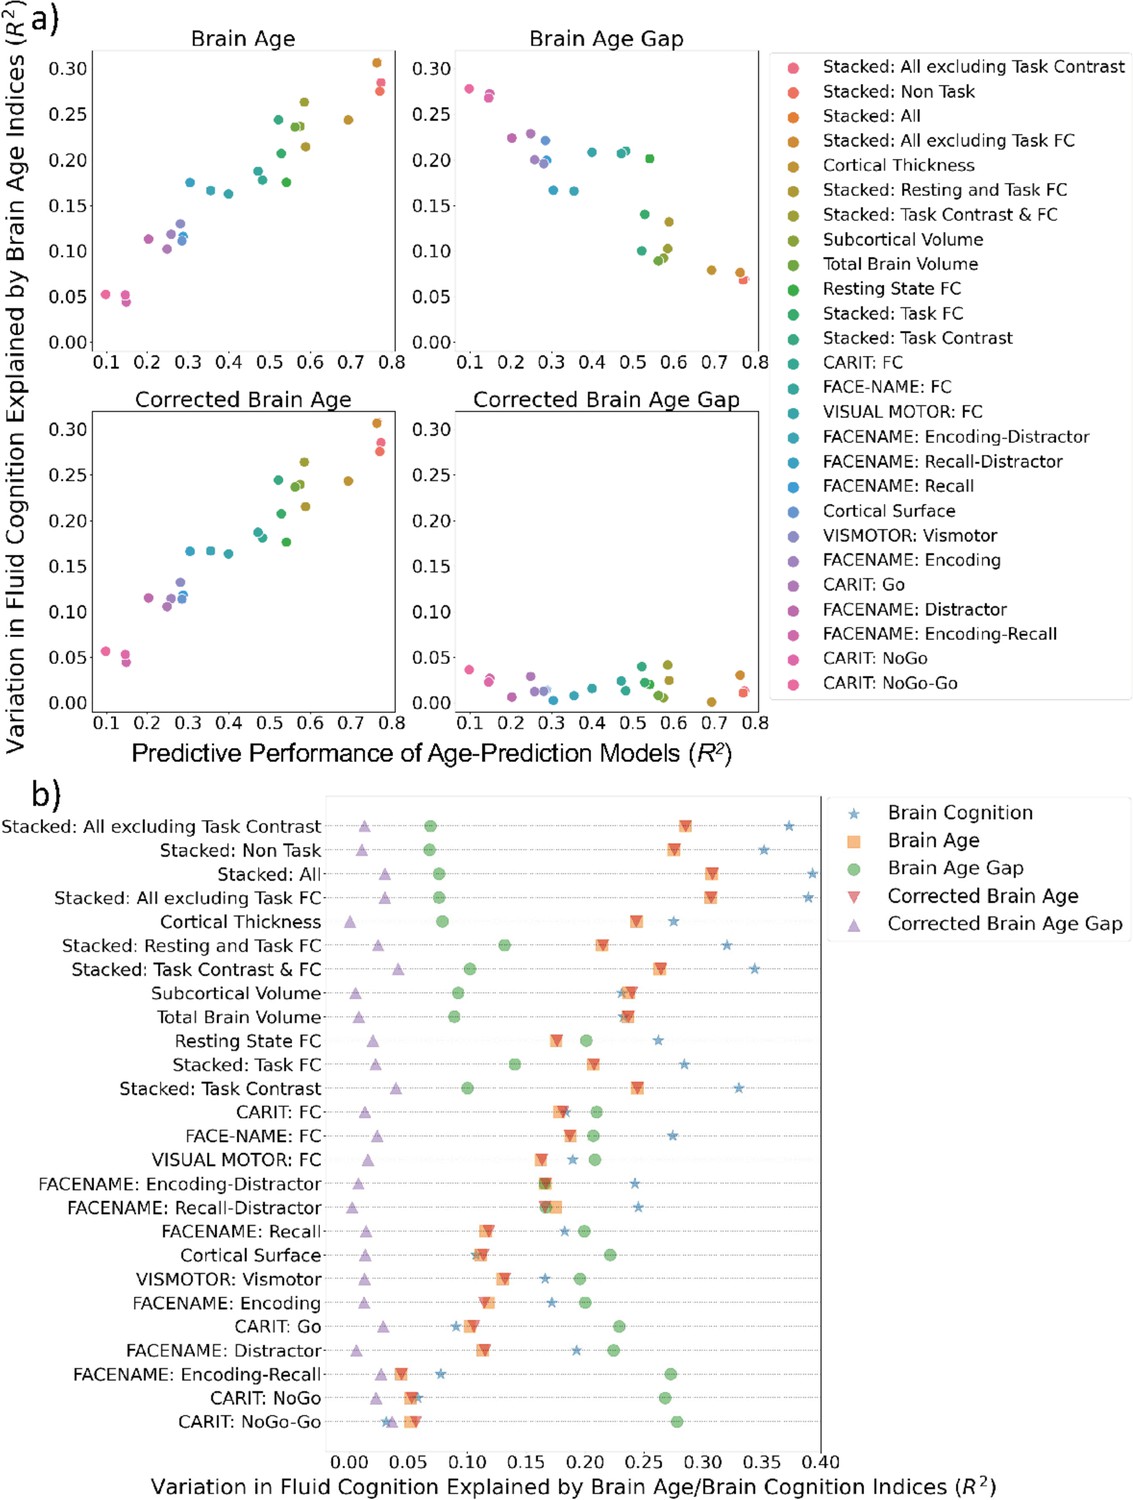
Simple regression: using each Brain Age index or Brain Cognition to explain fluid cognition.
(a) shows variation in fluid cognition explained by each Brain Age index as a function of the predictive performance of age-prediction models. (b) plots variation in fluid cognition explained by Brain Age indices and Brain Cognition.
Figure 6 with 2 supplements
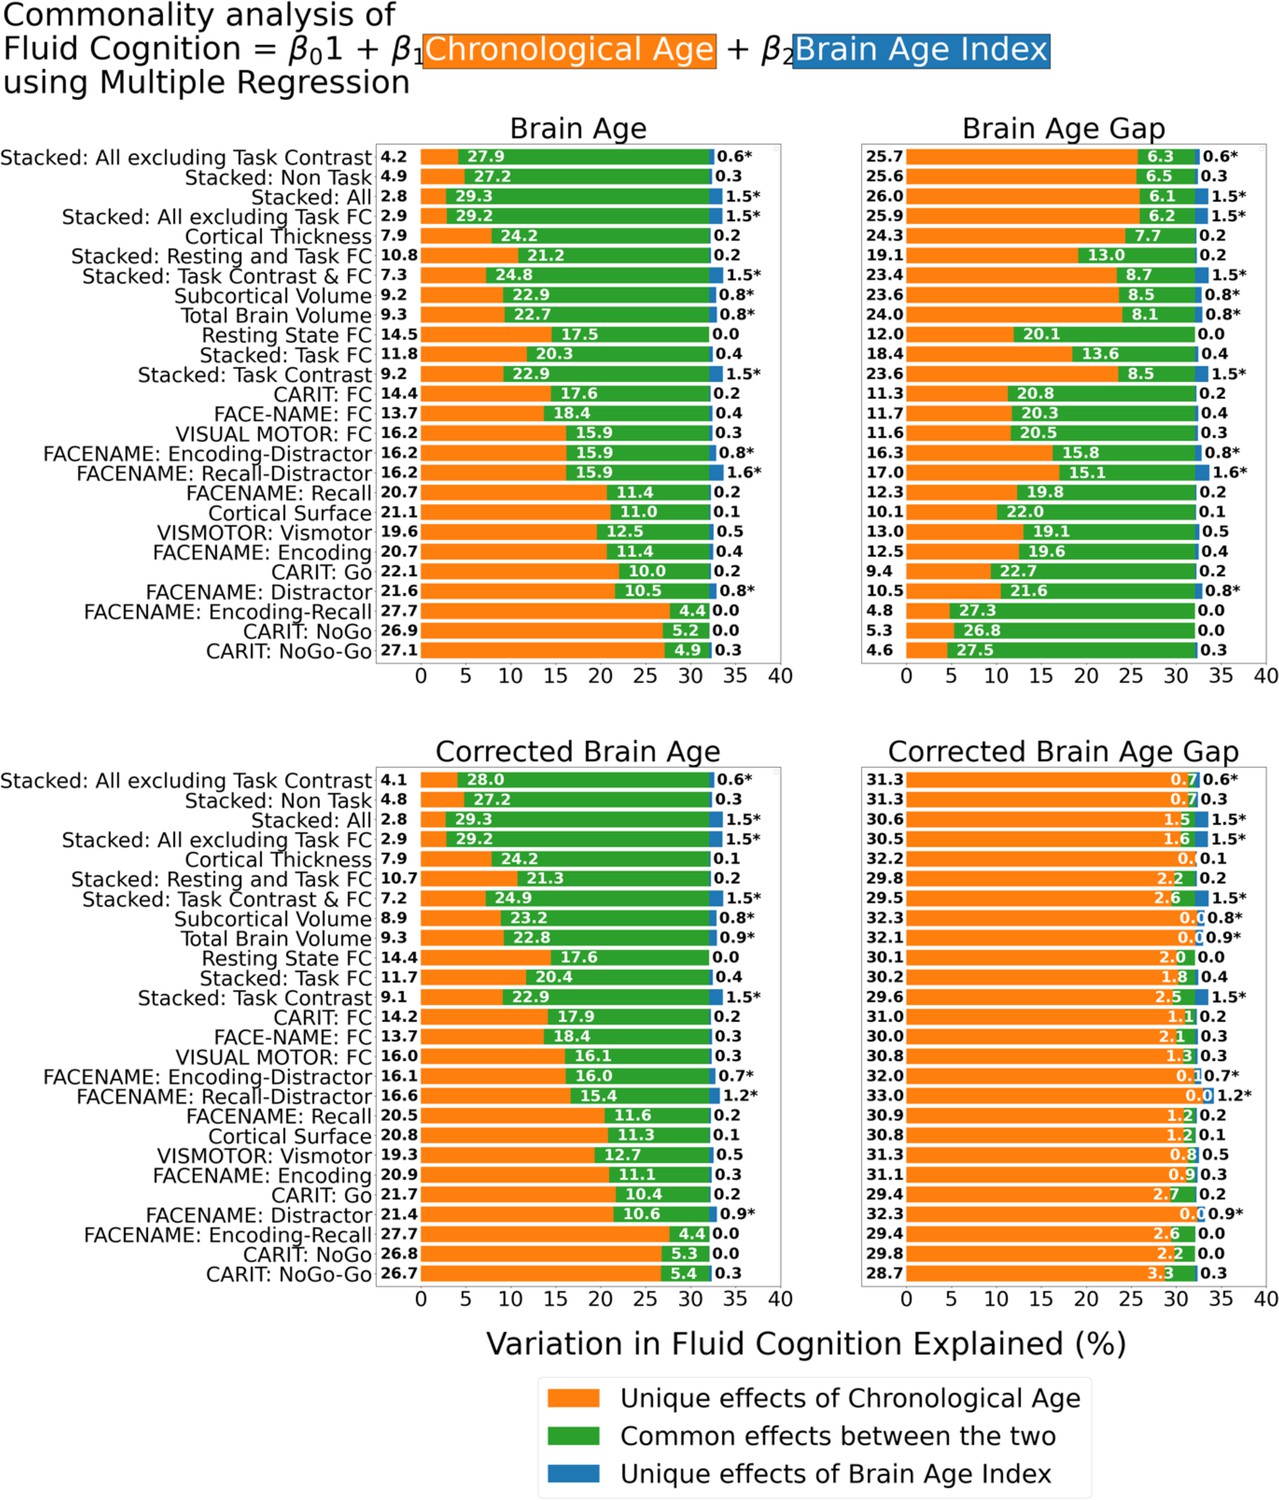
Commonality analysis of multiple regressions, having both chronological age and each Brain Age index as the regressors for capturing fluid cognition.
The numbers to the left of the figure represent the unique effects of chronological age in %, the numbers in the middle of the figure represent the common effects between chronological age and Brain Age index in %, and the numbers to the right of the figure represent the unique effects of Brain Age Index in %. * represents the statistical significance of the unique effects of Brain Age Index at p<0.05.
Figure 6—figure supplement 1
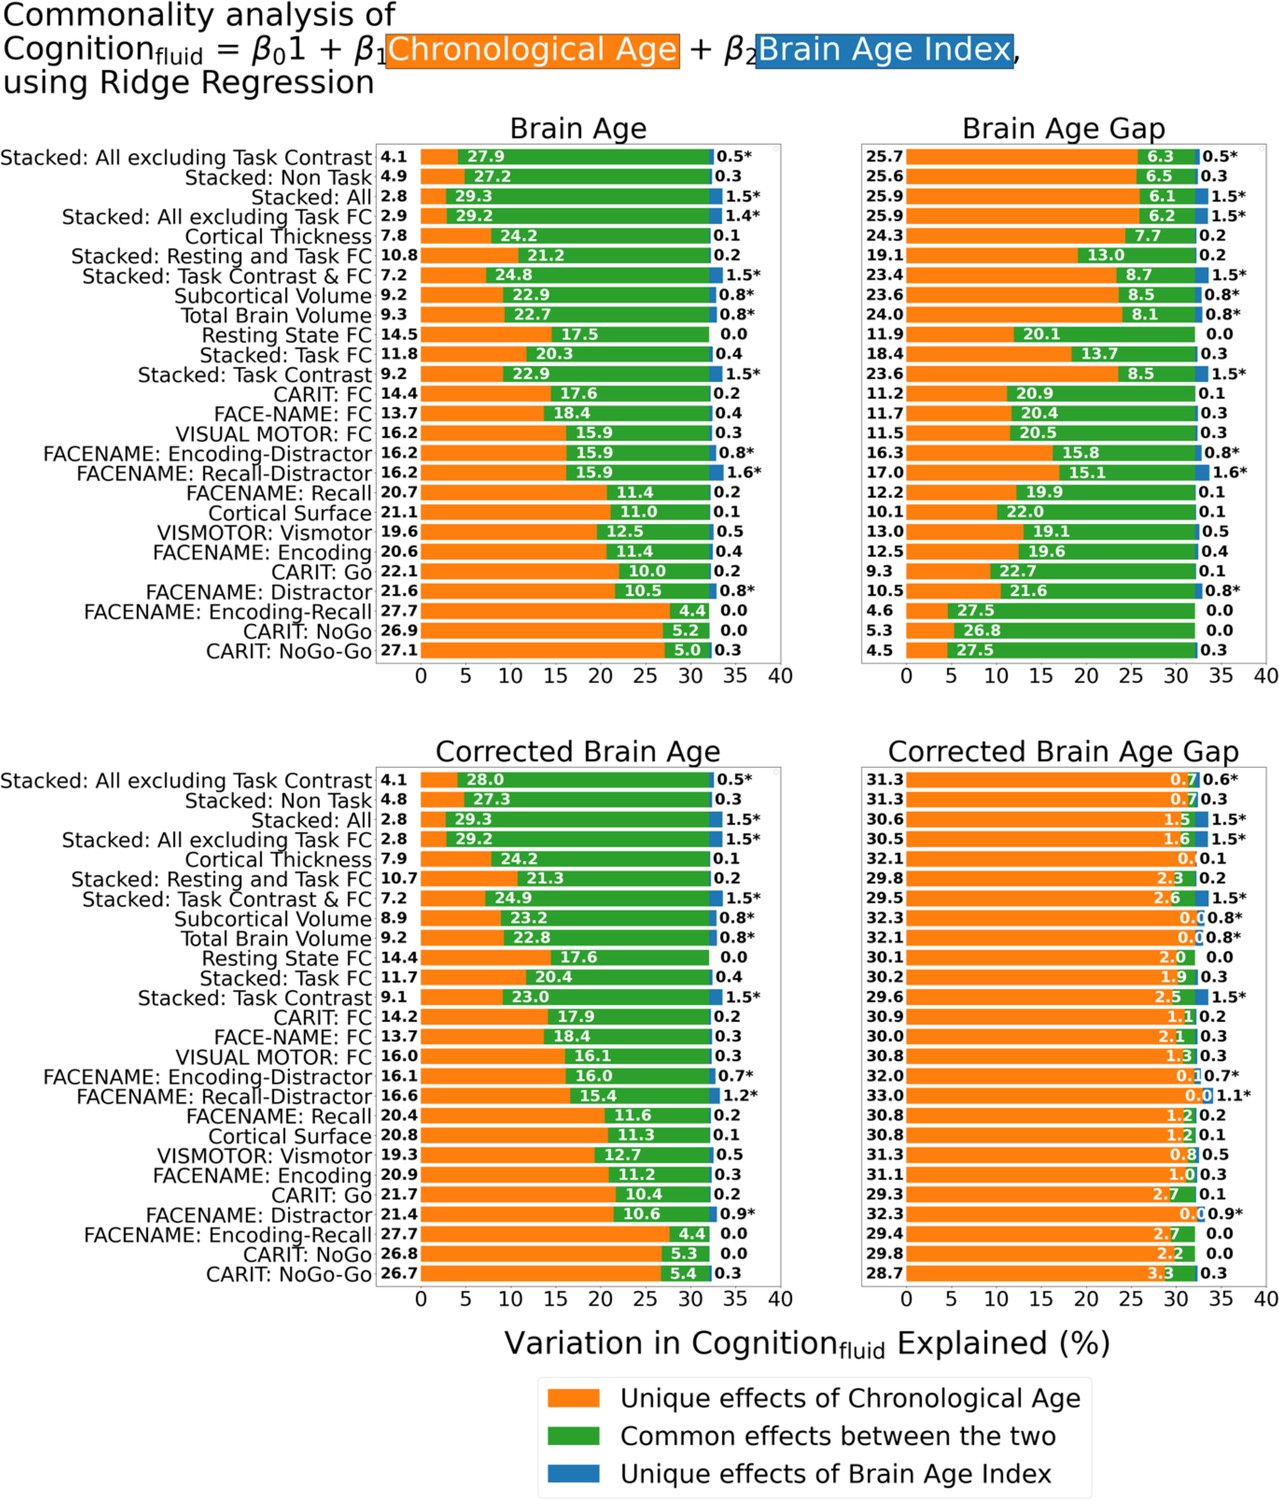
Commonality analysis of Ridge regressions, having both chronological age and each Brain Age index as the regressors for capturing fluid cognition.
Note we used Ridge regressions for models with both chronological age and each Brain Age index as the regressors and simple regressions for models with a single regressor (apart from the intercept). The numbers to the left of the figures represent the unique effects of chronological age in %, the numbers in the middle of the figures represent the common effects between chronological age and Brain Age index in %, and the numbers to the right of the figures represent the unique effects of Brain Age Index in %. * represents the statistical significance of the unique effects of Brain Age Index at p<0.05.
Figure 6—figure supplement 2
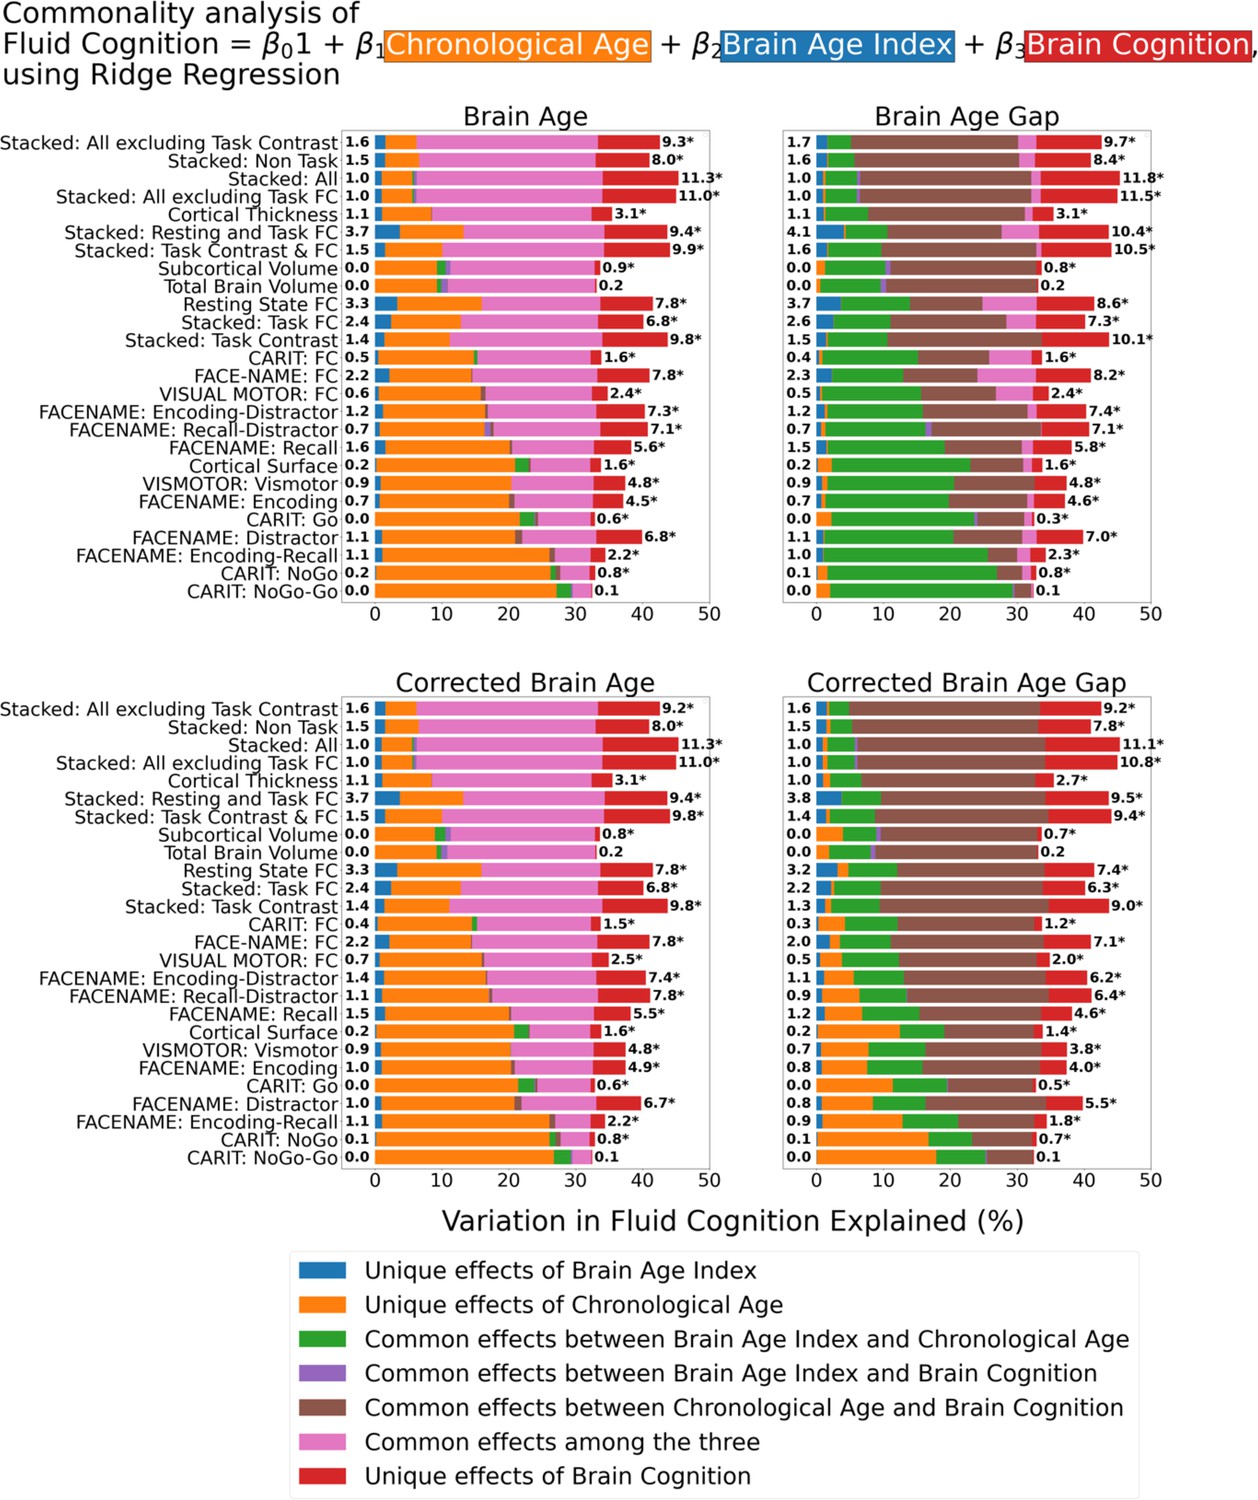
Commonality analysis of Ridge regressions, having chronological age and each Brain Age index and Brain Cognition as the regressors for fluid cognition.
Note we used Ridge regressions for models with at least two regressors (apart from the intercept) and simple regressions for models with a single regressor (apart from the intercept). The numbers to the left of the figures represent the unique effects of Brain Age Index in %, and the numbers to the right of the figures represent the unique effects of Brain Cognition in %. * represents the statistical significance of the unique effects of Brain Cognition at p<0.05.
Figure 7 with 2 supplements
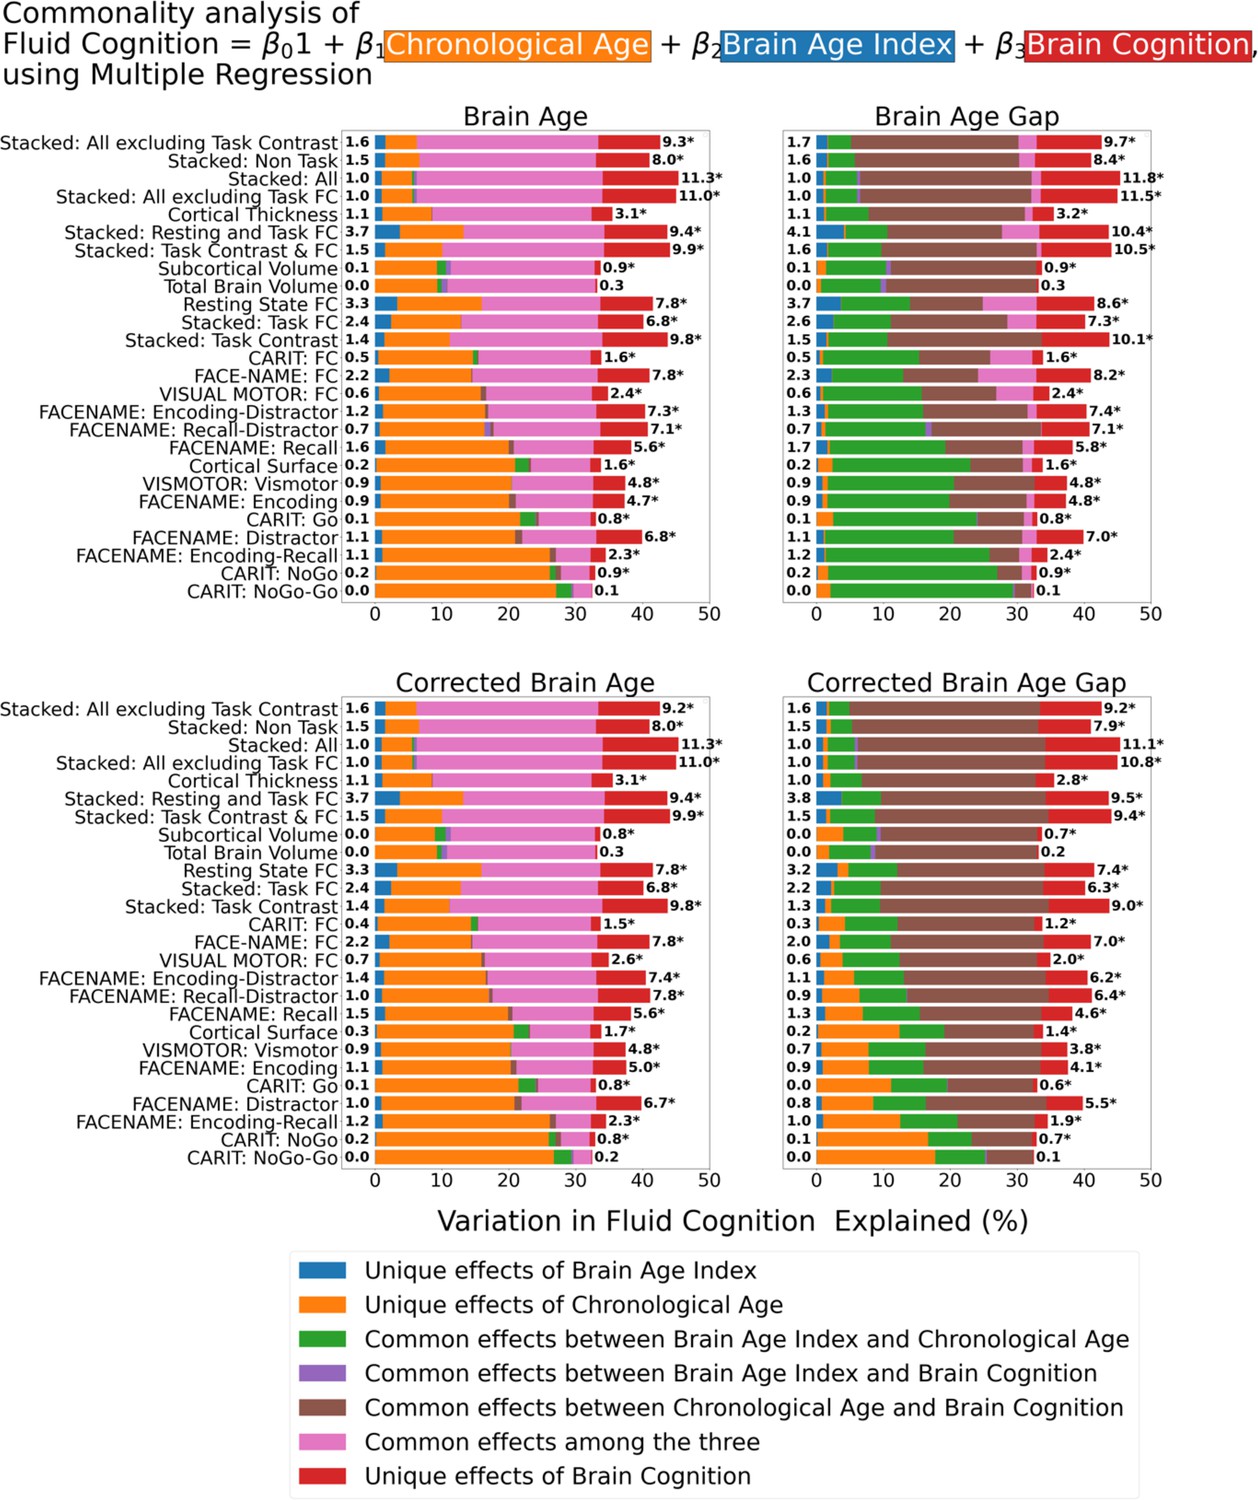
Commonality analysis of multiple regressions, having chronological age and each Brain Age index and Brain Cognition as the regressors for capturing fluid cognition.
The numbers to the left of the figures represent the unique effects of Brain Age Index in %, and the numbers to the right of the figures represent the unique effects of Brain Cognition in %. * represents the statistical significance of the unique effects of Brain Cognition at p<0.05.
Figure 7—figure supplement 1
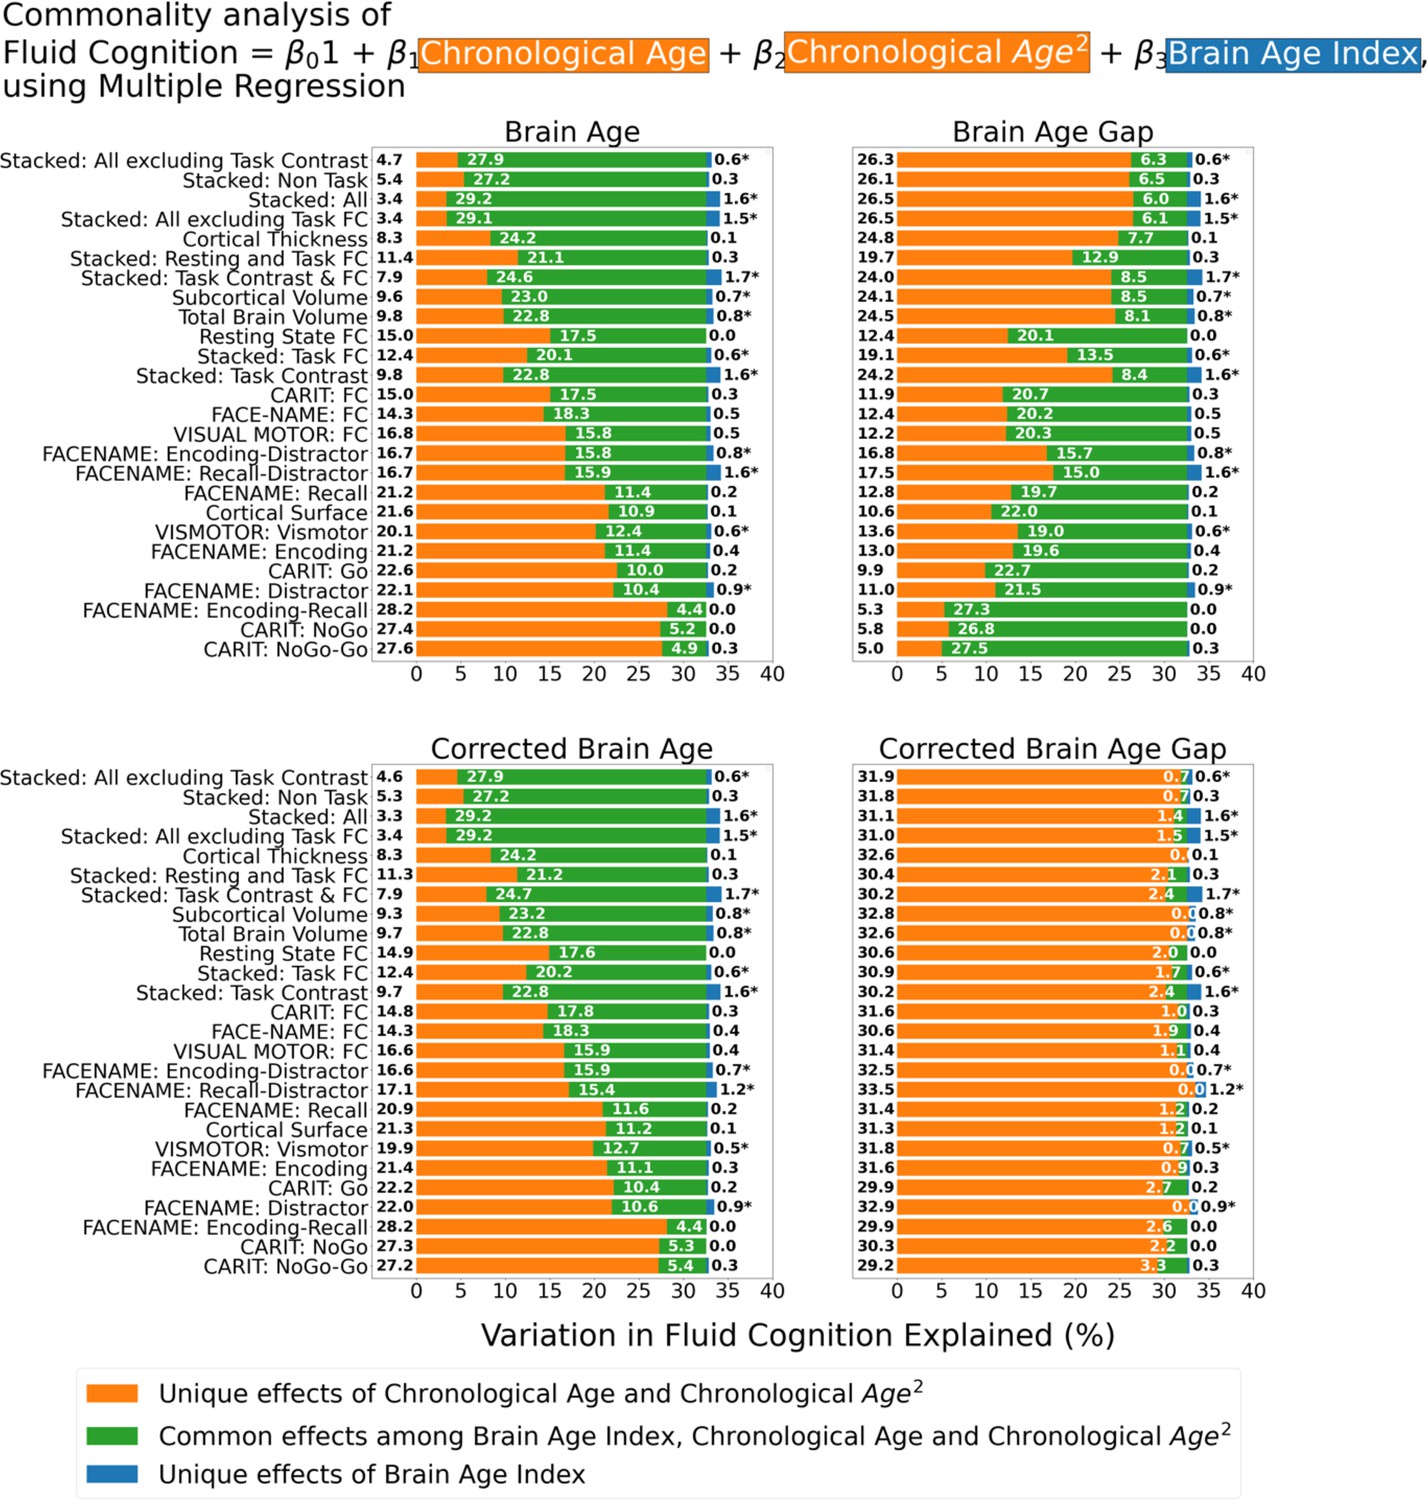
Commonality analysis of multiple regressions, having chronological age, a quadratic term for chronological age and each Brain Age index as the regressors for fluid cognition.
The numbers to the left of the figures represent the unique effects of chronological age in %, the numbers in the middle of the figures represent the common effects between chronological age and Brain Age index in %, and the numbers to the right of the figures represent the unique effects of Brain Age Index in %. * represents the statistical significance of the unique effects of Brain Age Index at p<0.05.
Figure 7—figure supplement 2
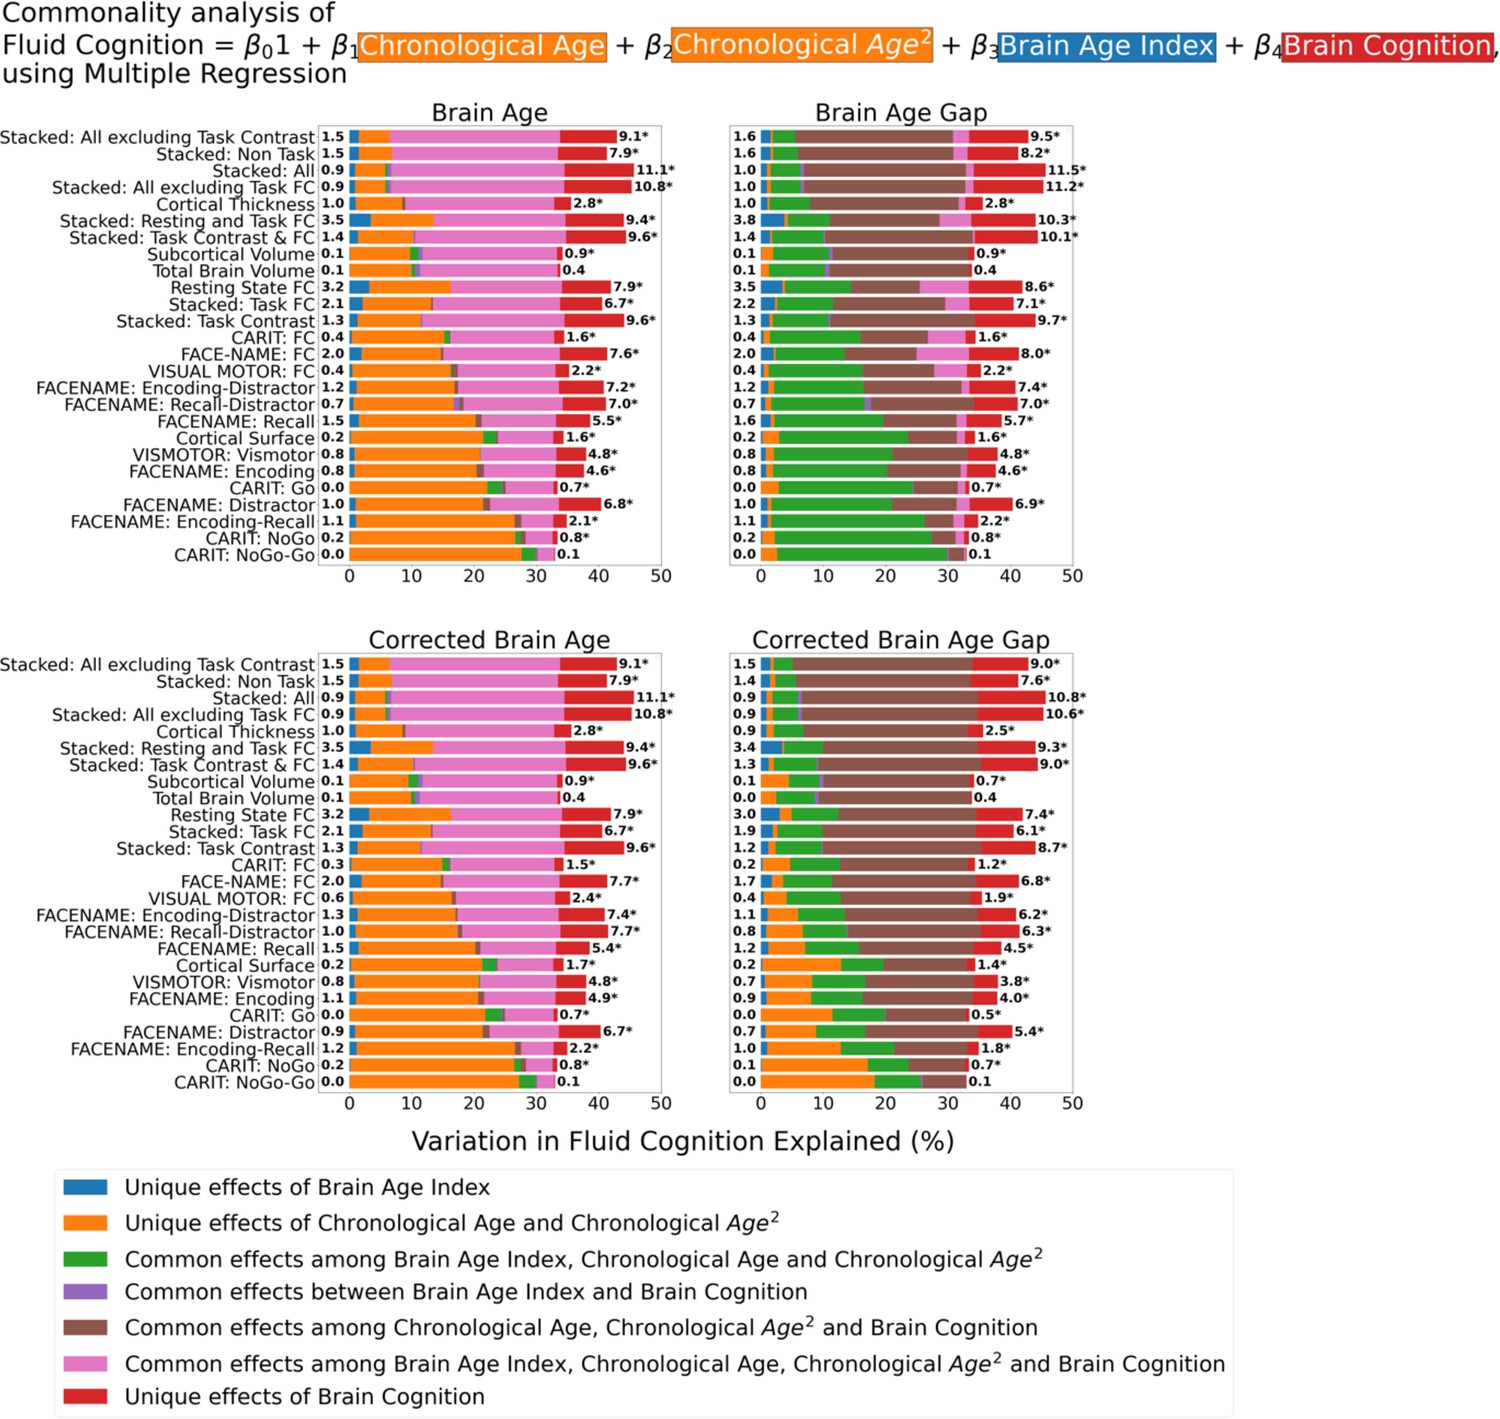
Commonality analysis of multiple regressions, having chronological age, a quadratic term for chronological age and each Brain Age index and Brain Cognition as the regressors for fluid cognition.
The numbers to the left of the figures represent the unique effects of Brain Age Index in %, and the numbers to the right of the figures represent the unique effects of Brain Cognition in %. * represents the statistical significance of the unique effects of Brain Cognition at p<0.05.
Figure 8

Diagram of the nested cross-validation used for creating predictions for models of each set of features as well as predictions for stacked models.
Author response image 1
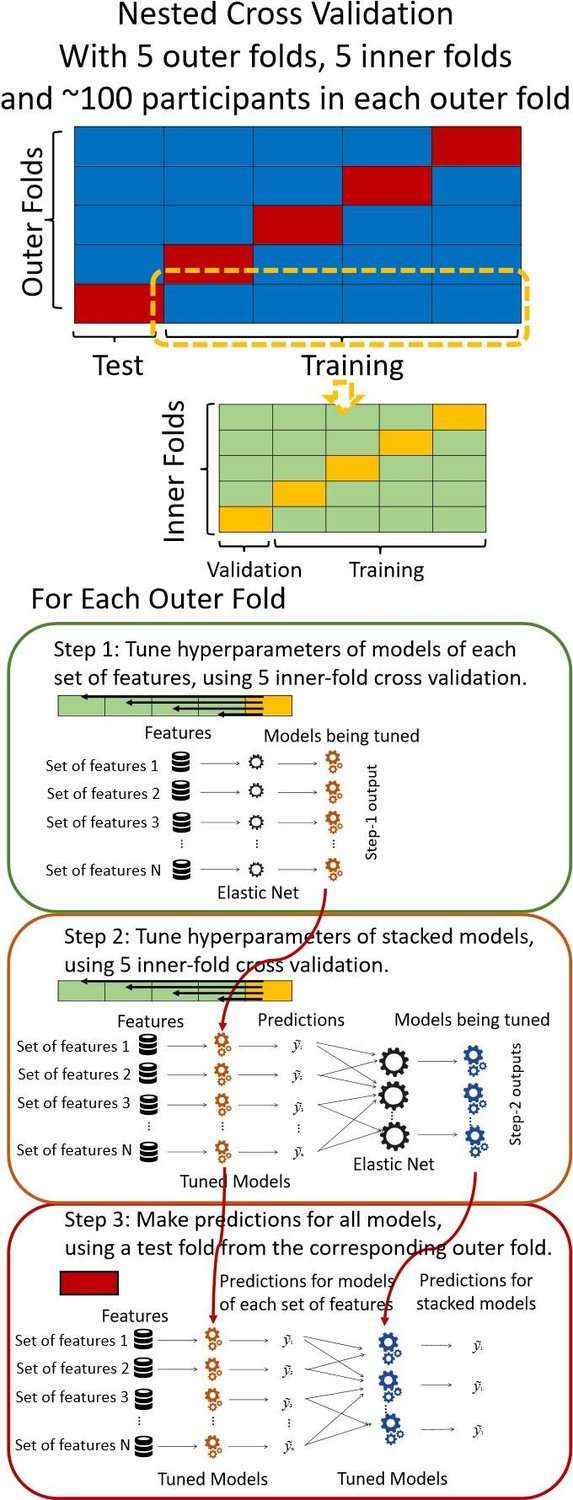
Diagram of the nested cross-validation used for creating predictions for models of each set of features as well as predictions for stacked models.
Author response image 2
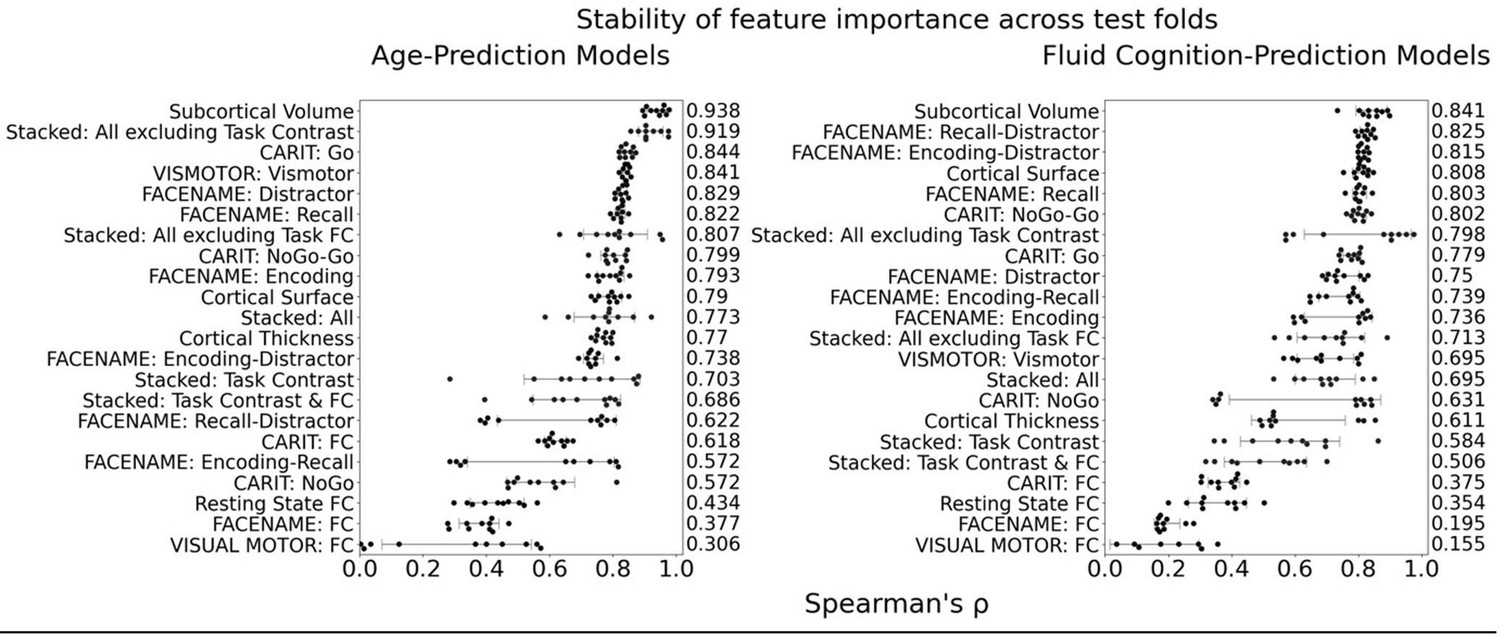
Stability of feature importance (i.e., Elastic Net Coefficients) of prediction models.
Each dot represents rank stability (reflected by Spearman’s ρ) in the feature importance between two prediction models of the same features, used in two different outer-fold test sets. Given that there were five outer-fold test sets, there were 10 Spearman’s ρs for each prediction model. The numbers to the right of the plots indicate the mean of Spearman’s ρ for each prediction model.
Additional files
Download links
A two-part list of links to download the article, or parts of the article, in various formats.
Downloads (link to download the article as PDF)
Open citations (links to open the citations from this article in various online reference manager services)
Cite this article (links to download the citations from this article in formats compatible with various reference manager tools)
Brain age has limited utility as a biomarker for capturing fluid cognition in older individuals
eLife 12:RP87297.
https://doi.org/10.7554/eLife.87297.4


