Intuitive movement-based prosthesis control enables arm amputees to reach naturally in virtual reality
- Univ. Bordeaux, CNRS, INCIA, UMR 5287, France
- ISIR UMR 7222, Sorbonne Université, CNRS, Inserm, France
- CMPR Tour de Gassies, France
Figures
Figure 1 with 1 supplement
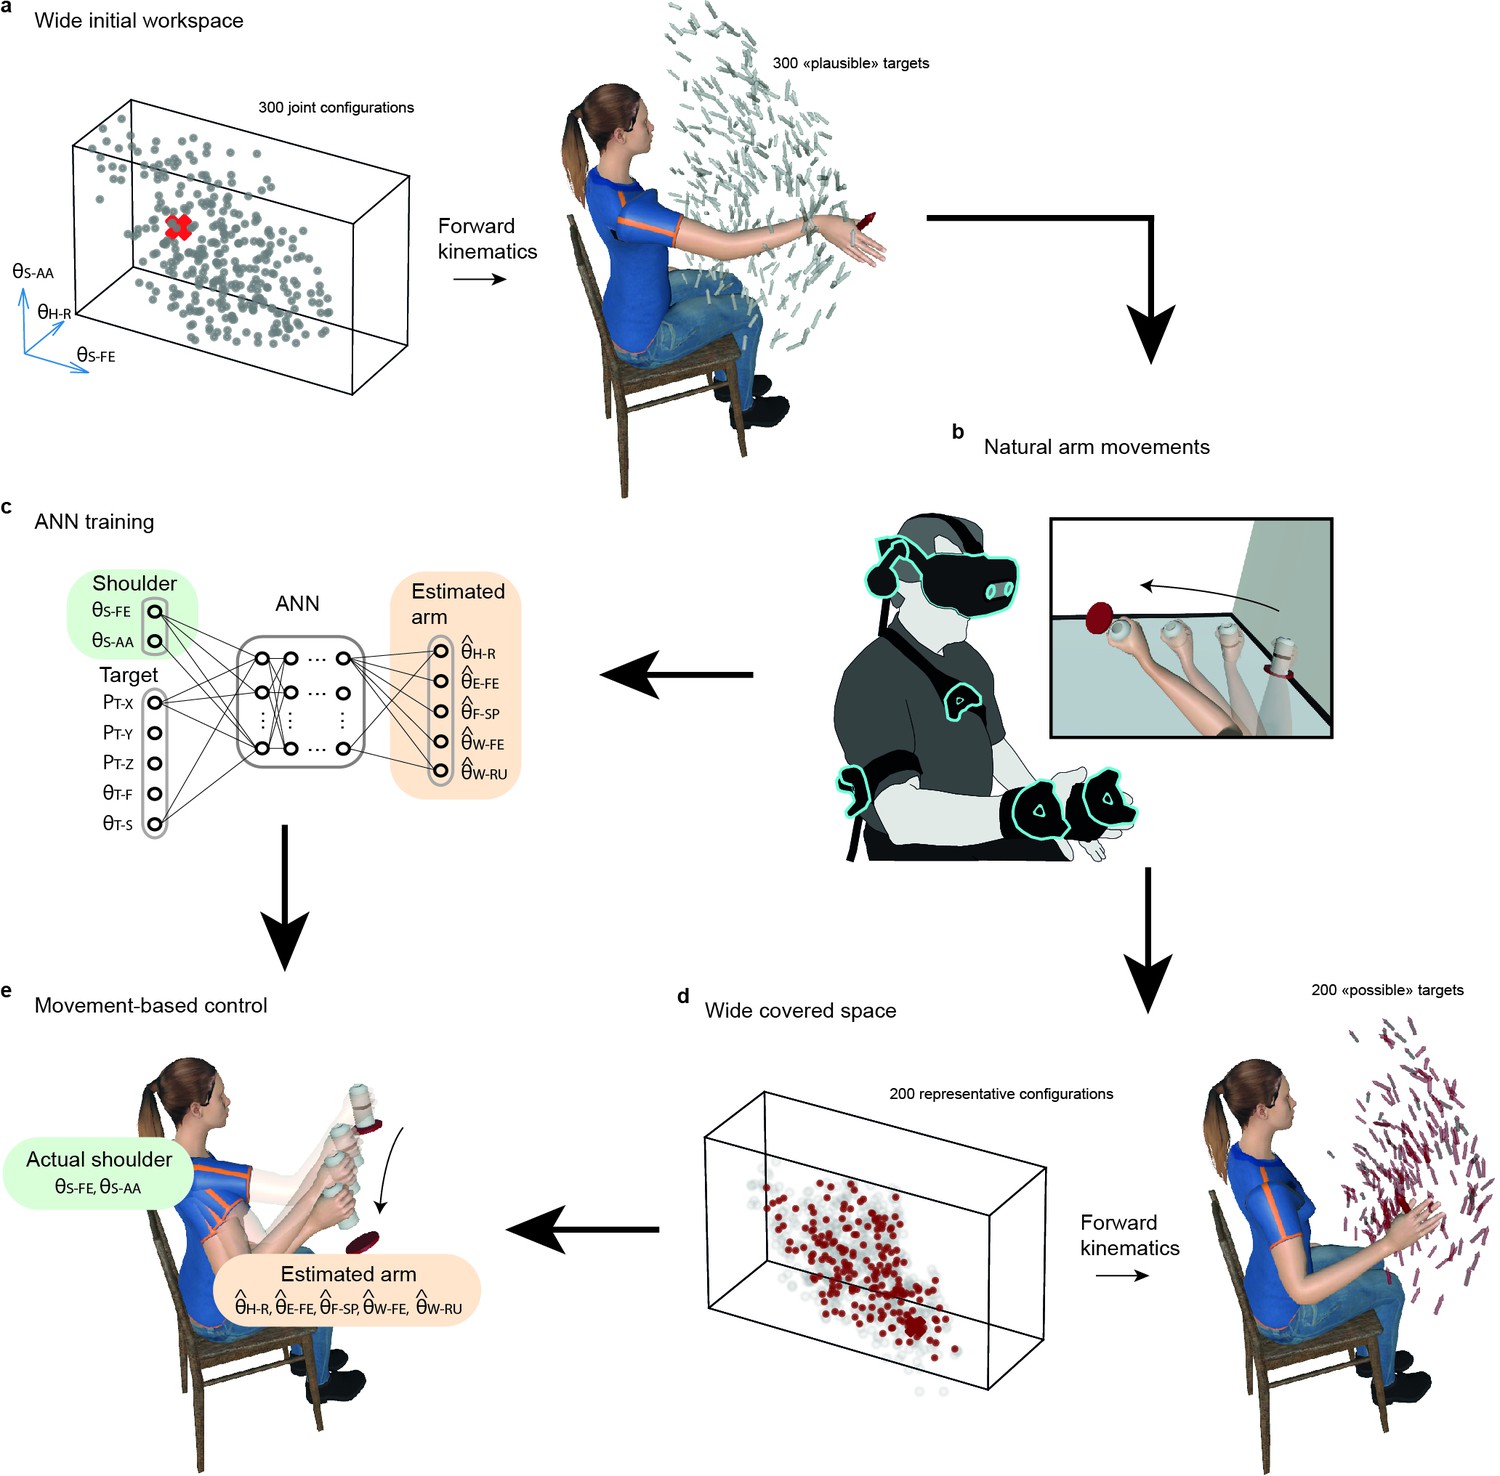
Overview of the task and control strategy.
(a) Wide initial workspace. Three hundred 7-DoF arm configurations (gray dots, only three angles displayed for convenience) within the joint operating range of a given participant (materialized by the parallelepiped) are transformed into 300 plausible target locations (gray arrows) using forward kinematics. (b). Natural arm movements are recorded while participants equipped with movement trackers on the arm and torso are involved in picking and placing a bottle at the 300 target locations in virtual reality. (c). The Artificial Neural Network (ANN) is trained on recorded natural arm movement to reconstruct distal Degrees of Freedom (DoFs) (orange) from proximal ones (green) plus target information (position and orientation). (d). Wide space covered during recorded natural arm movements. Two hundred nodes (red dots) that best represent the arm angular configurations actually produced (gray circles) by a participant during her/his recorded natural arm movements were identified using an unsupervised self-organizing neural network, and transformed into a set of 200 possible targets (red arrows) using forward kinematics. (e). Movement-based prosthesis control. The participant performs the pick and place task at the 200 possible targets using a hybrid arm reproducing in real-time her/his own shoulder movements (green angles), and using the ANN predictions for the five remaining distal DoFs (orange angles). Figure 1—figure supplement 1 provides complementary information about the ANN inputs and outputs, and the process used to remap data for different arm morphologies.
Figure 1—figure supplement 1
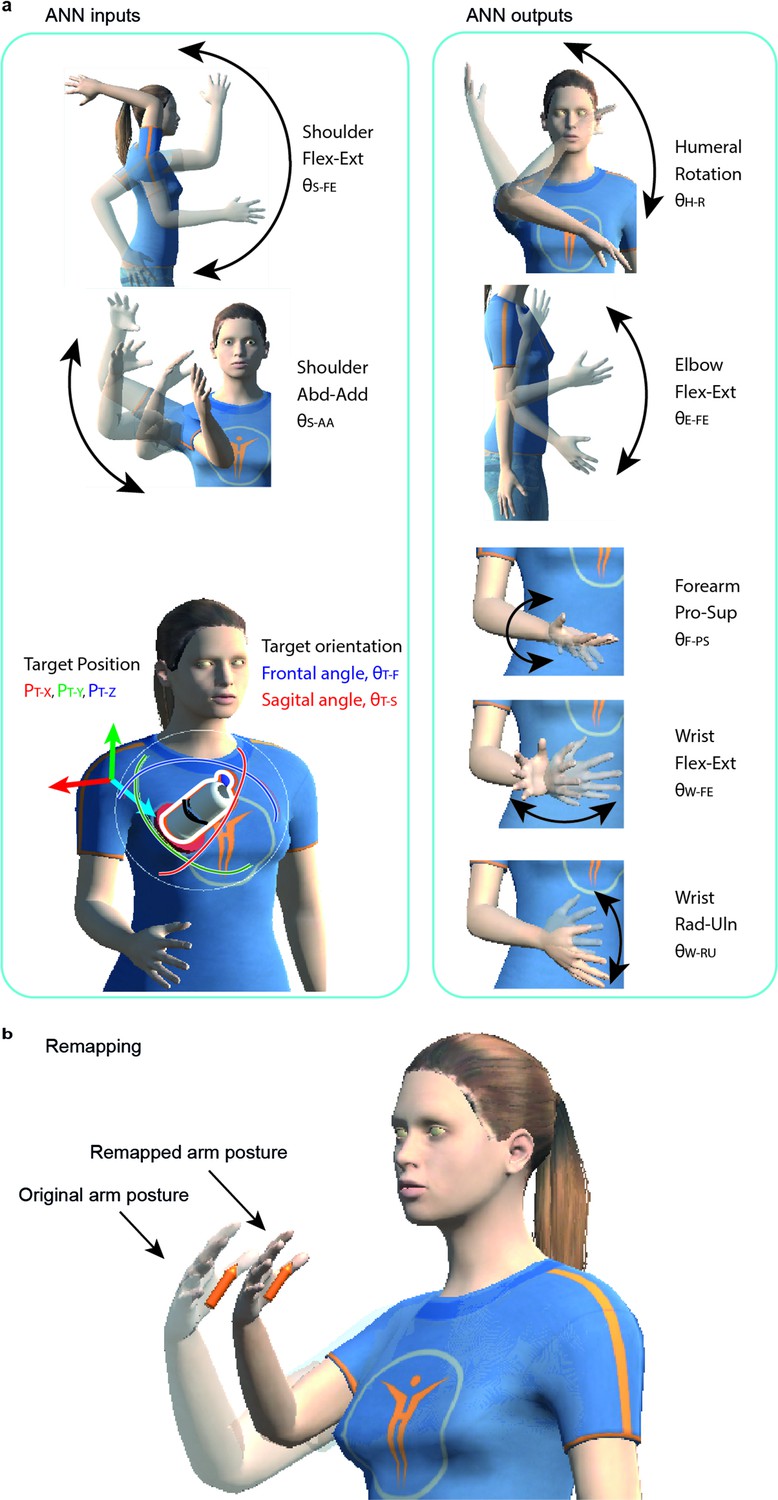
Overview of angular and movement-goal information.
(a) Artificial Neural Networks (ANNs) Inputs and Outputs, displayed together with movements done to get the joints range of motion (black arrows). ANNs Inputs include shoulder flexion-extension (θS-FE), shoulder abduction-adduction (θS-AA), target position in relation to the shoulder (PT-X, PT-Y, and PT-Z), and target orientation (as angles of rotation) with respect to the frontal and sagittal plane (θT-F and θT-S). ANNs outputs include all distal angles from the humeral rotation including: humeral rotation (θH-R), elbow flexion-extension (θE-FE), forearm pronation-supination (θF-PS), wrist flexion-extension (θW-FE) and radial-ulnar deviation (θW-RU). (b) Remapping target position for different arm morphologies. Two arms with the same angular configuration but different segments length lead to different positions of the target (orange arrows). Forward kinematics was used to remap the target position for a subject with a different arm segments’ length (remapping for a shorter arm displayed). Note that the target orientation remains unaffected.
Figure 2
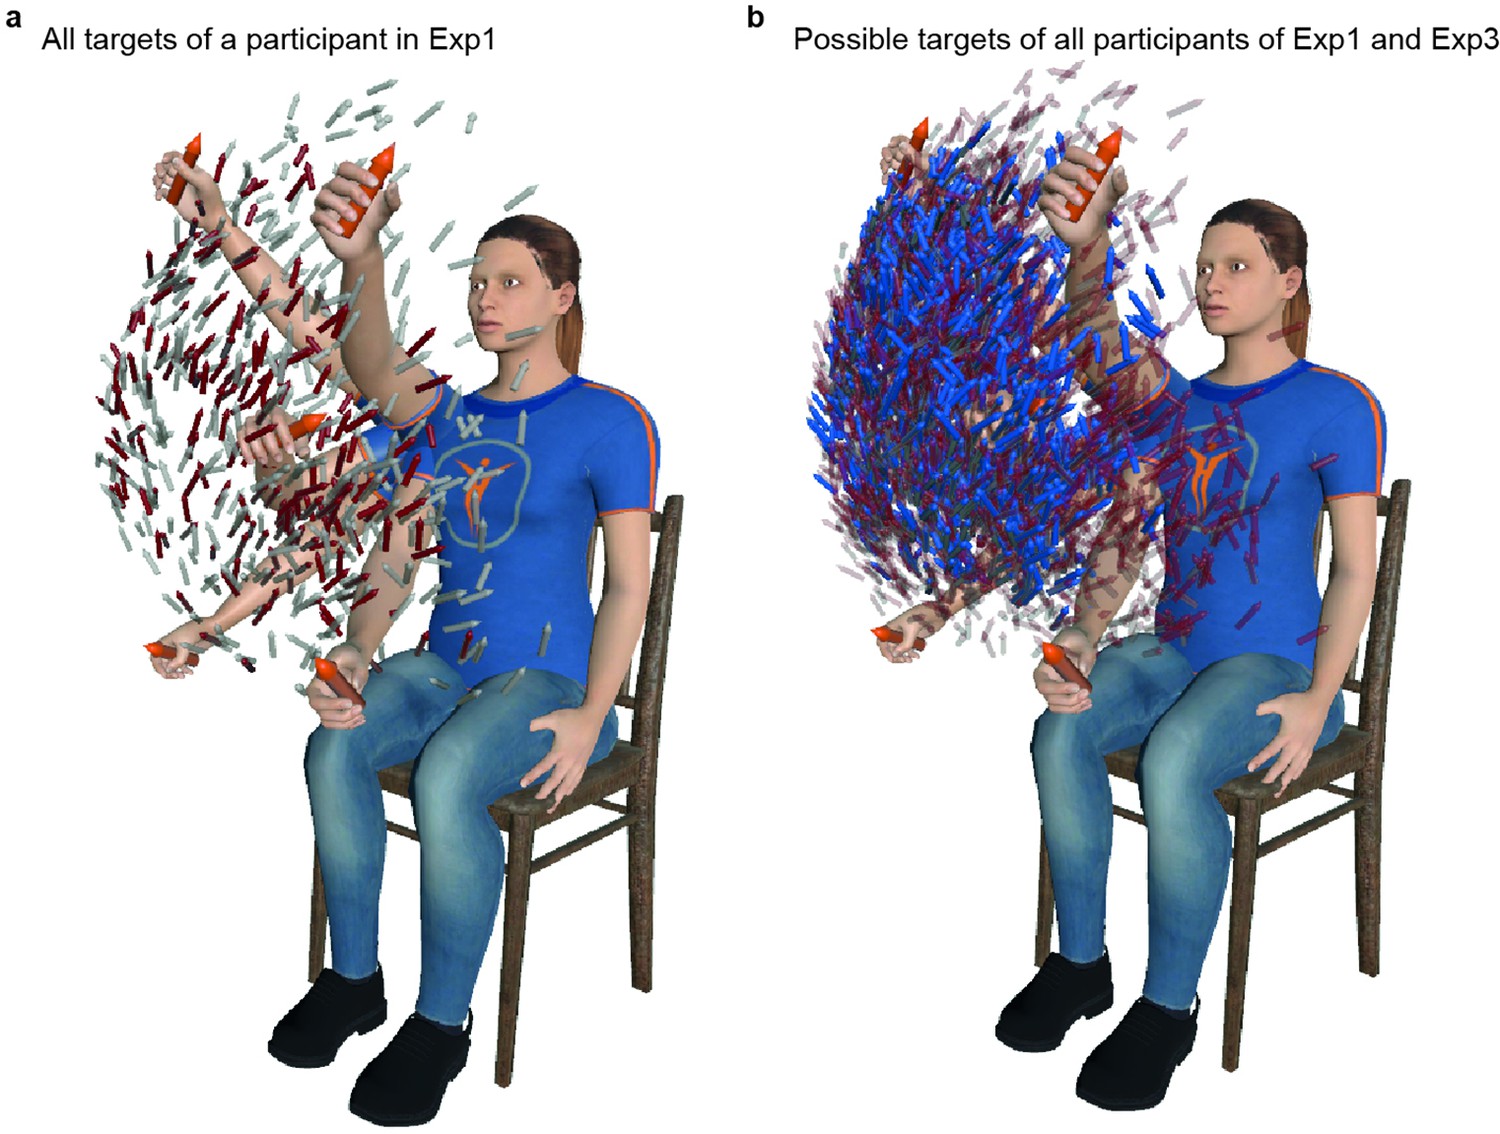
Wide workspace covered in experiments.
(a). All targets used for a representative participant of Exp1 are displayed, together with five arm postures (four at extended positions and one flexed in the middle) to provide perspectives. Gray arrows represent plausible targets (n=300), and red arrows represent possible targets (n=200). (b). Possible targets of all participants of Exp1 (n=2000, red arrows) and Exp3 (n=1400, in blue arrows), remapped for an average arm, and regrouped on the same graph. Note that for Exp3, possible targets corresponding to participants with left-sided limb loss were mirrored to be represented in relation to a right arm. This figure illustrates the comparably large workspaces obtained for the 10 participants with intact limbs of Exp1 (used for the Generic ANN) and the seven participants with transhumeral limb loss of Exp3 (using the Generic Artificial Neural Network (ANN)).
Figure 3 with 3 supplements
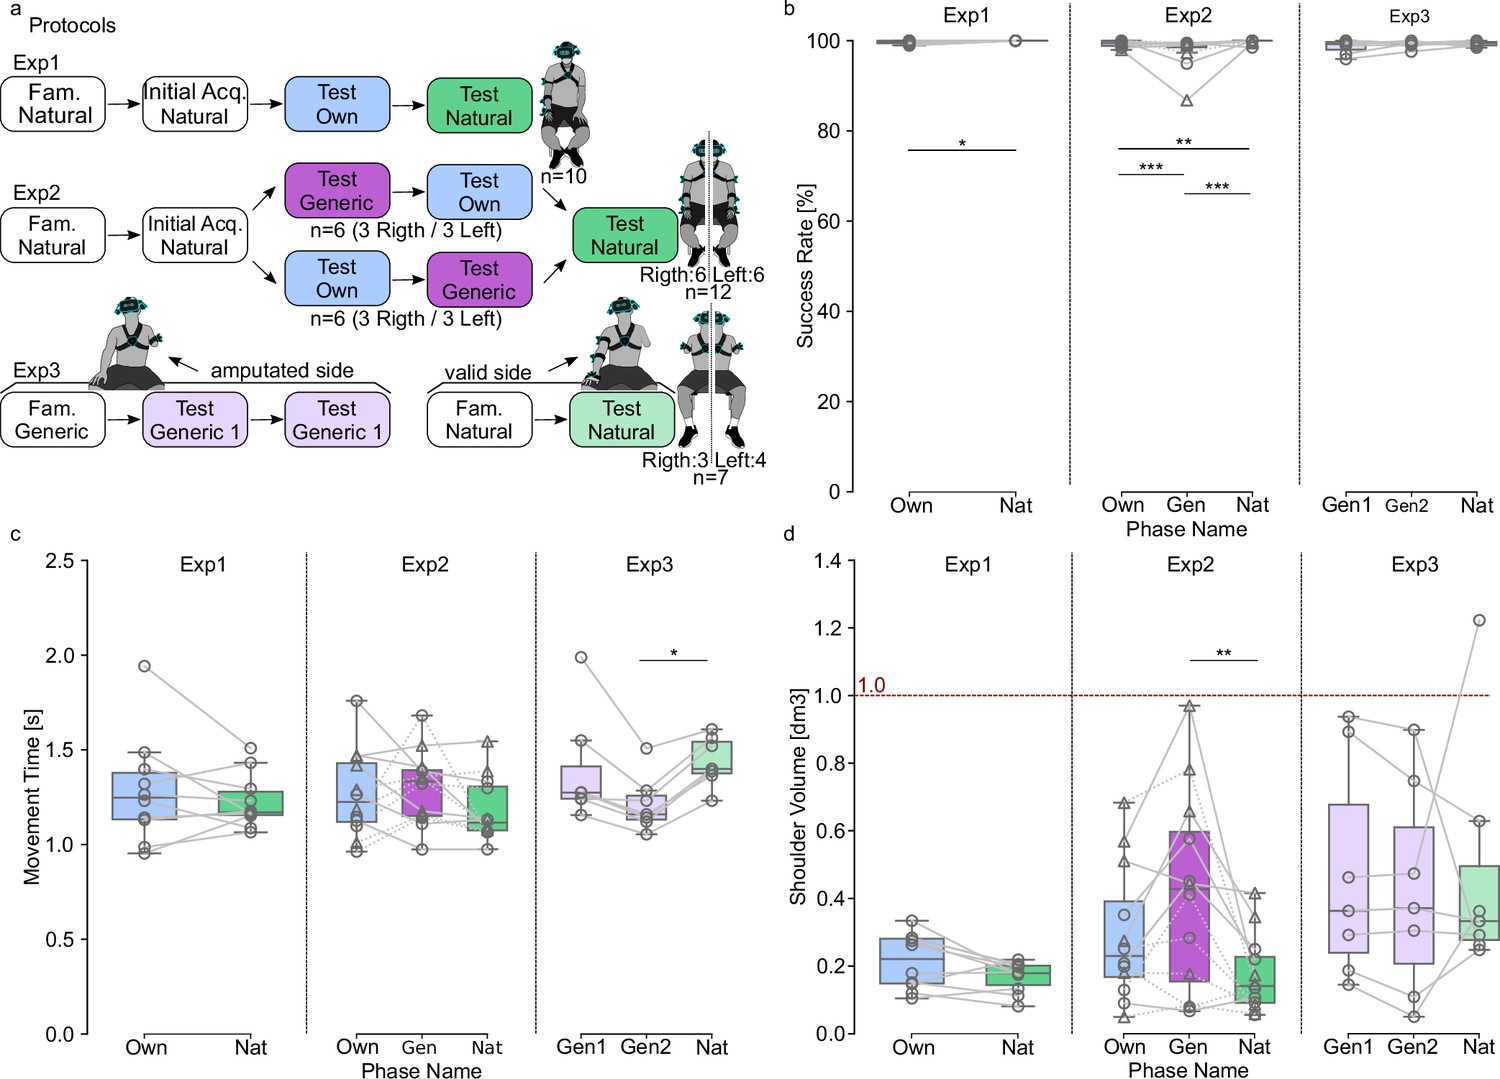
Protocols and results.
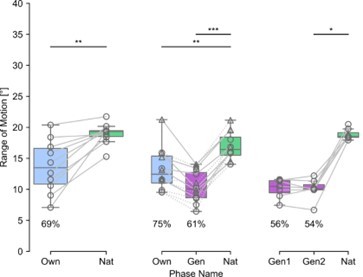
(a) Protocols of the three experiments. Each box contains a phase name and the name of the control used. Fam. stand for Familiarization phase, and Initial Acq. for Initial Acquisition phase. The order of test phases conducted with the Own and the Generic Artificial Neural Networks (ANNs) was counterbalanced in Exp2. (b–d). Results for success rate (b), movement time (c) and shoulder volume (d). Each gray line corresponds to a participant. In Exp2, dashed lines indicate participants who began by the control with the Generic ANN, and plain lines those who began by the control with the Own ANN. Boxes limits show first and third quartiles whereas inside line shows the median value. Whiskers show min and max values. Own, Gen, Nat represent phases in which the control was performed with the Own ANN, the Generic ANN, and the Natural Virtual Arm, respectively. In Exp3, Gen1 and Gen2 refer to the first and second blocks performed with the Generic ANN. Stars represent significant differences, with * for p<0.05, ** for p<0.01, and *** for p<0.001. The dashed red line represents a volume of 1 dm3 (=1 L). Figure 3—figure supplements 1–3 provide the participants’ individual distributions of movement times for each of the three experiments, respectively.
Figure 3—figure supplement 1
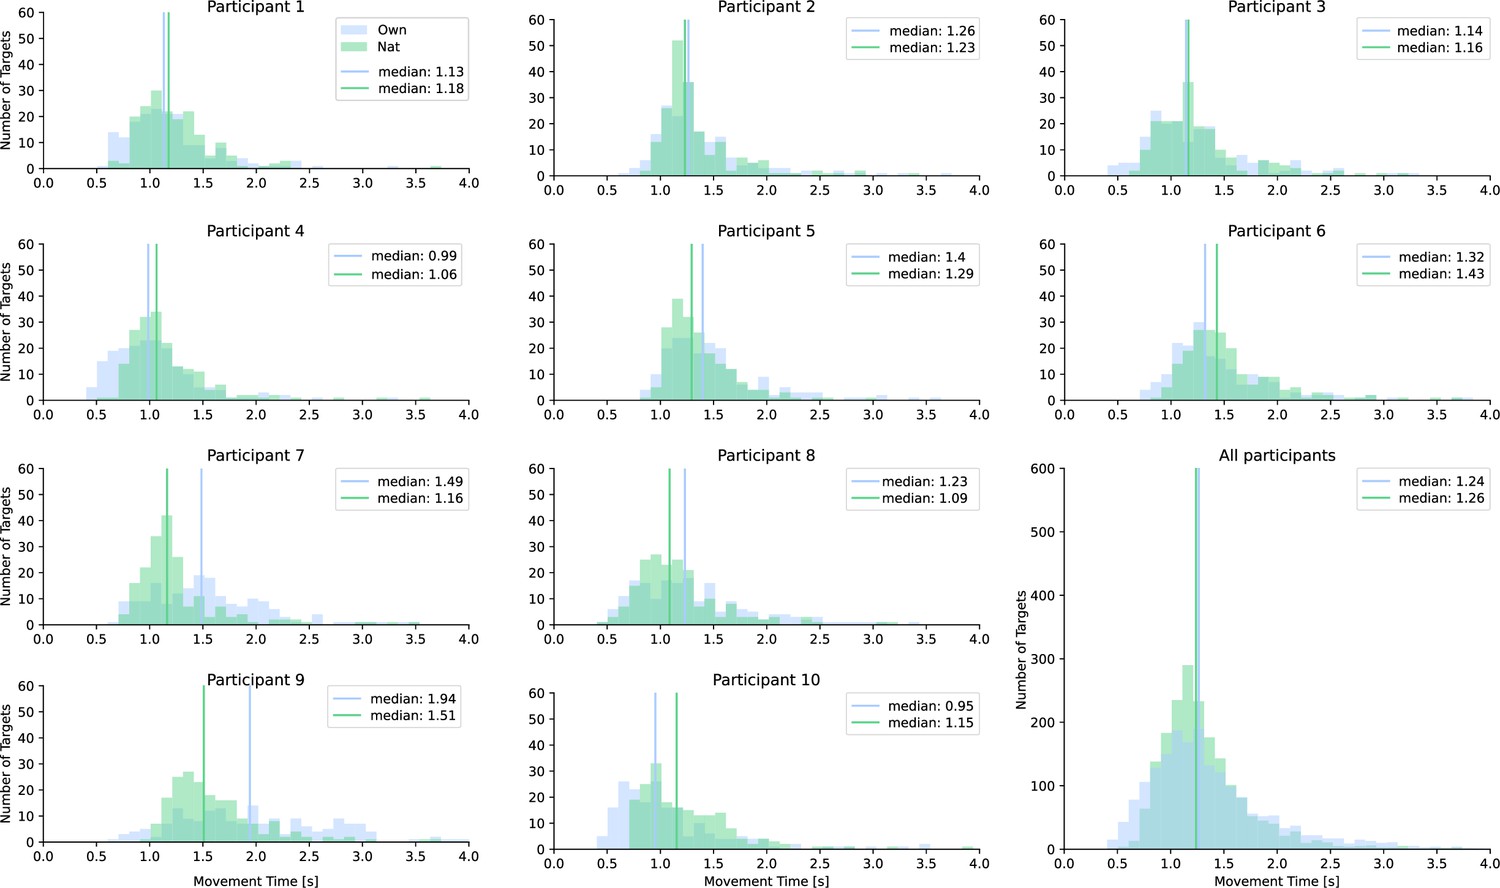
Distributions of movement times of each participant (and data from all participants regrouped in the last subplot) for the two experimental conditions (TestNat and TestOwn) of Exp1.
Please note that the median of each individual distribution indicated by a vertical bar corresponds to the median movement time of each individual displayed as a circle in Figure 3c.
Figure 3—figure supplement 2
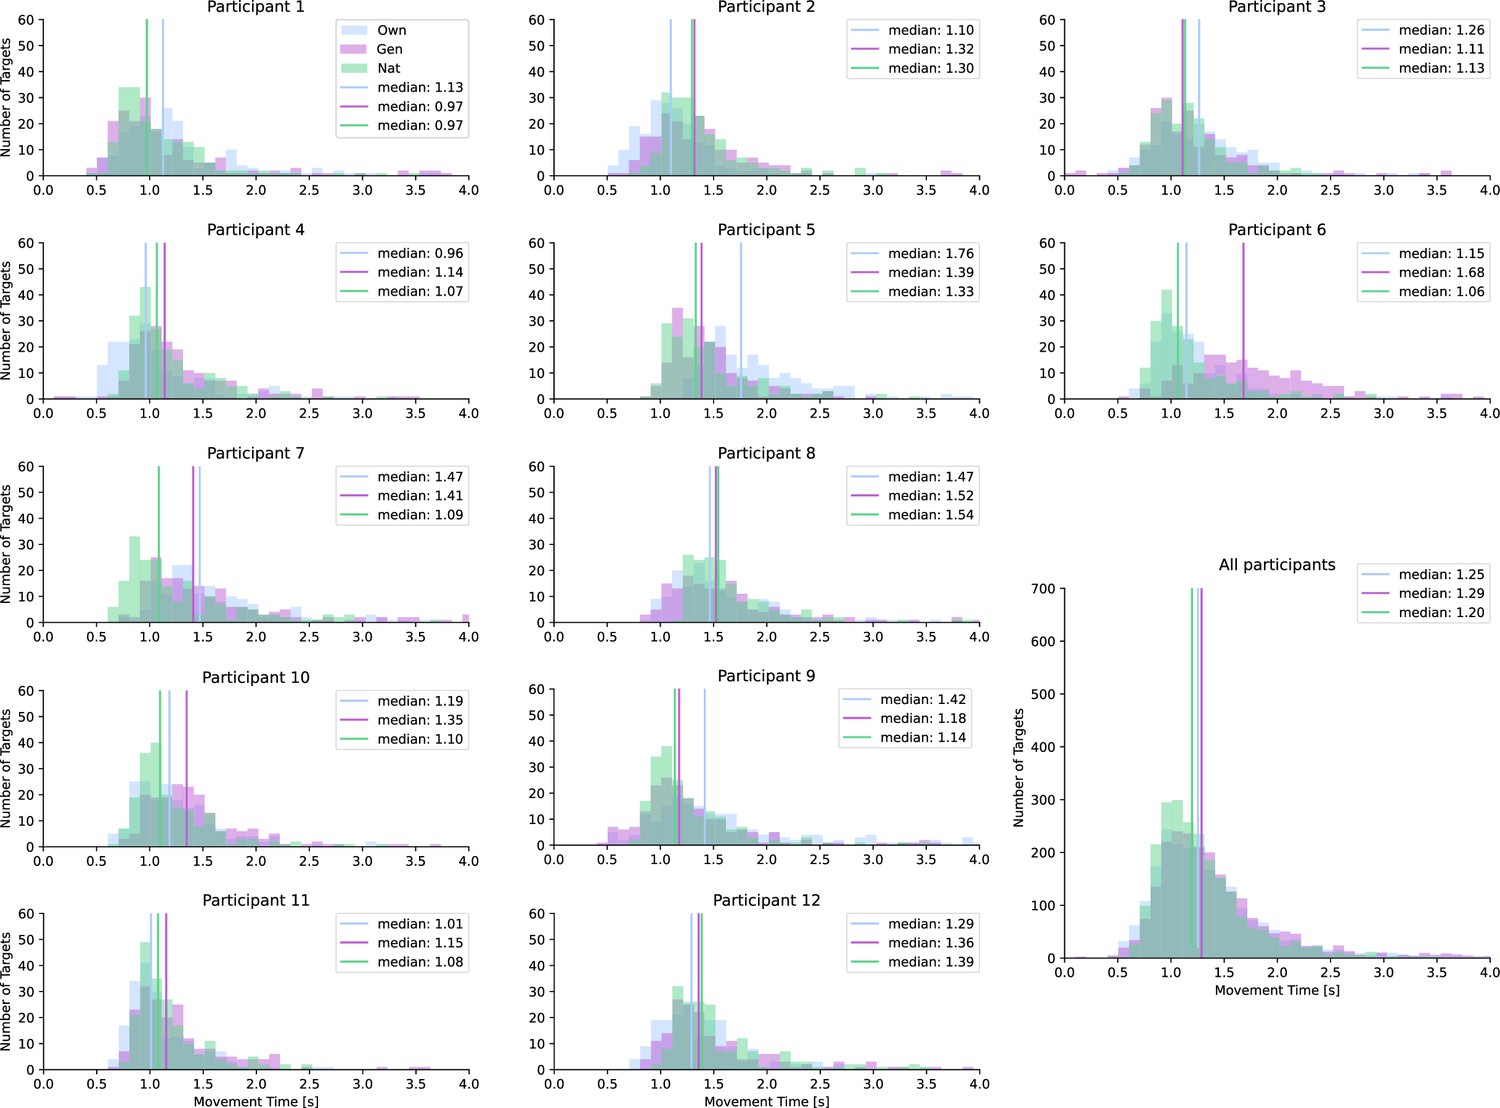
Distributions of movement times of each participant (and data from all participants regrouped in the last subplot) for the three experimental conditions (TestNat, TestOwn, and TestGen) of Exp2.
Please note that the median of each individual distribution indicated by a vertical bar corresponds to the median movement time of each individual displayed as a circle in Figure 3c.
Figure 3—figure supplement 3
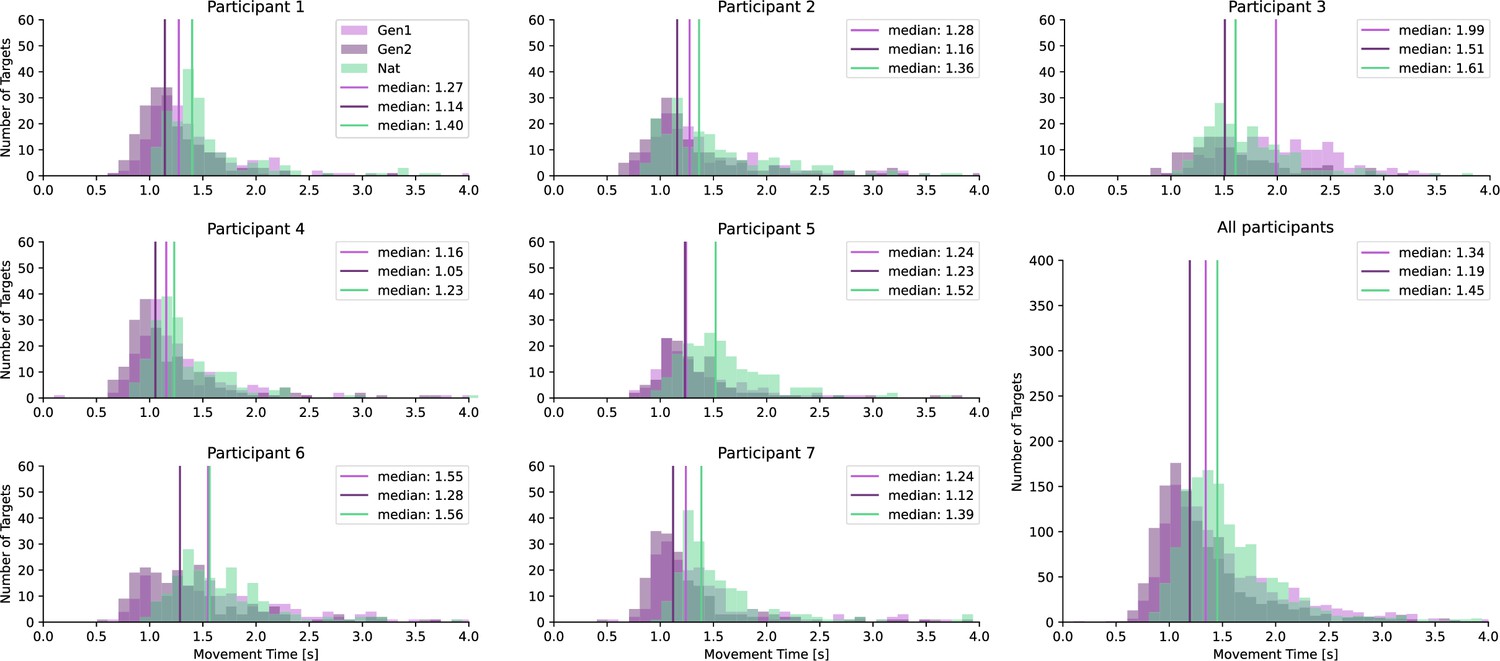
Distributions of movement times of each participant (and data from all participants regrouped in the last subplot) for the three test phases (TestNat, TestGen1, and TestGen2) of Exp3.
Please note that the median of each individual distribution indicated by a vertical bar corresponds to the median movement time of each individual displayed as a circle in Figure 3c.
Figure 4
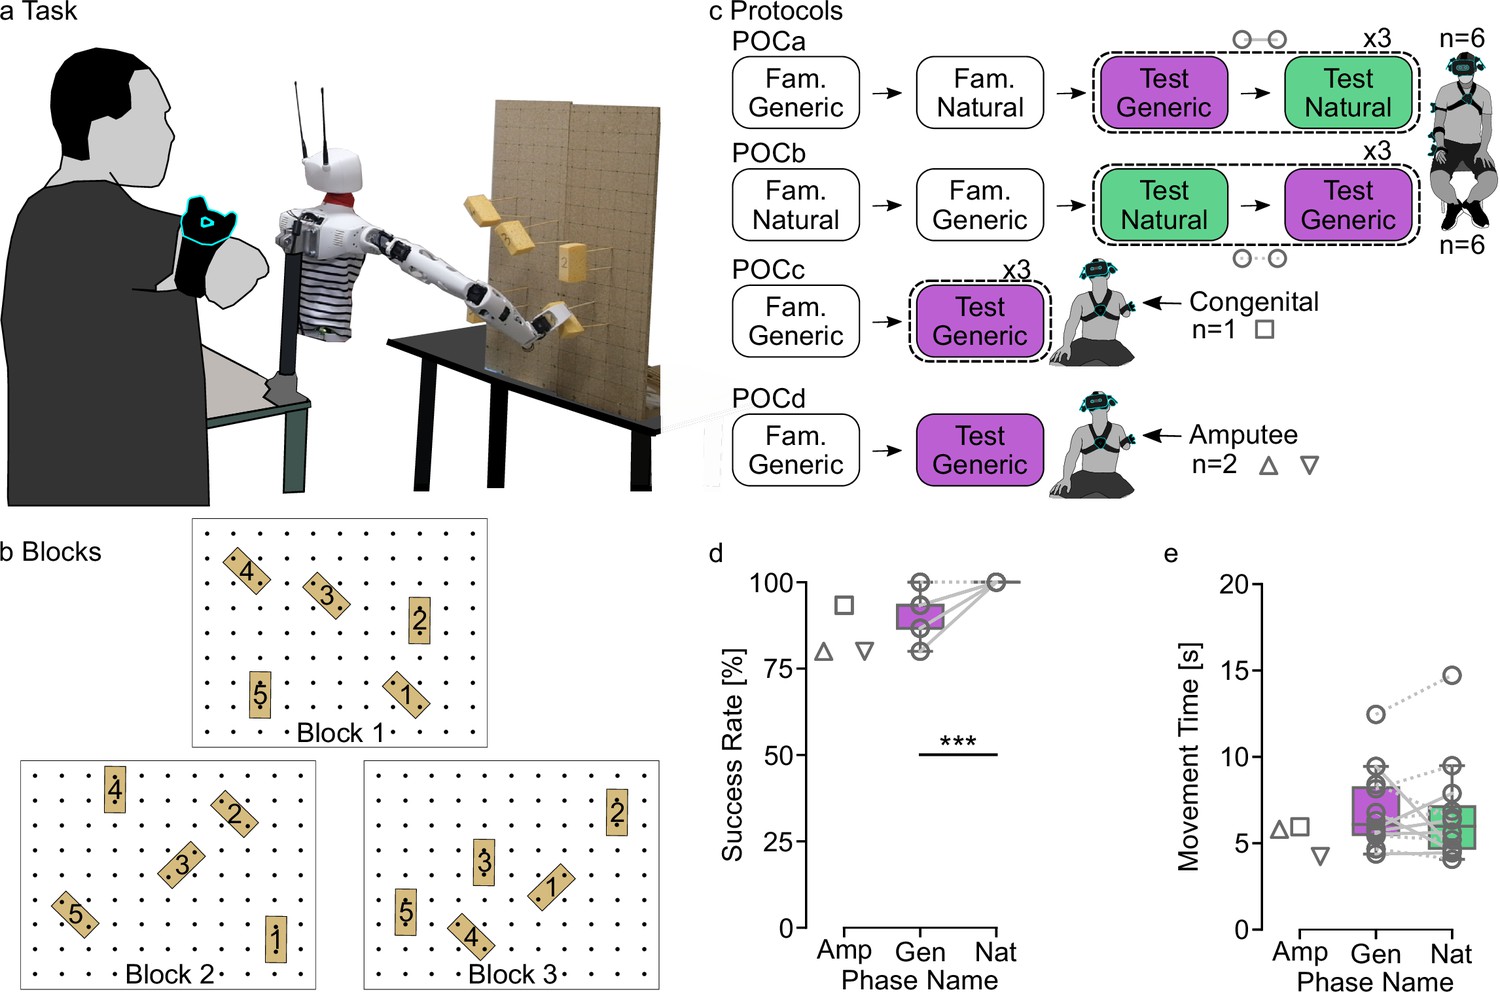
Physical Proof of Concept on a tele-operated robotic platform.
(a) Task and setup. The participant stands still setback from the humanoid robotic platform that faces a board on which five sponges are placed at different positions and orientations. The participant tele-operates the robotic arm so as to reach and grasp each of the five sponges of a block, one trial after another, according to the order indicated by numbers written on sponges. (b). Three types of blocks define three spatial arrangements of sponges on the board. (c) Protocols of the Proof of Concept (POC) experiments. Each box contains a phase name and the name of the control used, either based on natural arm movements (TestNat) or on predictions from the Generic Artificial Neural Network (ANN) (TestGeneric). Fam. stand for Familiarization phase. The order of test phases was counterbalanced in POCa and POCb. (d-e). Results for success rate (d) and movement time (e). Each gray line corresponds to a participant. In POCa-b, dashed lines indicate participants who began by TestGeneric and plain lines those who began by TestNat. Boxes limits show the first and third quartiles whereas inside line shows the median value. Whiskers show min and max values. Stars represent significant differences, with * for p<0.05, ** for p<0.01, and *** for p<0.001. Triangles represent performances obtained for the Block 1 by the two participants with transhumeral limb loss whereas the square represents performances of the congenital limb different participants on all three Blocks.
Figure 5
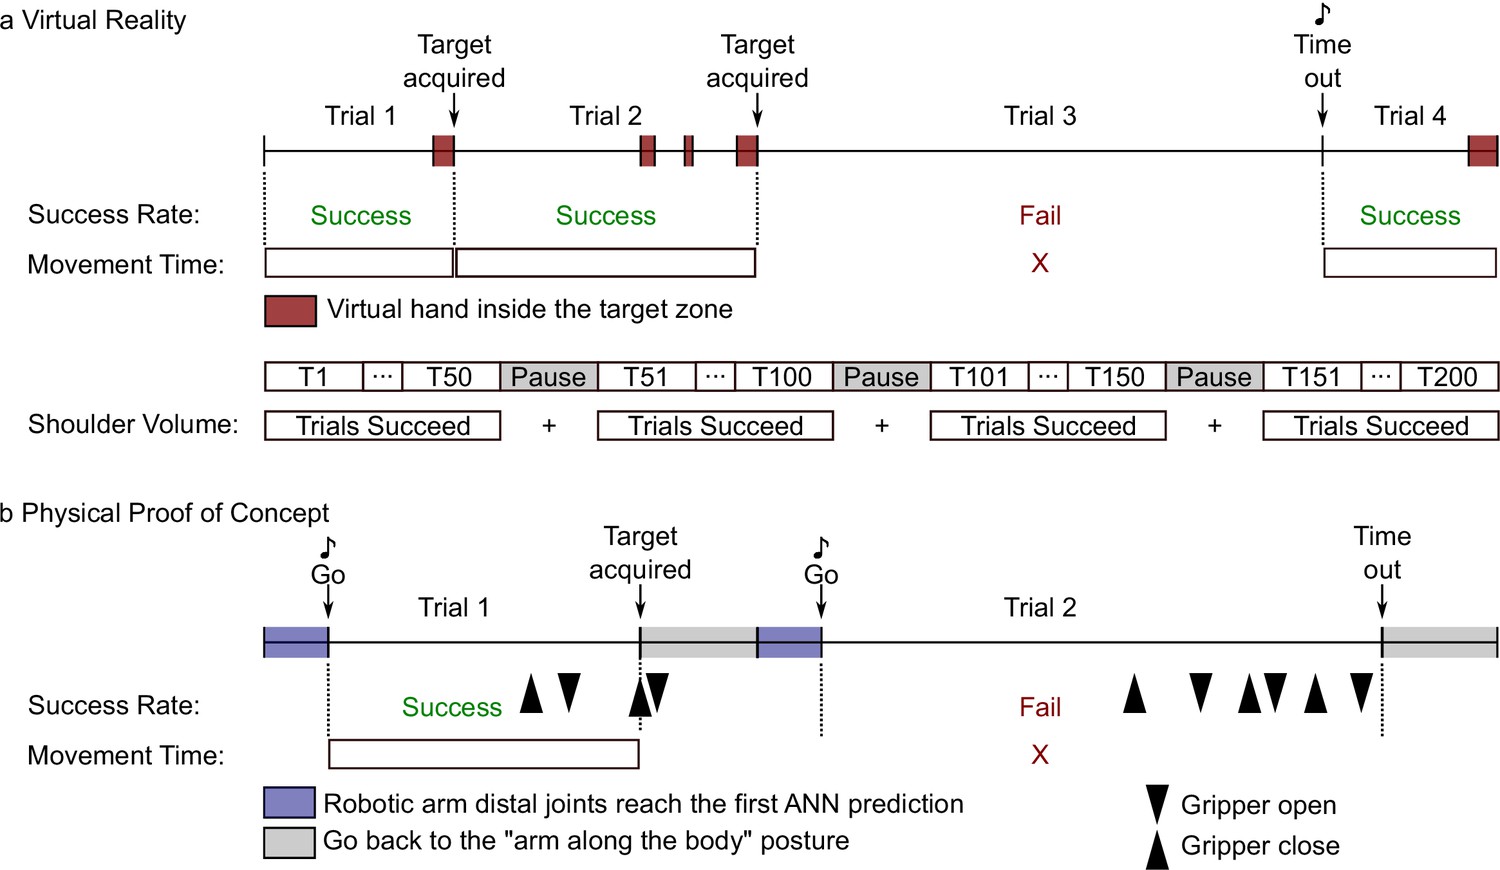
Timing protocols of the Virtual Reality (a) and the Physical Proof of Concept (b) experiments.
(a) Upper part: Sequence of four hypothetical trials conducted in virtual reality. In each trial, the participant had to move the virtual hand to a target zone. When in the target zone, the cylindrical object turned red (as indicated by the red squares) and the trial was successful if the participant pressed the validation button while within the target zone (see trials 1, 2, and 4). A trial was failed if the participant did not validate the target within the allotted time (see Trial 3). In this case, a sound signaled the time out and the subsequent trial began. Success Rate was calculated for each experimental phase as the percentage of successful trials. Movement Time was computed for each successful trial as the time between the beginning of the trial and the target validation. Lower part: A phase was sliced into blocks of 50 trials. Between blocks, participants could rest during pauses. The Shoulder Volume was computed by pooling all the shoulder movements done during the successful trials of a phase. (b). Sequence of two hypothetical trials conducted in the Physical Proof of Concept. Each trial required the participant to move their arm so that a robotic arm could reach a physical target (i.e. rectangular sponges). During the first 0.75 s of a trial, the robotic arm’s distal joints reached the first ANN prediction. At this time, a ‘Go’ signal indicated to the participant that they could start moving. A trial was successful if the participant grasped the target with the robotic gripper and removed it from the wooden sticks (see Trial 1, Target acquired). If the participant was not able to grasp the target within the allotted time, the trial was failed (see Trial 2). Success Rate was calculated for each phase (i.e. a sequence of five targets x three blocks done with the same control type) as the percentage of successful trials. During a trial, the participant was allowed to open and close the gripper as many times as necessary (see black arrowheads). The Movement Time was calculated for each successful trial as the time between the ‘Go’ signal and the last closure of the gripper. At the end of each trial, the participant was instructed to place their arm alongside their body, while the robotic arm returned to a neutral posture alongside the robotic platform.
Author response image 1
Author response image 2

Videos
Video 1
A representative intact-limbs participant performed the pick and place task.
Video 2
Participant 1 with transhumeral limb loss performed the pick and place task with residual limb movement-based control.
For anonymization purposes, the participant number indicated here is not the same as in Table 1 nor as in the result section.
Video 3
Participant 2 with transhumeral limb loss performed the pick and place task with residual limb movement-based control.
For anonymization purposes, the participant number indicated here is not the same as in Table 1 nor as in the result section.
Video 4
Participant 3 with transhumeral limb loss performed the pick and place task with residual limb movement-based control.
For anonymization purposes, the participant number indicated here is not the same as in Table 1 nor as in the result section.
Tables
Table 1
Exp3 participants’ amputation description.
Each line contains the time since amputation, the residual limb circumference and length, and the side of the amputation for a participant (R=right, L=left).
| Participants with transhumeral limb loss | Time since amputation (months) | Residual limb circumference (cm) | Residual limb length (cm) | Amputated arm side |
|---|---|---|---|---|
| Participant 1 | 20 | 33 | 15 | R |
| Participant 2 | 48 | 30 | 25 | L |
| Participant 3 | 12 | 30 | 35 | L |
| Participant 4 | 132 | 34 | 23 | R |
| Participant 5 | 120 | 35 | 30 | R |
| Participant 6 | 276 | 31 | 28 | L |
| Participant 7 | 108 | 32 | 23 | L |
Additional files
Download links
A two-part list of links to download the article, or parts of the article, in various formats.
Downloads (link to download the article as PDF)
Open citations (links to open the citations from this article in various online reference manager services)
Cite this article (links to download the citations from this article in formats compatible with various reference manager tools)
Intuitive movement-based prosthesis control enables arm amputees to reach naturally in virtual reality
eLife 12:RP87317.
https://doi.org/10.7554/eLife.87317.3


