Action sequence learning, habits, and automaticity in obsessive-compulsive disorder
- Department of Psychology, University of Cambridge, United Kingdom
- Behavioural and Clinical Neuroscience Institute, University of Cambridge, United Kingdom
- Department of Psychology, Goldsmiths University of London, United Kingdom
- Quantum Motion, United Kingdom
- Department of Psychiatry, School of Clinical Medicine, University of Cambridge, United Kingdom
- Hertfordshire Partnership University NHS Foundation Trust, United Kingdom
- University of Hertfordshire, United Kingdom
Figures
Figure 1
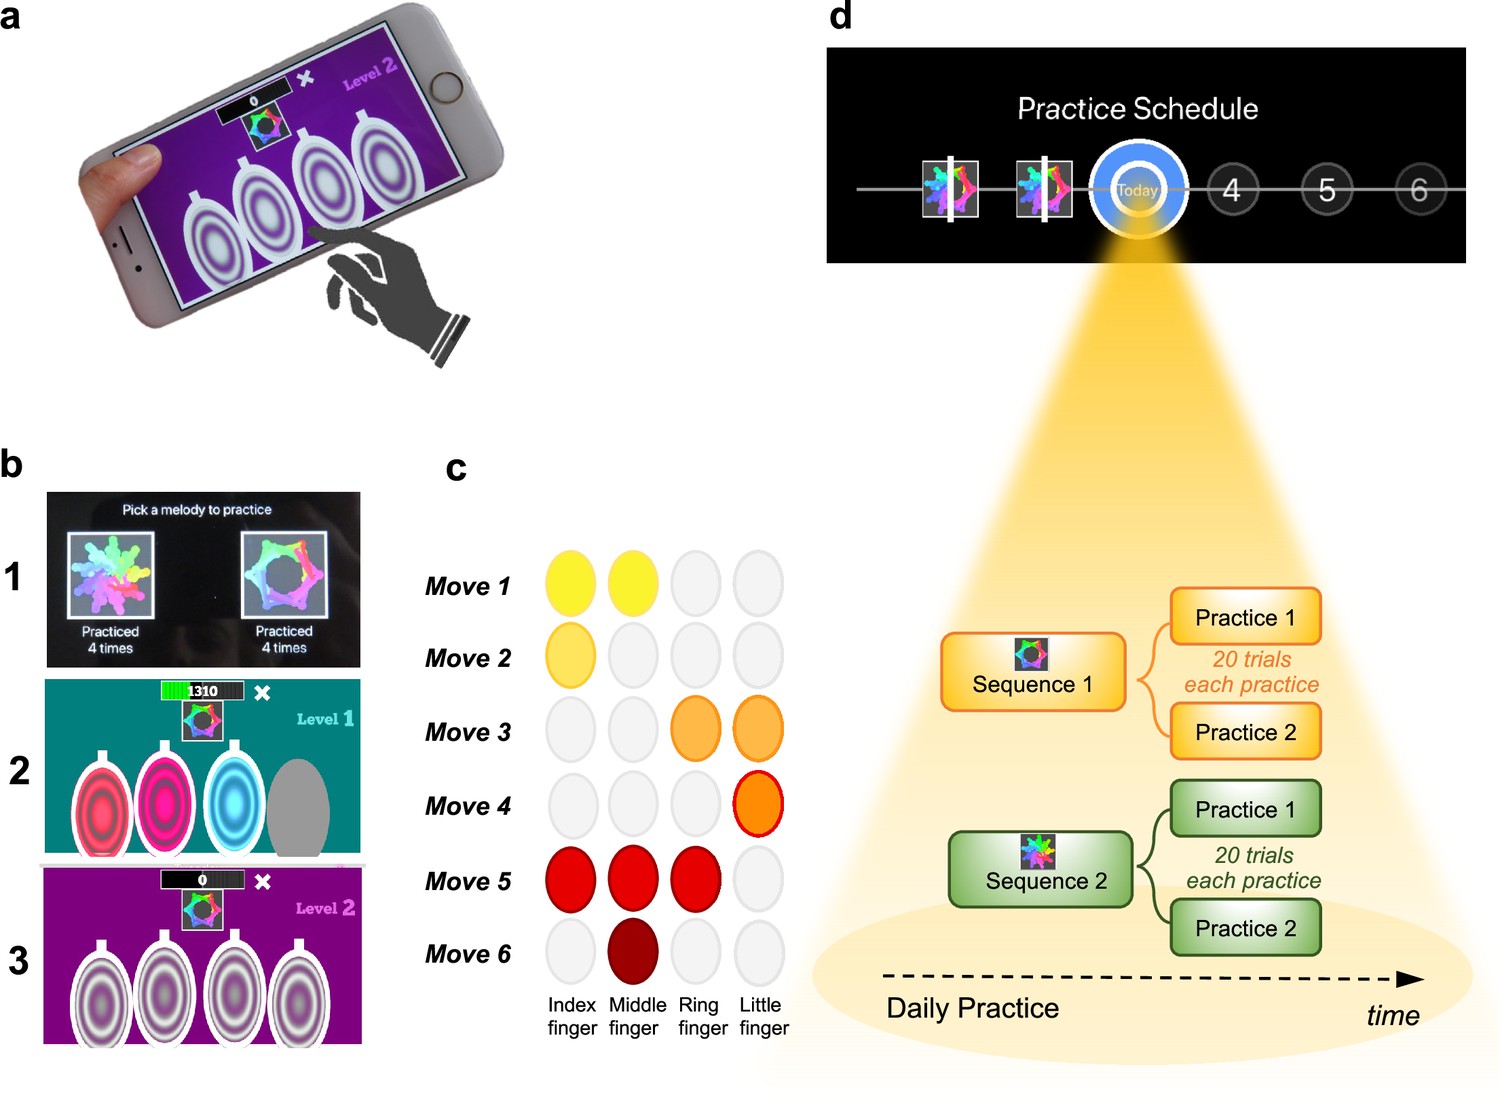
Motor Sequencing App.
(a) A trial starts with a static image depicting the abstract picture that identifies the sequence to be performed (or 'played') as well as the four keys that will need to be tapped. Participants use their dominant hand to play the required keys: excluding the thumb, the leftmost finger corresponds to the first circle and the rightmost finger corresponds to the last circle. (b) Screenshot examples of the task design: (1) sequence selection panel, each sequence is identified by an abstract picture; (2) panel exemplifying visual cues that initially guide the sequence learning; (3) panel exemplifying the removal of the visual cues, when sequence learning is only guided by auditory cues. (c) Example of a sequence performed with the right hand: 6-moves in length, each move can comprise multiple finger presses (2 or 3 simultaneous) or a single finger press. Each sequence comprises 3 single press moves, 2 two-finger moves, and 1 three-finger move. (d) Short description of the daily practice schedule. Each day, participants are required to play a minimum of two practices per sequence. Each practice comprised 20 successful trials. Participants could play more if they wished and the order of the training practices was self-determined.
Figure 2
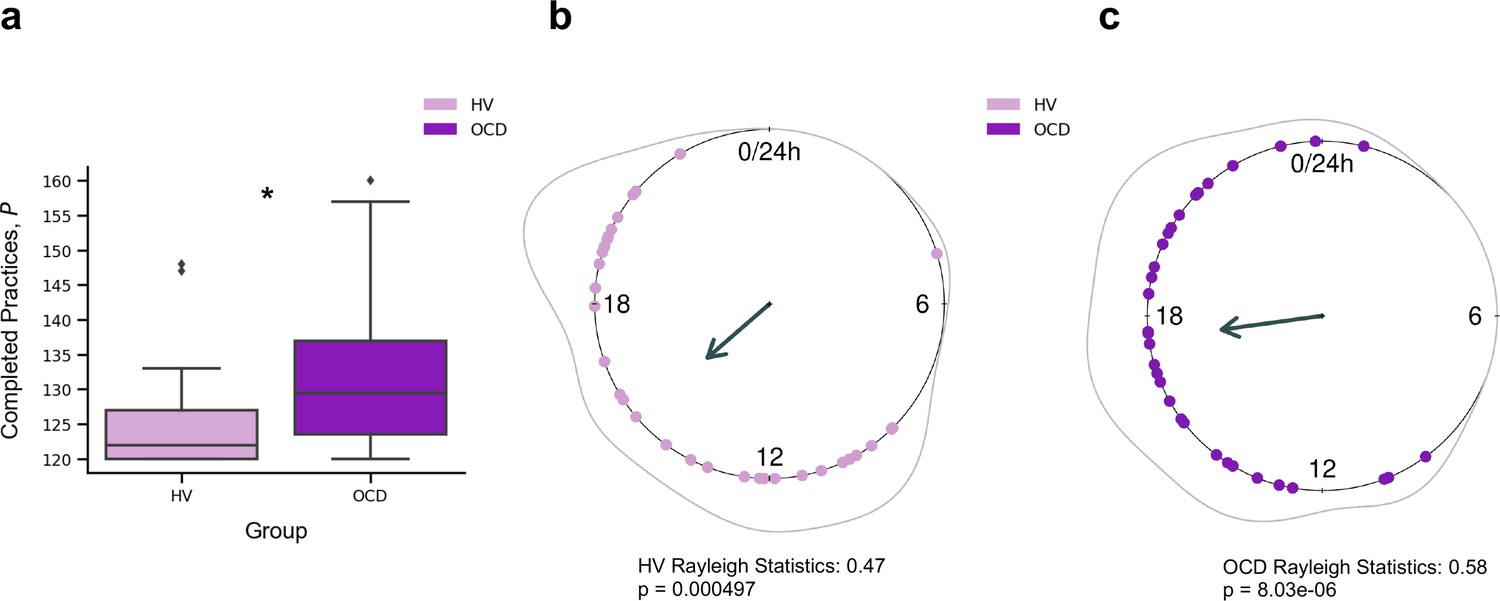
Training engagement.
(a) Whole training overview. Obsessive-compulsive disorder (OCD, N = 32) patients engaged in significantly more training sessions than healthy volunteers (HV, N = 33) (*p = 0.005). The minimum required practices (P) were 120P. (b) Daily training pattern for HV (N = 33) and (c) daily training pattern for OCD (N = 32). Single dots on the unit circle denote the preferred practice times of individual participants within 0–24 hr, obtained from the mean resultant vector of individual practice hours data (Rayleigh statistics). Group-level statistics were conducted in each group separately using the Rayleigh test to assess the uniformity of a circular distribution of points. The graphic displays the length of the mean resultant vector in each distribution, and the associated p-value. Regarding between-group statistical analysis, see main text.
Figure 3
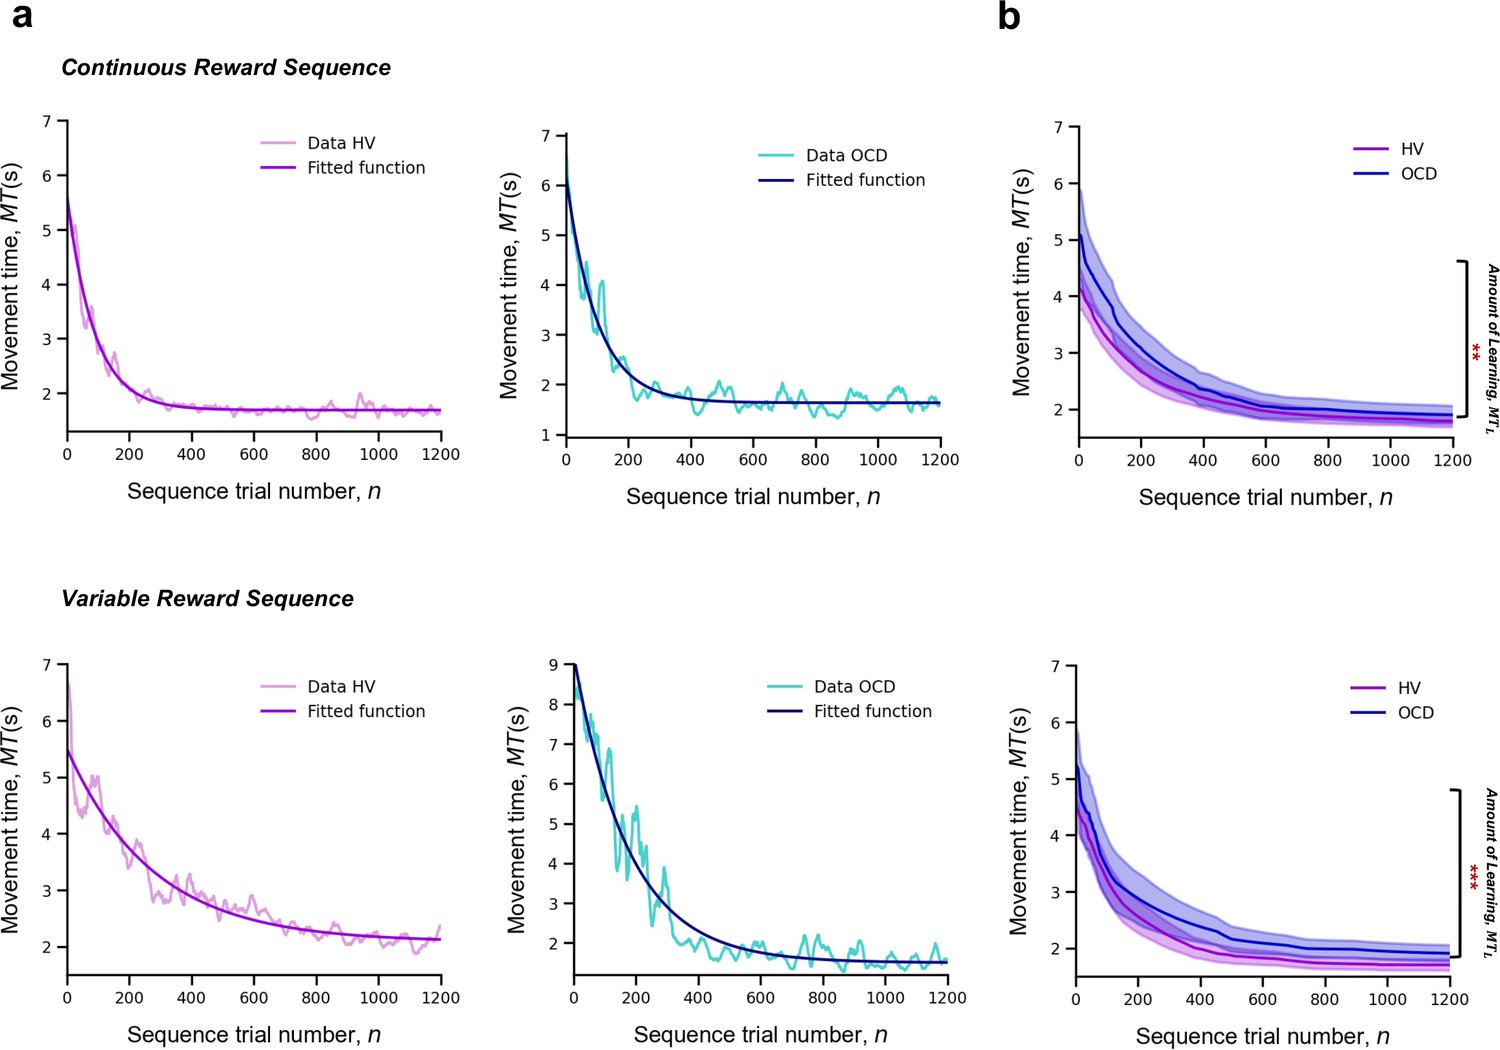
Learning.
Upper panel: Model fitting procedure conducted for the continuous reward sequence. Lower panel: Model fitting procedure conducted for the variable reward sequence. (a) Individual plots exemplifying the time-course of MT (in s) as training progresses (lighter color) as well as the exponential decay fit modeling the learning profile of a single participant (darker color). Left panels depict data in an healthy volunteers (HV) individual, right panels display data in a patient with obsessive-compulsive disorder (OCD). (b) Group comparison resulting from all individual exponential decays modeling the learning profile of each participant. A significant group difference was observed on the amount of learning, , in both reward schedule conditions (continuous: p = 0.009; variable: p < 0.001). Solid lines: median; transparent regions: median ± 1.57 × interquartile range/sqrt(n); purple: HV (N = 33); blue: patients with OCD (N = 32).
Figure 4
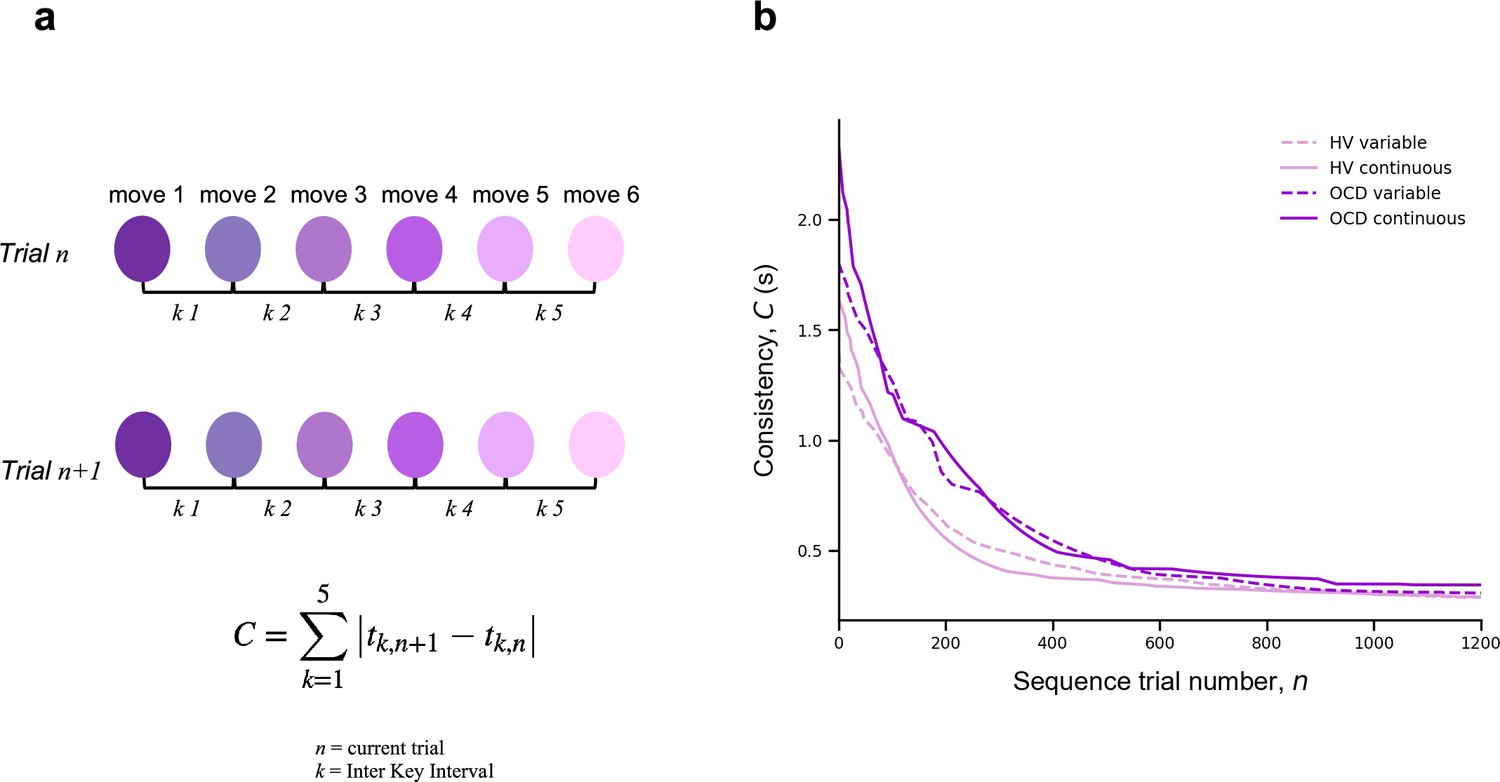
Automaticity.
(a) We mathematically defined trial-to-trial inter-keystroke-interval consistency (IKI consistency), denoted as C (in s), as the sum of the absolute values of the time lapses between finger presses across consecutive sequences. The variable n represents the sequence trial and k denotes the IKI. We evaluated automaticity by analyzing the decline in C over time, as it approached asymptotic levels. (b) Group comparison resulting from all individual exponential decays modeling the automaticity profile (drop in C) of each participant. A significant group effect was found on the amount of automaticity gain, (Kruskal-Wallis H = 11.1, p < 0.001) and on the automaticity constant, (Kruskal-Wallis H = 4.61, p < 0.03). Solid and dashed lines are median values (M). Light purple: healthy volunteers (HV); dark purple: patients with obsessive-compulsive-disorder (OCD); solid lines: continuous reward condition; dashed lines: variable reward condition. Sample size (N): HV = 33, OCD = 32.
Figure 5

Sensitivity of movement time to changes in reward in the continuous reward schedule.
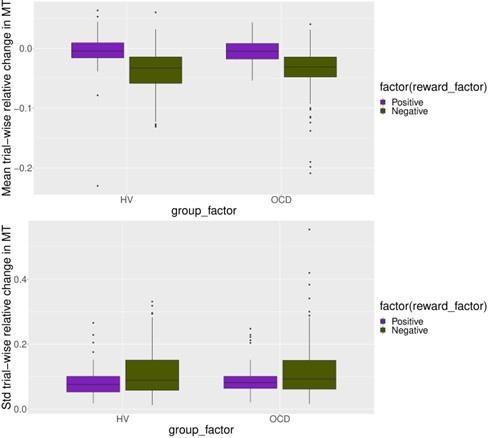
(a) Mean normalized change in movement time (MT, ms) from trial n to n+1 following an increment (∆R+, in purple) or decrement (∆R–, in green) in scores at n. The change in movement time trial to trial was normalized with the baseline value on the initial trial n: ∆MT(n+1) = (MT(n+1) – MT(n))/MT(n). This relative change index is therefore adimensional. The dots represent mean MT changes (error bars denote SEM) in each bin of correctly performed sequences, after partitioning all correct sequences into four subsets, and separately for obsessive-compulsive disorder (OCD, N = 32) (dark colors) and healthy volunteers (HV, N = 33) (light colors). (b) Both groups of participants speeded up their sequence performance more following a drop in scores (main effect of reward, p = 2 × 10–16; 2×4: reward × bin analyses of variance [ANOVA]); yet this acceleration was reduced over the course of practiced sequences (main bin effect, p = 5.06 × 10⁻¹²). (c) Same as (a) but for the spread (std) of the MT change distribution (adimensional). (d–e) Illustration of the main effect of group (d) p = 9.93 × 10⁻⁶ and reward (e) p = 4.13 × 10⁻⁵ on std. Each bin depicted in the plots (x-axis) contains around 110 correct sequences on average (further details in Appendix 1: Sample size for the reward sensitivity analysis).
Figure 6
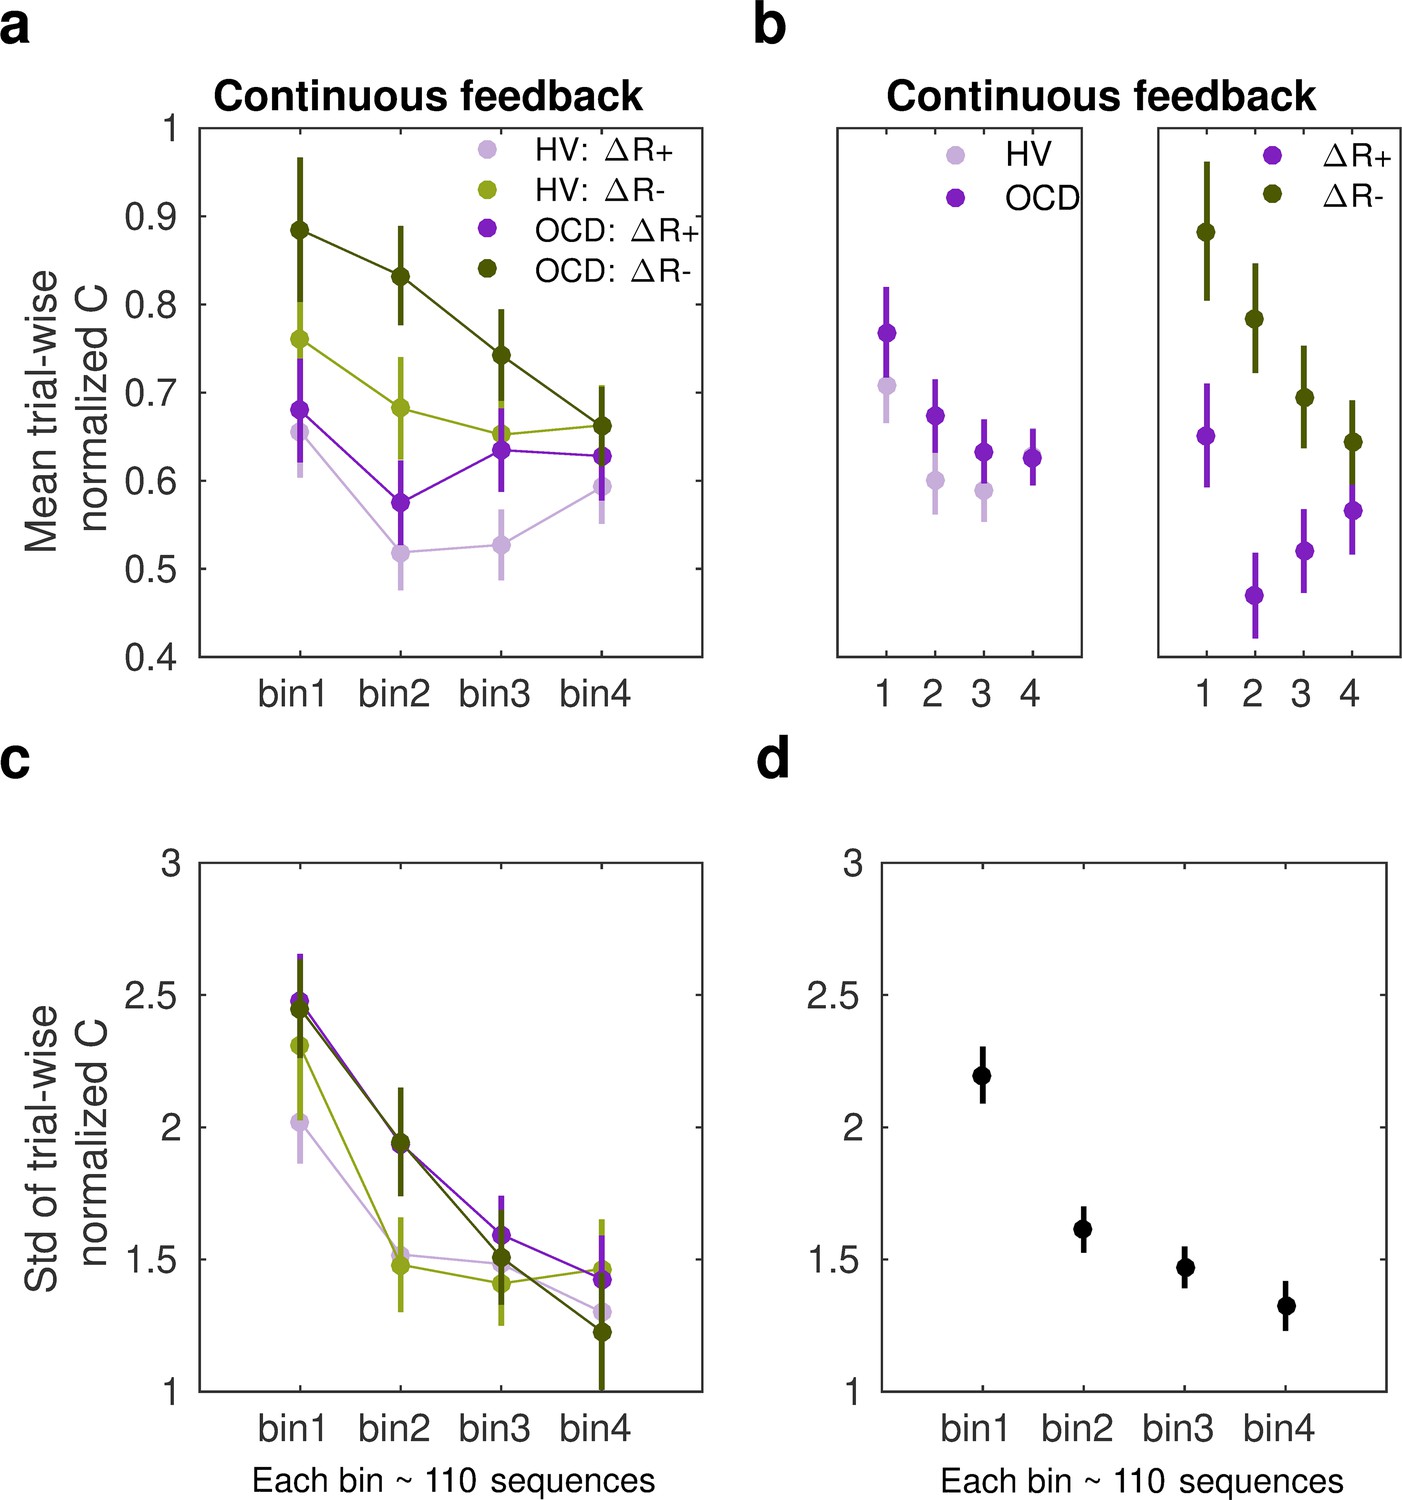
Sensitivity of normalized inter-keystroke interval (IKI) consistency (normC) to reward changes in the continuous schedule.
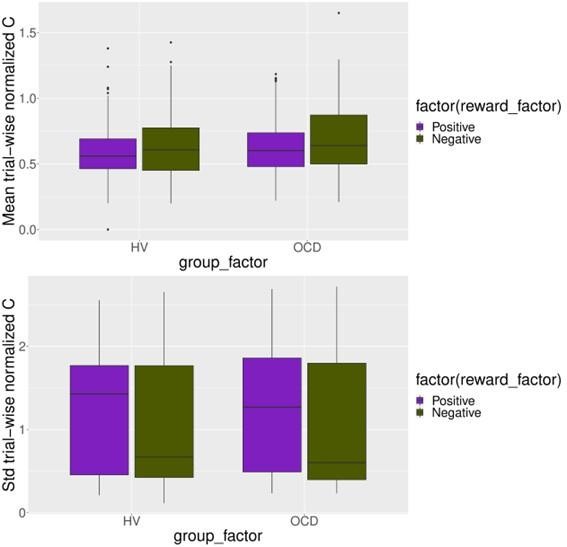
(a) The mean normalized change in trial-to-trial IKI consistency (normC, Equation 8 adimensional) across bins of correct sequences is shown, separately for each group (obsessive-compulsive disorder [OCD, N = 32]: dark colors; healthy volunteers [HV, N = 33]: light colors) and for reward increments (∆R+, purple) and decrements (∆R–, green). The dots represent the mean value, while the vertical bars denote SEM. (b) Illustration of the main effect of group (left panel; p = 0.00454) and type of reward change (right panel; p = 1.86 × 10⁻⁶). (c) Same as (a) but for the std of the distribution of IKI consistency changes, normC, adimensional. (d) The panel displays the main effect of bin (p = 3.63 × 10⁻¹⁴) on the std. Black denotes the average (SEM) across reward and group levels. Each bin depicted in the plots (x-axis) contains 110 correct sequences on average (see Appendix 1: Sample size for the reward sensitivity analysis).
Figure 7

Preference for familiar versus novel action sequences.
(a) Explicit preference task. Participants had to choose and play one of two given sequences. Once the choice was made, the image correspondent to the selected sequence was highlighted in blue. Participants then played the sequence. While playing it, the bar on top registered each move progressively lighting up in green. There were three conditions, each comprising a specific sequence pair: (1) app preferred sequence versus app non-preferred sequence (control condition); (2) app preferred sequence versus any 6-move sequence of participant’s choice (experimental condition 1); (3) app preferred sequence versus any 3-move sequence of participant’s choice (experimental condition 2). (b) No evidence for enhanced preference for the app sequence in either HV or OCD patients (HV: N = 33, OCD: N = 32). In fact, when an easier and shorter sequence is pitted against the app familiar sequence (right raincloud plot), both groups significantly preferred it (Kruskal-Wallis main effect of condition H = 23.2, p < 0.001). Left raincloud plot: control condition; middle raincloud plot: experimental condition 1; right raincloud plot: experimental condition 2. Y-axis depicts the number of app sequence choices (15 choice trials maximum). Connected lines depict mean values. (c) Exploratory analysis of the preference task following up unexpected findings on the mobile-app effect on symptomatology: re-analysis of the data conducting a Dunn’s post hoc test splitting the OCD group into two subgroups based on their YBOCS change after the app training (14 patients with improved symptomatology [reduced YBOCS scores] and 18 patients who remained stable or felt worse [i.e. respectively unchanged or increased YBOCS scores]). Patients with reduced YBOCS scores after the app training had significantly higher preference to play the app sequence in both experimental conditions (left panel: pFDR = 0.015*; right panel: pFDR = 0.011*). The bar plots represent the sample mean and the vertical lines the confidence interval. Individual data points are included to show dispersion in the sample. Abbreviations: YBOCS = Yale-Brown Obsessive-Compulsive Scale, HV = healthy volunteers, OCD = patients with obsessive-compulsive disorder.
Figure 8
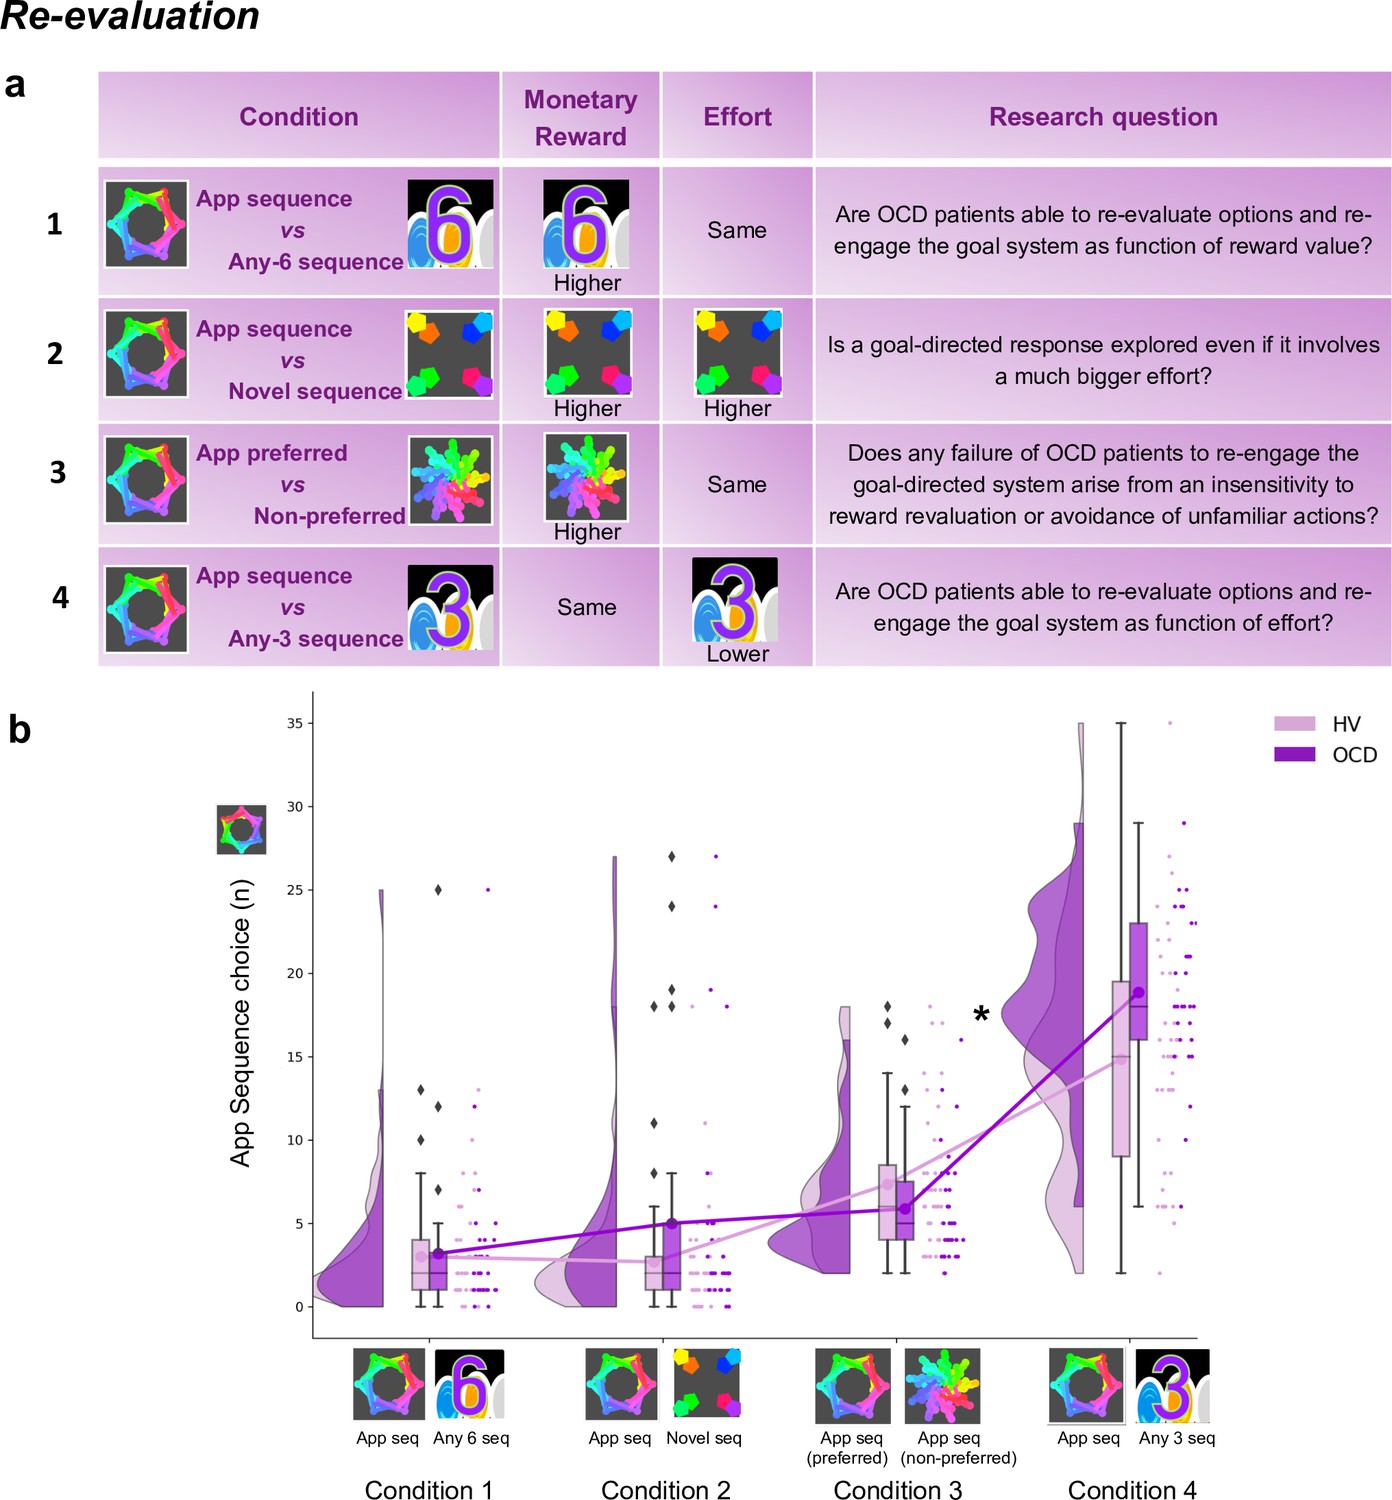
Re-evaluation procedure: two-choice appetitive learning task.
(a) shows the task design. We tested four conditions, with chest-pairs corresponding to the following motor sequences: (1) app preferred sequence versus any 6-move sequence; (2) app preferred sequence versus novel (difficult) sequence; (3) app preferred sequence versus app non-preferred sequence; (4) app preferred sequence versus any 3-move sequence. The ‘any 6-move’ or ‘any 3-move’ sequences could comprise any key press of the participant’s choice and could be played by different key press combinations on each trial. The ‘novel sequence’ (in 2) was a 6-move sequence of similar complexity and difficulty as the app sequences, but only learned on the test day (therefore, not overtrained). In conditions 1, 2, and 3, the preferred app sequence was pitted against alternative sequences of higher monetary value. In condition 4, the intrinsic value of the preferred app sequence was pitted against a motor-wise less effortful sequence (i.e. a shorter/easier sequence). Each condition addressed specific research questions, which are detailed in the right column of the table. (b) demonstrates the task performance per group and over the four conditions (HV: N = 33, OCD: N = 32). Both groups were able to adjust to the new contingencies and choose the sequences associated with higher monetary reward. When re-evaluation involved a motor effort manipulation, obsessive-compulsive disorder (OCD) patients chose the app sequence significantly more than healthy volunteers (HV) (* = p < 0.05) (condition 4). Y-axis depicts the number of app sequence chests chosen (40 trials maximum) and connected lines depict mean values.
Figure 9
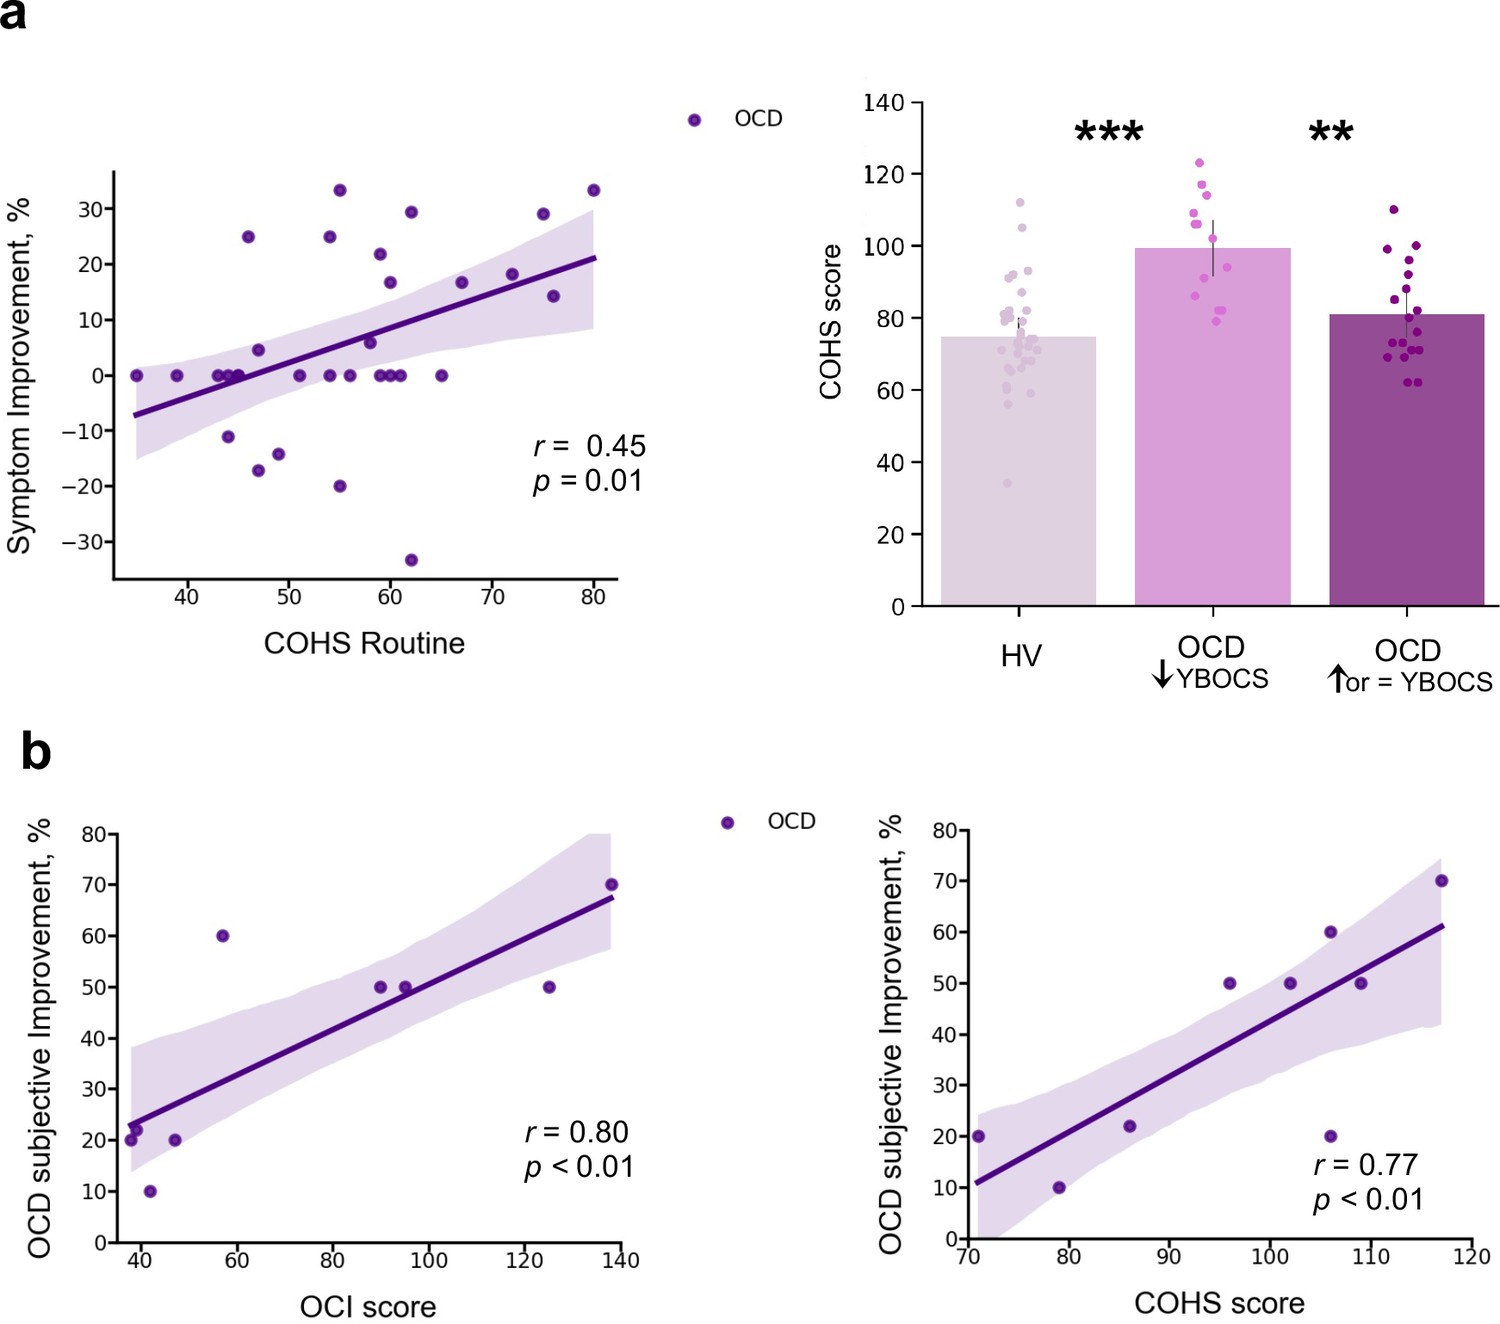
Mobile-app effect on symptomatology.
(a) Left: Positive correlation between patients’ routine tendencies reported in the COHS questionnaire and the symptom improvement (Pearson r = 0.45, p = 0.01), OCD sample size: N = 32. Symptom improvement was measured by the difference in YBOCS before and after app training. Right: Patients with greater improvement in their symptoms after the 1-month app training (N = 14) had greater habitual tendencies as compared to HV (N = 33) (p < 0.001) and to patients who did not improve post-app training (N = 18) (p = 0.002). The bar plot represents the sample means and the vertical lines the confidence interval. Individual data points are included to show dispersion in the sample. (b) OCD patients who related their symptom improvement directly to the app training (N = 9) were the ones with higher compulsivity scores on the OCI (Pearson r = 0.8, p = 0.008) (left) and higher habitual tendencies on the COHS (Pearson r = 0.77, p < 0.01) (right). Note that (b) has one missing patient because he did not complete the OCI scale and COHS. Abbreviations: OCI = Obsessive-Compulsive Inventory, COHS = Creature of Habit Scale, YBOCS = Yale-Brown Obsessive-Compulsive Scale, HV = healthy volunteers, OCD = patients with obsessive-compulsive disorder.
Figure 10

Participants’ demographics, clinical characteristics and results from the self-reported questionnaires.
(a) Participants’ demographics and clinical characteristics (HV: N = 33, OCD: N = 32). (b) Between-group results from the self-reported questionnaires. Abbreviations: HV, healthy Volunteers; OCD, patients with obsessive-compulsive disorder; YBOCS, Yale-Brown Obsessive-Compulsive Scale; MADRS, Montgomery-Asberg Depression Rating Scale; STAI, The State-Trait Anxiety Inventory; BDI, Beck Depression Inventory; OCI, Obsessive-Compulsive Inventory; CPAS, Compulsive Personality Assessment Scale; COHS, Creature of Habit Scale; HSCQ, Habitual Self-Control Questionnaire; BIS, Behavioral Inhibition System; BAS, Behavioral Activation System; Barratt, Barratt Impulsiveness Scale; IUS, Intolerance of Uncertainty Scale; SCS, Self-Control Scale; FMPS, Frost Multidimensional Perfectionism Scale; PSS, Perceived Stress Scale; PSWQ, Penn State Worry Questionnaire. ** = p < 0.01, *** = p < 0.001.
Appendix 1—figure 1
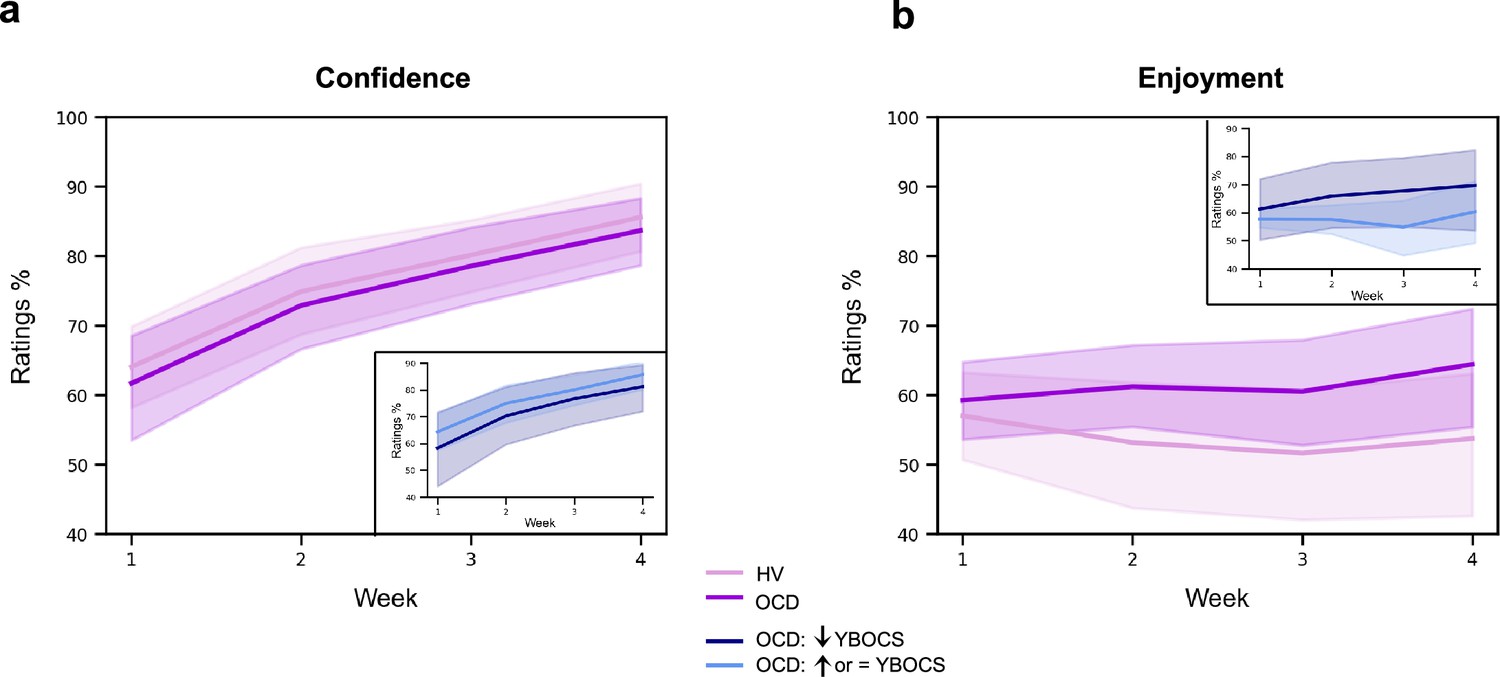
Confidence and enjoyment results.
The plots depict the average participants' ratings on confidence (a) and enjoyment (b) across the 4 weeks of app training. Solid lines: mean; transparent regions: confidence interval. Light purple: healthy volunteers; dark purple: patients with obsessive-compulsive disorder (OCD). The insert plots show the results for the two subgroups of the OCD sample, when split based on their Yale-Brown Obsessive-Compulsive Scale (YBOCS) change after the app training (14 patients with improved symptomatology [reduced YBOCS scores] and 18 patients who remained stable or felt worse [i.e. respectively, unchanged or increased YBOCS scores]).
Appendix 1—figure 2

Model fitting procedure conducted for the switch sessions.
Group comparison resulting from all individual exponential fits modeling the movement time (a), reaction time (b), and accuracy (c) profiles of each participant. No group differences were found. For (a) and (b) plots: solid lines represent median (M) and transparent regions the interquartile range (IQR); for plot (c): solid lines represent the mean and transparent regions for the confidence interval. Purple: healthy volunteers (HV); blue: patients with obsessive-compulsive disorder (OCD).
Appendix 1—figure 3
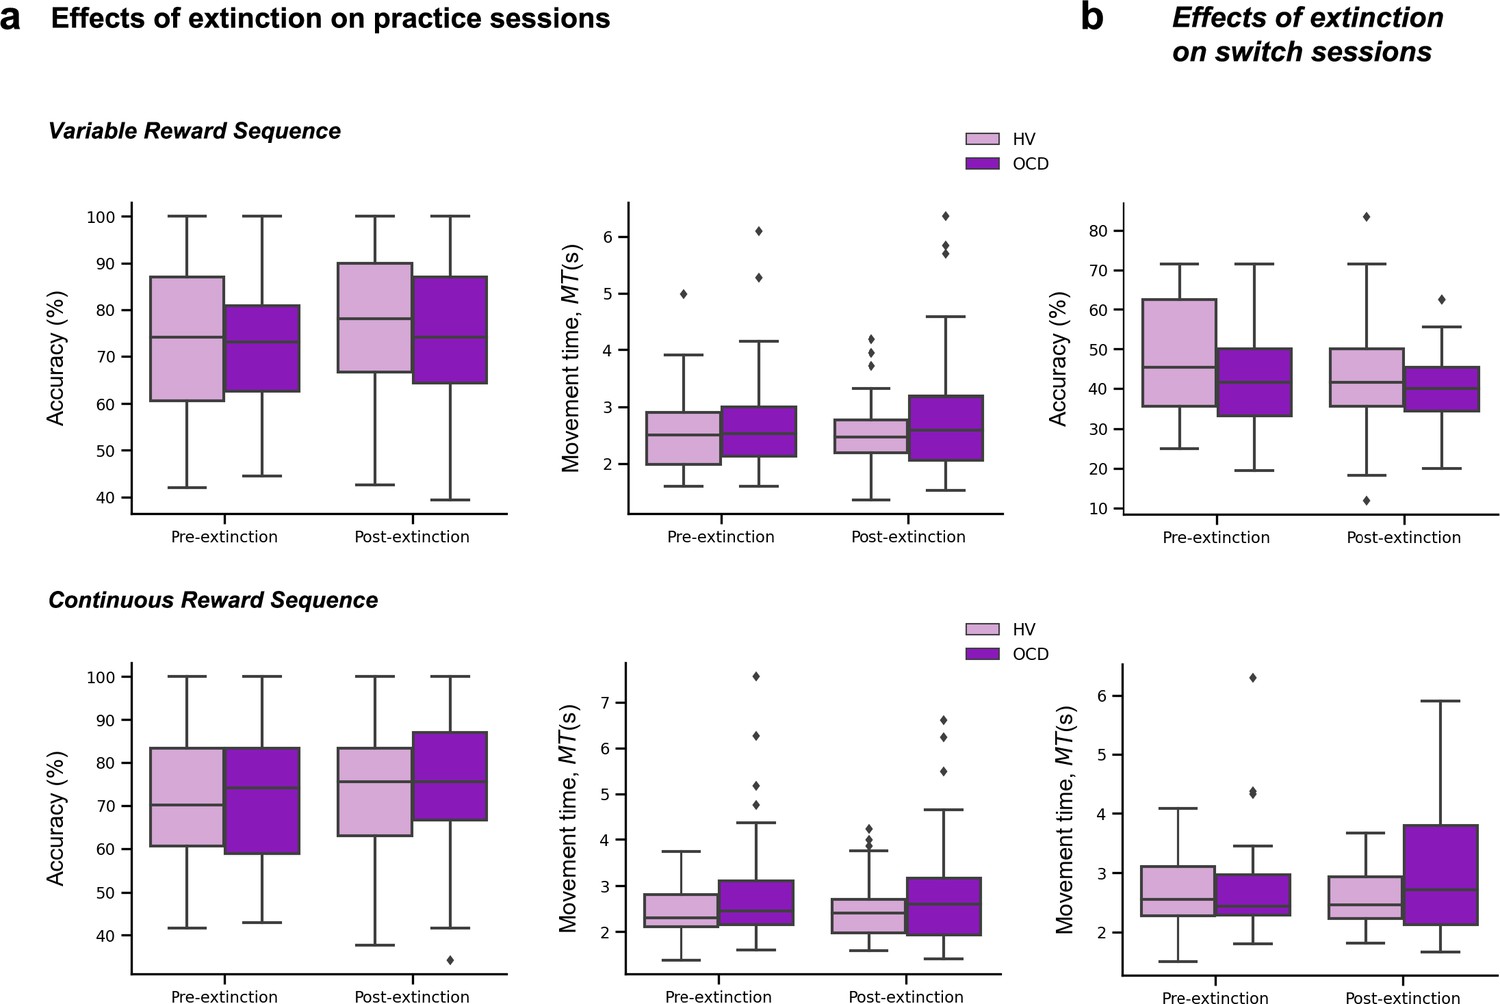
Extinction results.
(a) Effects of extinction on the number of successful trials (accuracy) (left plots) and MT (middle plots) across the practice sessions only, separately for the variable (upper panel) and continuous (lower panel) reward conditions. (b) Effects of extinction on the number of successful trials (accuracy) (top plot) and MT (bottom plot) across the switch sessions. Note that for these analyses we used the two blocks of practice pre- and post-removal of the rewarding feedback (both on the practice and switch conditions).
Appendix 1—figure 4

Relaxation ratings.
Participant’s ratings on how stressful/relaxing the app training was rated in a scale from –100% highly stressful to 100% very relaxing. No group differences (U = 351, p = 0.1).
Appendix 1—figure 5

Fitting of performance data to conditional probability distributions p(∆T|∆R+) and p(∆T|∆R−).
(a) Histogram of the changes in non-normalized movement time (MT, in ms, denoted by T in the graphic) following a decrease in scores relative to the previous trial, ∆R−. Data from one representative subject. (b) Same as (a) but for changes in MT following a reward increment, ∆R+. (c) Example of fitted Gaussian distributions to the histogram data in (a) and (b). The Gaussian fit was estimated in MATLAB using the Curve Fitting Toolbox [function fit, fit(x,y,'gauss1')] on a 20-bin histogram distribution of the data. This example illustrates the Gaussian fits to the total number of sequences and using non-normalized changes in MT (in ms). The full p(∆T|∆R+) and p(∆T |∆R−) distributions are denoted by the purple and green lines, respectively. (d–e) In our analyses, we split the total sample of correct sequences that each participant completed over the course of their training into four bins. We then fitted the Gaussian probability distributions to the subsample of sequences in each bin (~110 on average). The first bin is represented in (d), while the fourth bin is represented in (e). The y-axis limits are identical to those used in panel (c). (f and g) From the fitted Gaussian distributions we obtained the standard deviation, σ, to assess the spread of the distribution, and the mean, μ. Panel (f) displays the std across bins of sequences separately for p(∆T|∆R+) and p(∆T|∆R−). Panel (g) shows the shift in the center of the Gaussian distribution over the course of practiced sequences.
Author response image 1
Author response image 2
Videos
Video 1
Visual demonstration of the Motor Sequencing App for a better understanding of the task.
Tables
Table 1
Self-reported measures on various scales measuring impulsiveness, compulsiveness, habitual tendencies, self-control, behavioral inhibition and activation, intolerance of uncertainty, perfectionism, stress, and the trait of worry.
| HV | OCD | Statistics | |||
|---|---|---|---|---|---|
| (n = 33) | (n = 32) | t | df | p | |
| CPAS | 5.9 (4.0) | 14.2 (5.0) | –7.37 | 62 | <0.001† |
| COHS routine | 48.4 (9.4) | 55.7 (11.1) | –2.79 | 62 | 0.01* |
| COHS automaticity | 26.3 (8.2) | 32.9 (8.5) | –3.15 | 62 | <0.001† |
| COHS total | 74.8 (14.4) | 88.7 (16.7) | –3.56 | 62 | <0.001† |
| HSCQ | 50.7 (7.3) | 42.5 (8.5) | 4.17 | 62 | <0.001† |
| BIS | 17.5 (3.5) | 24.4 (2.7) | –8.81 | 61 | <0.001† |
| BAS reward responsibility | 15.9 (2.2) | 15.1 (2.5) | 1.25 | 61 | 0.22 |
| BAS drive | 10.0 (2.4) | 9.6 (2.6) | 0.66 | 61 | 0.51 |
| BAS fun seeking | 11.1 (1.9) | 9.7 (2.4) | 2.60 | 61 | 0.01* |
| Barratt total | 58.8 (8.4) | 65.0 (10.1) | –2.68 | 61 | 0.01* |
| Barratt attentional | 14.6 (4.1) | 19.8 (4.7) | –4.74 | 61 | <0.001† |
| Barratt motor | 21.2 (2.6) | 21.4 (3.2) | –0.23 | 61 | 0.82 |
| Barratt non-planning | 23.7 (3.3) | 24.6 (4.5) | –0.96 | 61 | 0.34 |
| IUS | 41.9 (10.0) | 87.3 (20.2) | –11.23 | 61 | <0.001† |
| SCS | 118.5 (21.4) | 118.3 (17.2) | 0.04 | 62 | 0.97 |
| FMPS | 70.3 (21.0) | 95.4 (21.4) | –4.73 | 62 | <0.001† |
| PSS | 13.7 (4.7) | 22.9 (5.1) | –7.51 | 62 | <0.001† |
| PSWQ | 37.9 (11.7) | 64.0 (11.0) | –9.20 | 62 | <0.001† |
-
HV, healthy volunteers; OCD, patients with obsessive-compulsive disorder; CPAS, Compulsive Personality Assessment Scale; COHS, Creature of Habit Scale; HSCQ, Habitual Self-Control Questionnaire; BIS, Behavioral Inhibition System; BAS, Behavioral Activation System; Barratt, Barratt Impulsiveness Scale; IUS, Intolerance of Uncertainty Scale; SCS, Self-Control Scale; FMPS, Frost Multidimensional Perfectionism Scale; PSS, Perceived Stress Scale; PSWQ, Penn State Worry Questionnaire. Standard deviations are in parentheses: mean (std). One patient and one healthy control missed a few questionnaires.
-
*
= p < 0.05 level.
-
†
= p < 0.001 level (two-tailed).
Table 2
Demographic and clinical characteristics of OCD patients and matched healthy controls.
| HV | OCD | Statistics | |||
|---|---|---|---|---|---|
| (n = 33) | (n = 32) | t | df | p | |
| Gender ratio (male/female) | 14/19 | 13/19 | |||
| Age | 40.2 (11.7) | 39.3 (12.5) | 0.29 | 63 | 0.77 |
| Years of education | 16.8 (3.4) | 15.6 (3.5) | 1.33 | 63 | 0.19 |
| Predicted verbal IQ | 117.8 (5.6) | 118.4 (4.6) | –0.43 | 63 | 0.67 |
| YBOCS session 1 | 0.0 | 24.3 (5.7) | – | – | – |
| YBOCS Obsessions session1 | 0.0 | 12.2 (3.0) | – | – | – |
| YBOCS Compulsions session1 | 0.0 | 11.8 (3.7) | – | – | – |
| YBOCS session 2 | 0.0 | 22.9 (6.6) | – | – | – |
| YBOCS Obsessions session2 | 0.0 | 11.6 (3.1) | – | – | – |
| YBOCS Compulsions session2 | 0.0 | 11.1 (4.2) | – | – | – |
| Trait Anxiety (STAI-T) | 28.6 (5.9) | 56.4 (8.6) | –15.11 | 63 | <0.001*** |
| State Anxiety (STAI-S) | 28.6 (5.9) | 56.4 (8.6) | –15.2 | 63 | <0.001*** |
| BDI | 1.7 (2.3) | 16.5 (9.4) | –8.72 | 62 | <0.001*** |
| MADRS | 0.9 (1.5) | 11.8 (6.2) | –9.88 | 63 | <0.001*** |
| OCI | 7.3 (9.1) | 68.4 (30.9) | –10.83 | 62 | <0.001*** |
| Checking | 0.9 (1.9) | 11.7 (9.4) | –6.5 | 62 | <0.001*** |
| Ordering | 0.7 (1.6) | 5.8 (3.3) | –7.92 | 62 | <0.001*** |
| Washing | 7.3 (9.2) | 66.0 (28.6) | –11.18 | 62 | <0.001*** |
| Doubting | 1.9 (2.7) | 13.6 (7.5) | –8.37 | 62 | <0.001*** |
| Obsessing | 1.1 (1.8) | 7.9 (4.0) | –8.82 | 62 | <0.001*** |
-
Abbreviations: OCD, patients with obsessive-compulsive disorder; HV, healthy volunteers; YBOCS, Yale-Brown Obsessive-Compulsive Scale; MADRS, Montgomery-Asberg Depression Rating Scale; STAI, The State-Trait Anxiety Inventory; BDI, Beck Depression Inventory; OCI, Obsessive-Compulsive Inventory. Standard deviations are in parentheses: mean (std). One patient missed the BDI and the OCI questionnaires. *** = p < 0.001 level (two-tailed).
Table 3
Follow-up task instructions.
| Explicit preference task |
|---|
| You will be given two sequences to choose from. You can play either of them and switch as you go. Select the sequences using the left and right pads and then play it |
| Two-choice appetitive instrumental task |
| In the following task, you will need to choose between two chests. Pick a chest using the left and right pads and play the matching sequence to open it. Open any chest you want. One of the chests may reward you more than the other. The more gems you get, the more money you will earn at the end of the task. Try to win as much as you can! You will receive your winnings at the end of the study. |
Appendix 1—table 1
Participant’s qualitative and quantitative feedback on the impact of the app-training in their life quality.
| Population | N | Qualitative feedback | Quantitative feedback (%) |
|---|---|---|---|
| HV | 28 | It was a very neutral game so it did not interfere positively or negatively with my life | 0 |
| 2 | It did not impact my routines but it was very boring to do this every day | 0 | |
| 1 | I could see the progress and this was fulfilling | 10 | |
| 1 | It kept my brain active in the morning | 15 | |
| 1 | This was a month full of changes (I changed job, moved house, …) so the app was probably the only thing that remain constant throughout the month. I think it probably worked as some kind of mindfulness. | 60 | |
| OCD | 16 | It was neutral, it did not interfere with my life in any way | 0 |
| 4 | The app gave me a goal, some kind of structure to work towards. It was quite relaxing to do it. I enjoyed and repetition was not boring. | 2, 60, 70 and 70 | |
| 1 | It took my mind off the obsessions and rituals. Moreover, playing the app was a challenge to me. Seeing that I was getting better at it gave me a sense of achievement. This increased my confidence, which has spilled over into other areas of my life. | 80 | |
| 1 | I found it quite relaxing and a diversion at times. | 23 | |
| 1 | It was gratifying because I was finally able to complete something | 30 | |
| 1 | It kept me occupied | 10 | |
| 1 | The app made me use my brain and became part of my everyday routine | 60 | |
| 1 | It was definitely a stress relief. I was familiar enough with the app and this was very relaxing. I felt more confident throughout and then this makes me feel really good. I could switch off my obsessions. It was a focus although repetitive. The repetitiveness is relaxing because it is familiar. | 70 | |
| 1 | It took my mind off of other checking rituals for a short time. | 25 | |
| 1 | The app training made me sit and relax and because I had to concentrate I did not worry with other things. | 10 | |
| 1 | It was sometimes a bit of fun while having a difficult day | 30 | |
| 1 | While I was doing I was so focused on doing it that the thoughts were not coming so often. I just don't rate higher because in the last couple of weeks there were some other things in my life that upset me and the old came stronger | 50 | |
| 1 | It gave me sense of achievement | 40 | |
| 1 | Definitely not improved my life. A bit of the opposite as it was an extra thing I needed to do every day | –30 |
-
Quantitative feedback was given in a scale from –100% to 100%, in which 0 was no change in life quality, –100% was the maximum decrease in life quality and 100% was the maximum increase in life quality.
Additional files
Download links
A two-part list of links to download the article, or parts of the article, in various formats.
Downloads (link to download the article as PDF)
Open citations (links to open the citations from this article in various online reference manager services)
Cite this article (links to download the citations from this article in formats compatible with various reference manager tools)
Action sequence learning, habits, and automaticity in obsessive-compulsive disorder
eLife 12:RP87346.
https://doi.org/10.7554/eLife.87346.4


