Brain areas for reversible symbolic reference, a potential singularity of the human brain
- Cognitive Neuroimaging Unit, CEA, INSERM, Université Paris-Saclay, NeuroSpin center, France
- Department of Neurophysics, Donders Centre for Neuroscience, Radboud University Nijmegen, Netherlands
- Department of Psychiatry, Radboud University Nijmegen Medical Centre, Netherlands
- State Key Laboratory of Cognitive Neuroscience and Learning & IDG, McGovern Institute for Brain Research, Beijing Normal University, China
- Center for Brain Circuit Therapeutics, Department of Neurology, Brigham & Women’s Hospital, Harvard Medical School, United States
- Department of Neurosciences, Laboratory of Neuro- and Psychophysiology, KU Leuven Medical School, Belgium
- Leuven Brain Institute, KU Leuven, Belgium
- Université Paris-Saclay (UVSQ), Hôpital Foch, France
- Athinoula A. Martinos Center for Biomedical Imaging, Massachusetts General Hospital, United States
- Department of Radiology, Harvard Medical School, United States
- Collège de France, Université Paris-Sciences-Lettres (PSL), France
Figures
Figure 1 with 1 supplement
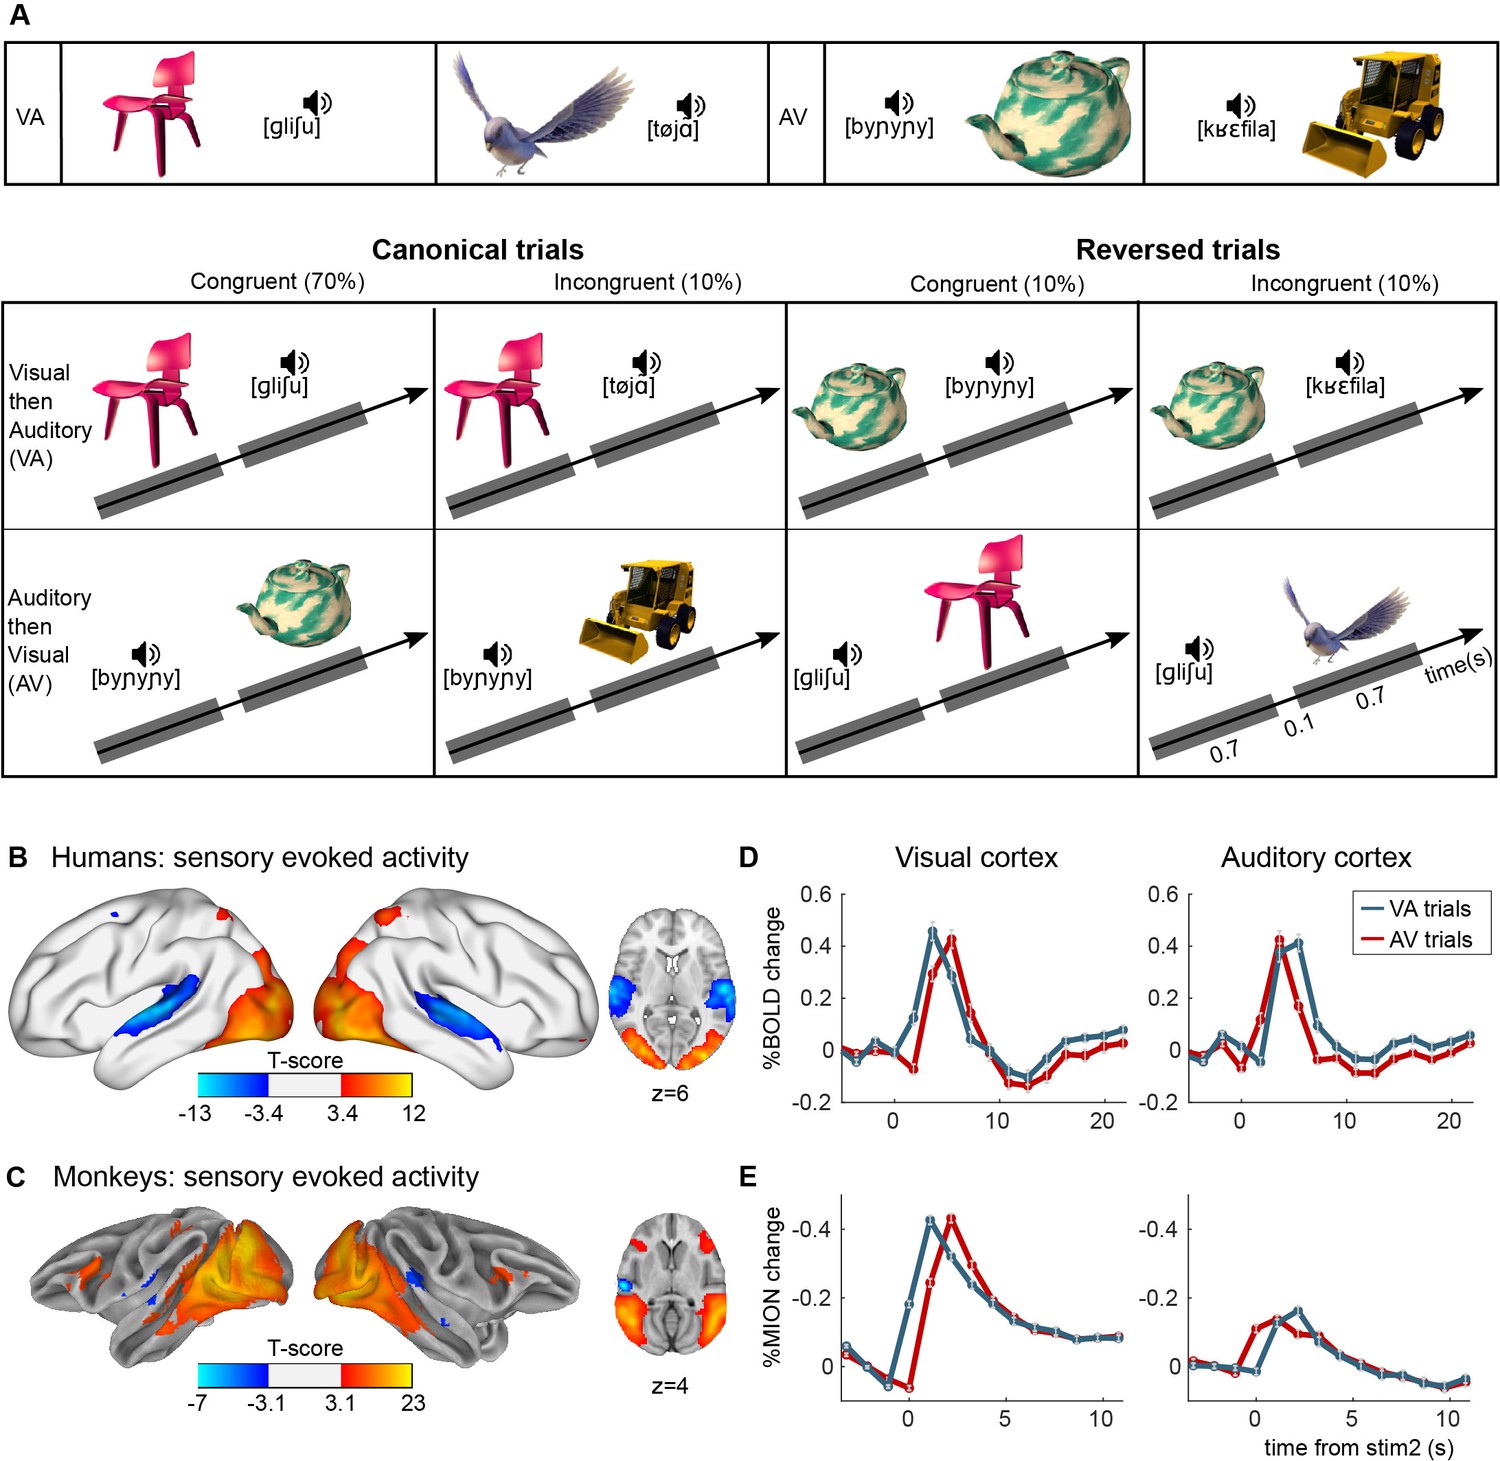
Experimental paradigm for auditory–visual label learning.
(A) Subjects were exposed to four different visual–auditory pairs during 3 days (six repetitions of each pair, 3-min video). Two pairs were always presented in the ‘visual-then-auditory’ order (object to label), and two in the ‘auditory-then-visual’ (label to object) order. During the test phase, this canonical order was kept on 80% of trials, including 10% of incongruent pairs to test memory of the learned pairs, and was reversed on 20% of the trials. On reversed trials, half the pairs were congruent and half were incongruent (each 10% of total trials), thus testing reversibility of the pairings without affording additional learning. (B, C) Activation in sensory cortices. Although each trial comprises auditory and visual stimuli, these could be separated by the temporal offsets. Images show significantly activated regions in the contrasts image > sound (red-yellow) and sound > image (blue-light blue), averaged across all subjects and runs for humans (B) and monkeys (C). Average finite-impulse-response (FIR) estimate of the deconvolved hemodynamic responses for humans (D) and monkeys (E) within clusters shown in B and C, respectively, separately for visual–audio (VA) and audio–visual (AV) trials. Sign flipped on y-axis for monkey responses.
Figure 1—figure supplement 1
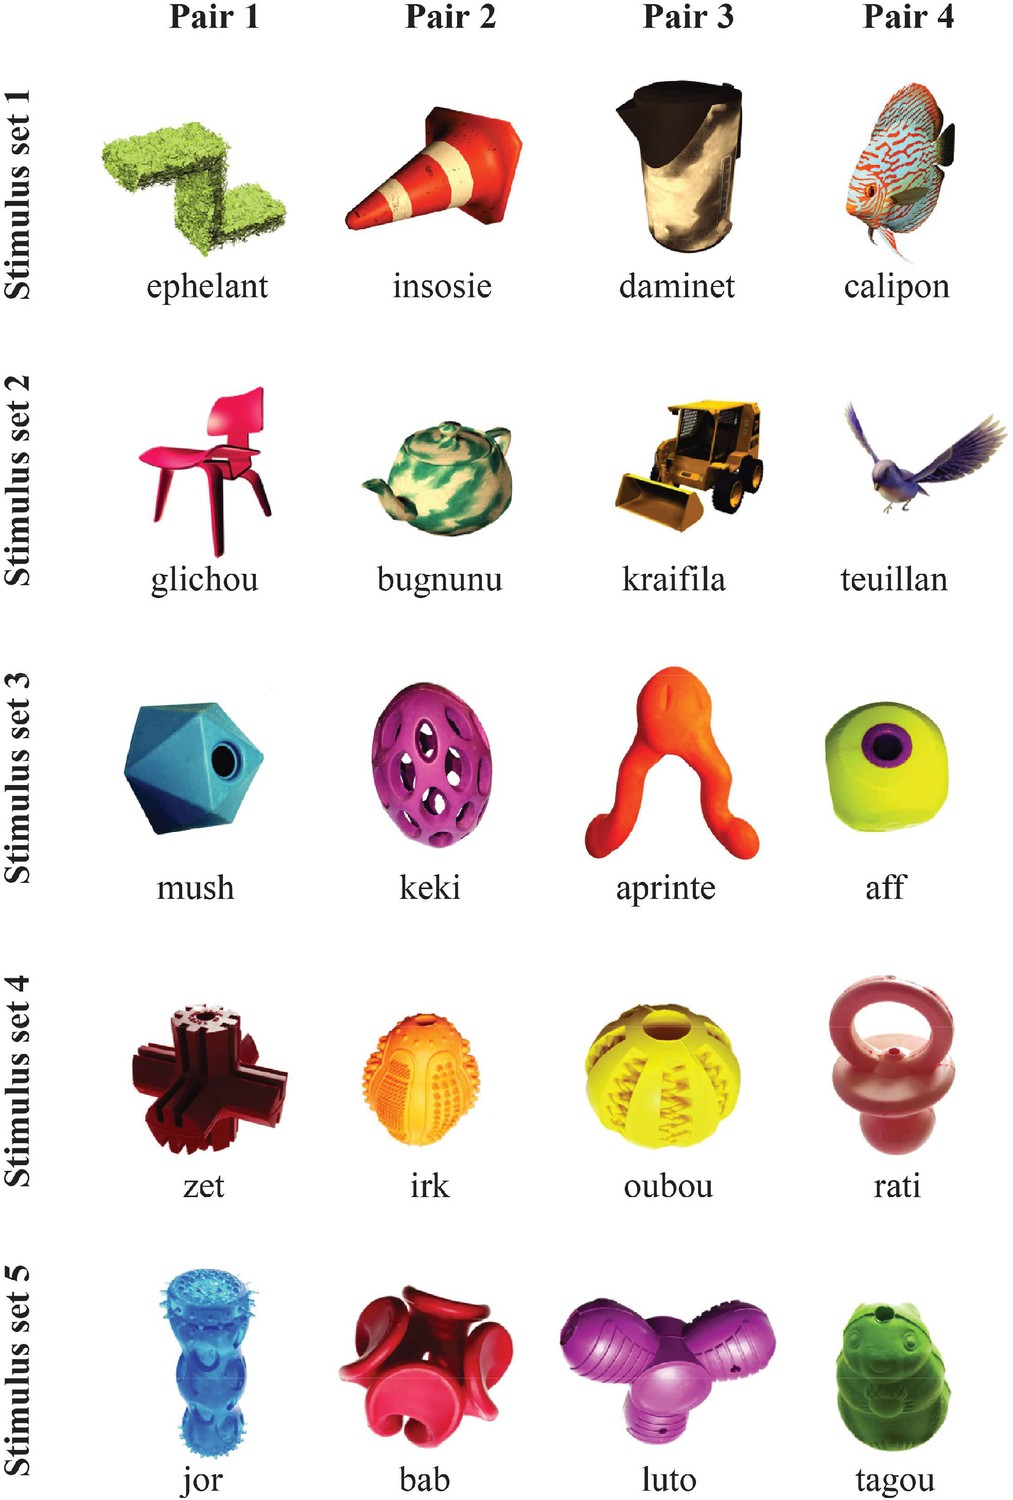
Stimulus sets for experiment 1.
Figure 2
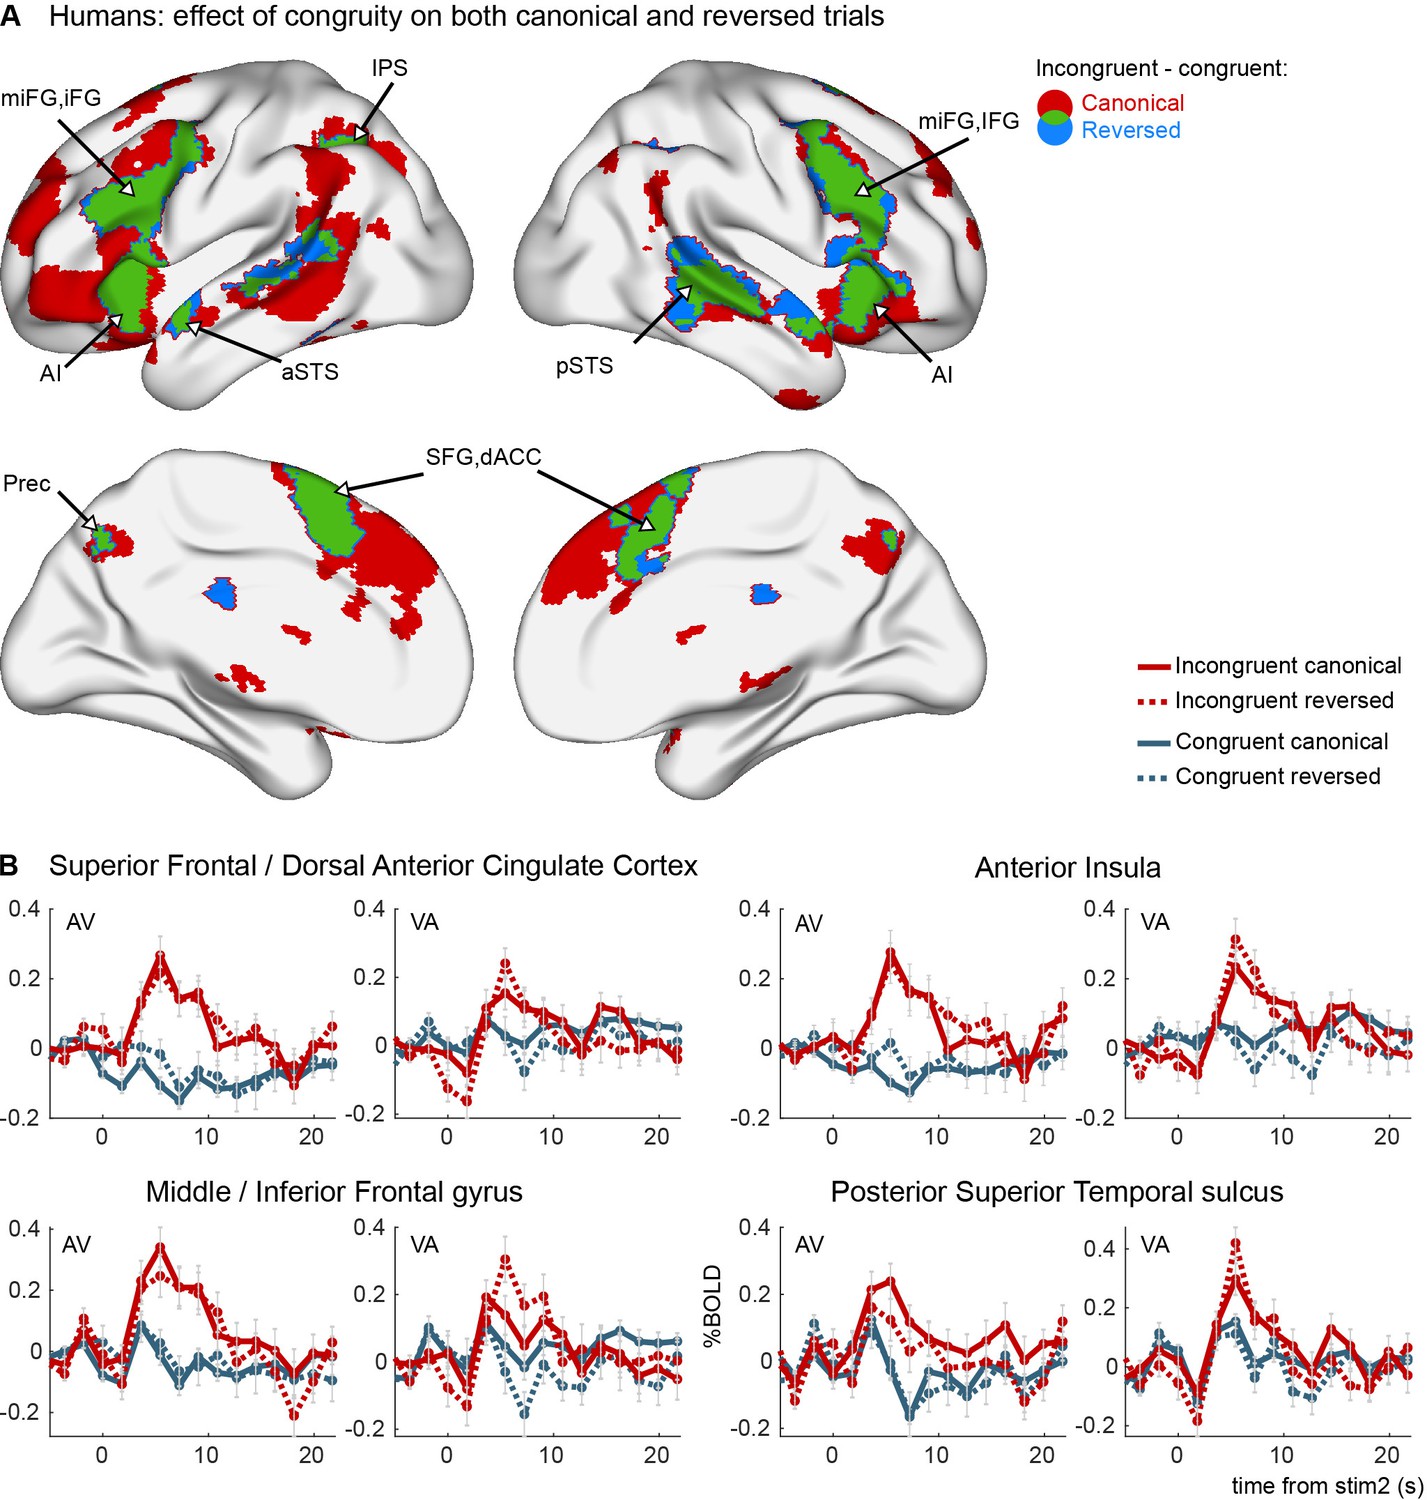
Congruity effects in the auditory–visual task in humans (experiment 1).
(A) Areas activated by incongruent trials more than by congruent trials in canonical trials (red), reverse trials (blue), and their overlap (green). Brain maps are thresholded at pvoxel < 0.001 and pcluster < 0.05 corrected for multiple comparisons across the brain volume. No interaction effect was observed between congruity and canonicity. (B) Average FIR estimate of the deconvolved hemodynamic responses within significant clusters in the left hemisphere, separately for VA and AV trials. Thirty-one human subjects were tested, on a single imaging session per subject after 3 days of exposure to canonical trials.
Figure 3
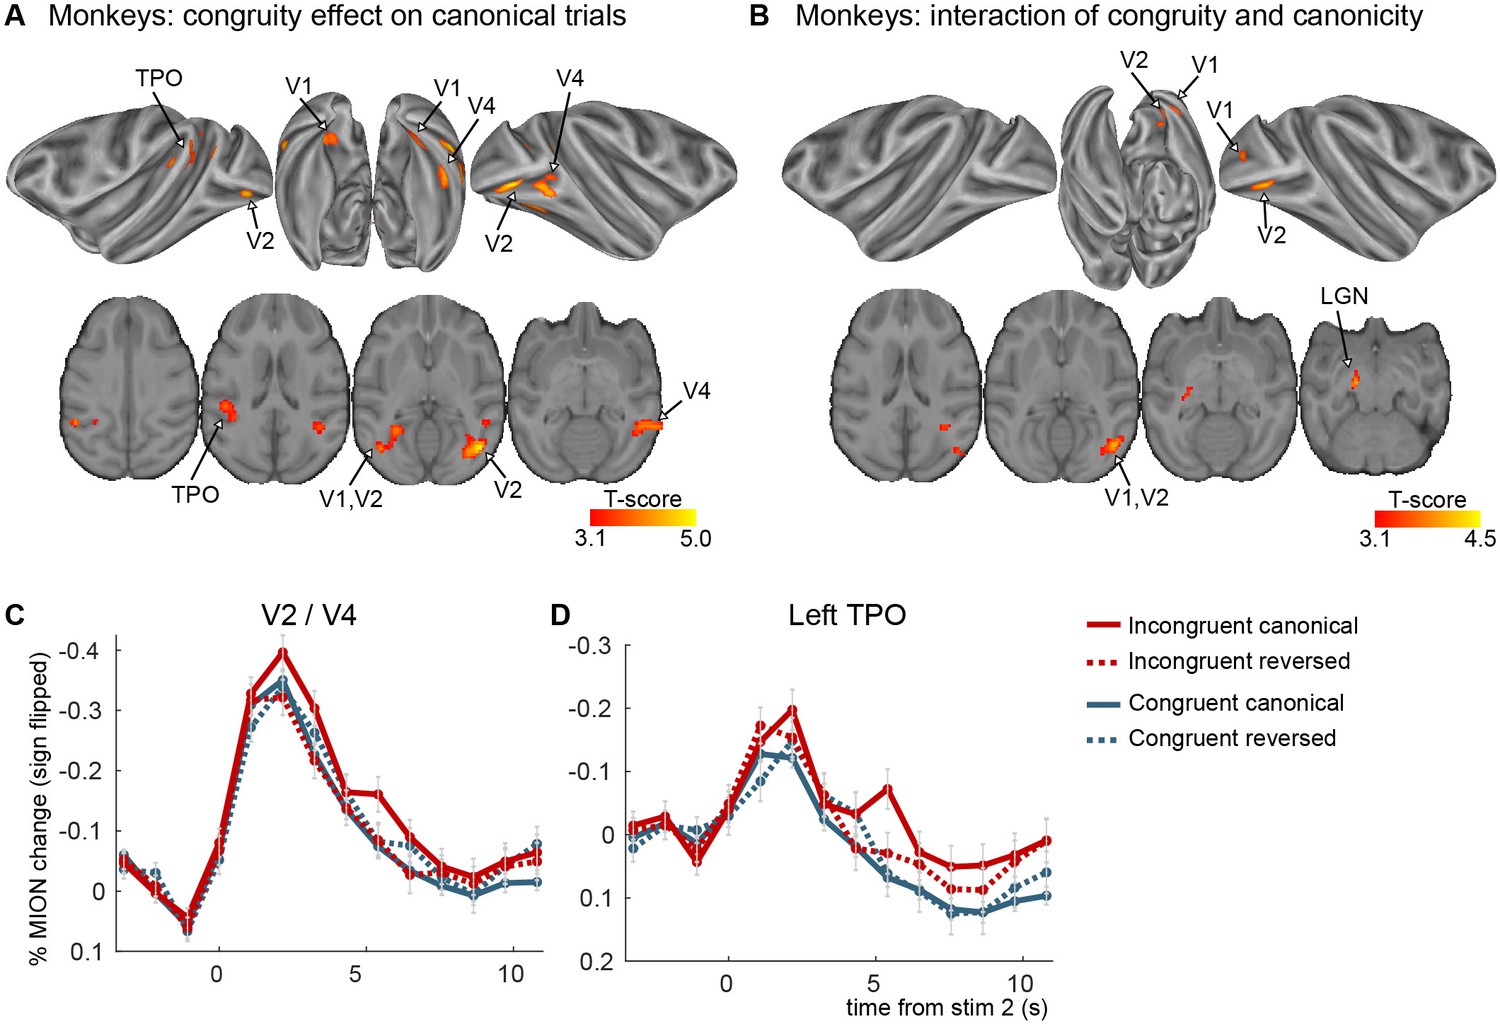
Congruity effects in the auditory–visual task in monkeys (experiment 1).
(A) Significant clusters from the incongruent–congruent canonical contrast. No significant clusters were found for the reversed direction. (B) Significant clusters from the interaction between congruity and canonicity (pvoxel < 0.001 and pcluster < 0.05 for both maps). (C, D) Average FIR estimate of the deconvolved MION responses within the clusters from the incongruent–congruent canonical contrast, averaged over VA and AV trials. All clusters in early visual areas were taken together to create figure C. The two monkeys were scanned after two additional weeks of exposure (4 imaging sessions per subject per stimulus set, three stimulus sets were used).
Figure 4 with 3 supplements
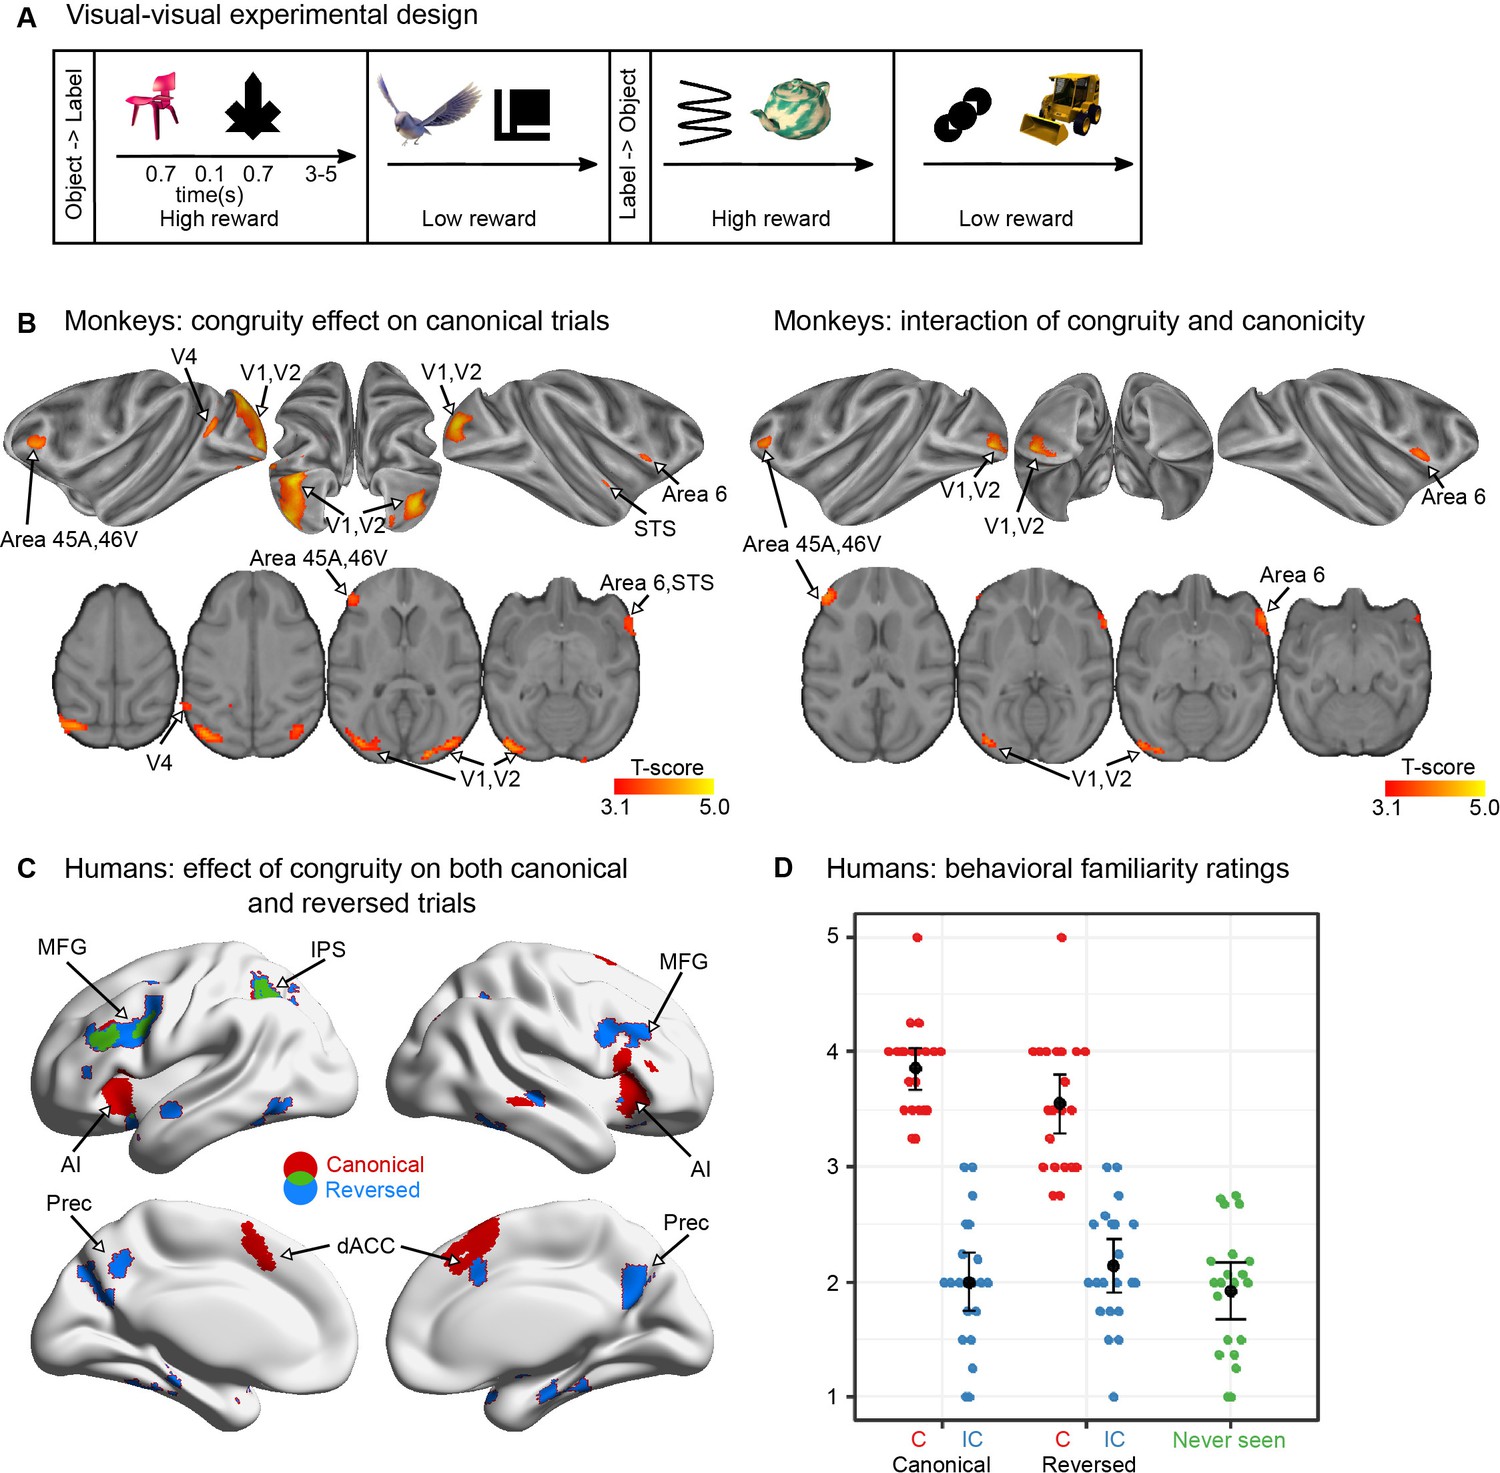
Visual–visual label learning in humans and monkeys (experiment 2).
(A) Experiment paradigm. Subjects were habituated to four different visual–visual pairs during 3 days. Two pairs were in the ‘object-then-label’ order and two pairs in the ‘label-then-object’ order. For the monkeys, one object in each direction was associated with a high reward while the other one was associated with a low reward, making reward size orthogonal to congruity and canonicity (see Figure 4—figure supplement 1 for details). (B) Monkey fMRI results. Significant clusters (pvoxel < 0.001 and cluster volume >50) from the incongruent–congruent canonical contrast (left) and the interaction between congruity and canonicity (right). One imaging session per subject per stimulus set was performed after 3 days of exposure to canonical trials in each of the three monkeys, with 5 stimulus sets per subject. (C) Human fMRI results. Areas more activated by incongruent trials than by congruent trials in the canonical (red), and the reversed direction (blue), and their overlap (green) (right) (pvoxel < 0.005 and cluster volume >50). No red voxels are visible because all of them figure in the overlap (green). One imaging session was performed per subject in 23 participants after 3 days of exposure to a short block of 24 canonical trials. (D) Human behavioural results. After learning, human adults rated the familiarity of different types of pairs (including a fifth category of novel, never-seen pairings). Each dot represents the mean response of a subject in each condition. Although the reversed congruent trials constituted only 10% of the trials, they were considered almost as familiar as the canonical congruent pairs.
Figure 4—figure supplement 1
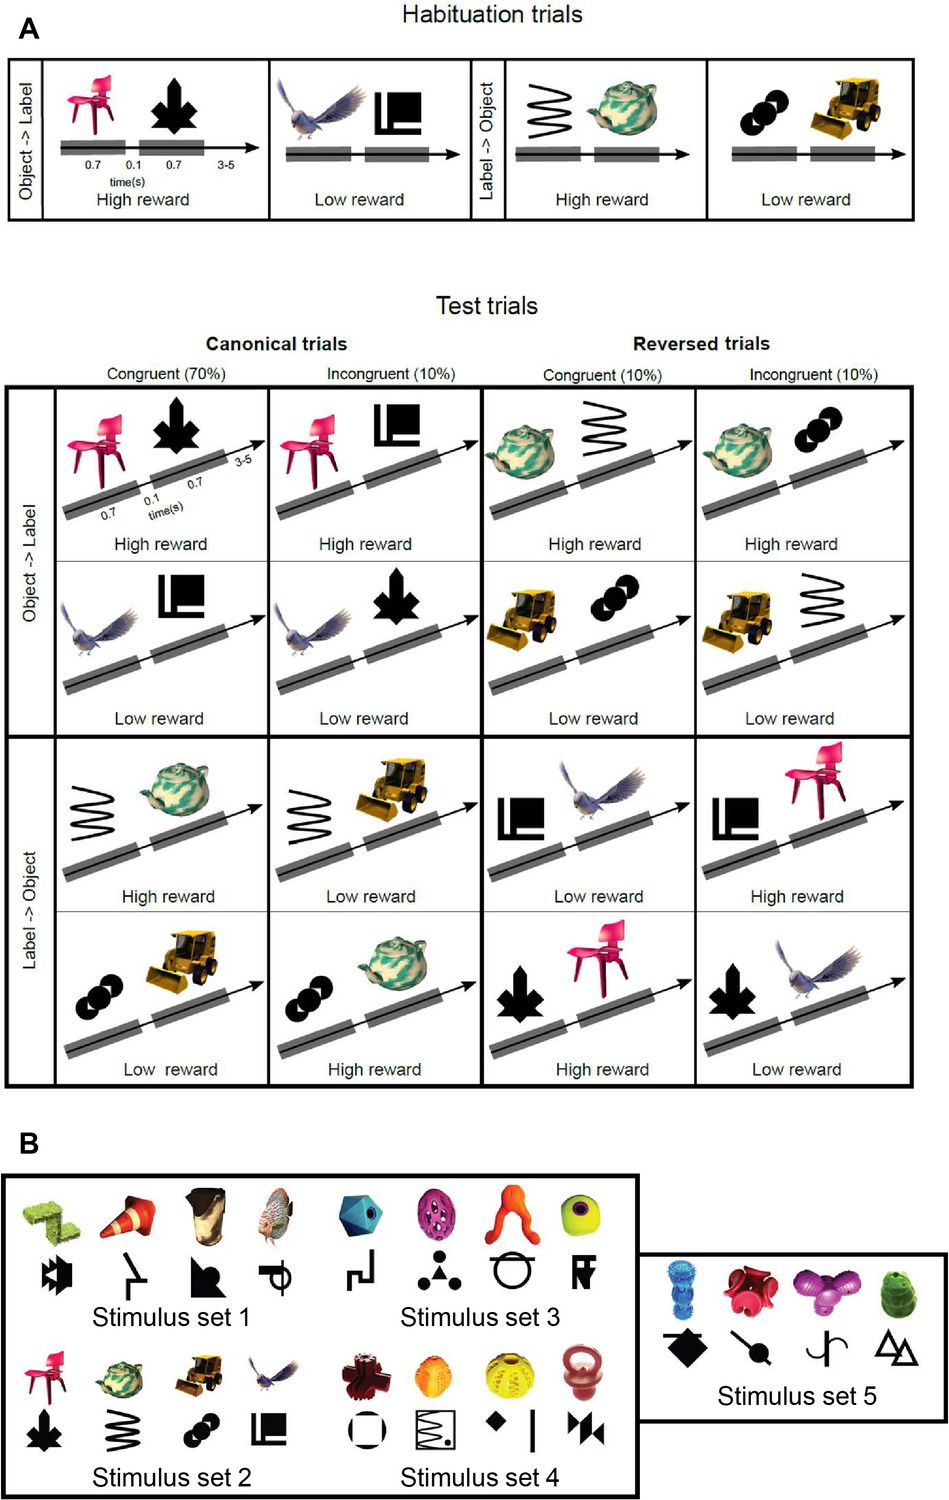
Complete description of the task paradigm for visual-visual label learning.
(A) Subjects were habituated to four different visual–visual pairs during 3 days. Two pairs were in the ‘object–label’ order and two pairs in the ‘label–object’ order. During the test phase, the same canonical order was kept in 80% of the trials, including 10% of incongruent pairs. In reversed trials (20% of trials), the pairs were either congruent (10%) or incongruent (10%) with the learning. For the monkeys, one pair in each direction was associated with a high reward while the other one was associated with a low reward, making the reward size orthogonal to congruity and canonicity. (B) Stimulus sets for experiment 2 in monkeys. Humans were tested with stimulus set 2.
Figure 4—figure supplement 2
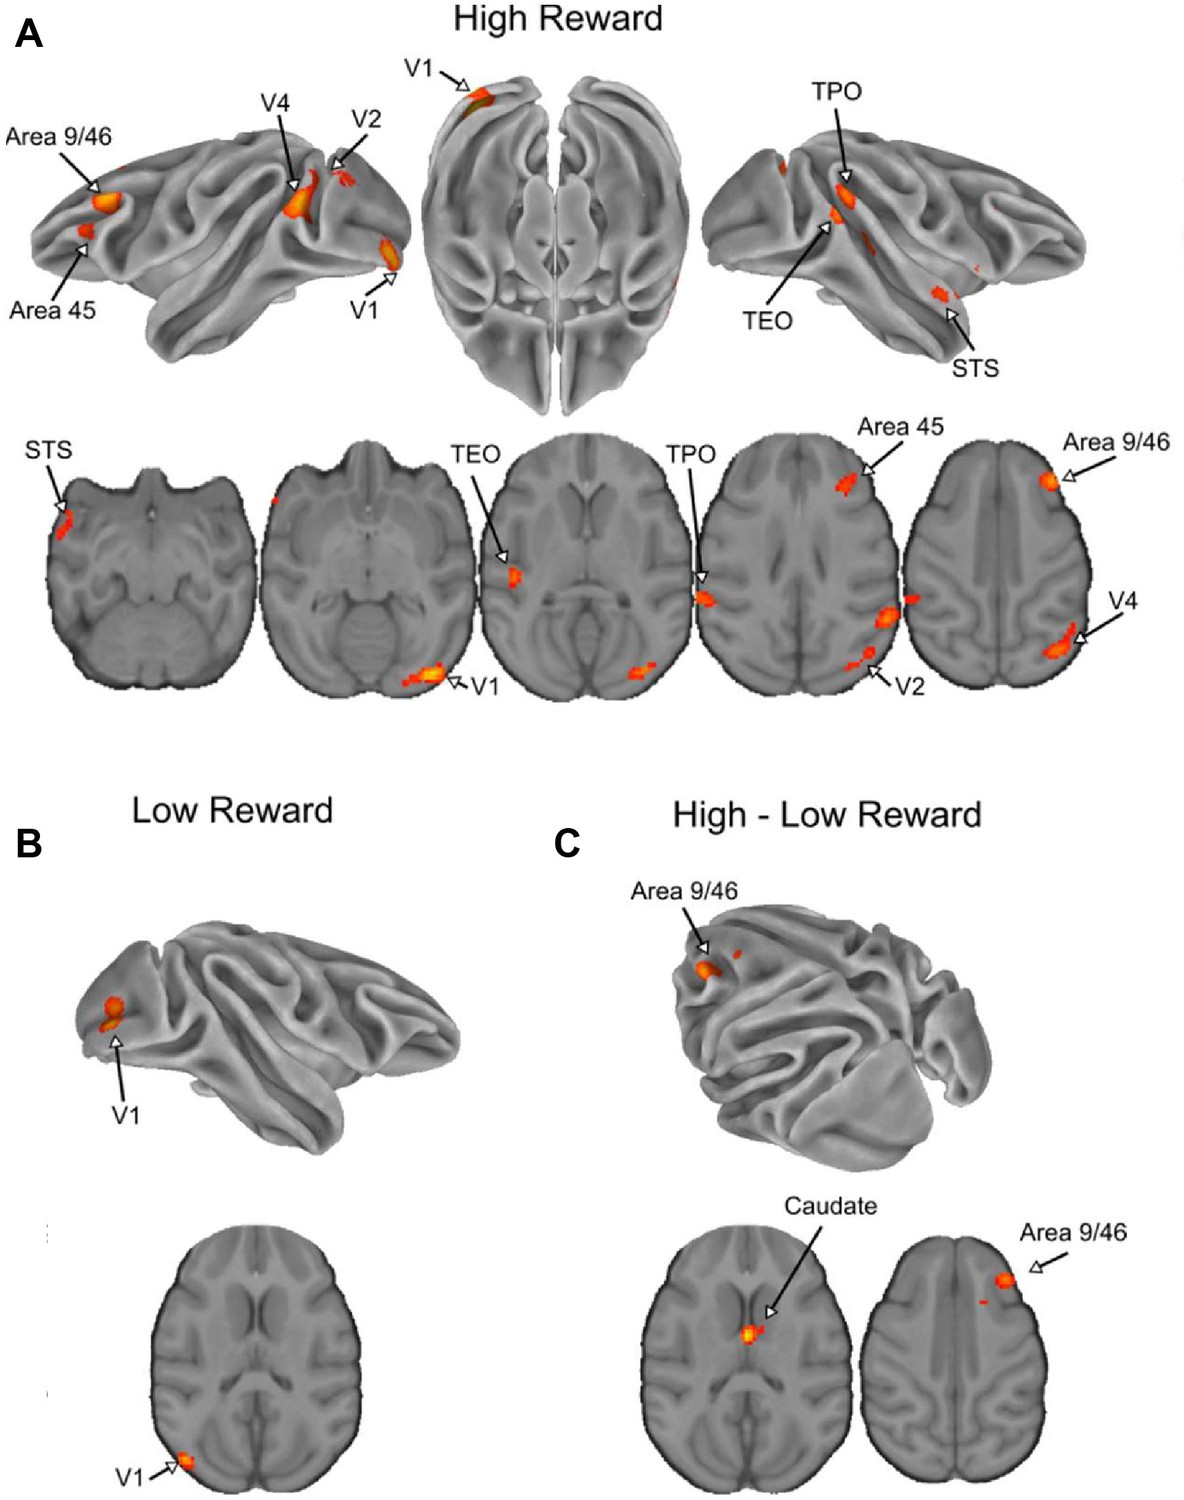
Effect of reward for the visual–visual task in non-human primates.
(A) Significant clusters from the incongruent–congruent canonical contrast in low reward trials. (B) Significant from the incongruent–congruent canonical contrast in high reward trials. (C) Significant clusters from the interaction between congruity and reward. pvoxel < 0.001 and pcluster < 0.05 in all panels.
Figure 4—figure supplement 3
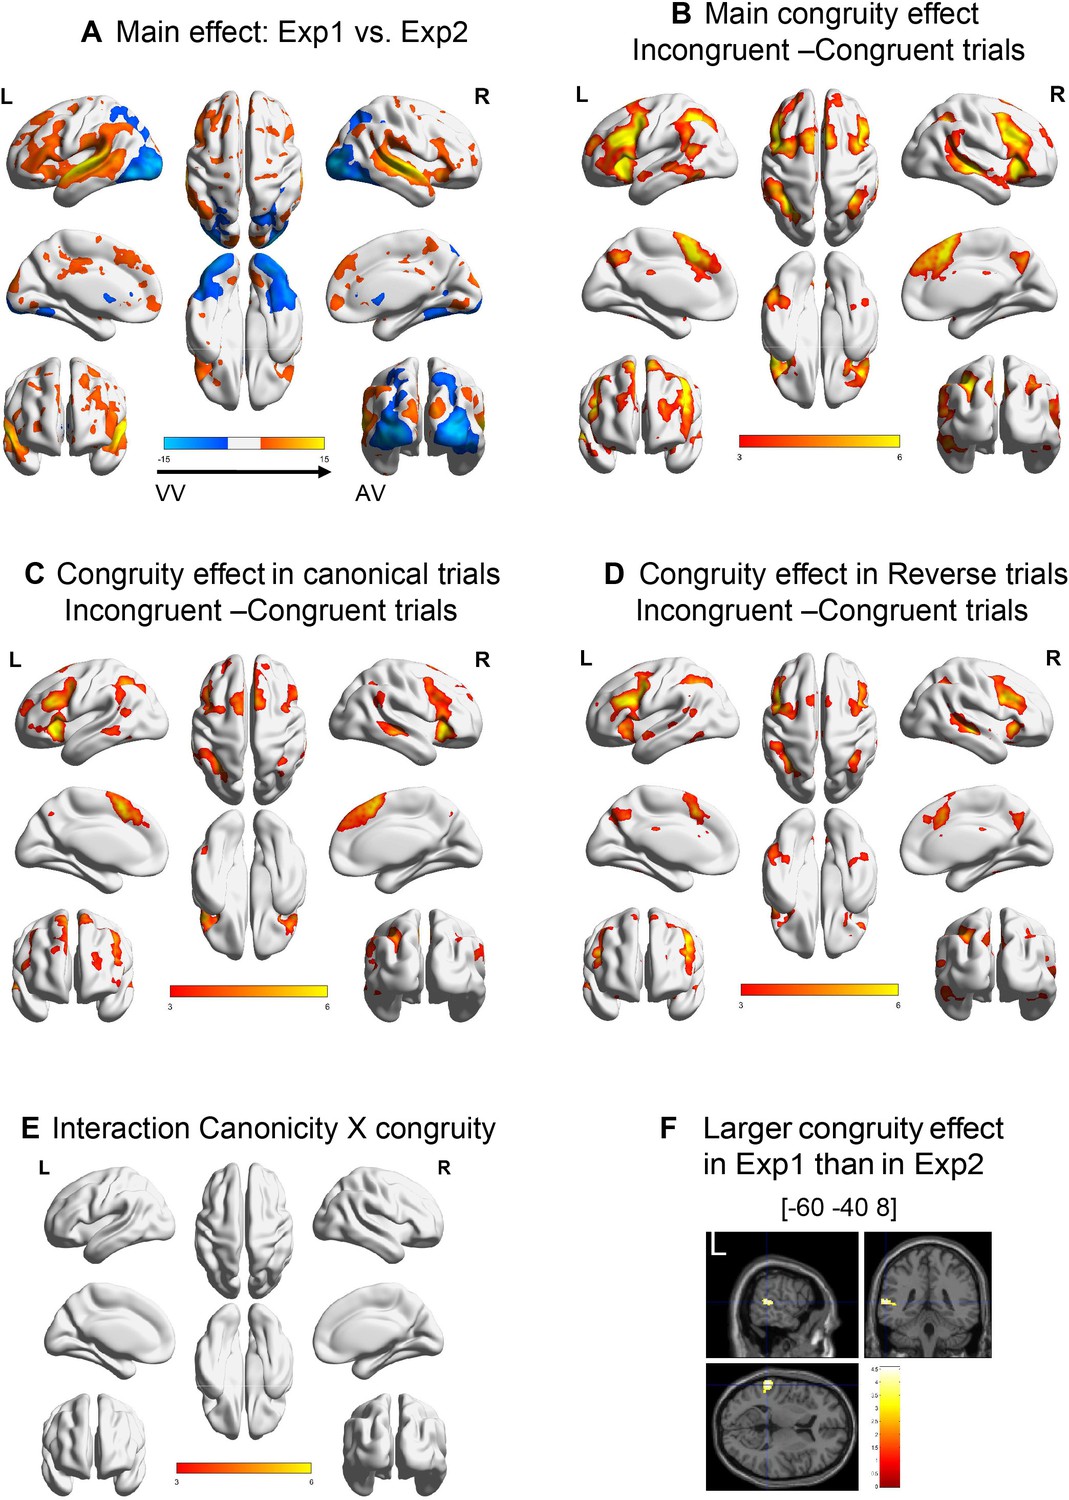
Analyses of all human participants in experiments 1 and 2 merged.
(A) Main effect of experiment. (B) Main effect of congruity. (C) Effect of congruity in the canonical trials and (D) in the reversed trials. (E) No significant cluster was observed for the interaction canonicity × congruity. (F) Slices in the three planes showing the only significant cluster in the experiment × congruity interaction. pvoxel < 0.001 and pcluster < 0.05 in all panels.
Figure 5
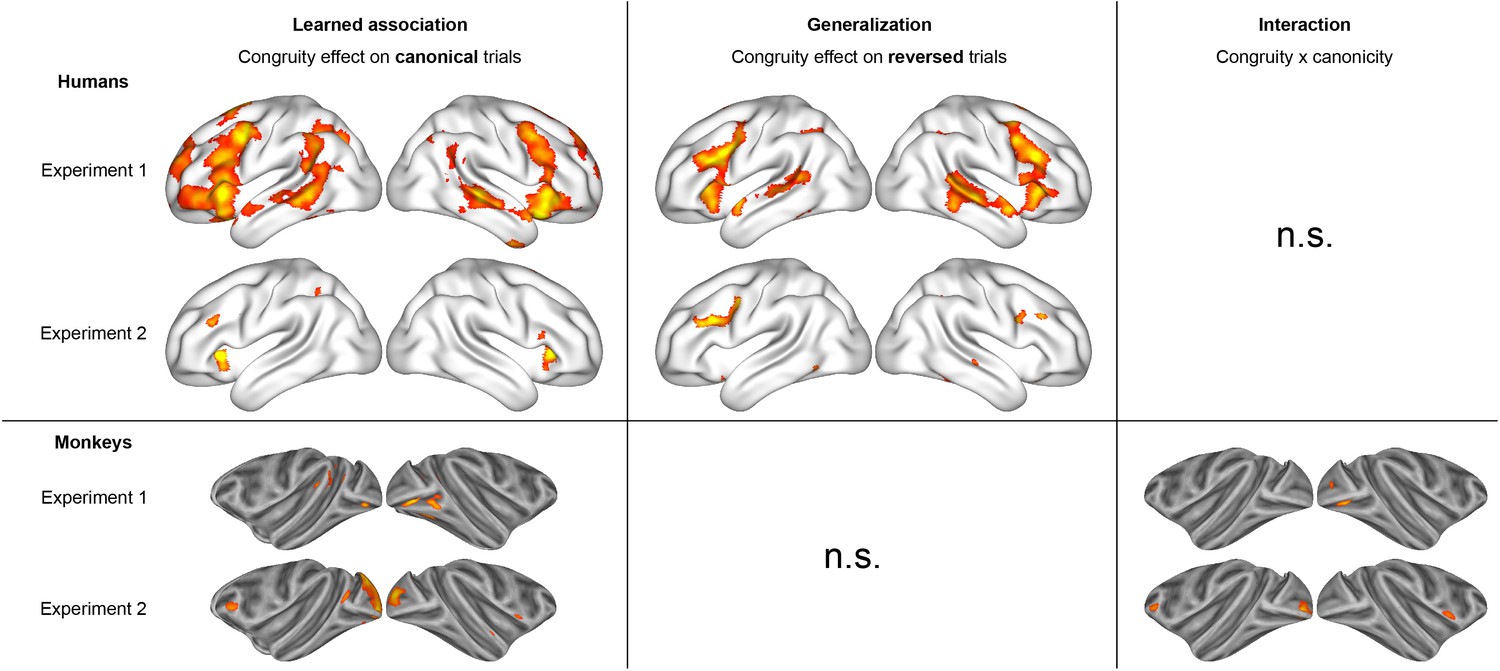
Summary of the two experiments in humans and monkeys.
(In experiment 1, pvoxel < 0.001 and pcluster < 0.05 for humans and monkeys. In experiment 2, pvoxel < 0.005 and cluster volume >50 in humans and pvoxel < 0.001 and cluster volume >50 in monkeys.).
Author response image 1

Tables
Table 1
Congruity effect in experiment 1 in 31 human subjects, with 1 imaging session per subject after 3 days of exposure to congruent canonical pairs.
The MNI coordinates indicate the location of the peak of all significant clusters in the main effect of congruity, after correction for multiple comparisons across the whole brain (corrected pcluster < 0.05). Additional t-values are provided at the same peak location for the canonical and reverse congruity effects. A star is added when the voxels belong to a cluster that achieves corrected-level significance (corrected pcluster < 0.05).
| Congruity effect (t-values) | ||||
|---|---|---|---|---|
| Region | MNI coordinates | Main | Canonical trials | Reversed trials |
| L sup frontal | –26 56 24 | 4.40* | 4.41* | 2.10* |
| L precentral | –36 6 32 | 5.75* | 3.57* | 7.50* |
| L triangularis | –48 16 2 | 7.65* | 5.45* | 6.08* |
| L insula | –40 22 0 | 7.76* | 5.84* | 6.27* |
| L temporal pole | –60 2 –10 | 6.56* | 3.95 | 5.71* |
| L ant STS | –62 –24 0 | 5.71* | 4.28* | 4.09* |
| L post STS | –54 –34 4 | 4.82* | 2.78* | 5.09* |
| L precuneus | –6 –68 40 | 4.68* | 4.72* | 3.39 |
| L inf parietal | –28 –58 42 | 5.85* | 3.97* | 4.56* |
| L caudate | –10 2 14 | 5.22* | 5.15* | 3.03* |
| L cerebellum | –6 –82 –34 | 5.59* | 3.98 | 3.27 |
| R mid frontal | 54 26 32 | 7.79* | 5.34* | 5.86* |
| R opercularis | 50 20 32 | 7.32* | 5.44* | 6.74* |
| R insula | 40 22 0 | 5.83* | 4.93* | 5.11* |
| R temporal pole | 60 4 –14 | 6.89* | 5.52* | 4.49* |
| R post STS | 48 –32 0 | 7.48* | 5.96* | 5.47* |
| R precuneus | 4 –62 40 | 6.36* | 5.16* | 2.88 |
| R inf parietal | 34 –64 44 | 5.14* | 3.57* | 4.49* |
| R caudate | 10 2 14 | 4.21* | 4.35* | 2.67* |
-
R: right; L: left; STS: superior temporal sulcus.
Table 2
Congruity effect in experiment 1 in two monkeys after two additional weeks of exposure to congruent canonical pairs.
Per subject, 3 stimulus sets were used, with 4 imaging sessions per stimulus set. The MNI coordinates indicate the location of the peak of all significant clusters for the canonical congruity contrast as well as the interaction between congruity and canonicity, after correction for multiple comparisons across the whole brain (corrected pcluster < 0.05). Other columns provide the other contrasts at the same peak location for reference. A star is added when the voxels belong to a cluster that achieves corrected-level significance (corrected pcluster < 0.05).
| Region | MNI coordinates | Congruity canonical | Congruity reversed | Congruity × canonicity |
|---|---|---|---|---|
| R V2, V4 | 17 –29 4 | 5.04* | –2.24 | 4.56* |
| L V2 | –18 –30 2 | 4.6* | –0.09 | 3.08 |
| R V4 | 21 –22 0 | 4.23* | –0.74 | 2.95 |
| L TPO | –20 –21 11 | 4.13* | 0.45 | 2.26 |
| L LGN | –8 –8 –5 | 0.46 | –4.27 | 3.98 |
-
R: right; L: left; TPO: temporo-parieto-occipital cortex; LGN: lateral geniculate nucleus.
-
For completeness, t-values are also given for non-significant clusters.
-
*
pcluster < 0.05.
Table 3
Congruity effect in experiment 2 in three monkeys after 3 days of exposure to congruent canonical pairs.
Per subject, five stimulus sets were used, with 1 imaging session per stimulus set. The MNI coordinates indicate the location of the peak of all significant clusters for the canonical congruity contrast as well as the interaction between congruity and canonicity, after correction for multiple comparisons across the whole brain (corrected pcluster < 0.05). Other columns provide the other contrasts at the same peak location for reference. A star is added when the voxels belong to a cluster that achieves corrected-level significance (corrected pcluster < 0.05).
| Region | MNI coordinates | Congruity canonical | Congruity reversed | Congruity × canonicity |
|---|---|---|---|---|
| L V1, V2 | –17 –36 1 | 5.18* | –2.64 | 4.82* |
| R V1, V2 | 15 –35 7 | 4.76* | 0.98 | 1.31 |
| L V4 | –23 –23 8 | 3.92* | 0.94 | 1.61 |
| L area 45A, 46v | –17 14 6 | 3.89* | –2.2 | 4.00* |
| R area 6/STS 6 | 22 6 –3 | 3.65* | –1.26 | 3.37* |
| L TPO | –8 –17 13 | 3.45* | 0.03 | 2.04 |
-
MNI coordinates and t-values of each significant cluster at the peak voxel. R: right; L: left; STS: superior temporal sulcus; TPO: temporo-parieto-occipital cortex.
-
For completeness, t-values are also given for non-significant clusters.
-
*
pcluster < 0.05.
Table 4
Congruity effect in experiment 2 in 23 human subjects, with 1 imaging session per subject after 3 days of exposure to congruent canonical pairs.
The MNI coordinates indicate the location of the peak of all significant clusters in the main effect of congruity, after correction for multiple comparisons across the whole brain (corrected pcluster < 0.05). Additional t-values are provided at the same peak location for the canonical and reverse congruity effects. A star (*) is added when the voxels belong to a cluster that achieves corrected-level significance (corrected pcluster < 0.05).
| Congruity effect (t-values) | ||||
|---|---|---|---|---|
| Region | MNI coordinates | Main | Canonical trials | Reversed trials |
| L triangularis | –44 30 24 | 5.34* | 3.64* | 3.91* |
| L operculum | –34 26 0 | 4.43* | 4.36* | 1.91 |
| L ant cingulaire | –8 18 42 | 4.52* | 3.25* | 3.13 |
| L suppl motor area | 2 20 52 | 3.79* | 3.95* | 1.40 |
| L precentral | –48 4 40 | 4.82* | 2.56 | 4.26* |
| L inf parietal | –30 –50 44 | 5.09* | 3.90* | 3.30* |
| L mid occipital | –28 –70 32 | 5.05* | 2.89 | 2.79 |
| L visual word form area | –50 –60 –12 | 4.43* | 2.62 | 3.64 |
| R sup frontal | 56 24 36 | 4.93* | 3.41* | 3.57* |
| R orbito frontal | 26 26 –16 | 5.05* | 1.92* | 5.22 |
| R operculum | 50 16 –2 | 3.58* | 2.96* | 2.11 |
| 48 10 28 | 4.74* | 2.20* | 4.39* | |
-
R: right; L: left; VWFA: visual word form area.
Table 5
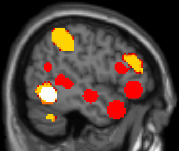
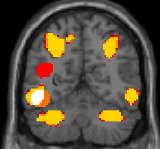
Region-of-interest (ROI) analyses of the language and mathematics localiser: F-values of ANOVAs performed on the averaged betas of the main task across different ROIs (main effect of congruity, canonicity, experiment (1 or 2), and interaction effect of congruity and canonicity, and congruity and experiment).
These ROIs correspond to the 10% best voxels selected in each participant thanks to an independent and short localiser, in regions commonly reported in the literature as activated in language and mathematical tasks. In this localiser, participants listened to and read short sentences of general content or requiring easy mental calculations. On the sagittal (x = −50 mm) and coronal (y = −58 mm) brain slices, the language and mathematical ROIs are presented as red and yellow areas, respectively. The left-lateralised white area corresponds to the visual word form area (VWFA); n = 52; df = 50.
 |  | Congruity | Canonicity | Experiment | Congruity × canonicity | Congruity × experiment |
|---|---|---|---|---|---|---|
| ROIs language | Temporal pole | 11.44† | <1 | 6.02‡ | <1 | <1 |
| Anterior STS | 5.41‡ | <1 | 42.31* | <1 | <1 | |
| Posterior STS | 18.70* | 1.31 | 50.75* | <1 | 17.01† | |
| Temporo-parietal junction | 20.81* | 1.85 | 9.39† | <1 | <1 | |
| IFG orbitalis | 22.47* | <1 | 11.40† | <1 | 1.64 | |
| IFG triangularis | 16.98* | <1 | 22.42* | <1 | 10.45‡ | |
| VWFA | 22.29* | <1 | 11.77† | <1 | <1 | |
| ROIs math | Left precentral BA44d | 29.71* | <1 | 4.1§ | <1 | <1 |
| Right precentral BA44d | 10.44* | 1.23 | <1 | 1.49 | <1 | |
| Left IPS | 27.4* | <1 | 1.81 | 1.77 | <1 | |
| Right IPS | 18.19* | 6.77 | 1.70 | 2.37 | 5.29 | |
| Left IT | 33.43* | <1 | 4.43§ | <1 | <1 | |
| Right IT | 5.41‡ | <1 | 7.76‡ | <1 | <1 | |
| Left cerebellum | 5.51‡ | <1 | <1 | <1 | 2.87 | |
| Right cerebellum | 19.20* | <1 | <1 | <1 | <1 |
-
STS: superior temporal sulcus; IFG: inferior frontal gyrus; IPS: intra-parietal sulcus; IT: inferior temporal.
-
*
pFDRcor < 0.001.
-
†
pFDRcor < 0.01.
-
‡
pFDRcor < 0.05.
-
§
pFDRcor < 0.1.
Author response table 1
Congruity effect for monkeys in Experiment 2 within the ROIs of the MDN (n=3).
Significance was assessed with one-sided one-sample t-tests.
| Congruity effect canonical trials | Congruity effect reversed trials | Interaction effect congruity X canonicity | |||||||
|---|---|---|---|---|---|---|---|---|---|
| region | t-values | p -values | FDR p-values | t-values | p-values | FDR p-values | t-values | p -values | FDR p-values |
| insular | 0.84 | 0.20 | 0.23 | -1.04 | 0.85 | 0.91 | 1.36 | 0.09 | 0.17 |
| lateral fissure | 1.67 | 0.05 | 0.19 | -0.28 | 0.61 | 0.91 | 1.25 | 0.11 | 0.17 |
| lateral frontal middle | 1.02 | 0.15 | 0.23 | -1.36 | 0.91 | 0.91 | 1.66 | 0.05 | 0.17 |
| lateral frontal anterior | 1.36 | 0.09 | 0.23 | -1.02 | 0.85 | 0.91 | 1.58 | 0.06 | 0.17 |
| lateral frontal posterior | 1.84 | 0.03 | 0.19 | -0.32 | 0.63 | 0.91 | 1.36 | 0.09 | 0.17 |
| anterior intraparietal | 1.19 | 0.12 | 0.23 | 0.38 | 0.35 | 0.91 | 0.43 | 0.33 | 0.44 |
| anterior cingular rostral | -0.23 | 0.59 | 0.59 | 0.99 | 0.16 | 0.82 | -0.89 | 0.81 | 0.81 |
| anterior cingular caudal | 0.86 | 0.19 | 0.23 | 0.83 | 0.20 | 0.82 | -0.19 | 0.58 | 0.66 |
Author response table 2
Congruity effect for humans in Experiment 2 within the ROIs of the MDN (n=23).
| Congruity effect | Congruity effect | Interaction Congruity X Canonicity | ||||||||||
|---|---|---|---|---|---|---|---|---|---|---|---|---|
| Main Congruity effect | Canonical trials | Reverse trials | ||||||||||
| F-val | p-val | FDR p-val | F -val | p-val | FDR p-val | F-val | p-val | FDR p-val | F -val | p-val | FDR p-val | |
| Insula | 6.04 | 0.022 | 0.051 | 11.68 | 0.002 | 0.014* | 1.27 | 0.27 | 0.31 | 1.86 | 0.19 | n.s |
| antMFG | <1 | n.s | n.s | 1.01 | 0.32 | 0.37 | <1 | n.s | n.s | <1 | n.s | n.s |
| postMFG | 8.53 | 0.008 | 0.028* | 9.25 | 0.006 | 0.019* | 5.11 | 0.034 | 0.12 | <1 | n.s | n.s |
| ipreCentral | 10.75 | 0.003 | 0.021* | 7.03 | 0.014 | 0.024* | 6.2 | 0.02 | 0.12 | <1 | n.s | n.s |
| SpreCentral | 3.05 | 0.094 | 0.11 | <1 | n.s | n.s | 1.75 | 0.2 | 0.28 | <1 | n.s | n.s |
| Intra-parietal sulcus | 4.23 | 0.051 | 0.071 | 3.7 | 0.067 | 0.094 | 1.97 | 0.17 | 0.28 | <1 | n.s | n.s |
| Anterior Cingulate | 5.44 | 0.029 | 0.051 | 8.43 | 0.008 | 0.019* | 1.72 | 0.2 | 0.28 | <1 | n.s | n.s |
Additional files
Download links
A two-part list of links to download the article, or parts of the article, in various formats.
Downloads (link to download the article as PDF)
Open citations (links to open the citations from this article in various online reference manager services)
Cite this article (links to download the citations from this article in formats compatible with various reference manager tools)
Brain areas for reversible symbolic reference, a potential singularity of the human brain
eLife 12:RP87380.
https://doi.org/10.7554/eLife.87380.3


