The acetylase activity of Cdu1 regulates bacterial exit from infected cells by protecting Chlamydia effectors from degradation
- Department of Integrative Immunobiology, Duke University, United States
- Department of Molecular Genetics and Microbiology, Duke University, United States
- Deparment of Molecular Biology, Umeå University, Sweden
- The Laboratory for Molecular Infection Medicine Sweden (MIMS), Umeå University, Sweden
- Umeå Centre for Microbial Research (UCMR), Umeå University, Sweden
- Department of Molecular Microbiology & Immunology, Oregon Health & Science University, United States
Figures
Figure 1 with 4 supplements
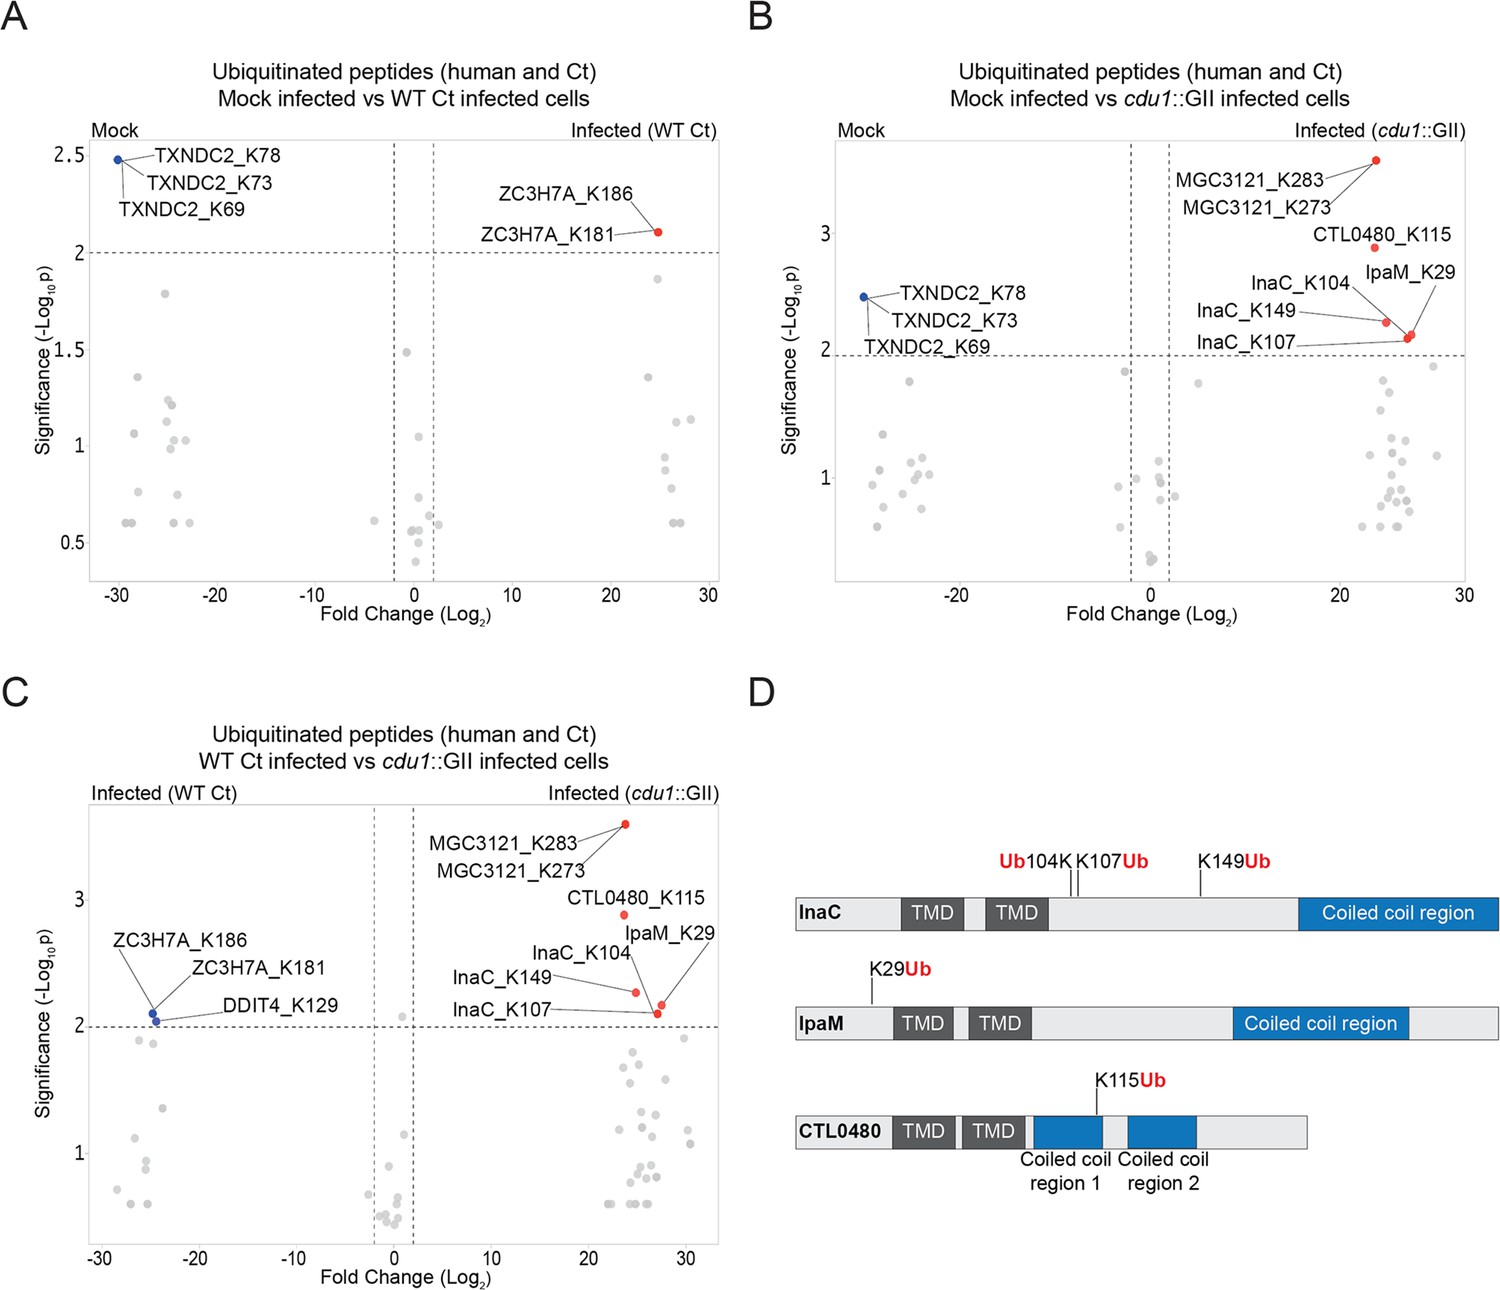
The C. trachomatis inclusion membrane proteins InaC, IpaM, and CTL0480 are ubiquitinated in the absence of Cdu1.
(A–C) Volcano plots (pairwise comparisons) of the relative abundance of human and Ct ubiquitinated peptides.(A) Mock infected HeLa cells versus HeLa cells infected with WT Ct (L2 434 Bu pBOMB) (24 hpi). (B) Mock infected HeLa cells versus HeLa cells infected with a cdu1 null strain (cdu1::GII pBOMB) (24 hpi) (C) HeLa cells infected with WT Ct (24 hpi) versus HeLa cells infected with a cdu1 null strain (24 hpi). Significance values were interpolated from 3 independent biological replicates. Ubiquitinated proteins were enriched with magnetic TUBE1 beads (binds to polyubiquitinated proteins) and peptides identified by quantitative LC MS/MS analysis. Three Ct inclusion membrane proteins, InaC, IpaM, and CTL0480 were differentially ubiquitinated in the absence of Cdu1. (D) InaC was ubiquitinated at K104, K107, and K149, IpaM at K290, and CTL0480 at K115 in the absence of Cdu1. TMD: Transmembrane domain. Numbering corresponds to amino acids in the protein sequence of each respective inclusion membrane protein.
-
Figure 1—source data 1
Excel file containing MaxQuant intensity values used to generate volcano plots in Figure 1A–C.
- https://cdn.elifesciences.org/articles/87386/elife-87386-fig1-data1-v1.zip
Figure 1—figure supplement 1
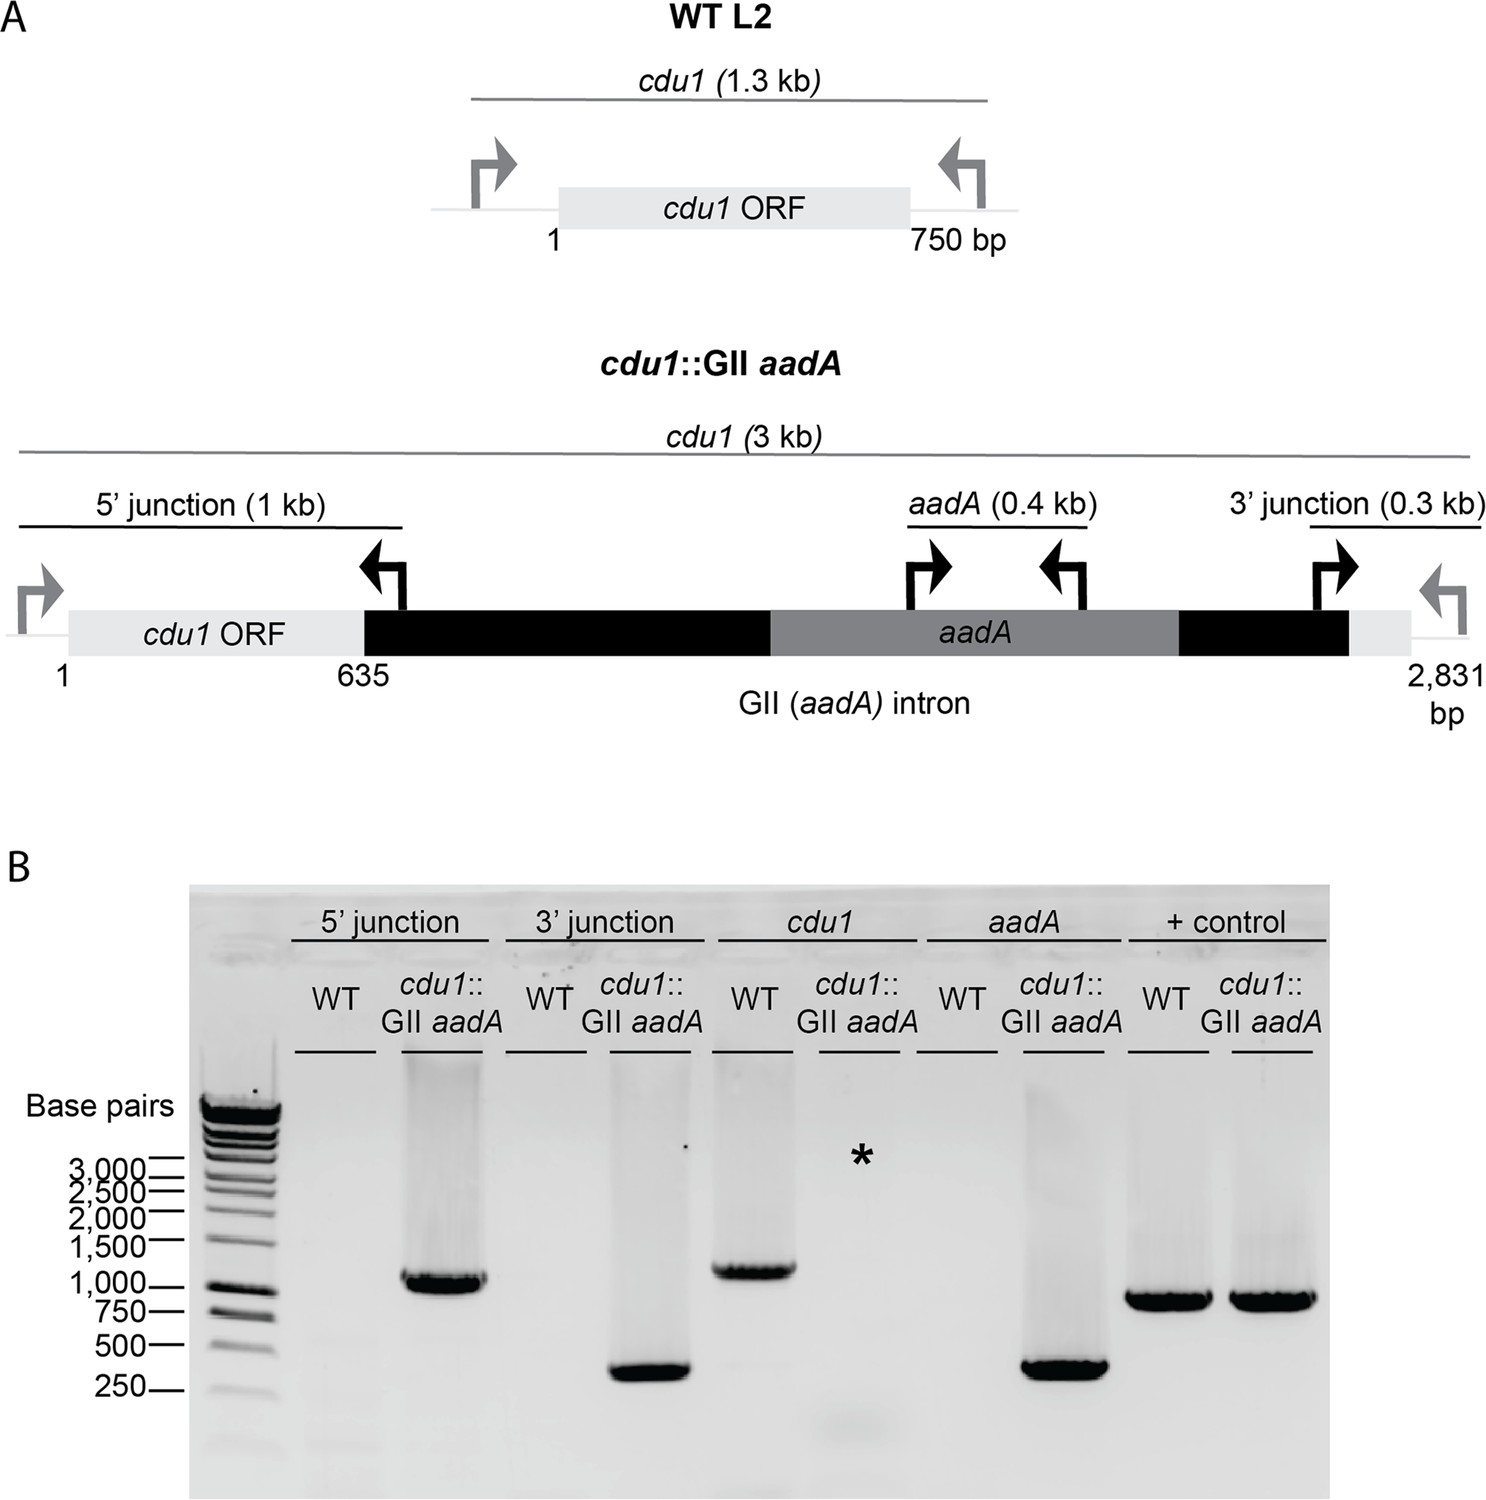
TargeTron mediated disruption of the L2 cdu1 ORF.
(A) Depiction of the cdu1 ORFs in WT L2 and cdu1::GII strains with corresponding diagnostic PCR amplicons. (B) PCR analysis of the disrupted cdu1 ORF in the cdu1::GII strain. *Amplification of cdu1 ORF in cdu1::GII strain was unsuccessful due to size of amplicon. + control: WT cdu2.
Figure 1—figure supplement 2
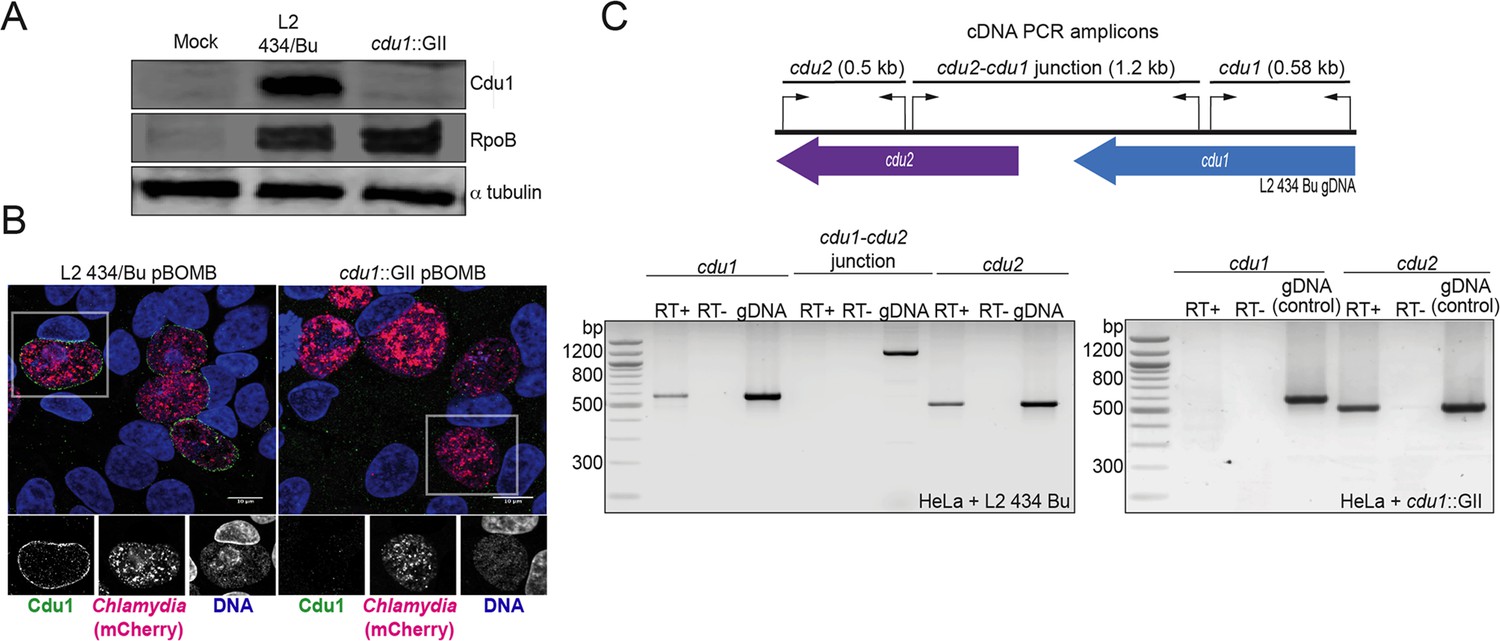
Generation of a cdu1 null strain in C. trachomatis (L2).
(A) Western blot analysis of protein lysates derived from HeLa cells infected with a Ct L2 434 Bu parental strain (L2) and an L2 cdu1::GII aadA (cdu1::GII) strain for 24 hr. Blots were probed with antibodies raised against recombinant Cdu1 (amino acids 71–401), Ct RpoB (bacterial RNA polymerase), and human αtubulin. (B) HeLa cells infected with L2 transformed with pBOMB4-MCI empty vector (L2 pBOMB) and cdu1::GII transformed with empty pBOMB4-MCI (cdu1::GII pBOMB) were fixed at 24 hpi and stained with Cdu1 antisera. Cdu1 signal is depicted in green, Ct cells expressing mCherry (encoded in pBOMB4-MCI vector) are shown in red, and DNA stained with Hoechst in blue. Scale bar: 10 μm. (C) Total RNA isolated from HeLa cells infected with L2 and cdu1::GII strains for 24 hr was used to synthesize cDNAs which served as templates for PCR analysis of cdu1, cdu2, and cdu1-cdu2 bicistronic expression. RT+: Total RNA +reverse transcriptase. RT-: Total RNA without reverse transcriptase. gDNA: Genomic DNA.
-
Figure 1—figure supplement 2—source data 1
Original files used for western blot analysis shown in Figure 1—figure supplement 2A (anti-Cdu1, anti-RpoB, and anti-α-tubulin).
- https://cdn.elifesciences.org/articles/87386/elife-87386-fig1-figsupp2-data1-v1.zip
-
Figure 1—figure supplement 2—source data 2
Files containing original scans of western blot analysis shown in Figure 1—figure supplement 2A (anti-Cdu1, anti-RpoB, and anti-α-Tubulin) with sample labels and highlighted bands.
- https://cdn.elifesciences.org/articles/87386/elife-87386-fig1-figsupp2-data2-v1.zip
Figure 1—figure supplement 3
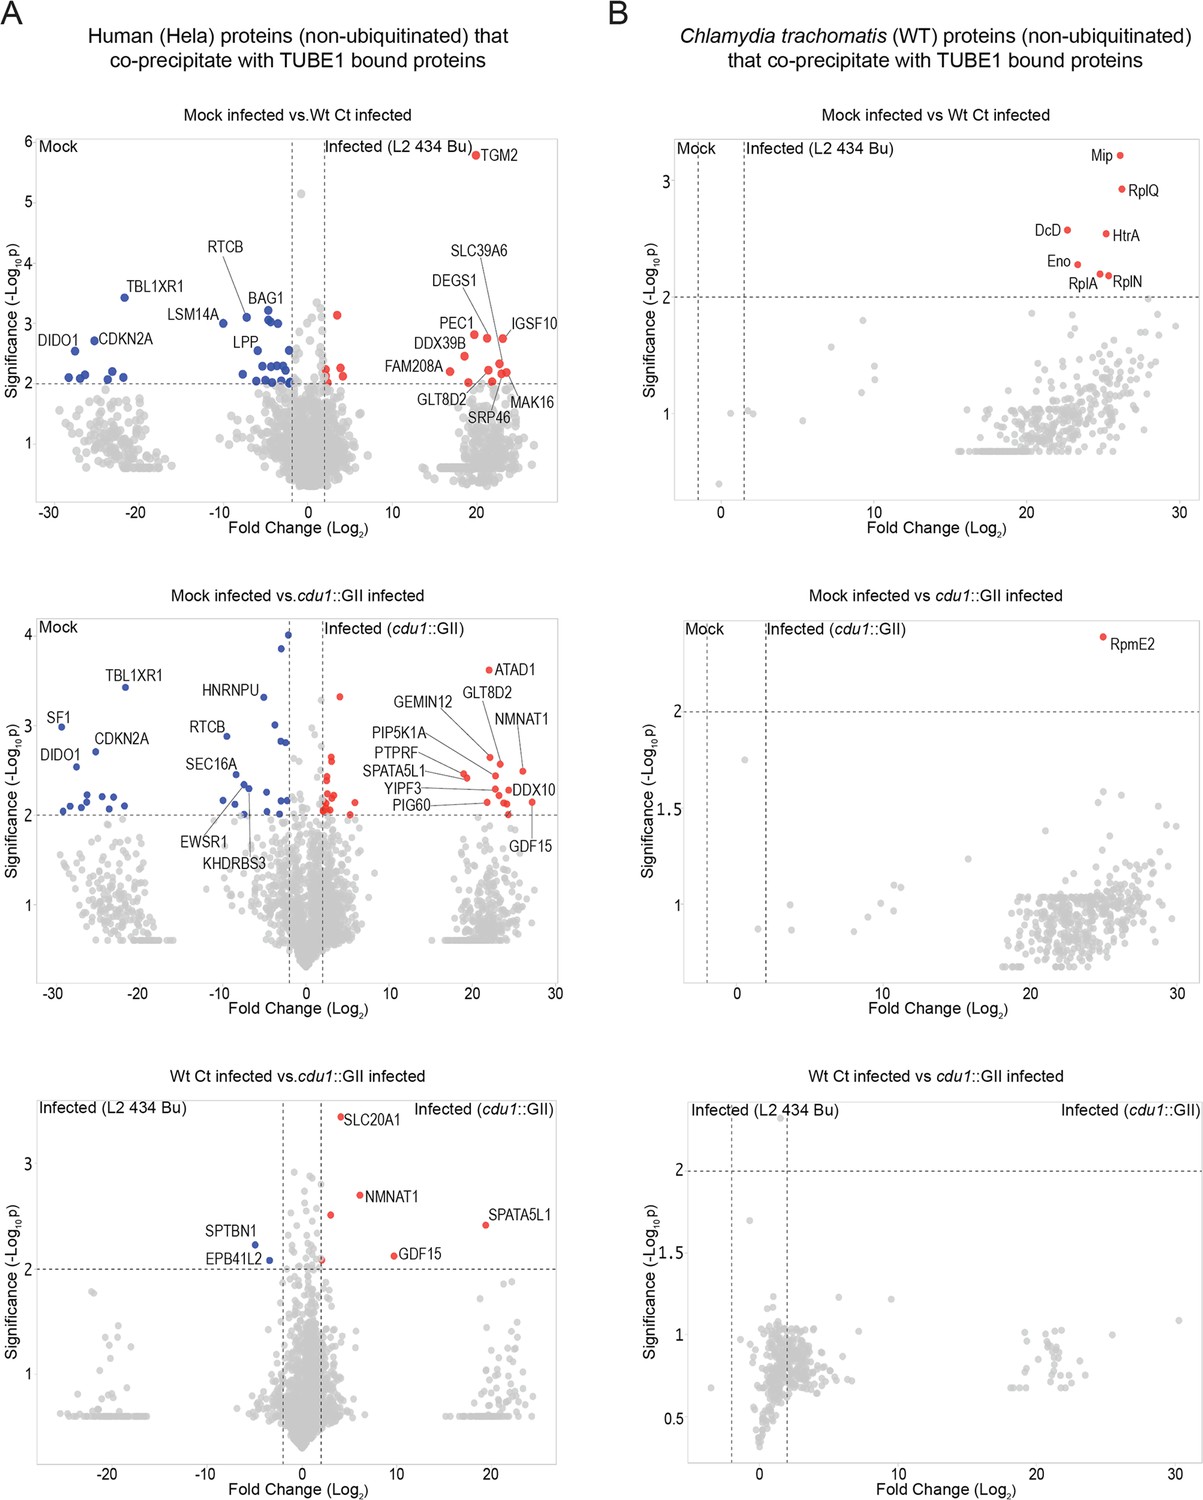
Proteins co-precipitating (non ubiquitinated) with human and Ct proteins enriched by TUBE1 pulldowns.
(A) Volcano plots (pairwise comparisons) of human proteins (non-ubiquitinated) that co-precipitate with TUBE1-bound proteins in mock infected HeLa cells and HeLa cells infected with L2 or cdu1 null strains (24 hpi). (B) Volcano plots (pairwise comparisons) of Ct TUBE1 co-precipitating proteins (non-ubiquitinated) identified in mock infected HeLa cells and HeLa cells infected with L2 or cdu1 null strains (24 hpi).
-
Figure 1—figure supplement 3—source data 1
Excel file containing MaxQuant intensity values used to generate volcano plots in panels A and B.
- https://cdn.elifesciences.org/articles/87386/elife-87386-fig1-figsupp3-data1-v1.zip
Figure 1—figure supplement 4
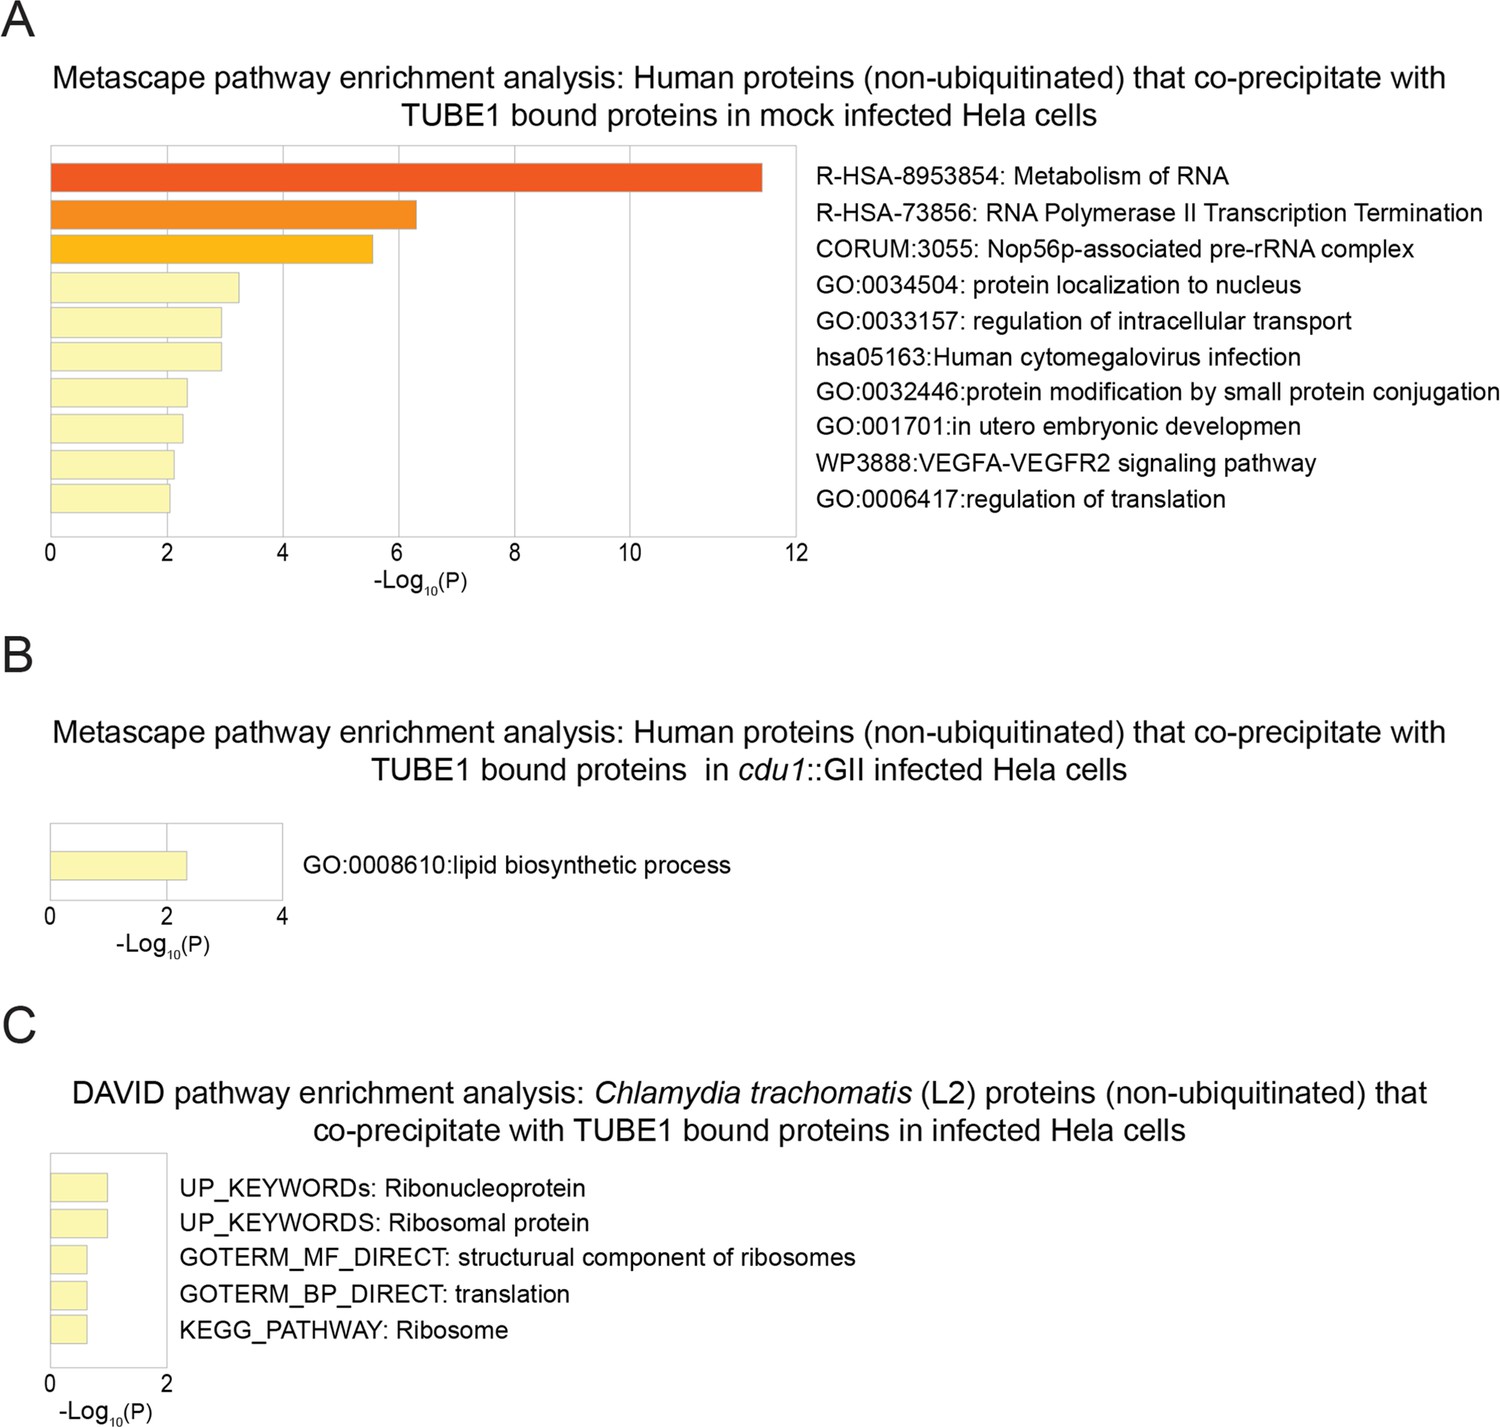
Pathway enrichment analysis of human and Ct proteins that co-precipitate (non ubiquitinated) with TUBE1-bound proteins.
(A) Metascape functional enrichment analysis of human co-precipitating proteins in mock infected HeLa cells. (B) Metascape functional enrichment analysis of human co-precipitating proteins in cdu1 null infected HeLa cells. (C) DAVID pathway enrichment analysis of Ct co-precipitating proteins enriched in infected (L2 and cdu1 null) HeLa cells.
-
Figure 1—figure supplement 4—source data 1
Excel file with Metascape compiled GO clusters and associated p-values for GO analysis of human co-precipitating proteins in mock-infected Hela cells (panel A).
- https://cdn.elifesciences.org/articles/87386/elife-87386-fig1-figsupp4-data1-v1.zip
-
Figure 1—figure supplement 4—source data 2
Excel file with Metascape compiled GO clusters and associated p-values for GO analysis of human co-precipitating proteins in cdu1 null infected HeLa cells (panel B).
- https://cdn.elifesciences.org/articles/87386/elife-87386-fig1-figsupp4-data2-v1.zip
Figure 2
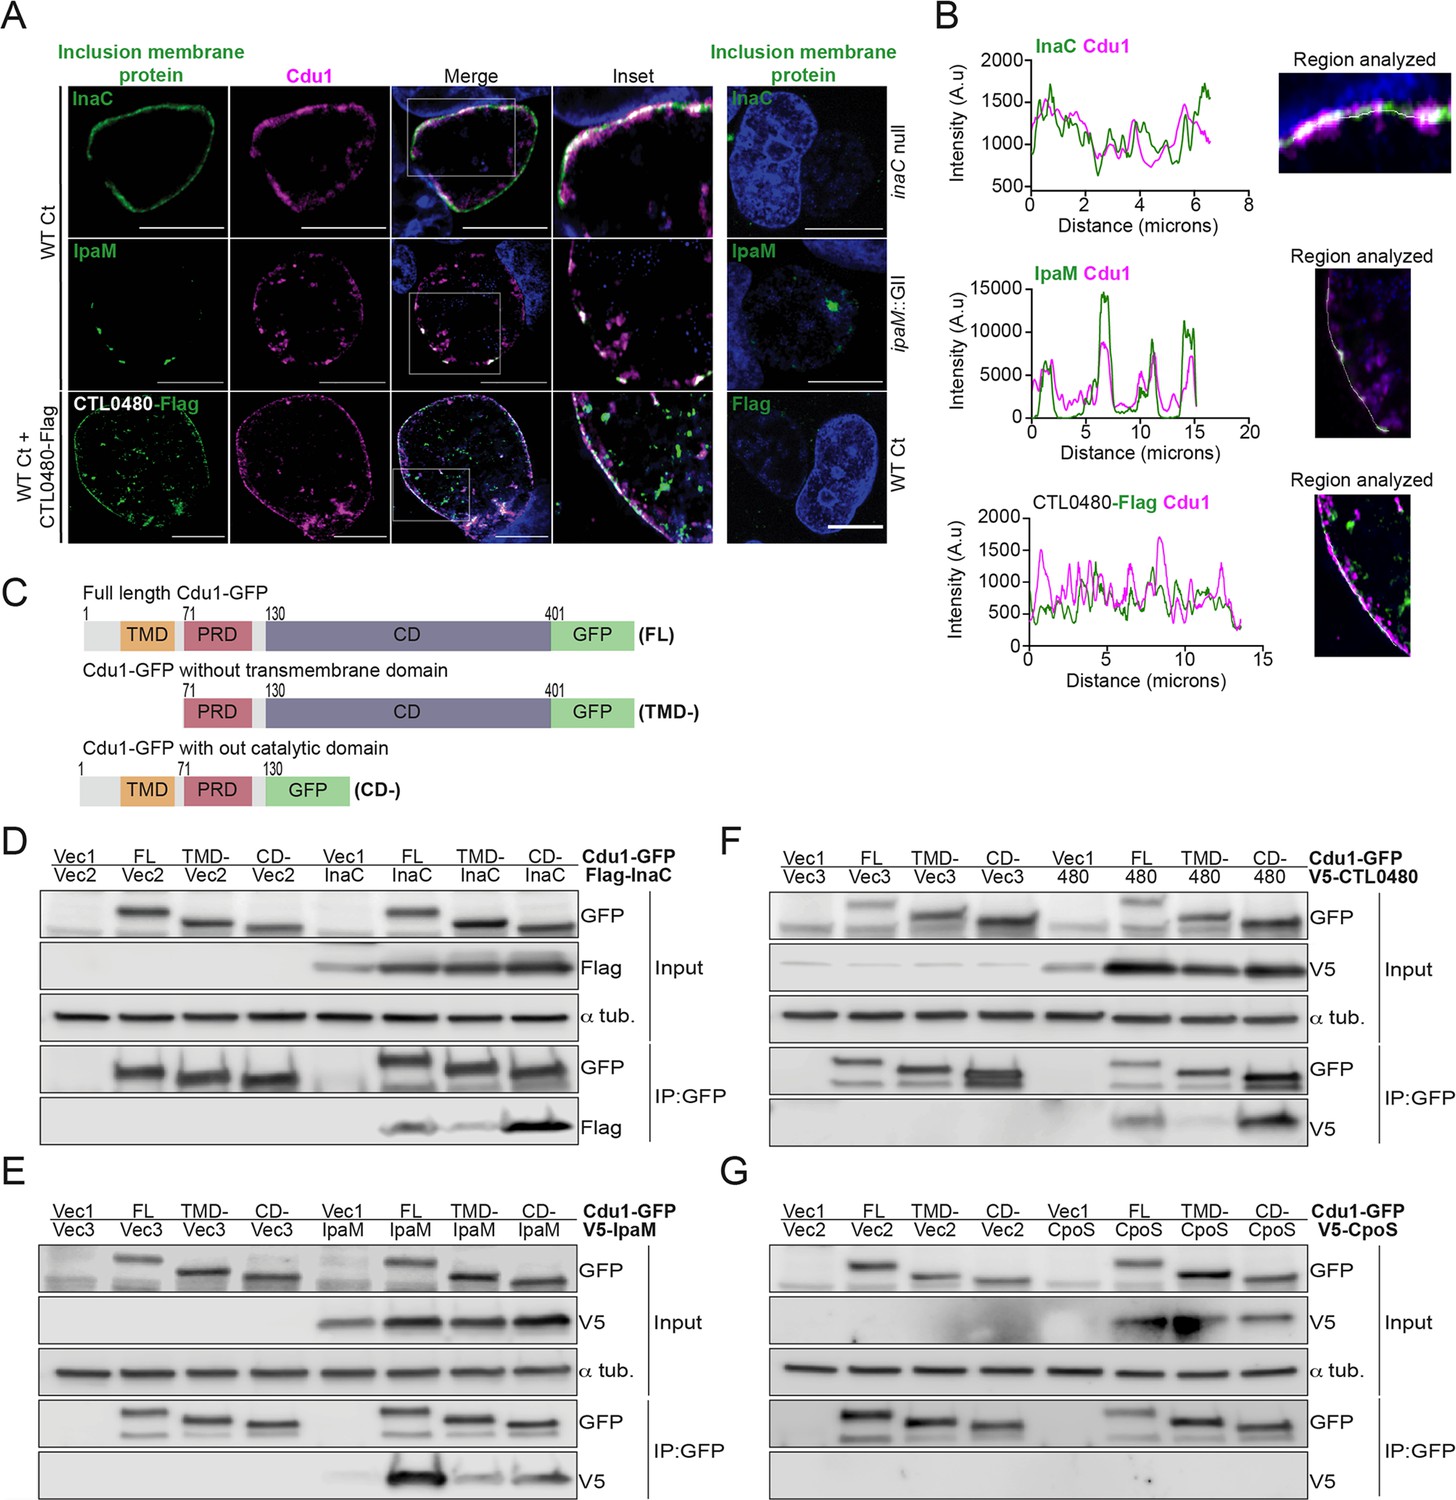
Cdu1 associates with InaC, IpaM, and CTL0480.
(A) Co-localization of Cdu1(magenta) with endogenous InaC (green), IpaM (green), and ectopically expressed CTL0480-Flag (green) at the Ct (L2) inclusion membrane of HeLa cells infected for 24 hr. HeLa cells infected with an inaC null strain (M407), an ipaM null strain (ipaM::GII), and WT Ct (L2 434 Bu pBOMB) were used as controls for antibody specificity. DNA stained with Hoechst is shown in blue. Scale bar: 10 μm. Images are representative of multiple images captured across three independent replicates. (B) Line scan profiles of fluorescent signal intensities displayed in (A) showing co-localization of fluorescence intensities for endogenous Cdu1 with endogenous InaC and IpaM, and with CTL0480-Flag along the L2 inclusion membrane. (C) Schematic of Cdu1-GFP(C) (L2) fusion (Cdu1-GFP) and Cdu1-GFP variants used in co-transfections of HEK 293 cells. GFP: Green fluorescent protein. TMD: Transmembrane domain. PRD: Proline rich domain. CD: Catalytic domain. FL: Full length. TMD-: Cdu1-GFP variant lacking TMD domain. CD-: Cdu1-GFP variant lacking CD domain. (D–G) Western blot analysis of GFP immunoprecipitates from HEK 293 cells co-transfected with mammalian plasmids expressing: Cdu1-GFP variants and (D) truncated 3XFlag(N)-InaC (D/UW-3/CX CT813, amino acids 96–264), (E) V5(N)-IpaM (L2, full length), (F) V5(N)-CTL0480 (L2, full length), and (G) V5(N)-CpoS (L2, full length). Vec1: Empty pOPINN-GFP vector. Vec2: Empty pDEST53 vector. Vec3: Empty pcDNA3.1/nV5-DEST vector. Western blot images are representative from two independent experiments.
-
Figure 2—source data 1
Excel files with pixel intensity values for generating line scan profiles in Figure 2B.
- https://cdn.elifesciences.org/articles/87386/elife-87386-fig2-data1-v1.zip
-
Figure 2—source data 2
Original western blot scans used to generate Figure 2D (anti-GFP [input], anti-Flag [input], anti-α-tubulin [input], anti-GFP [IP:GFP], and anti-Flag [IP:GFP]).
- https://cdn.elifesciences.org/articles/87386/elife-87386-fig2-data2-v1.zip
-
Figure 2—source data 3
Original western blot scans with labeled samples and highlighted bands for Figure 2D.
- https://cdn.elifesciences.org/articles/87386/elife-87386-fig2-data3-v1.zip
-
Figure 2—source data 4
Original western blot scans used to generate Figure 2E (anti-GFP [input], anti-V5 [input], anti-α-tubulin [input], anti-GFP [IP:GFP], and anti-V5 [IP:GFP]).
- https://cdn.elifesciences.org/articles/87386/elife-87386-fig2-data4-v1.zip
-
Figure 2—source data 5
Original western blot scans with labeled samples and highlighted bands for Figure 2E.
- https://cdn.elifesciences.org/articles/87386/elife-87386-fig2-data5-v1.zip
-
Figure 2—source data 6
Original western blot scans used to generate Figure 2F (anti-GFP [input], anti-V5 [input], anti-α-tubulin [input], anti-GFP [IP:GFP], and anti-V5 [IP:GFP]).
- https://cdn.elifesciences.org/articles/87386/elife-87386-fig2-data6-v1.zip
-
Figure 2—source data 7
Original western blot scans with labeled samples and highlighted bands for Figure 2F.
- https://cdn.elifesciences.org/articles/87386/elife-87386-fig2-data7-v1.zip
-
Figure 2—source data 8
Original western blot scans used to generate Figure 2G (anti-GFP [input], anti-V5 [input], anti-α-tubulin [input], anti-GFP [IP:GFP], and anti-V5 [IP:GFP]).
- https://cdn.elifesciences.org/articles/87386/elife-87386-fig2-data8-v1.zip
-
Figure 2—source data 9
Original western blot scans with labeled samples and highlighted bands for Figure 2G.
- https://cdn.elifesciences.org/articles/87386/elife-87386-fig2-data9-v1.zip
Figure 3 with 1 supplement
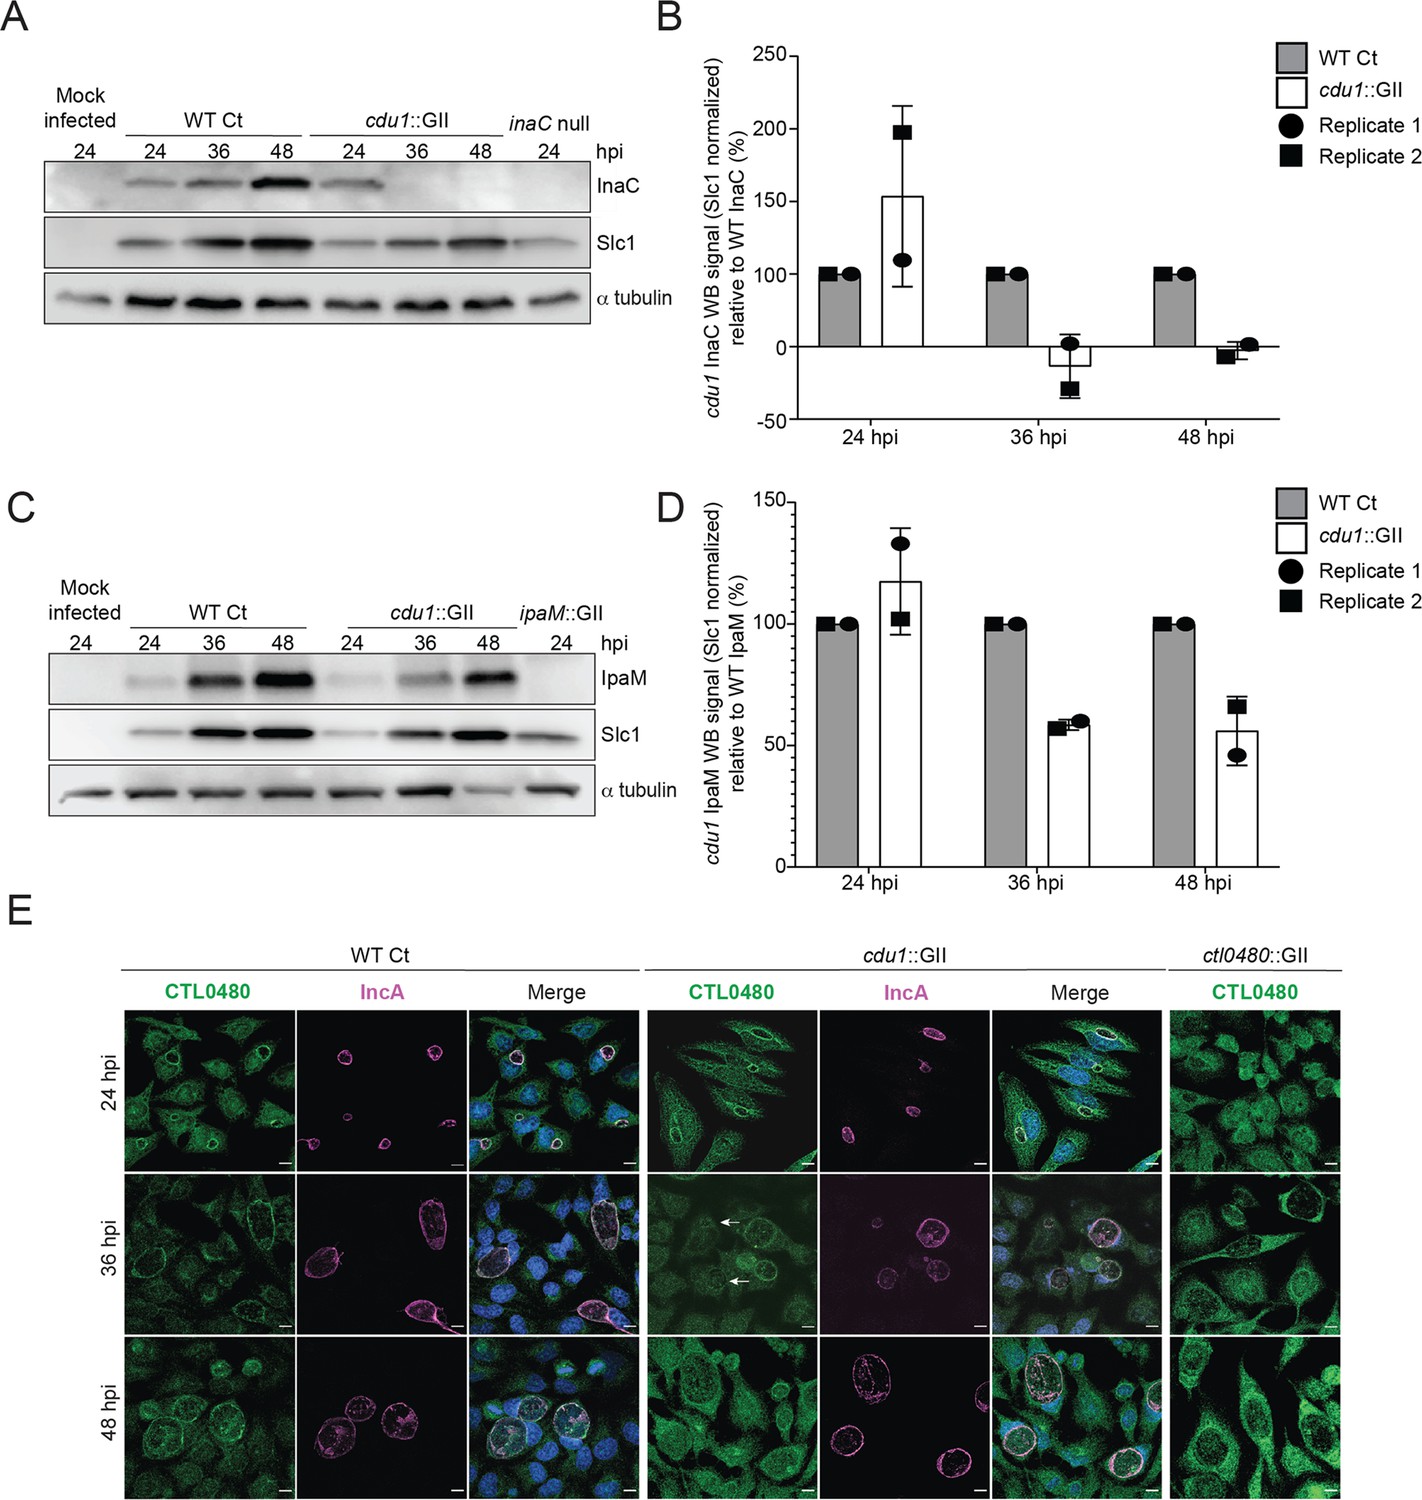
Cdu1 stabilizes InaC, IpaM, and CTL0480.
(A) Western blot analysis of endogenous InaC in HeLa cells infected for 24, 36, and 48 hr with Wt Ct (L2 pBOMB), cdu1 null (cdu1::GII pBOMB), and inaC null (M407) strains. Ct Slc1 and human alpha tubulin were used to determine Ct burdens and equal loading of protein extracts respectively. Western blot images are representative of 2 independent experiments. (B) Quantification of InaC abundance (InaC western blot signal from (A)) normalized to Slc1 western blot signal (from panel A) in HeLa cells infectedwith a cdu1 null strain, relative to normalized InaC abundance in HeLa cells infected with Wt Ct. Error bars depict standard deviation. (C) Western blot analysis of endogenous IpaM in HeLa cells infected for 24, 36, and 48 hr with Wt Ct, cdu1 null, and ipam null (ipam::GII) strains. Western blot images are representative of two independent experiments. (D) Quantification of normalized IpaM abundance from (C) in HeLa cells infectedwith a cdu1 null strain, relative to normalized IpaM abundance in HeLa cells infected with Wt Ct. Error bars depict standard deviation. (E) Localization of CTL0480 during Ct infection of HeLa cells at 24, 36, and 48 hpi. CTL0480 signal (green) co-localizes with the inclusion membrane protein IncA (magenta) at the Ct inclusion membrane. Arrowheads highlight cdu1 null inclusions lacking CTL0480 at 36 hpi. DNA stained with Hoechst is shown in blue. Scale bar: 10 μm. Quantification of CTL0480 localization at inclusion membranes can be found in Figure 3—figure supplement 1.
-
Figure 3—source data 1
Original western blot scans used to generate Figure 3A (anti-InaC, anti-Slc1, and anti-α-tubulin).
- https://cdn.elifesciences.org/articles/87386/elife-87386-fig3-data1-v1.zip
-
Figure 3—source data 2
Original western blot scans with labeled samples and highlighted bands for Figure 3A.
- https://cdn.elifesciences.org/articles/87386/elife-87386-fig3-data2-v1.zip
-
Figure 3—source data 3
Excel file containing densitometry data for Figure 3B.
- https://cdn.elifesciences.org/articles/87386/elife-87386-fig3-data3-v1.zip
-
Figure 3—source data 4
Original western blot scans used to generate Figure 3C (anti-IpaM, anti-Slc1, and anti-α-tubulin).
- https://cdn.elifesciences.org/articles/87386/elife-87386-fig3-data4-v1.zip
-
Figure 3—source data 5
Original western blot scans with labeled samples and highlighted bands for Figure 3C.
- https://cdn.elifesciences.org/articles/87386/elife-87386-fig3-data5-v1.zip
-
Figure 3—source data 6
Excel file containing densitometry data for Figure 3D.
- https://cdn.elifesciences.org/articles/87386/elife-87386-fig3-data6-v1.zip
Figure 3—figure supplement 1
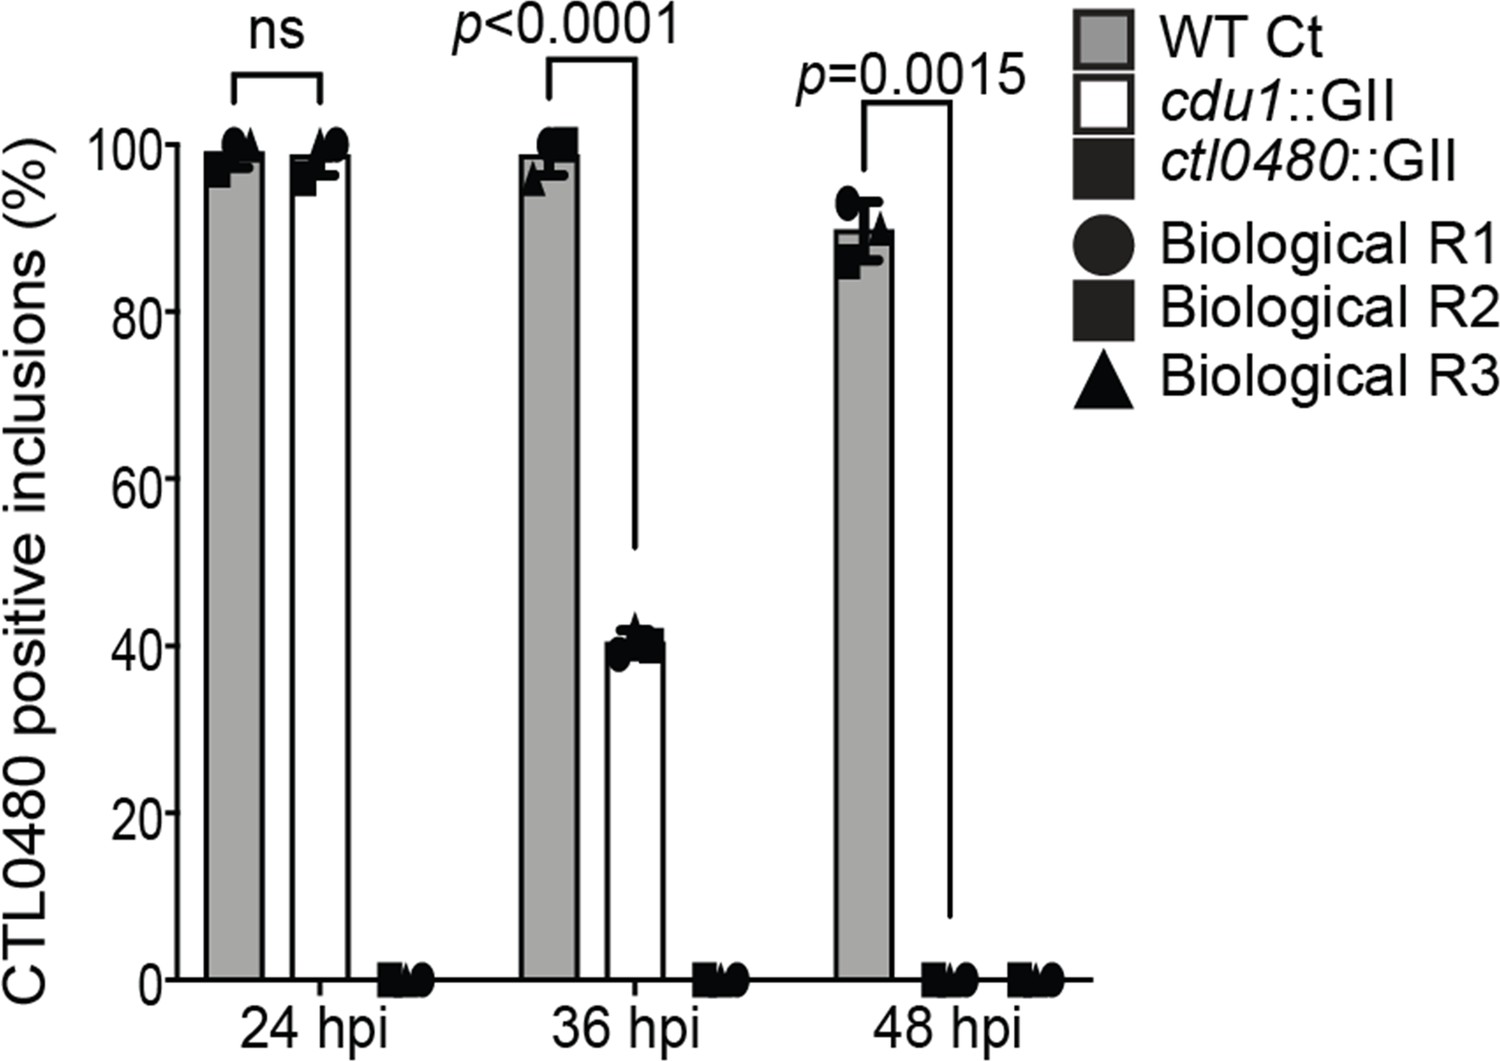
Quantification of CTL0480 at Ct inclusion membranes.
Quantification of CTL0480 localization at Ct inclusion membranes as shown in Figure 3E. CTL0480 fluorescent signal was used to determine the percent of inclusions displaying CTL0480 at the inclusion membranes. Representative images and quantification of CTL0480-positive inclusions are derived from Ct inclusions imaged in 10 fields across 3 independent biological replicates. Error bars depict standard deviation. p values were determined by a student paired t-test. For cells infected with WT Ct (sum across 3 replicates) n=297 inclusions at 24 hpi , n=296 inclusions at 36 hpi , and n=269 inclusions at 48 hpi. For cells infected with cdu1::GII (sum across 3 replicates) n=296 inclusions at 24 hpi, n=121 inclusions at 36 hpi, and n=254 at 48 hpi. For cells infected with ctl0480::GII (sum across 3 replicates) n=252 inclusions at 24 hpi , n=214 inclusions at 36 hpi , and n=239 inclusions at 48 hpi.
-
Figure 3—figure supplement 1—source data 1
Excel files with numerical data for quantifying CTL0480 localization to WT and cdu1::GII inclusions.
- https://cdn.elifesciences.org/articles/87386/elife-87386-fig3-figsupp1-data1-v1.zip
Figure 4
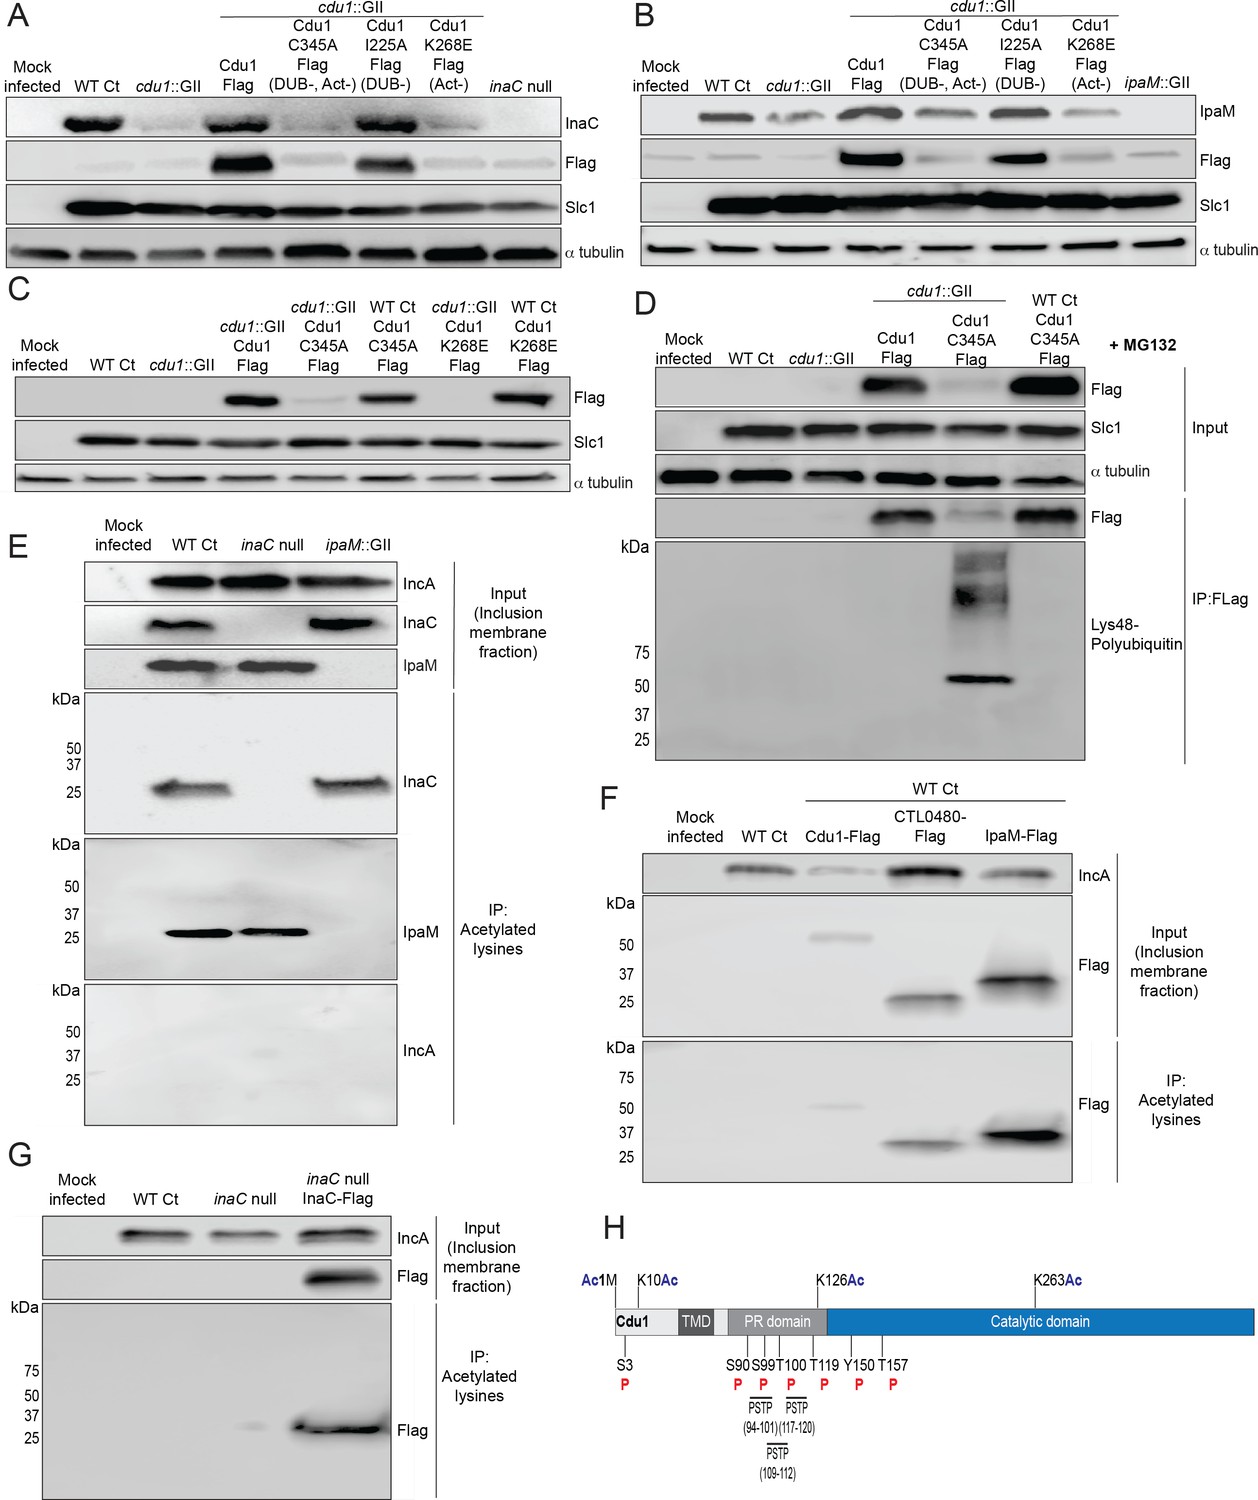
The acetylase activity of Cdu1 is required to stabilize Cdu1, InaC, and IpaM.
(A) Western blot analysis of endogenous InaC and Cdu1-Flag catalytic variants expressed from a plasmid (pBOMB). HeLa cells were infected for 36 hr with WT Ct (L2 434 Bu pBOMB), a cdu1 null strain (cdu1::GII pBOMB), and cdu1 null strains expressing wild type Cdu1-Flag and the Cdu1 variants C345A-Flag (catalytic inactive), I225A-Flag (DUB deficient), and K268E-Flag (Act deficient). Cdu1-Flag variants were expressed from a pBOMB shuttle plasmid. Protein lysates from HeLa cells infected with an inaC null (M407) strain were used to control for the specificity of anti-InaC antibodies. Western blot images are representative of two independent experiments. (B) Western blot analysis of endogenous IpaM and Cdu1-FLAG variants in crude extracts of HeLa cells infected for 48 hr with the same strains as describe in (A). Infection of HeLa cells with ipaM::GII was used to test for the specificity of the anti-IpaM antibody. Western blot images are representative of two independent experiments. (C) Western blot analysis of Cdu1C345A-Flag (catalytic inactive) and Cdu1K268E-Flag (Act deficient) expressed in a cdu1 null strain or WT Ct (L2 434 Bu) background after infection of HeLa cells for 24 hr. Both Cdu1 variants are stabilized by Cdu1 expressed in WT Ct. (D) Western blot analysis of Cdu1-Flag and Cdu1C345A-Flag expressed in a cdu1 null strain and Cdu1C345A-Flag expressed in WT Ct (L2 434 Bu) following immunoprecipitation (anti-Flag) from HeLa cell extracts after infection for 24 hr and treatment with MG132 (25 μM, 5 hr). Western blot image is a representative blot from at least three independent experiments. (E) Western blot analysis of endogenous InaC and IpaM following immunoprecipitation of inclusion membrane enriched subcellular fractions (24hpi) with anti-acetylated lysine antibodies. Western blot image is representative of two independent experiments. (F) Western blot analysis (Flag WB) of acetylated lysine immunoprecipitates generated from inclusion membrane enriched subcellular fractions (40 hpi) derived from HeLa cells infected with WT Ct strains expressing Cdu1-Flag, CTL0480-Flag, or IpaM-Flag. Western blot image is representative of two independent experiments. (G) WB of acetylated lysine immunoprecipitates of inclusion membrane enriched fractions (24 hpi) of HeLa cells infected with WT Ct and with an inaC null strain (M407) expressing InaC-Flag. Western blot image is representative of two independent experiments. (H) The initiator methionine, Lys10, Lys126, and Lys263 of Cdu1 are acetylated by 24 hpi. One tyrosine (Y) residue and multiple serine (S) and threonine (T) residues in Cdu1 are also phosphorylated during Ct infection of HeLa cells (24 hpi). Three PX(S/T)P MAPK phosphorylation consensus sequence motifs were identified in the proline rich domain of Cdu1. Modified residues were identified by quantitative LC MS/MS analysis of immunoprecipitated Cdu1-Flag across three independent biological replicates. TMD: Transmembrane domain. PR: Proline rich. PSTP: PX(S/T)P motifs. Ac: Acetylation. P: Phosphorylation. Numbering corresponds to amino acids in Cdu1 protein sequence.
-
Figure 4—source data 1
Original western blot scans used to generate Figure 4A (anti-InaC, anti-Flag, anti-Slc1, and anti-α-tubulin).
- https://cdn.elifesciences.org/articles/87386/elife-87386-fig4-data1-v1.zip
-
Figure 4—source data 2
Original western blot scans with labeled samples and highlighted bands for Figure 4A.
- https://cdn.elifesciences.org/articles/87386/elife-87386-fig4-data2-v1.zip
-
Figure 4—source data 3
Original western blot scans used to generate Figure 4B (anti-IpaM, anti-Flag, anti-Slc1, and anti-α-tubulin).
- https://cdn.elifesciences.org/articles/87386/elife-87386-fig4-data3-v1.zip
-
Figure 4—source data 4
Original western blot scans with labeled samples and highlighted bands for Figure 4B.
- https://cdn.elifesciences.org/articles/87386/elife-87386-fig4-data4-v1.zip
-
Figure 4—source data 5
Original western blot scans used to generate Figure 4C (anti-Flag, anti-Slc1, and anti-α-tubulin).
- https://cdn.elifesciences.org/articles/87386/elife-87386-fig4-data5-v1.zip
-
Figure 4—source data 6
Original western blot scans with labeled samples and highlighted bands for Figure 4C.
- https://cdn.elifesciences.org/articles/87386/elife-87386-fig4-data6-v1.zip
-
Figure 4—source data 7
Original western blot scans used to generate Figure 4D (anti-Flag [input], anti-Slc1 [input], anti-α-tubulin [input], anti-Flag [IP:Flag], and anti-lys48 pUb [IP:Flag]).
- https://cdn.elifesciences.org/articles/87386/elife-87386-fig4-data7-v1.zip
-
Figure 4—source data 8
Original western blot scans with labeled samples and highlighted bands for Figure 4D.
- https://cdn.elifesciences.org/articles/87386/elife-87386-fig4-data8-v1.zip
-
Figure 4—source data 9
Original western blot scans used to generate Figure 4E (anti-IncA [input], anti-InaC [input], anti-IpaM [input], anti-InaC [IP:Acetylated lysines], anti-IpaM [IP:Acetylated lysines], and anti-IncA [IP:Acetylated lysines]).
- https://cdn.elifesciences.org/articles/87386/elife-87386-fig4-data9-v1.zip
-
Figure 4—source data 10
Original western blot scans with labeled samples and highlighted bands for Figure 4E.
- https://cdn.elifesciences.org/articles/87386/elife-87386-fig4-data10-v1.zip
-
Figure 4—source data 11
Original western blot scans used to generate Figure 4F (anti-IncA [input], anti-Flag [input], and anti-Flag [IP:Acetylated lysines]).
- https://cdn.elifesciences.org/articles/87386/elife-87386-fig4-data11-v1.zip
-
Figure 4—source data 12
Original western blot scans with labeled samples and highlighted bands for Figure 4F.
- https://cdn.elifesciences.org/articles/87386/elife-87386-fig4-data12-v1.zip
-
Figure 4—source data 13
Original western blot scans used to generate Figure 4G (anti-IncA [input], anti-Flag [input], and anti-Flag [IP:Acetylated lysines]).
- https://cdn.elifesciences.org/articles/87386/elife-87386-fig4-data13-v1.zip
-
Figure 4—source data 14
Original western blot scans with labeled samples and highlighted bands for Figure 4G.
- https://cdn.elifesciences.org/articles/87386/elife-87386-fig4-data14-v1.zip
Figure 5 with 1 supplement
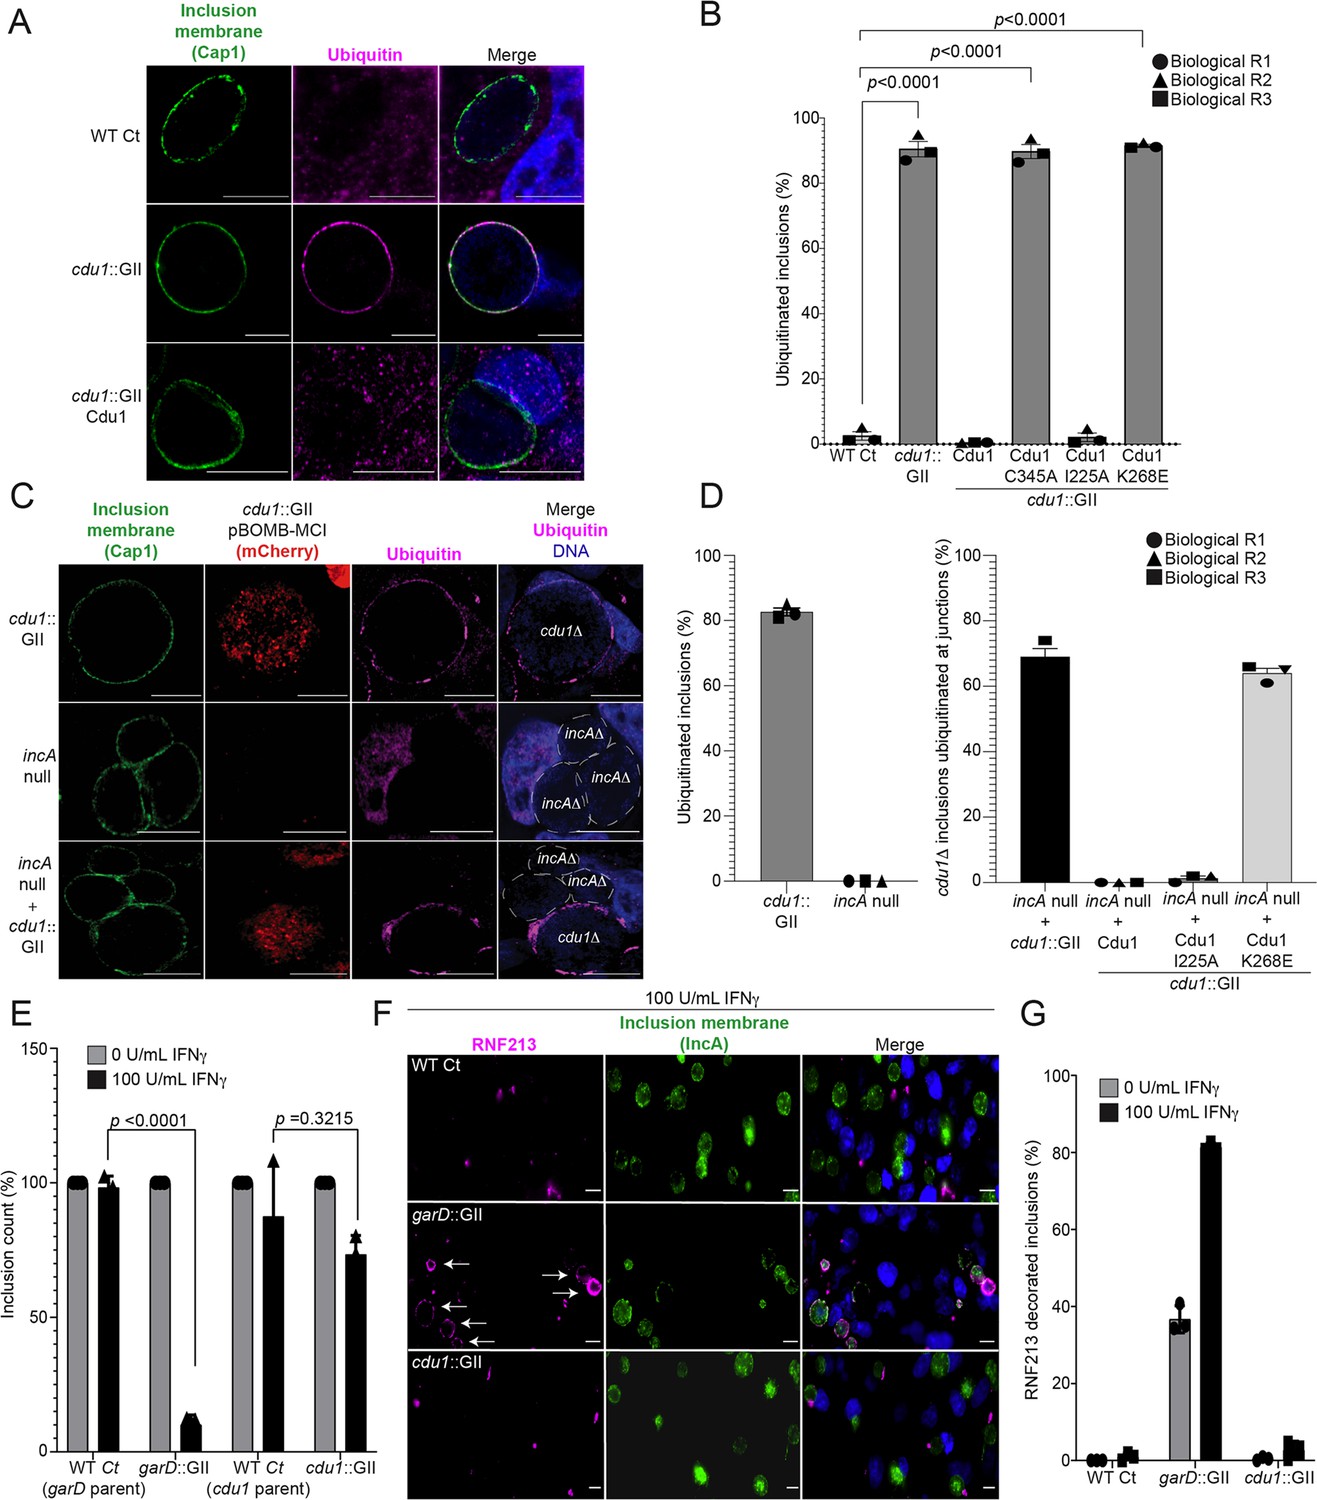
The DUB activity of Cdu1 is not required for blocking the ubiquitination of inclusion membranes and Cdu1 is not required for protection against IFNγ mediated cellular immunity.
(A) Representative images of Ct inclusions decorated with ubiquitin during infection of HeLa cells with a cdu1::GII strain for 24 hr. Representative images of infected HeLa cells used for quantification of ubiquitin decorated inclusions in (B) are shown in Figure 5—figure supplement 1A. Antisera against the membrane protein Cap1 (green) was used to mark inclusion membranes. DNA stained with Hoechst is shown in blue. Scale bar: 10 μm. (B) Quantification of ubiquitinated inclusions as shown in (A). The Ub fluorescent signal was used to determine the number of infected cells with Ub decorated inclusions. The total number of ubiquitinated inclusions was divided by the total number of inclusions analyzed (defined by Cap1 staining). 87%, 86%, and 91% of inclusions were decorated with Ub in HeLa cells infected with a cdu1 null strain and cdu1 null strains expressing Cdu1C345A (DUB-, Act-), and Cdu1K268E (Act-) variants respectively. Representative images (panel (A) and Figure 5—figure supplement 1A) and quantification of ubiquitinated inclusions were obtained from inclusions imaged in 10 fields across 3 independent biological replicates for each strain. p values were determined by a student paired t-test. For cells infected with the strains WT Ct, cdu1::GII, and cdu1::GII strains expressing WT Cdu1 and the variants C345A, I225A and K268E, n (across 3 replicates) = 262, 1505, 652, 1229, 389, and 1413 respectively. Error bars depict standard deviation.(C) Representative images of HeLa cells co-infected with cdu1::GII (cdu1Δ) and incA null (incAΔ, M923) strains at 24 hpi. IncA-deficient inclusions do not fuse with other inclusions. In co-infected cells, Cdu1 present on the inclusion membranes of incAΔ strains did not block ubiquitination events at or near the inclusion membranes of neighboring cdu1Δ strains (mCherry signal from pBOMB4-MCI plasmid). Representative images of HeLa cells infected with strains quantified in (D) are shown in Figure 5—figure supplement 1B. DNA stained with Hoechst is shown in blue. Scale bar: 10 μm. (D) Quantification of cdu1Δ inclusions as shown in (C) in which ubiquitination events are observed in regions of cdu1Δ inclusion membranes that are in direct apposition to incAΔ inclusion membranes (junctions). The total number of cdu1Δ inclusions ubiquitinated at inclusion junctions was divided by the total number of inclusions analyzed (Cap1 staining). 66% and 61% of cdu1Δ inclusions were decorated with Ub at junctions in HeLa cells co-infected with incAΔ and cdu1Δ strains or with incAΔ and a cdu1Δ strain ectopically expressing Cdu1K268E (Act-) respectively. Representative images (panel (C) and Figure 5—figure supplement 1B) and quantification of cdu1Δ inclusions ubiquitinated at junctions are derived from inclusions imaged in six fields across three independent biological replicates for each condition. p values were determined by a student paired t-test. For cells infected with the strains cdu1::GII and incA null, n (across 3 replicates) = 547 and 420 respectively. For cells co-infected with the incA null strain and cdu1::GII, or cdu1::GII strains expressing WT Cdu1 and the variants C345A, I225A and K268E, n (across 3 replicates) = 234, 188, 165, and 207 respectively. Error bars depict standard deviation. (E) Quantification of Ct inclusion production during infection of unprimed and IFNγ-primed (100 U/mL) A549 cells at 24 hours post infection. Inclusions were quantified by high-content imaging analysis. Plot reflects inclusion counts across nine fields of view and three independent biological replicates. Inclusion counts by each strain in unprimed A549 cells were set to 100%. Inclusion counts resulting from cdu1::GII and garD::GII strains were normalized to corresponding parental Ct inclusion (100%) counts in unprimed cells. p-values were calculated by two-way ANOVA analysis. For unprimed A549 cells infected with strains WT Ct (garD::GII parent), garD::GII, WT Ct (cdu1::GII parent), and cdu1::GII, n (across 3 replicates) = 20,212, 15,356, 10,931, and 9,535 respectively. For A549 cells pretreated with 100 U/mL IFNγ and infected with strains WT Ct (garD::GII parent), garD::GII, WT Ct (cdu1::GII parent), and cdu1::GII, n (across 3 replicates) = 19,082, 1,170, 7,842, and 6,368 respectively. Error bars depict standard deviation. (F) Representative images of RNF213 localizing to inclusions of WT Ct, garD::GII, and cdu1::GII strains during infection of A549 cells primed with IFNγ (100 U/mL). (G) Quantification of RNF213 localizing to Ct inclusions during infection of unprimed and IFNγ-primed (100 U/mL) A549 cells at 24 hours post infection. Plot reflects inclusion counts across six fields and three independent biological replicates. For unprimed A549 cells infected with strains WT Ct, garD::GII, and cdu1::GII, n (across 3 replicates) = 830, 817, and 620 respectively. For A549 cells pretreated with 100 U/mL IFNγ and infected with strains WT Ct, garD::GII, and cdu1::GII, n (across 3 replicates) = 816, 520, and 617 respectively. Error bars depict standard deviation.
-
Figure 5—source data 1
Excel file with numerical data for quantifying ubiquitinated inclusions in HeLa cells infected with WT CT and cdu1::GII strains, and cdu1::GII strains expressing Cdu1 C345A, I225A, and K268E variants (Figure 5B).
- https://cdn.elifesciences.org/articles/87386/elife-87386-fig5-data1-v1.zip
-
Figure 5—source data 2
Excel files with numerical data for quantifying the number of ubiquitinated inclusions in HeLa cells infected with cdu1::GII and incA null strains, and cdu1::GII strains expressing Cdu1 variants that are ubiquitinated at inclusion junctions in co-infected HeLa cells (Figure 5D).
- https://cdn.elifesciences.org/articles/87386/elife-87386-fig5-data2-v1.zip
-
Figure 5—source data 3
Excel file containing numerical data for quantifying the number of inclusions in IFN-γ-primed A549 cells infected with WT CT, garD::GII, and cdu1::GII strains (Figure 5E).
- https://cdn.elifesciences.org/articles/87386/elife-87386-fig5-data3-v1.zip
-
Figure 5—source data 4
Excel file containing numerical data for quantifying the number of RNF213-positive inclusions in IFN-γ-primed A549 cells infected with WT CT, garD::GII, and cdu1::GII strains (Figure 5G).
- https://cdn.elifesciences.org/articles/87386/elife-87386-fig5-data4-v1.zip
Figure 5—figure supplement 1
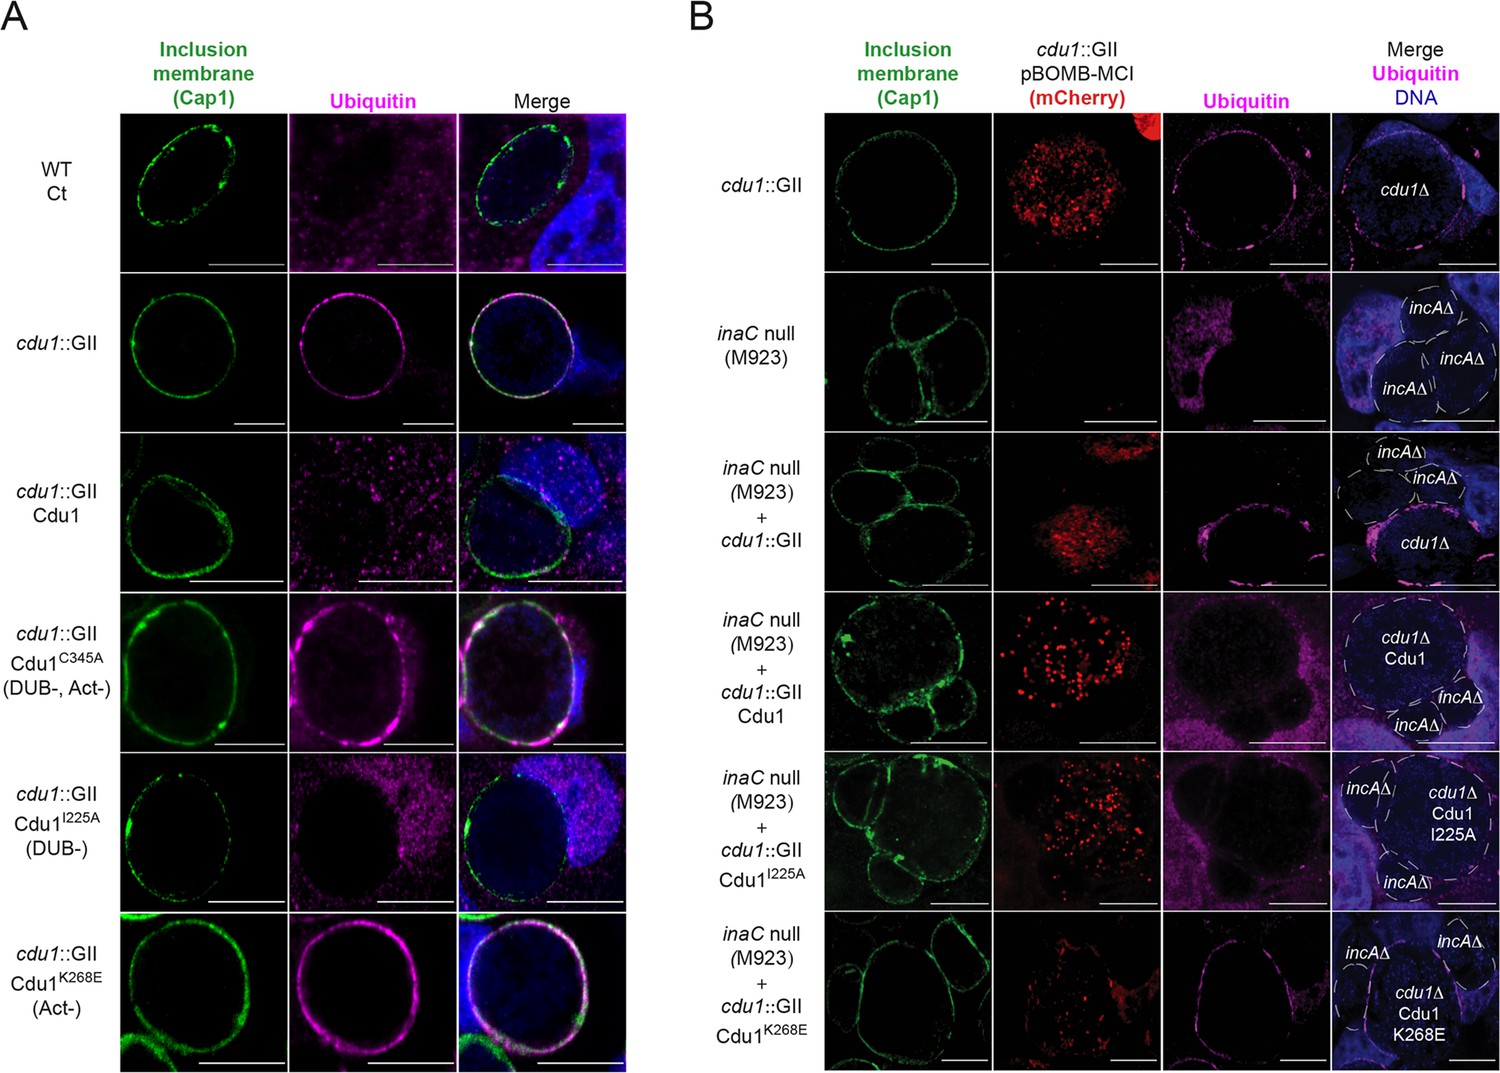
The Acetylase activity of Cdu1 is the predominant activity of Cdu1 responsible for protecting Ct inclusions from ubiquitination.
(A) Representative images of Ct inclusions (green, Cap1) decorated with Ubiquitin (magenta, FK2 antibody) in HeLa cells infected for 24 hr. Strains used: WT Ct (L2 434 Bu), cdu1::GII pBOMB MCI, cdu1::GII pBOMB MCI-Cdu1 Flag, cdu1::GII pBOMB MCI-Cdu1C345A Flag, cdu1::GII pBOMB MCI-Cdu1I225A Flag, and cdu1::GII pBOMB MCI-Cdu1K268E Flag. (B) Representative images of HeLa cells co-infected with an incA null strain and cdu1::GII strains expressing Cdu1 variants for 24 hr. Strains used: cdu1::GII pBOMB MCI, inaC null (M923), cdu1::GII pBOMB MCI-Cdu1 Flag, cdu1::GII pBOMB MCI-Cdu1C345A Flag, cdu1::GII pBOMB MCI-Cdu1I225A Flag, and cdu1::GII pBOMB MCI-Cdu1K268E Flag. DNA stained with Hoechst is shown in blue. Scale bar: 10 μm. MCI = mCherry.
Figure 6 with 2 supplements
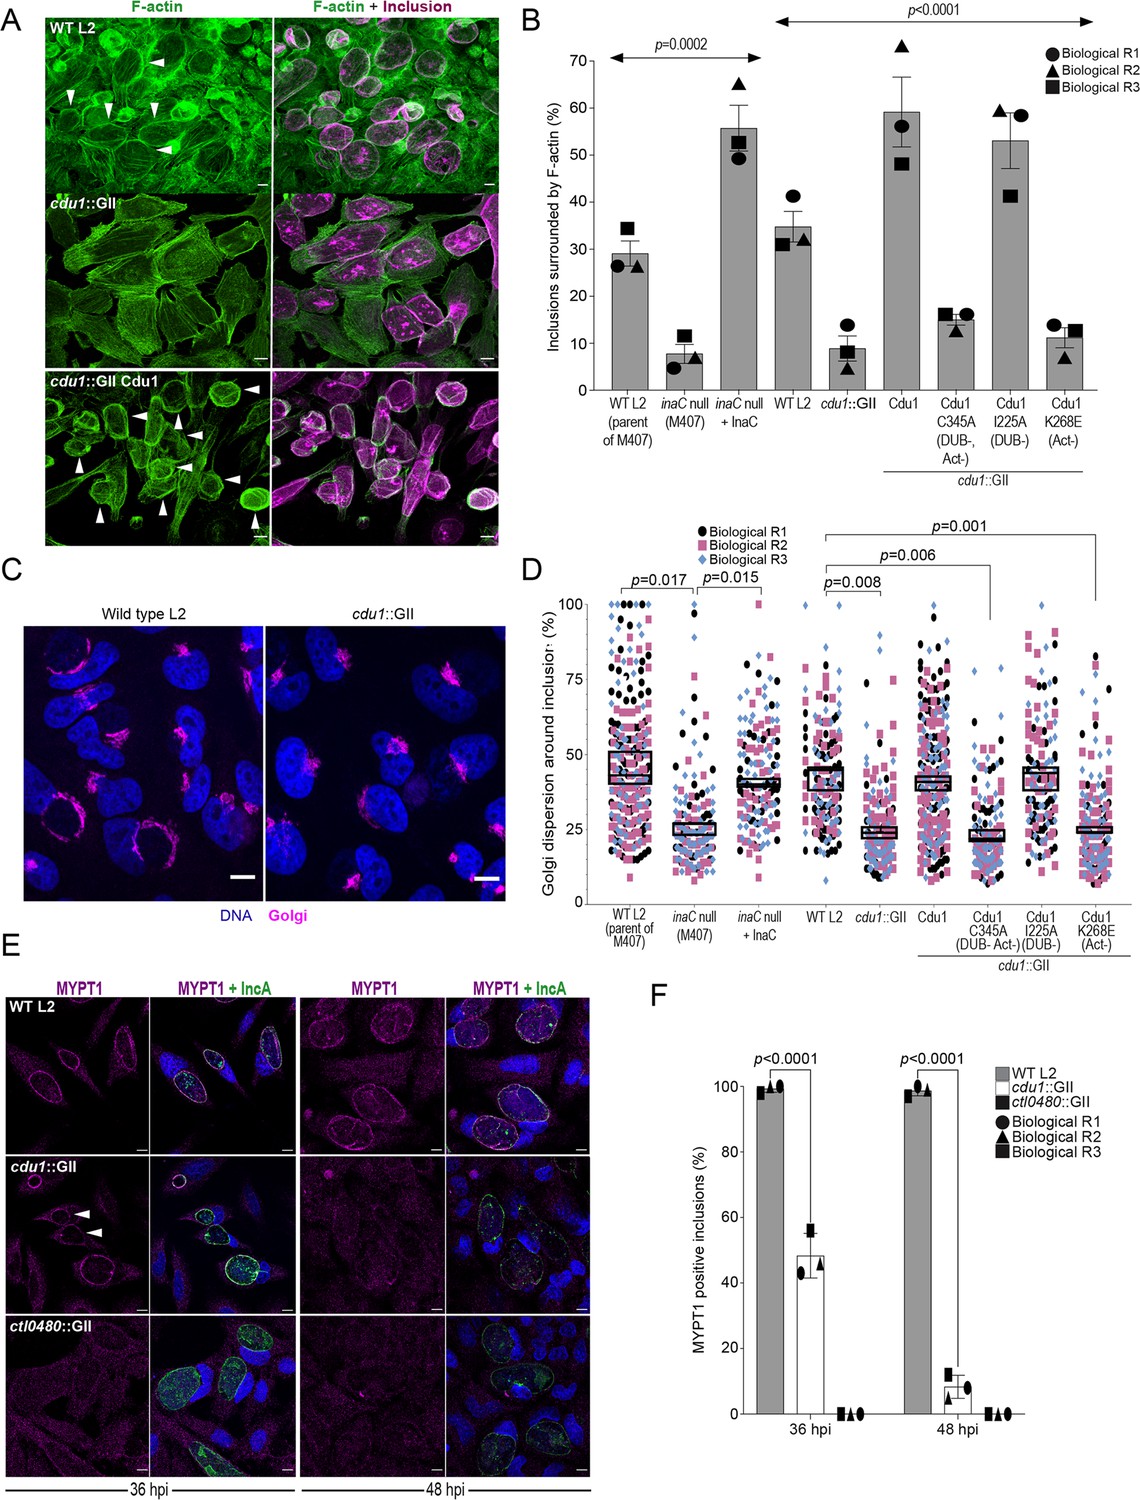
Cdu1 is required for assembly of F-actin, Golgi ministack repositioning, and MYPT1 recruitment to the inclusion.
(A) Examples of representative images of F-actin (arrowheads) (green, Alexa Fluor Phalloidin) assembled around the Ct inclusion (magenta, anti Cdu1 and Cap1 staining) in HeLa cells infected for 40 hr. Representative images for each strain analyzed can be found in Figure 6—figure supplement 1. (B) Quantification of Ct inclusion surrounded by F-actin normalized to the total number of inclusions analyzed during infection of HeLa cells at 40 hpi. Quantification of surrounding F-actin were obtained from inclusions imaged in six fields across three independent biological replicates. p values were determined by one-way ANOVAs with a Student-Newman-Keuls post hoc test. Strains used: WT L2 (Rif-R 434 Bu, parent of M407), M407 (inaC null strain) p2TK2, M407 p2TK2-InaC, WT L2 (434 Bu) pBOMB, cdu1::GII pBOMB, cdu1::GII pBOMB-Cdu1 Flag, cdu1::GII pBOMB-Cdu1C345A Flag, cdu1::GII pBOMB-Cdu1I225A Flag, and cdu1::GII pBOMB-Cdu1K268E Flag. For cells infected with the strains WT CT (parent of M407), inaC null, inaC null + InaC, WT L2, cdu1::GII, and cdu1::GII strains expressing WT Cdu1 and the variants C345A, I225A and K268E, n (across 3 replicates) = 259, 708, 780, 477, 538, 496, 370, 438, and 472 respectively. Error bars depict standard deviation.(C) Sample representative images of Golgi (anti GM130 staining, magenta) around Ct inclusions in HeLa cells infected for 24 hours. Representative images for each strain analyzed can be found in Figure 6—figure supplement 2. (D) Quantification of Golgi dispersal around the Ct inclusion during infection of HeLa cells for 24 hpi. The length of Golgi dispersed around each Ct inclusion imaged was measured and normalized to the perimeter length of each inclusion (% Golgi dispersion around the inclusion). Golgi dispersal around Ct inclusions was quantified from inclusions imaged in six fields across three independent biological replicates. p values were determined by a student paired t-test. Strains analyzed were the same ones as mentioned in (B). For cells infected with the strains WT CT (parent of M407), inaC null, inaC null + InaC, WT L2, cdu1::GII, and cdu1::GII strains expressing WT Cdu1 and the variants C345A, I225A and K268E, n (across 3 replicates) = 351, 187, 147, 169, 198, 284,187, 143, and 130 respectively. Error bars depict standard deviation. (E) Representative images of MYPT1 (magenta) at Ct inclusions (green, anti-IncA staining). Arrowheads represent cdu1 null inclusions with low MYPT1 signal. DNA stained with Hoechst is shown in blue in panels C and E. Scale bar: 10 μm. (F) Quantification of MYPT1 at Ct inclusions as shown in (E). Representative images in (E) and quantification of MYPT1 recruitment in (F) were obtained from inclusions imaged in six fields across three independent replicates. Error bars depict standard deviation. p values were determined by a student paired t-test. For cells infected with WT Ct n (across 3 replicates) = 187 inclusions at 36 hpi and n=204 inclusions at 48 hpi. For cells infected with cdu1::GII n (across 3 replicates) = 202 inclusions at 36 hpi and n=168 at 48 hpi. For cells infected with ctl0480::GII n (across 3 replicates) = 175 inclusions at 36 hpi and n=203 inclusions at 48 hpi.
-
Figure 6—source data 1
Excel file containing numerical data for quantifying the number of inclusions surrounded by filamentous actin in HeLa cells infected with WT CT, inaC null, inaC null complemented with InaC, cdu1::GII, and cdu1::GII strains expressing Cdu1, Cdu1 C345A, I225A, and K268E variants (Figure 6B).
- https://cdn.elifesciences.org/articles/87386/elife-87386-fig6-data1-v1.zip
-
Figure 6—source data 2
Excel files containing numerical data for quantifying the number of inclusions surrounded by dispersed Golgi mini stacks in HeLa cells infected with WT CT, inaC null, inaC null complemented with InaC, cdu1::GII, and cdu1::GII strains expressing Cdu1, Cdu1 C345A, I225A, and K268E variants (Figure 6D).
- https://cdn.elifesciences.org/articles/87386/elife-87386-fig6-data2-v1.zip
-
Figure 6—source data 3
Excel files with numerical data for quantifying the localization of MYPT1 to WT and cdu1::GII inclusions (Figure 6F).
- https://cdn.elifesciences.org/articles/87386/elife-87386-fig6-data3-v1.zip
Figure 6—figure supplement 1
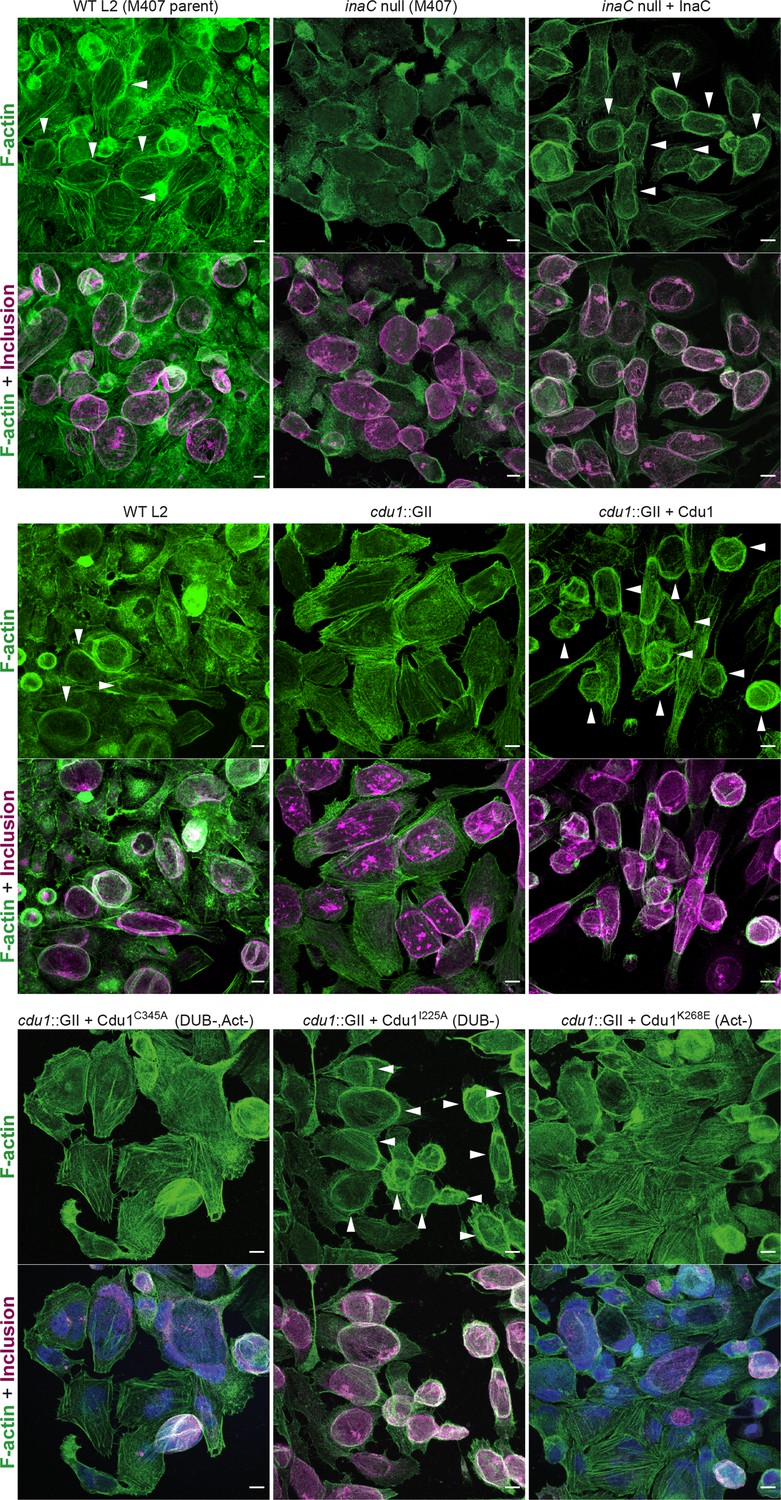
The DUB activity of Cdu1 is not required for assembly of F-actin around the Ct inclusion.
Representative images of F-actin (arrowheads) (green, Alexa Fluor Phalloidin) assembled around the Ct inclusion (magenta, antiCdu1 and Cap1 staining) in HeLa cells infected for 40 hr. Strains used: WT L2 (Rif-R 434 Bu, parent of M407), M407 (inaC null strain) p2TK2, M407 p2TK2-InaC, WT L2 (434 Bu) pBOMB, cdu1::GII pBOMB, cdu1::GII pBOMB-Cdu1 Flag, cdu1::GII pBOMB-Cdu1C345A Flag, cdu1::GII pBOMB-Cdu1I225A Flag, and cdu1::GII pBOMB-Cdu1K268E Flag. DNA stained with Hoechst is shown in blue. Scale bar: 10 μm.
Figure 6—figure supplement 2
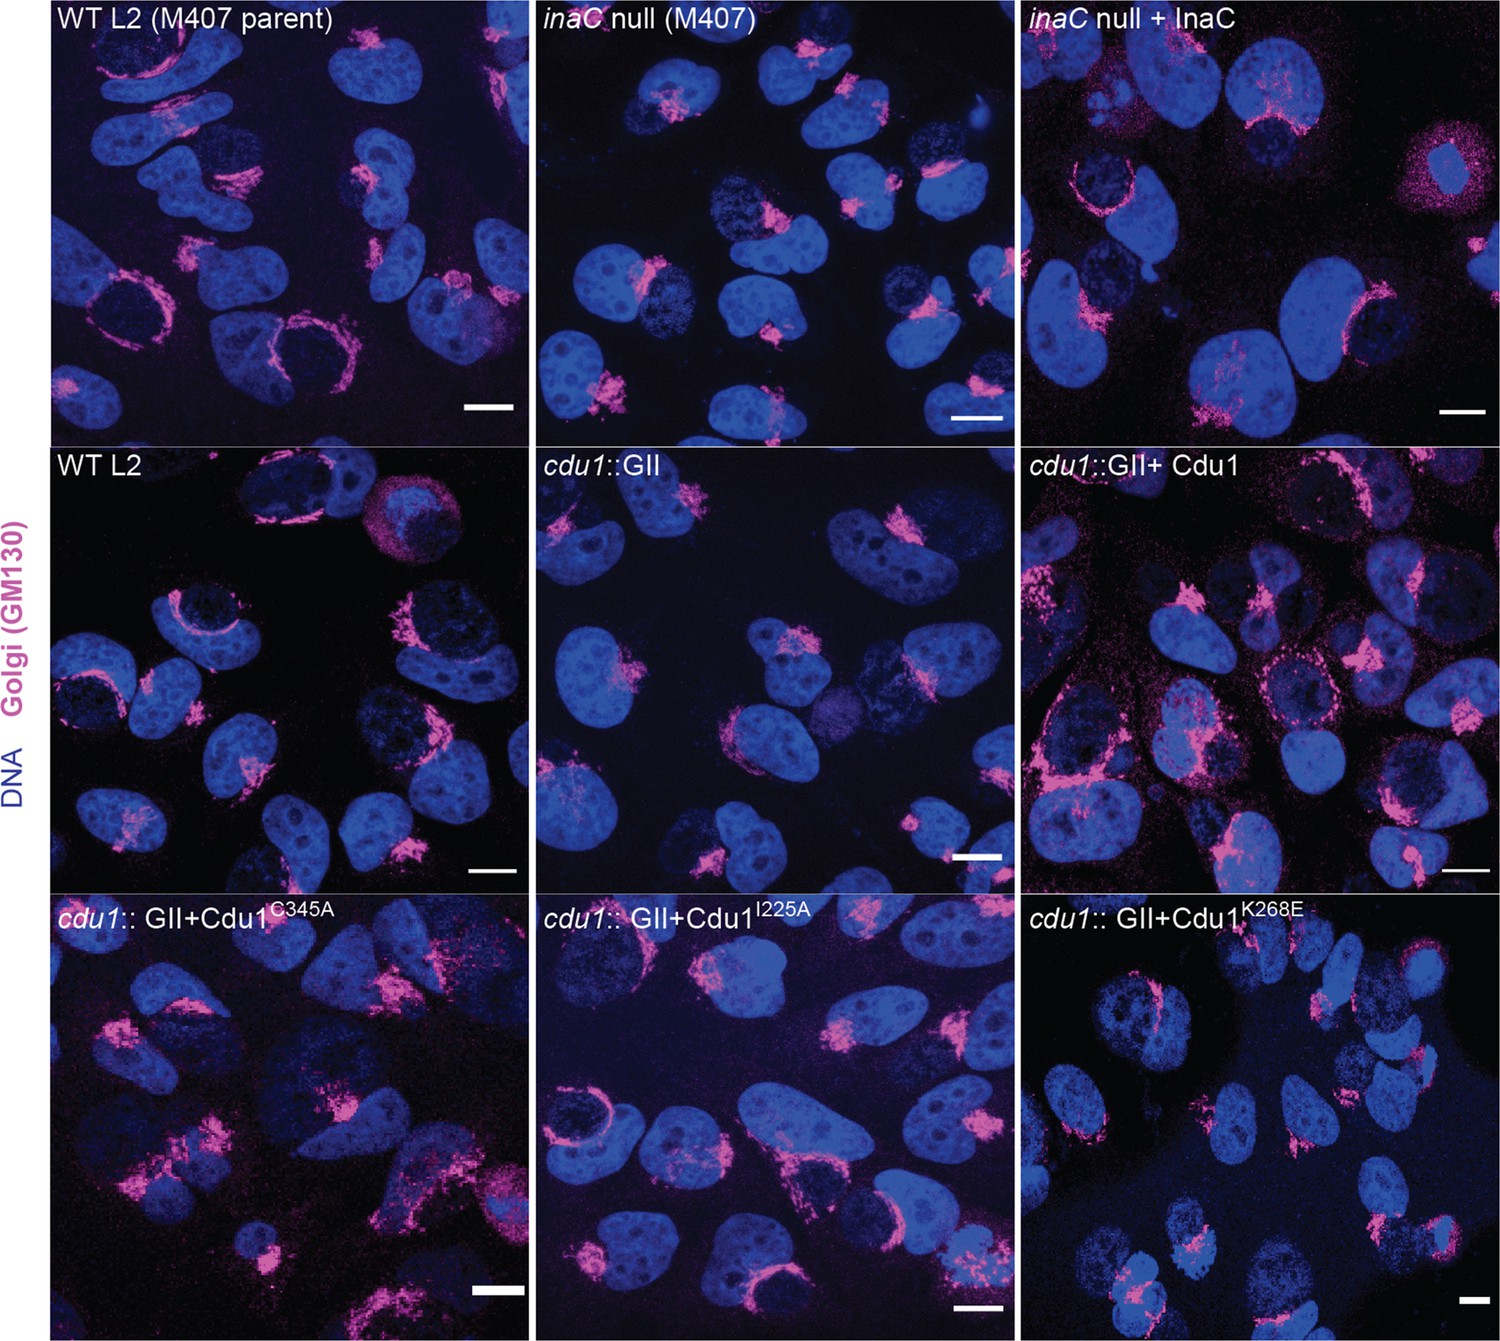
The DUB activity of Cdu1 is not required for Golgi ministack repositioning around the Ct inclusion.
Representative images of Golgi (anti-GM130 staining, magenta) around Ct inclusions in HeLa cells infected for 24 hr. Strains used: WT L2 (Rif-R 434 Bu, parent of M407), M407 (inaC null strain) p2TK2, M407 p2TK2-InaC, WT L2 (434 Bu) pBOMB, cdu1::GII pBOMB, cdu1::GII pBOMB-Cdu1 Flag, cdu1::GII pBOMB-Cdu1C345A Flag, cdu1::GII pBOMB-Cdu1I225A Flag, and cdu1::GII pBOMB-Cdu1K268E Flag. DNA stained with Hoechst is shown in blue. Scale bar: 10 μm.
Figure 7 with 1 supplement
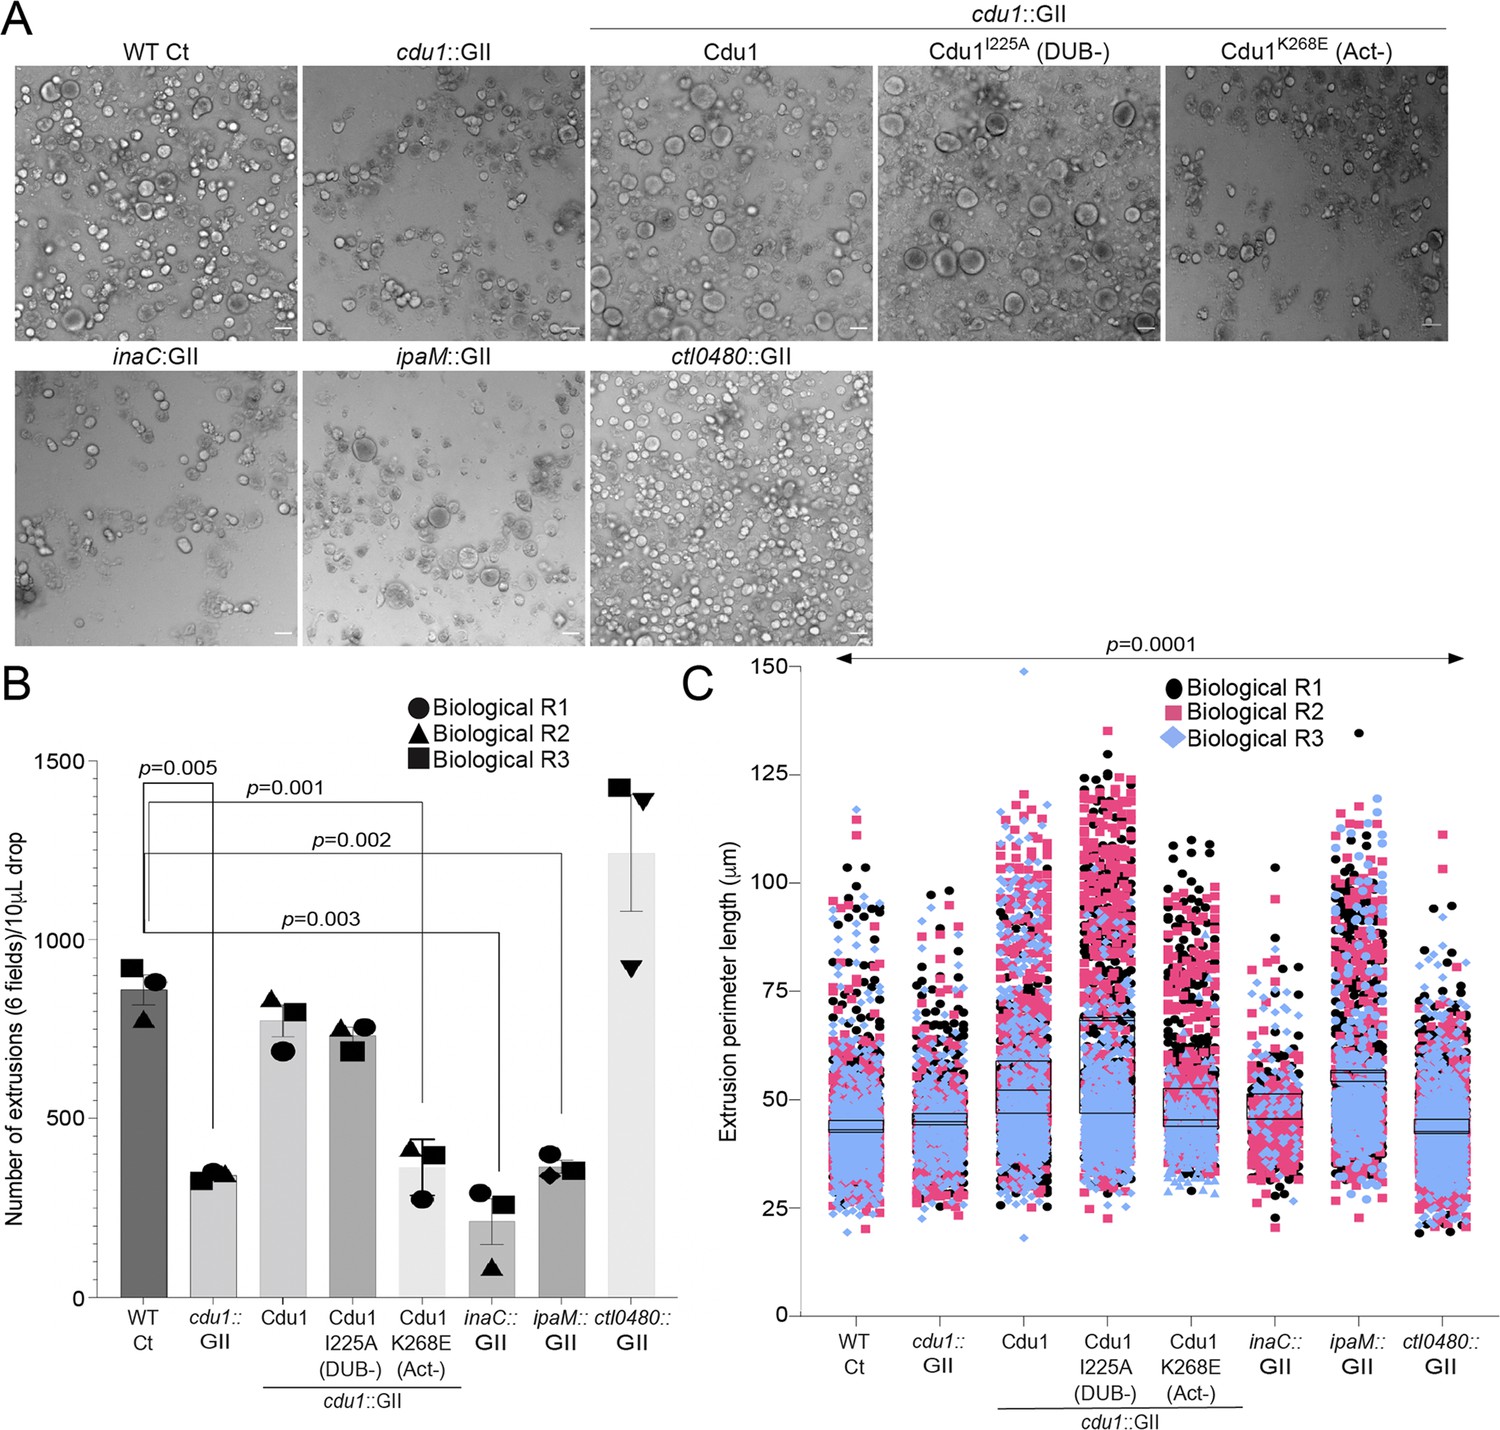
Cdu1, InaC, and IpaM are required for optimal extrusion of Ct inclusions from HeLa cells.
(A) Representative images of extrusions isolated from HeLa cell monolayers infected with Ct strains for 52 hr. Scale bar: 200 μm (B) Quantification of the number of extruded inclusions produced by infected HeLa cell monolayers. p values were determined by a student paired t-test. (C) Quantification of the size of extruded inclusions quantified in (B). Extruded inclusions varied in size among cells infected with wild type L2 (average:43 μm), ipaM mutants (average: 56 μm) and cdu1 mutants complemented wild type Cdu1 (average: 52 μm) and Cdu1I225A (DUB-) (average: 60 μm). p values were determined by one-way ANOVAs with a Student-Newman-Keuls post hoc test. Representative images in (A) and quantification of extrusion number in (B) and extrusion size in (C) are based on images obtained from six fields across three independent biological replicates. For extrusions isolated from Hela cells infected with WT CT, cdu1::GII, inaC::GII, ipaM::GII, ctl0480::GII, and cdu1::GII strains expressing WT Cdu1 and the variants I225A and K268E, n (across 3 replicates) = 2,580, 1,025, 637, 1,194, 3,726, 2,321, 2,198, and 1,091 respectively. Error bars depict standard deviation.
-
Figure 7—source data 1
Excel files containing numerical data for quantifying the number of extrusions produced and the size of extrusions in WT CT, cdu1::GII strains, and cdu1::GII strains expressing Cdu1, I225A, and K268E variants from infected HeLa cells (Figure 7B and C).
- https://cdn.elifesciences.org/articles/87386/elife-87386-fig7-data1-v1.zip
Figure 7—figure supplement 1
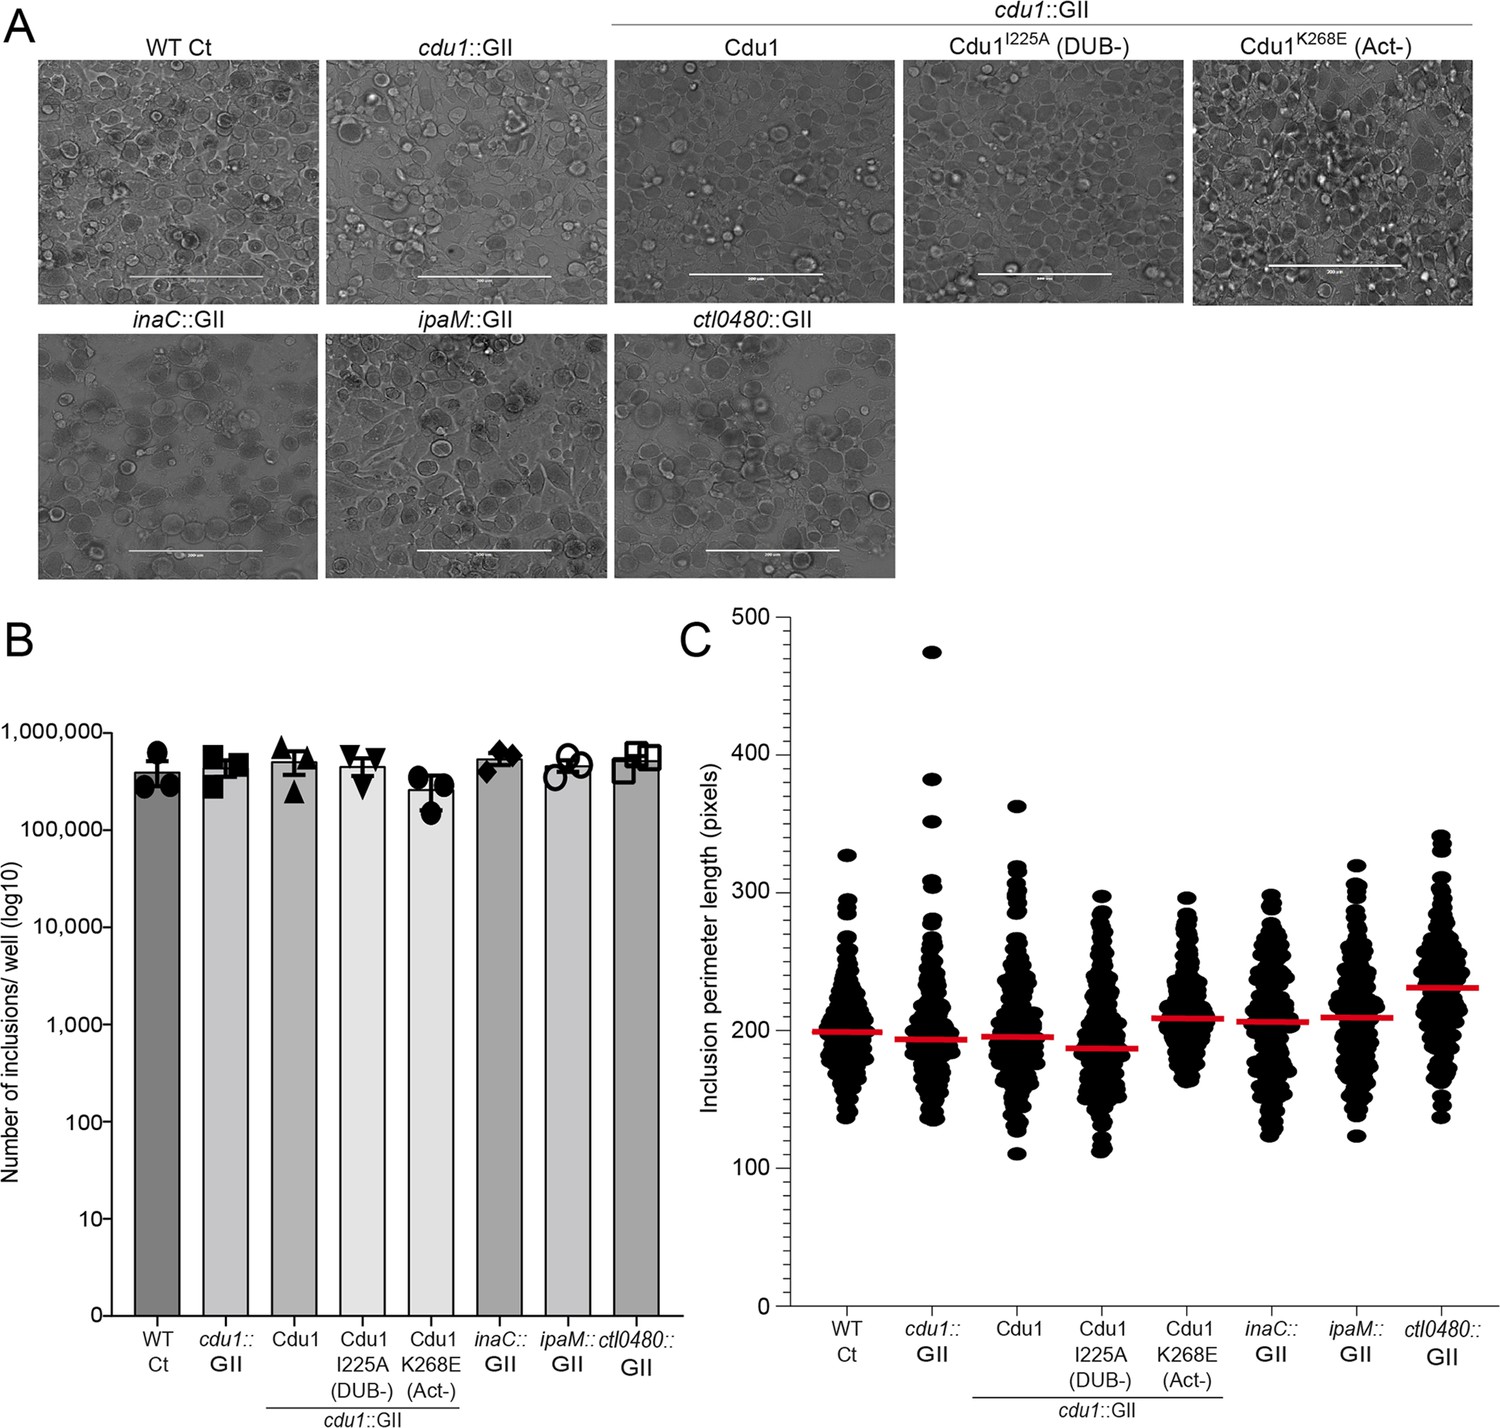
The number of inclusions and the size of inclusions in cdu1 null, inaC null, ipaM null, and ctl0480 null strains are similar across each strain.
(A) Representative images of inclusions in infected HeLa cell monolayers at 48 hpi. Scale bar: 200 μm (B) Quantification of the number of inclusions in infected HeLa cell monolayers. To determine the number of inclusions for the strains WT CT, cdu1::GII, inaC::GII, ipaM::GII, ctl0480::GII, and cdu1::GII strain expressing WT Cdu1 and the variants I225A and K268E, the respective sample sizes (across 3 replicates) were as follows: 1.2E+06, 1.3E+06, 1.6E +06, 1.4E +06, 1.6E+06, 1.5E+06, 1.4E+06, and 1.2E+06. Error bars depict standard deviation.(C) Quantification of inclusion size. To determine the inclusion size for the strains WT CT, cdu1::GII, inaC::GII, ipaM::GII, ctl0480::GII, and cdu1::GII strain expressing WT Cdu1 and the variants I225A and K268E, the respective sample sizes (across 3 replicates) were as follows: 250, 218, 220, 225, 225, 222, 225, and 269 respectively. Error bars depict standard deviation.
-
Figure 7—figure supplement 1—source data 1
Excel files with numerical data for quantifying the number of inclusions produced and inclusion size in WT CT, cdu1::GII strains, and cdu1::GII strains expressing Cdu1, I225A, and K268E variants in infected HeLa cells (panels B and C).
- https://cdn.elifesciences.org/articles/87386/elife-87386-fig7-figsupp1-data1-v1.zip
Figure 8
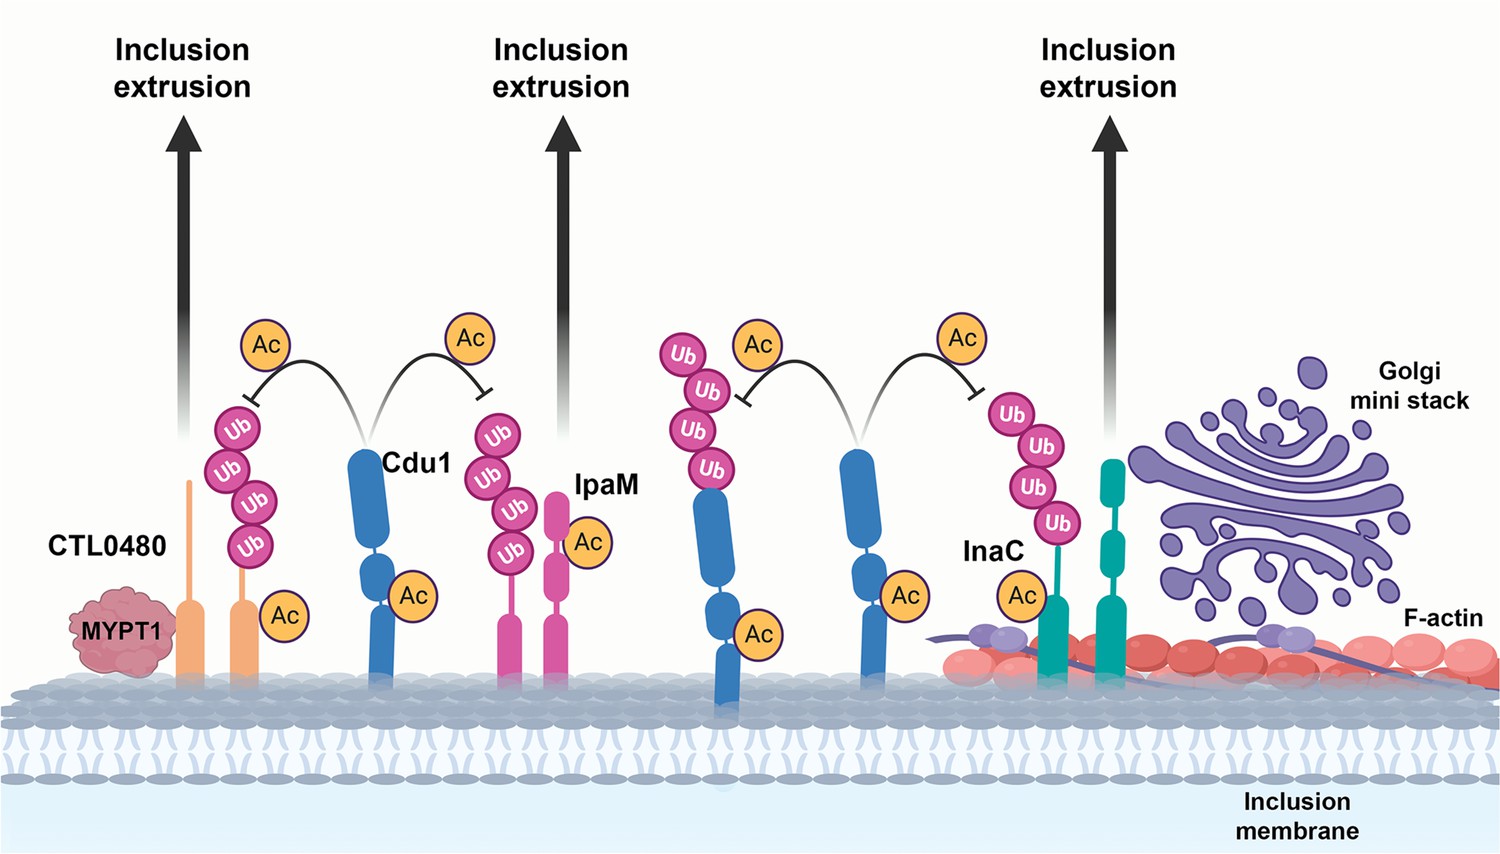
A model for acetylation mediated protection of the Inc proteins InaC, IpaM, and Ctl0480 from degradation.
The cellular Ub machinery targets C. trachomatis effectors, including the Inc proteins InaC, IpaM, and CTL0480 for ubiquitination and subsequent protein degradation. C. trachomatis counters such defense mechanisms by translocating Cdu1 which protect itself and all three Inc proteins from being targeted for ubiquitination and degradation through its acetylase activity. Cdu1 protects InaC and enables the recruitment of F-actin scaffolds and Golgi ministacks to the inclusion perimeter and CTL0480 to recruit the Myosin II regulator MYPT1. All three inclusion proteins and Cdu1 promote extrusion and dissemination of C. trachomatis inclusions late in infection.
© 2024, Bastidas et al. Figure 8 was created using BioRender, and is published under a CC BY-NC-ND 4.0 license. Further reproductions must adhere to the terms of this license.
Tables
Appendix 1—key resources table
| Reagent type (species) or resource | Designation | Source or reference | Identifiers | Additional information |
|---|---|---|---|---|
| Gene (Chlamydia trachomatis L2 434 Bu) | cdu1 | BV-BRC (Bacterial and Viral Bioinformatics resource center); Refseq (NCBI Reference Sequence Database) | fig|471472.4.peg.264 (BV-BRC) CTL0247 (Refseq) | |
| Gene (Chlamydia trachomatis L2 434 Bu) | inaC | BV-BRC; Refseq | fig|471472.4.peg.199 (BV-BRC) CTL0184 (Refseq) | |
| Gene (Chlamydia trachomatis L2 434 Bu) | ipaM | BV-BRC; Refseq | fig|471472.4.peg.511 (BV-BRC) CTL0476 (Refseq) | |
| Gene (Chlamydia trachomatis L2 434 Bu) | CTL0480 | BV-BRC; Refseq | fig|471472.4.peg.516 (BV-BRC) CTL0480 (Refseq) | |
| Gene (Chlamydia trachomatis L2 434 Bu) | cpoS | BV-BRC; Refseq | fig|471472.4.peg.517 (BV-BRC) CTL0481 (Refseq) | |
| Gene (Chlamydia trachomatis L2 434 Bu) | incA | BV-BRC; Refseq | fig|471472.4.peg.406 (BV-BRC) CTL0374 (Refseq) | |
| Gene (Chlamydia trachomatis L2 434 Bu) | slc1 | BV-BRC; Refseq | fig|471472.4.peg.323 (BV-BRC) CTL0299 (Refseq) | |
| Gene (Chlamydia trachomatis L2 434 Bu) | rpoB | BV-BRC; Refseq | fig|471472.4.peg.608 (BV-BRC) CTL0567 (Refseq) | |
| Gene (Chlamydia trachomatis L2 434 Bu) | garD | BV-BRC; Refseq | fig|471472.4.peg.421 (BV-BRC) CTL0390 (Refseq) | |
| Gene (Homo sapiens) | MYPT1 | NCBI | PPP1R12A | |
| Cell line (Homo sapiens) | Hela | ATCC | Cat# CCL-2 RRID:CVCL_0030 | |
| Cell line (Cercopithecus aethiops) | Vero | ATCC | Cat# CCL-81 RRID:CVCL_0059 | |
| Cell line (Homo sapiens) | HEK 293T | ATCC | Cat# CRL-3216 RRID:CVCL_0063 | |
| Cell line (Homo sapiens) | A549 | ATCC | Cat# CCL-185 RRID:CVCL_0023 | |
| Transfected construct (Chlamydia trachomatis L2 43 Bu) | pOPIN-GFP_Cdu1 FL (aa 1–401) | Jonathan Pruneda (Oregon Health and Science University) | N/A | Used for Cdu1 co-immunoprecipitations in transfected cells |
| Transfected construct (Chlamydia trachomatis L2 43 Bu) | pOPIN-GFP_Cdu1 TMD- (aa 71–401) | Jonathan Pruneda (Oregon Health and Science University) | N/A | Used for Cdu1 co-immunoprecipitations in transfected cells |
| Transfected construct (Chlamydia trachomatis L2 43 Bu) | pOPIN-GFP_Cdu1 CD- (aa 1–130) | Jonathan Pruneda (Oregon Health and Science University) | N/A | Used for Cdu1 co-immunoprecipitations in transfected cells |
| Transfected construct (Chlamydia trachomatis L2 43 Bu) | pCDNA-DEST53 (w/o GFP)_InaC (CT813)–3XFLAG | This paper | N/A | Construct for showing Cdu1-InaC co-IP in transfected cells |
| Transfected construct (Chlamydia trachomatis L2 43 Bu) | pcDNA3.1/nV5-DEST_IpaM | This paper | N/A | Construct for showing Cdu1-IpaM co-IP in transfected cells |
| Transfected construct (Chlamydia trachomatis L2 43 Bu) | pcDNA3.1/nV5-DEST_CTL0480 | This paper | N/A | Construct for showing Cdu1-CTL0480 co-IP in transfected cells |
| Transfected construct (Chlamydia trachomatis L2 43 Bu) | pcDNA3.1/nV5-DEST_CpoS | This paper | N/A | Construct for showing lack of Cdu1-Cpos co-IP in transfected cells |
| Biological sample (Chlamydia trachomatis L2 434 Bu) | Chlamydia trachomatis LGV biovar L2 434 Bu (L2) | Richard Stephens (UC Berkeley) | N/A | Reference Chlamydia trachomatis (L2) strain |
| Biological sample (Chlamydia trachomatis L2 434 Bu) | L2 pBOMB-MCI (Parent: LGV L2 434 Bu) | This paper | N/A | L2 strain transformed with empty expression plasmid |
| Biological sample (Chlamydia trachomatis L2 434 Bu) | L2 pBOMB-MCI_CTL0480-3XFlag (Parent: LGV L2 434 Bu) | This paper | N/A | L2 strain transformed with plasmid expressing CTL0480-3XFlag |
| Biological sample (Chlamydia trachomatis L2 434 Bu) | L2 pBOMB-MCI_IpaM-3XFlag (Parent: LGV L2 434 Bu) | This paper | N/A | L2 strain transformed with plasmid expressing IpaM-3XFlag |
| Biological sample (Chlamydia trachomatis L2 434 Bu) | L2 pBOMB-MCI_Cdu1-3XFlag (Parent: LGV L2 434 Bu) | This paper | N/A | L2 strain transformed with plasmid expressing Cdu1-3XFlag |
| Biological sample (Chlamydia trachomatis L2 434 Bu) | L2 pBOMB-MCI_Cdu1C345A-3XFlag (Parent: LGV L2 434 Bu) | This paper | N/A | L2 strain transformed with plasmid expressing Cdu1C345A –3XFlag |
| Biological sample (Chlamydia trachomatis L2 434 Bu) | L2 pBOMB-MCI_Cdu1K268E-3XFlag (Parent: LGV L2 434 Bu) | This paper | N/A | L2 strain transformed with plasmid expressing Cdu1K268E –3XFlag |
| Biological sample (Chlamydia trachomatis L2 434 Bu) | L2 cdu1::GII aadA (Parent: LGV L2 434 Bu) | This paper | N/A | L2 cdu1 null strain (SpecR) |
| Biological sample (Chlamydia trachomatis L2 434 Bu) | L2 cdu1::GII aadA pBOMB-MCI (Parent: L2 cdu1::GII aadA) | This paper | N/A | L2 cdu1 null strain transformed with empty expression plasmid |
| Biological sample (Chlamydia trachomatis L2 434 Bu) | L2 cdu1::GII aadA pBOMB-MCI_Cdu1-3XFlag (Parent: L2 cdu1::GII aadA) | This paper | N/A | L2 cdu1 null strain transformed with plasmid expressing WT Cdu1-3XFlag |
| Biological sample (Chlamydia trachomatis L2 434 Bu) | L2 cdu1::GII aadA pBOMB-MCI_Cdu1C345A-3XFlag (Parent: L2 cdu1::GII aadA) | This paper | N/A | L2 cdu1 null strain transformed with plasmid expressing WT Cdu1C345A-3XFlag |
| Biological sample (Chlamydia trachomatis L2 434 Bu) | L2 cdu1::GII aadA pBOMB-MCI_Cdu1I225A-3XFlag (Parent: L2 cdu1::GII aadA) | This paper | N/A | L2 cdu1 null strain transformed with plasmid expressing WT Cdu1I225A-3XFlag |
| Biological sample (Chlamydia trachomatis L2 434 Bu) | L2 cdu1::GII aadA pBOMB-MCI_Cdu1K268E-3XFlag (Parent: L2 cdu1::GII aadA) | This paper | N/A | L2 cdu1 null strain transformed with plasmid expressing WT Cdu1K268E-3XFlag |
| Biological sample (Chlamydia trachomatis L2 434 Bu) | L2 Rif-R (Parent: L2 434 Bu) | PMID:22232666 | N/A | Rifampin resistant L2 strain (L2 434 Bu) |
| Biological sample (Chlamydia trachomatis L2 434 Bu) | M407 (inaC C307T, InaC Q103*) (Parent: L2 Rif-R) | PMID:25920978 | N/A | L2 strain bearing a nonsense mutation in inaC (inaC null srain) |
| Biological sample (Chlamydia trachomatis L2 434 Bu) | M407 p2TK2 (Parent: M407) | PMID:25920978 | N/A | L2 inaC null strain transformed with empty expression plasmid |
| Biological sample (Chlamydia trachomatis L2 434 Bu) | M407 p2TK2_InaC (Parent: M407) | PMID:25920978 | N/A | L2 inaC null strain transformed with plasmid expressing WT InaC (untagged) |
| Biological sample (Chlamydia trachomatis L2 434 Bu) | M407 p2TK2_InaC-3X Flag (Parent: M407) | This paper | N/A | L2 inaC null strain transformed with plasmid expressing WT InaC-3X Flag |
| Biological sample (Chlamydia trachomatis L2 434 Bu) | inaC::GII bla (Parent: L2 434 Bu) | PMID:28465429 | N/A | L2 inaC null strain (PenicillinR) |
| Biological sample (Chlamydia trachomatis L2 434 Bu) | ipaM::GII cat (Parent: L2 434 Bu) | PMID:37530528 | N/A | L2 ipaM null strain (ChloramphenicolR) |
| Biological sample (Chlamydia trachomatis L2 434 Bu) | ctl0480::GII aadA (Parent: L2 434 Bu) | PMID:30555802 | N/A | L2 ctl0480 null strain (SpecR) |
| Biological sample (Chlamydia trachomatis L2 434 Bu) | M923 (incA C589T, IncA R197*) (Parent: L2 Rif-R) | PMID:25920978 | N/A | L2 strain bearing a nonsense mutation in incA (incA null srain) |
| Biological sample (Chlamydia trachomatis L2 434 Bu) | M923 pBOMB-MCl (Parent: L2 M923) | PMID:28041929 | N/A | L2 incA null strain transformed with empty expression plasmid |
| Biological sample (Chlamydia trachomatis L2 434 Bu) | L2 434 Bu (Parent of L2 garD::GII) | PMID:36084633 | N/A | Wild type L2 parent of garD null strain |
| Biological sample (Chlamydia trachomatis L2 434 Bu) | L2 ctl0390::GII aadA (garD::GII) | PMID:36084633 | N/A | L2 garD null strain (SpecR) |
| Antibody | CT L2 Cdu1 (a.a 71–401) Rabbit polyclonal | This paper | N/A | Dilution IF: 1:100 Dilution WB 1:500 Antibody raised against L2 Cdu1 |
| Antibody | CT Cap1 Rabbit polyclonal | PMID:26981769 | N/A | Dilution IF: 1:250 |
| Antibody | CT CT813 (InaC) (D/UW-3/CX) Mouse monoclonal | PMID:16861671 | N/A | Dilution IF: 1:100 |
| Antibody | CT CTL0480 Rabbit polyclonal | PMID:23727243 | N/A | Dilution IF: 1:100 |
| Antibody | CT IncA Mouse monoclonal | Dan Rockey Oregon State Univ. Corvallis | N/A | Dilution IF: 1:100 |
| Antibody | CT IpaM Mouse monoclonal 12ES IgG1 | PMID:11207561 | N/A | Dilution IF: 1:100 Dilution WB 1:200 See Supplementary file 9 |
| Antibody | CT RpoB Rabbit polyclonal | Ming Tang (UC Irvine) | N/A | Dilution WB 1:100 See Supplementary file 9 |
| Antibody | CT Slc1 Rabbit polyclonal | PMID:24586162 | N/A | Dilution WB 1:400 See Supplementary file 9 |
| Antibody | Hs Acetylated lysine Rabbit polyclonal | Cell signalling | Cat# 9441 RRID:AB_331805 | Dilution WB 1:4000 See Supplementary file 9 |
| Antibody | Hs Alpha tubulin clone B-5-1-2 Mouse monoclonal | Sigma-Aldrich | Cat# T5168 RRID:AB_477579 | Dilution WB 1:500 See Supplementary file 9 |
| Antibody | Flag epitope Mouse monoclonal | Sigma-Aldrich | Cat# F3165 RRID:AB_259529 | Dilution WB 1:1000 See Supplementary file 9 |
| Antibody | Flag epitope Mouse monoclonal | Sigma-Aldrich | Cat# F1804 RRID:AB_262044 | Dilution IF: 1:250 |
| Antibody | Hs GM130 Mouse monoclonal | BD Biosciences | Cat# 610822 RRID:AB_398141 | Dilution IF: 1:1000 |
| Antibody | Lys48-linkage specific polyubiquitin (D9D5) Rabbit monoclonal | Cell signalling | Cat# 8081 RRID:AB_10859893 | Dilution WB 1:1000 See Supplementary file 9 |
| Antibody | Hs MYPT1 Rabbit polyclonal | US Biological | Cat# M9925-01C RRID:AB_2927397 | Dilution IF: 1:100 |
| Antibody | Hs Ubiquitin (P4D1) Mouse monoclonal | Cell signalling | Cat# 3936 RRID:AB_331292 | Dilution IF: 1:50 |
| Antibody | V5 epitope Mouse monoclonal | Abcam | Cat# ab27671 RRID:AB_471093 | Dilution WB 1:5000 See Supplementary file 9 |
| Antibody | Hs RNF213 Rabbit Polyclonal | Sigma | Cat# HPA003347 RRID:AB_1079204 | Dilution IF: 1:1000 |
| Antibody | Rabbit IgG-HRP Goat polyclonal | ThermoFisher | Cat# 31460 RRID:AB_228341 | Dilution WB 1:1000 See Supplementary file 9 |
| Antibody | Mouse IgG-HRP Goat polyclonal | ThermoFisher | Cat# 31430 RRID:AB_228307 | Dilution WB 1:1000 See Supplementary file 9 |
| Antibody | Rabbit IgG-A488 Goat polyclonal | ThermoFisher | Cat# A-11008 RRID:AB_143165 | Dilution IF: 1:1000 |
| Antibody | Rabbit IgG-A647 Goat polyclonal | ThermoFisher | Cat# A-21244 RRID:AB_2535812 | Dilution IF: 1:1000 |
| Antibody | Mouse IgG-A488 Goat polyclonal | ThermoFisher | Cat# A-11001 RRID:AB_2534069 | Dilution IF: 1:1000 |
| Antibody | Mouse IgG-A647 Goat polyclonal | ThermoFisher | Cat# A-21235 RRID:AB_2535804 | Dilution IF: 1:1000 |
| Sequence-based reagent | See Supplementary file 10 | This paper | Primers used in this study | |
| Peptide, recombinant protein | 3xFLAG peptide | APExBIO | Cat# A6001 | Peptide for eluting Flag immunoprecipitated proteins |
| Peptide, recombinant protein | Recombinant human interferon gamma (IFNγ) | Millipore | Cat# IF005 | For inducing Type II interferon responses in cell cultures |
| Peptide, recombinant protein | LGV L2 434 Bu Cdu1 recombinant protein | Jonathan Pruneda (Oregon Health and Science University) | N/A | Recombinant Cdu1 protein used to generate Rabbit polyclonal antibodies against Cdu1 |
| Commercial assay or kit | TargeTron gene knockout system | Sigma-Aldrich | Cat# TA0100 | Kit for generating cdu1::GII null strain |
| Chemical compound, drug | PR-619 (DUB inhibitor) | Sigma-Aldrich | Cat# SML0430 | Used during TUBE affinity enrichment |
| Chemical compound, drug | MG132 | Sigma-Aldrich | Cat# 474791 | Proteasome inhibitor |
| Chemical compound, drug | TUBE-1 | LifeSensors | Cat# UM401M | Pan-polyubiquitination affinity capture reagent |
| Chemical compound, drug | Acti-stain 488 (Phalloidin 488) | Cytoskeleton Inc. | Cat# PHDG1 | Reagent for visualizing Actin by IF |
| Chemical compound, drug | ChromoTek GFP-Trap Agarose | Proteintech | Cat# gta | Agarose for immunoprecipitating GFP tagged proteins |
| Chemical compound, drug | Protein A/G PLUS-Agarose | Santa Cruz Biotechnology | Cat# sc-2203 | Agarose for immunoprecipitations |
| Software | Targetronics | Targetronics, LLC; https://www.targetrons.com/ | Algorithm for generating TargeTron homing sequences | |
| Software | Proteome Discoverer 2.3 | Thermo Fisher; https://www.thermofisher.com/in/en/home/industrial/mass-spectrometry/liquid-chromatography-mass-spectrometry-lc-ms/lc-ms-software/multi-omics-data-analysis/proteome-discoverer-software.html | Proteomics software | |
| Software | Mascot software | Matrix Science; https://www.matrixscience.com | Proteomics software | |
| Software | MaxQuant 1.6.2.3 | https://www.maxquant.org | Proteomics software | |
| Software | Scaffold PTM | Proteome Software; https://www.proteomesoftware.com/products/scaffold-ptm | Software for viewing proteomics data | |
| Software | VolcaNoseR | PMID:33239692; https://huygens.science.uva.nl/VolcaNoseR/ | Online software for generating volcano plots | |
| Software | Metascape | PMID:30944313; https://metascape.org/gp/index.htm#/main/step1 | Online program for Gene Ontology clustering | |
| Software | DAVID Bioinformatic Resources | PMID:19033363; PMID:19131956 https://david.ncifcrf.gov/tools.jsp | Online program for Gene Ontology clustering | |
| Software | Image J | PMID:22930834; https://imagej.nih.gov/ij/ | Software for image viewing and processing | |
| Software | NEBaseChanger | New England Biolabs; https://nebasechanger.neb.com | Cloning website | |
| Software | Prism 9 | GraphPad; https://www.graphpad.com/updates/prism-900-release-notes | Software for statistical analysis | |
| Software | HCS Studio Cell Analysis Software | Thermo Fischer Scientific | Cat# CX51110 | Software for high content image analysis |
Additional files
-
Supplementary file 1
TUBE1 co-precipitating proteins mass spectrometry data for all biological replicates.
- https://cdn.elifesciences.org/articles/87386/elife-87386-supp1-v1.xlsx
-
Supplementary file 2
Numerical data used to generate all volcano plots.
- https://cdn.elifesciences.org/articles/87386/elife-87386-supp2-v1.xlsx
-
Supplementary file 3
Numerical mass spectrometry data used to identify high confidence TUBE1 human co-precipitating proteins.
- https://cdn.elifesciences.org/articles/87386/elife-87386-supp3-v1.xlsx
-
Supplementary file 4
Numerical data for Gene Ontology (GO) classification of TUBE1 human co-precipitating proteins.
- https://cdn.elifesciences.org/articles/87386/elife-87386-supp4-v1.xlsx
-
Supplementary file 5
Numerical mass spectrometry data used to identify high confidence TUBE1 Chlamydia co-precipitating proteins.
- https://cdn.elifesciences.org/articles/87386/elife-87386-supp5-v1.xlsx
-
Supplementary file 6
Human ubiquitinated peptides mass spectrometry data.
- https://cdn.elifesciences.org/articles/87386/elife-87386-supp6-v1.xlsx
-
Supplementary file 7
Chlamydia ubiquitinated peptides mass spectrometry data.
- https://cdn.elifesciences.org/articles/87386/elife-87386-supp7-v1.xlsx
-
Supplementary file 8
Numerical mass spectrometry data used tp identify high confidence ubiquitinated proteins.
- https://cdn.elifesciences.org/articles/87386/elife-87386-supp8-v1.xlsx
-
Supplementary file 9
Antibodies used in this study.
- https://cdn.elifesciences.org/articles/87386/elife-87386-supp9-v1.docx
-
Supplementary file 10
Primer sequences used in this study.
- https://cdn.elifesciences.org/articles/87386/elife-87386-supp10-v1.xlsx
-
MDAR checklist
- https://cdn.elifesciences.org/articles/87386/elife-87386-mdarchecklist1-v1.pdf
Download links
A two-part list of links to download the article, or parts of the article, in various formats.
Downloads (link to download the article as PDF)
Open citations (links to open the citations from this article in various online reference manager services)
Cite this article (links to download the citations from this article in formats compatible with various reference manager tools)
The acetylase activity of Cdu1 regulates bacterial exit from infected cells by protecting Chlamydia effectors from degradation
eLife 12:RP87386.
https://doi.org/10.7554/eLife.87386.3


