Bactabolize is a tool for high-throughput generation of bacterial strain-specific metabolic models
- Department of Infectious Diseases, Central Clinical School, Monash University, Australia
- Microbiology Unit, Alfred Health, Australia
- Department of Bioengineering, University of California, San Diego, United States
- Department of Infection Biology, London School of Hygiene & Tropical Medicine, United Kingdom
Figures
Figure 1 with 4 supplements
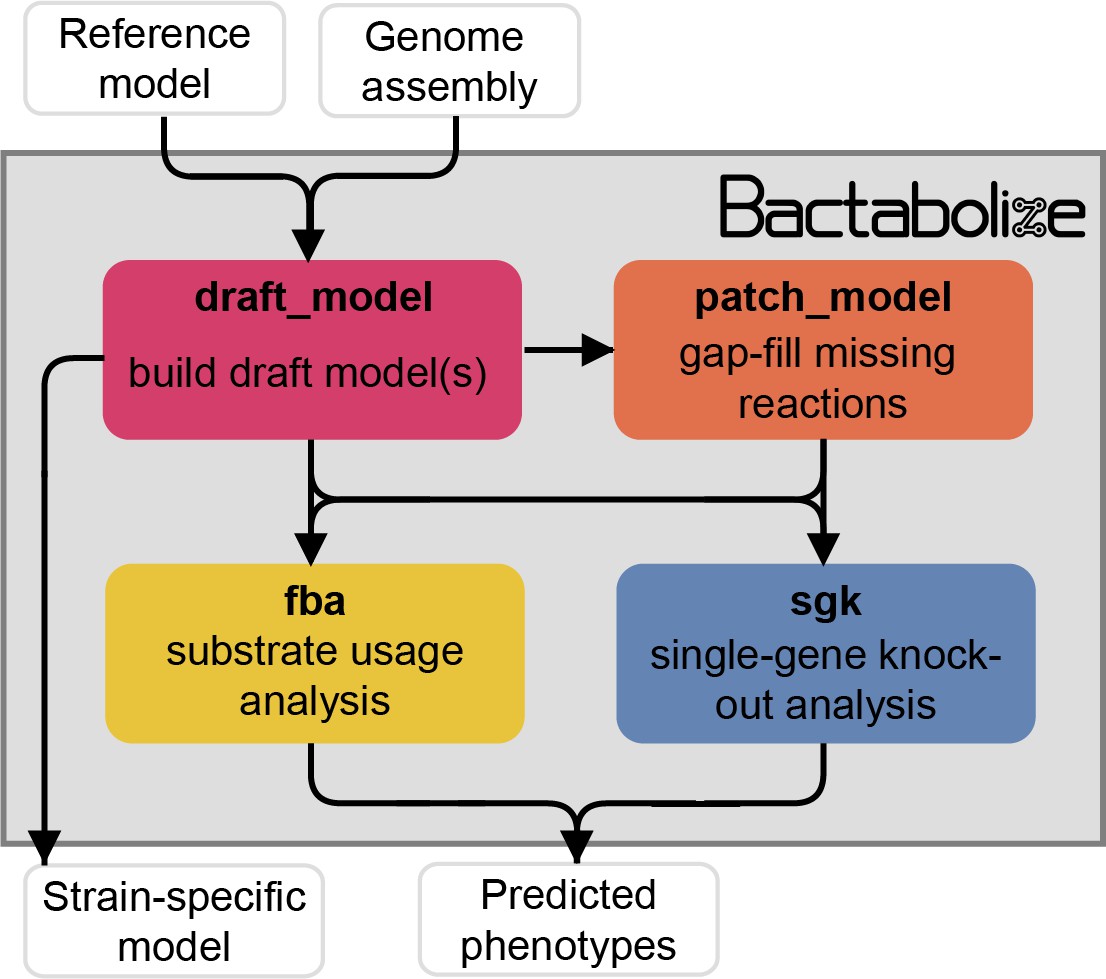
Simplified overview of Bactabolize’s main commands.
In pink is the draft_model command, which builds a draft strain-specific metabolic model using an input reference model and an input target assembly (approach adapted from Norsigian et al., 2020). If the model fails to simulate growth, Bactabolize will attempt automated gap-filling and produce a model patch file. The patch_model command (orange) allows the addition of missing reactions to produce a valid draft model that can simulate growth in a user-specified growth environment. A functioning model can be passed to the fba command (yellow), which performs Flux Balance Analysis to simulate growth in the user specified conditions, across all carbon, nitrogen, phosphorus, and sulphur metabolite sources supported by the model under aerobic and anerobic conditions. The sgk command (blue) shows the single-gene knockout analysis, which outputs a predicted phenotype. User inputs and outputs are shown in white boxes while Bactabolize commands are shown inside the grey box. Additional graphics can be found in Figure 1—figure supplements 1–4.
Figure 1—figure supplement 1
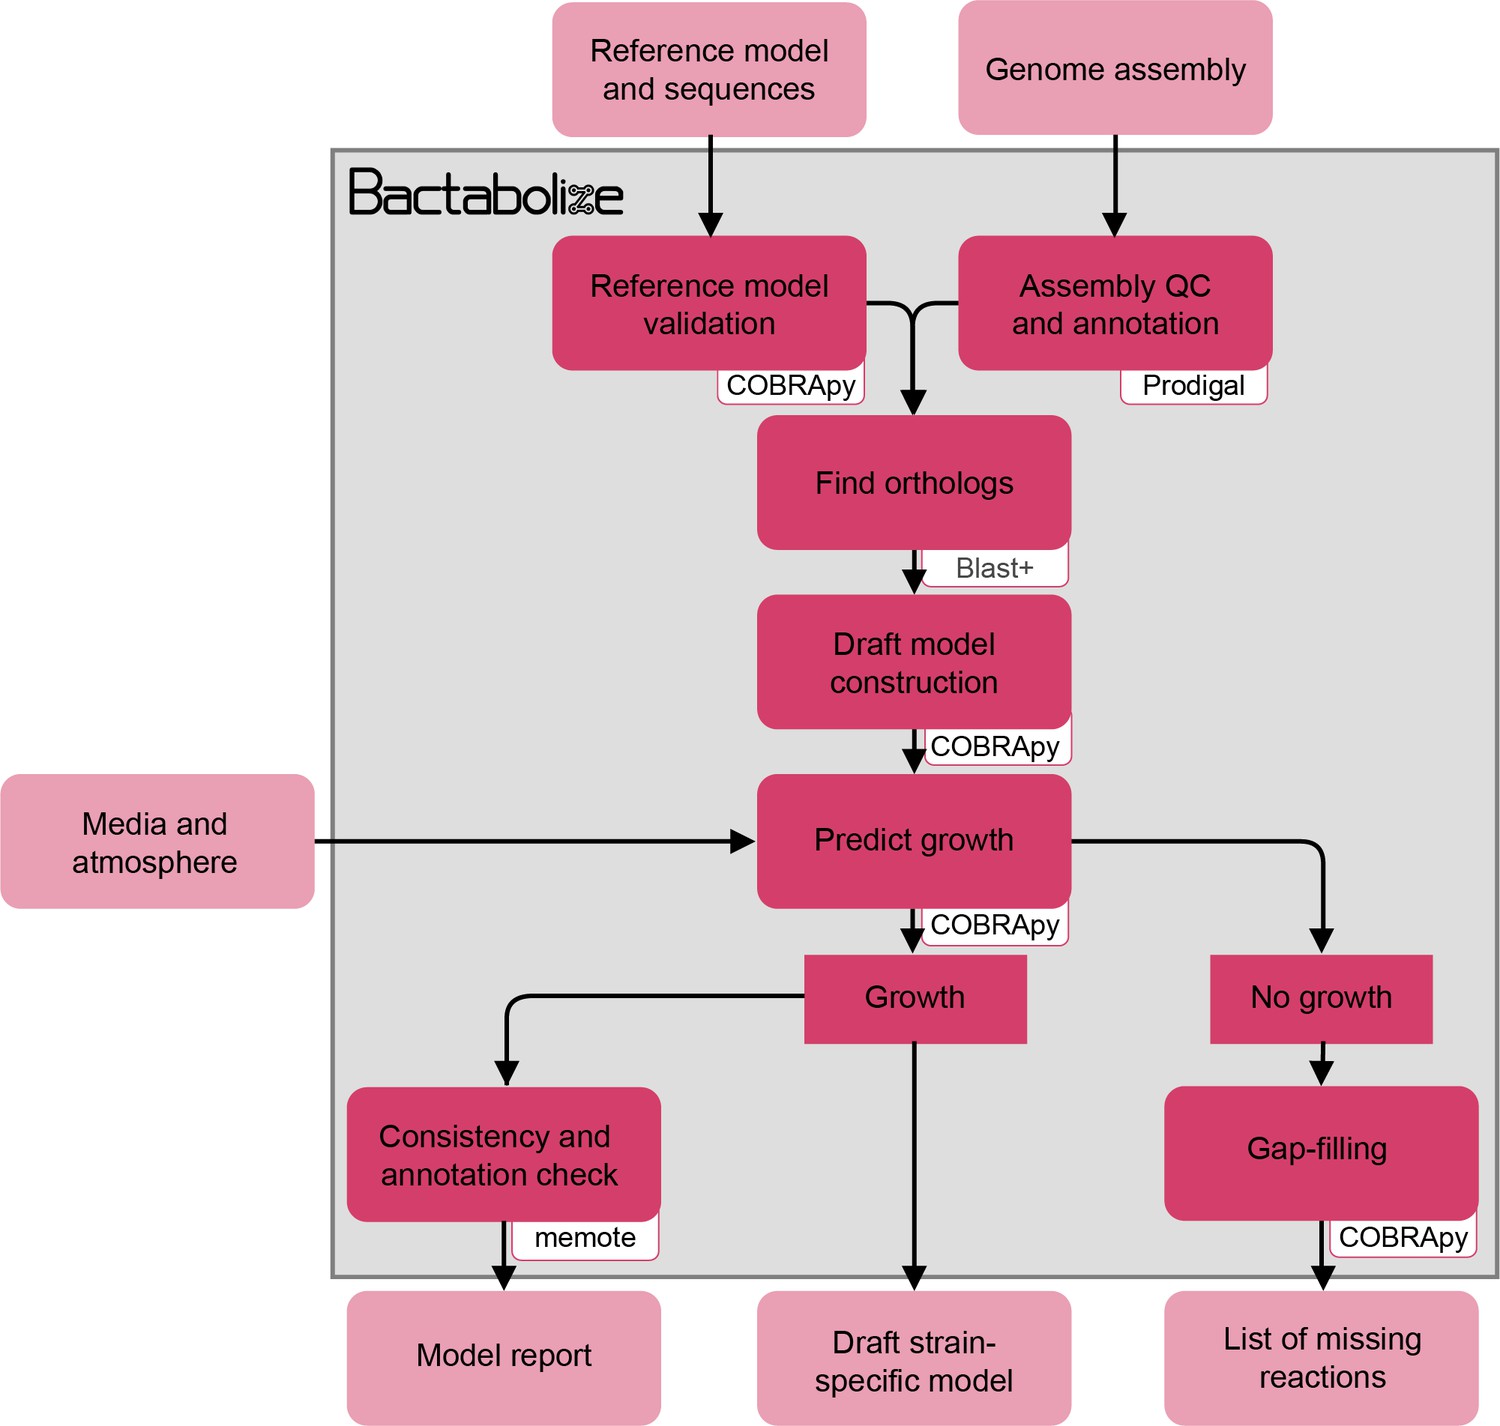
Flow diagram showing the overview of the draft_model module from Bactabolize, which produces draft metabolic models.
Input and output files are shown in light pink while Bactabolize processes are shown in dark pink. Third-party dependencies are indicated within the white boxes.
Figure 1—figure supplement 2
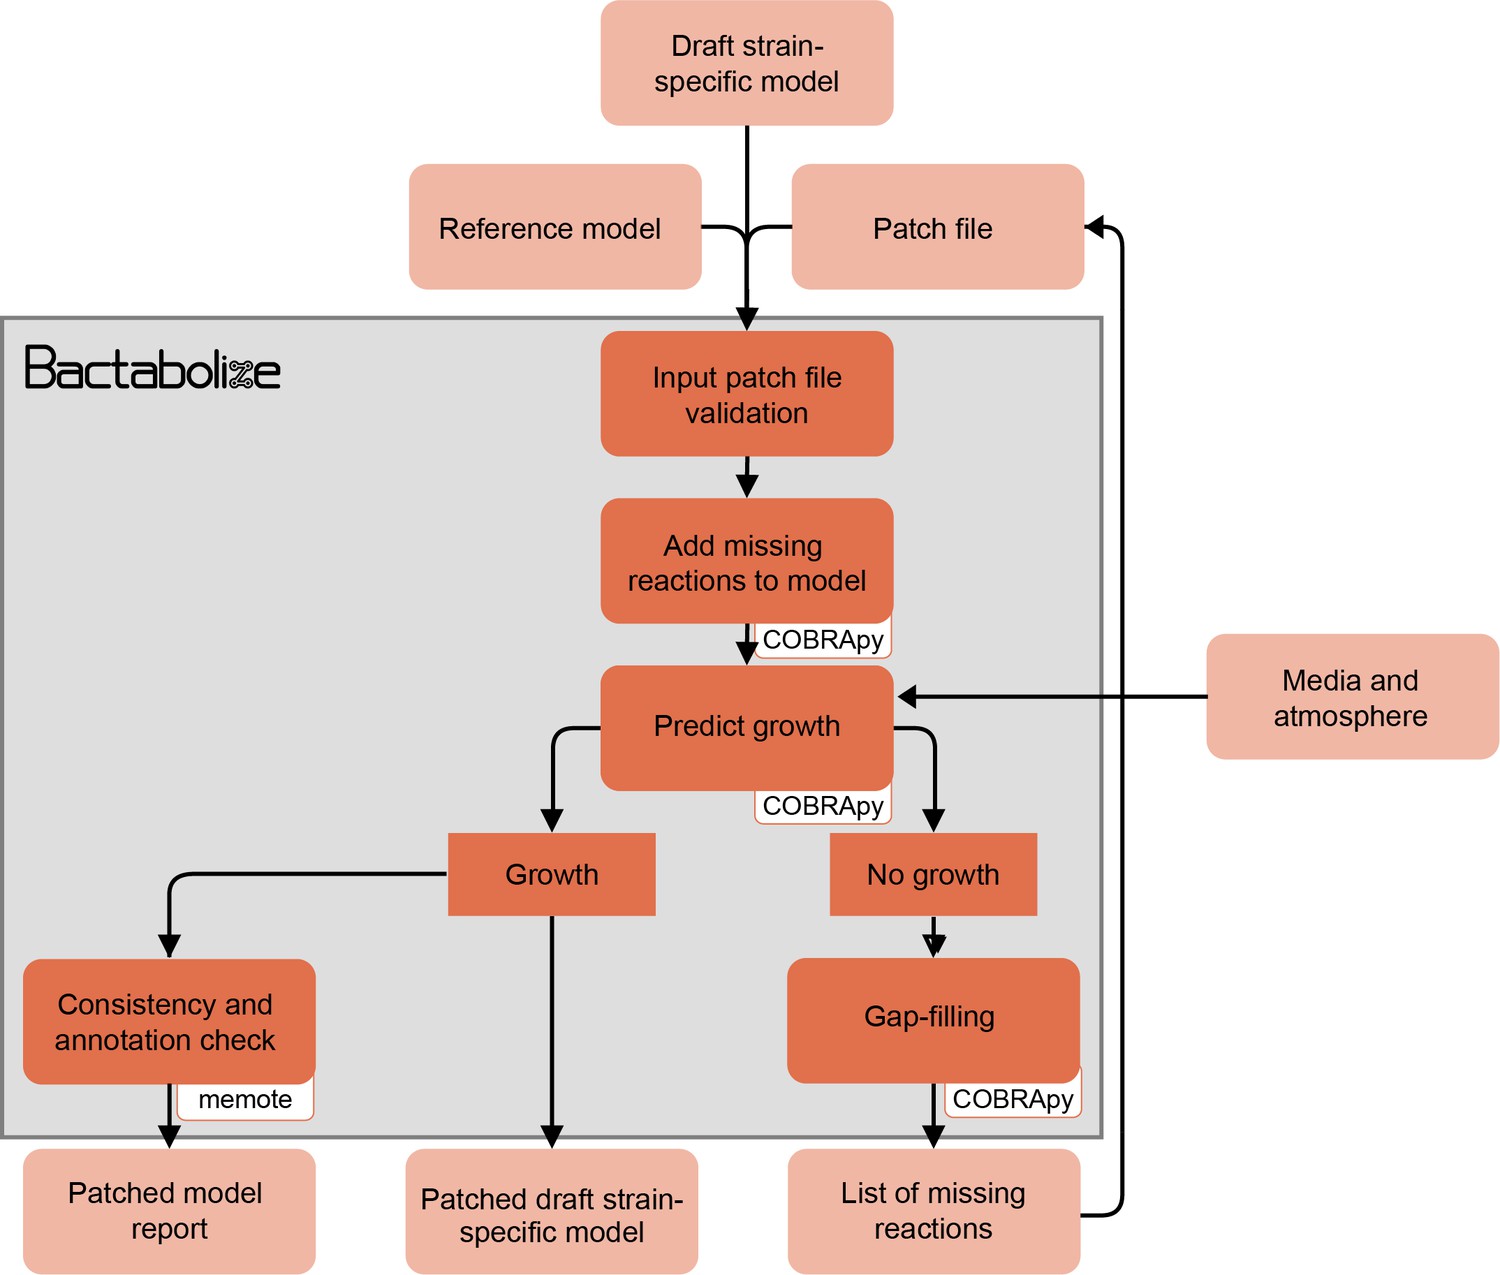
Flow diagram showing the overview of the patch_model module from Bactabolize, which patches metabolic models that do not simulate growth.
Input and output files are shown in light orange while Bactabolize processes are shown in dark orange. Third-party dependencies are indicated within the white boxes.
Figure 1—figure supplement 3

Flow diagram showing the overview of the fba module from Bactabolize, which performs growth simulations using Flux Balance Analysis.
Input and output files are shown in light yellow while Bactabolize processes are shown in dark yellow. Third-party dependencies are indicated within white boxes. C, carbon; N, nitrogen, P, phosphorus; S, sulphur; O2, oxygen.
Figure 1—figure supplement 4
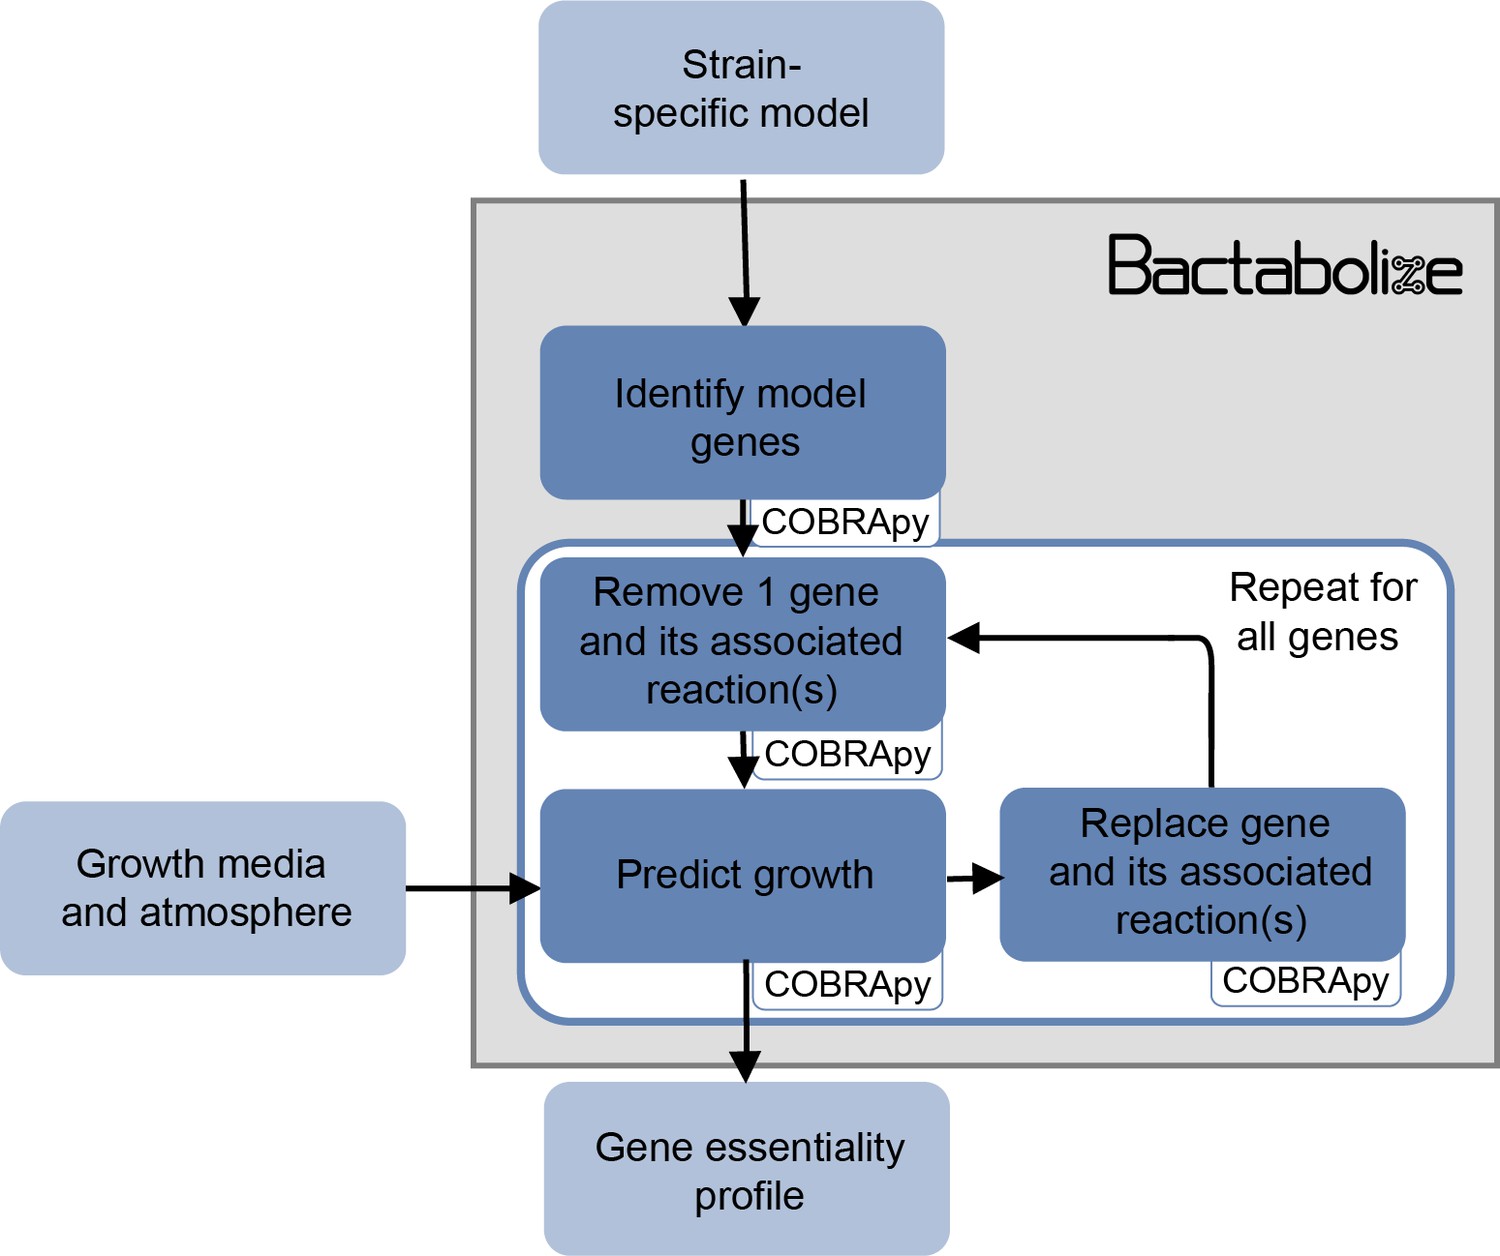
Flow diagram showing the overview of the sgk module from Bactabolize, which performs single-gene knockout analysis.
Input and output files are shown in light blue while Bactabolize processes are shown in dark blue. Third-party dependencies are indicated within white boxes.
Figure 2 with 2 supplements
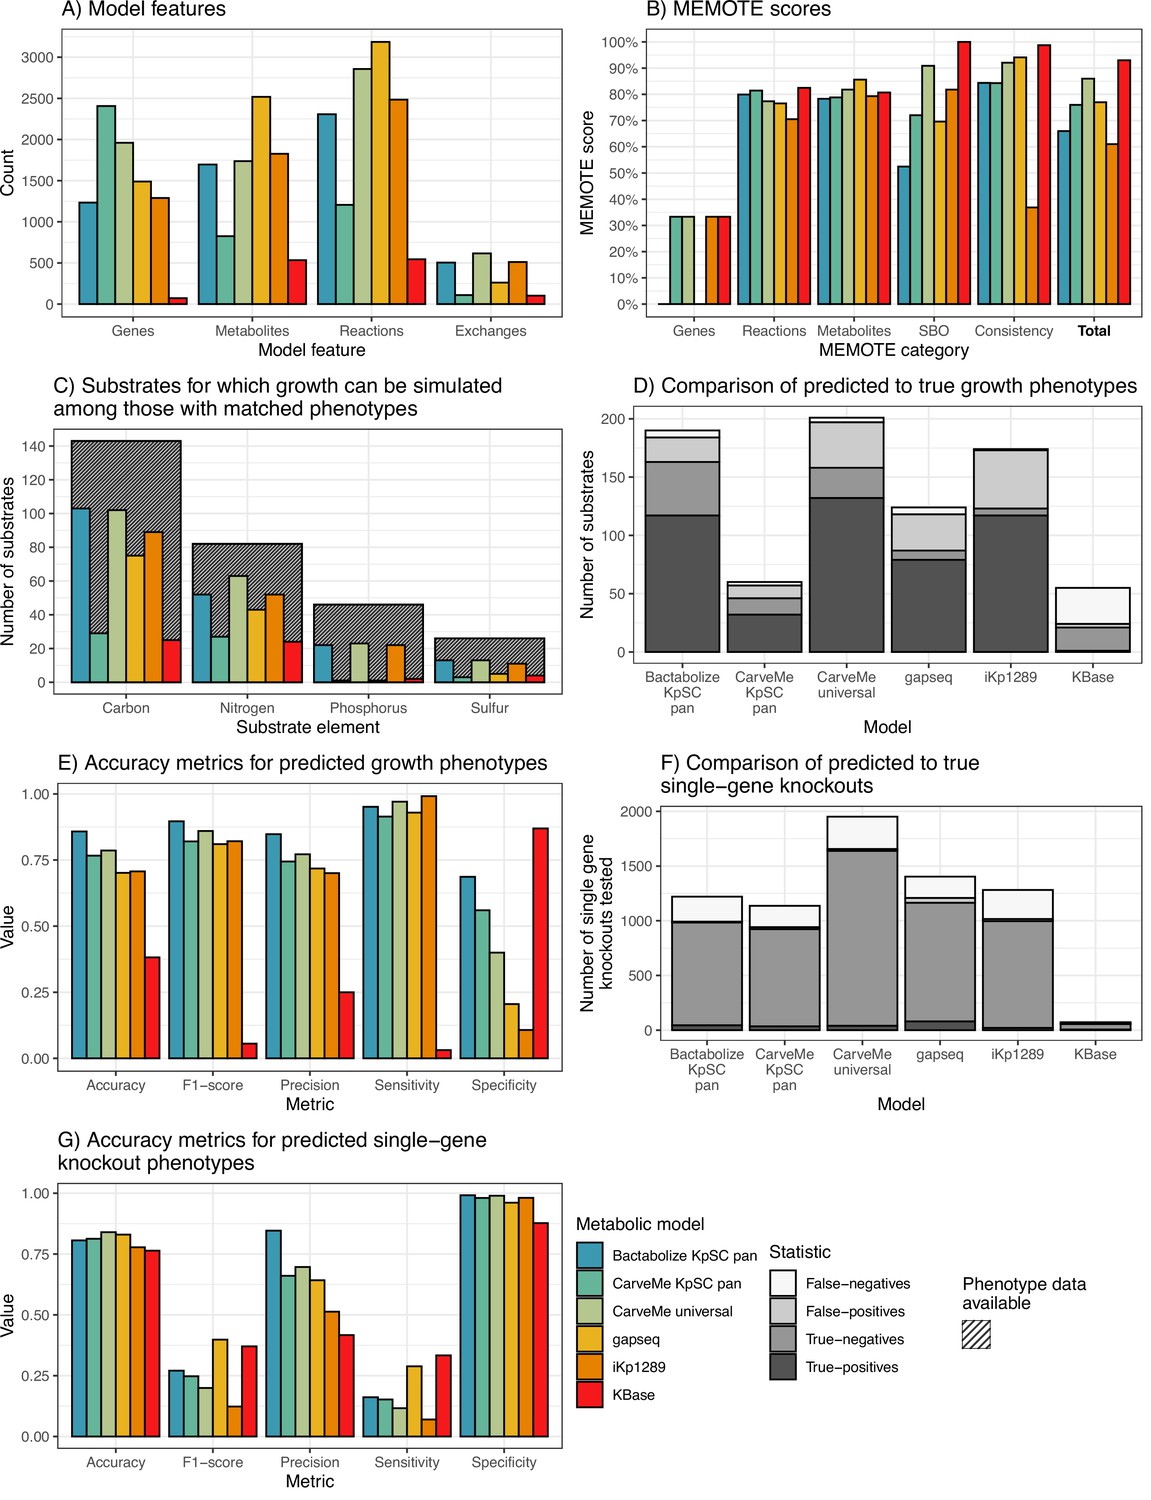
K. pneumoniae KPPR1 metabolic model benchmarking comparisons.
(A) Counts of model features: genes, metabolites, and reactions captured by each model. Exchanges refer to number of exchange reactions, a subset of reactions involved in substrate uptake, which determine the number of distinct growth substrates for which phenotypes can be predicted with the model. (B) MEMOTE scores indicating the richness of annotations and metadata for metabolic model features according to database outlinks. SBO refers to score of Systems Biology Ontology (SBO), a controlled vocabulary for systems biology. Consistency refers to the score of stoichiometric consistency and chemical formulae annotation. Total refers to total MEMOTE score, as a combination of all previous scores, and is shown in bold. (C) Counts of carbon, nitrogen, phosphorus, and sulphur growth substrates that can be simulated by models and for which matched phenotypes were available for comparison (Henry et al., 2017). Hatched columns indicate the total number of substrates for which phenotypic data for K. pneumoniae KPPR1 were described (Henry et al., 2017). (D and E) Accuracy metrics for predicted to true phenotypes for the growth substrates shown in D and E, respectively. False-negatives, true-negatives, false-positives, and true-positives are coloured as shown in legend. (F and G) Accuracy metrics for the KPPR1 single-gene knockout mutant library described in Short et al., 2020 as shown in F and G, respectively. Numbers of true-positives and false-positives are shown to the left of the respective columns. Figure 2—source data 1 and Figure 2—figure supplements 1–2 contain additional data.
-
Figure 2—source data 1
Data table showing single-gene knockout summary of each model.
- https://cdn.elifesciences.org/articles/87406/elife-87406-fig2-data1-v1.xlsx
Figure 2—figure supplement 1
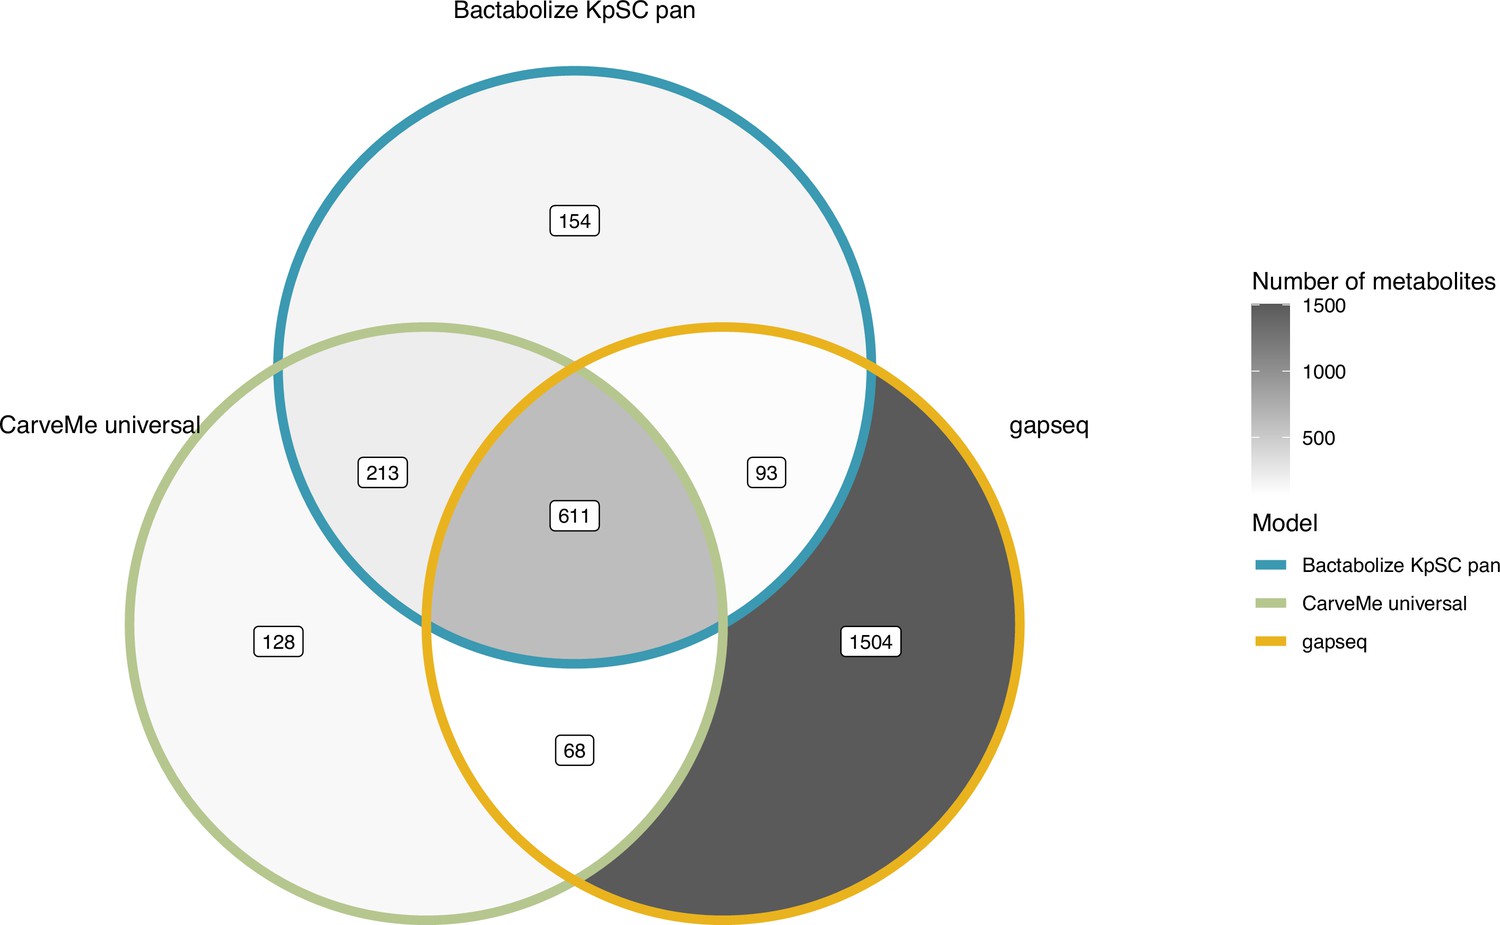
Venn diagram comparing the metabolite output of the best-performing tools for K. pneumoniae KPPR1.
Figure 2—figure supplement 2
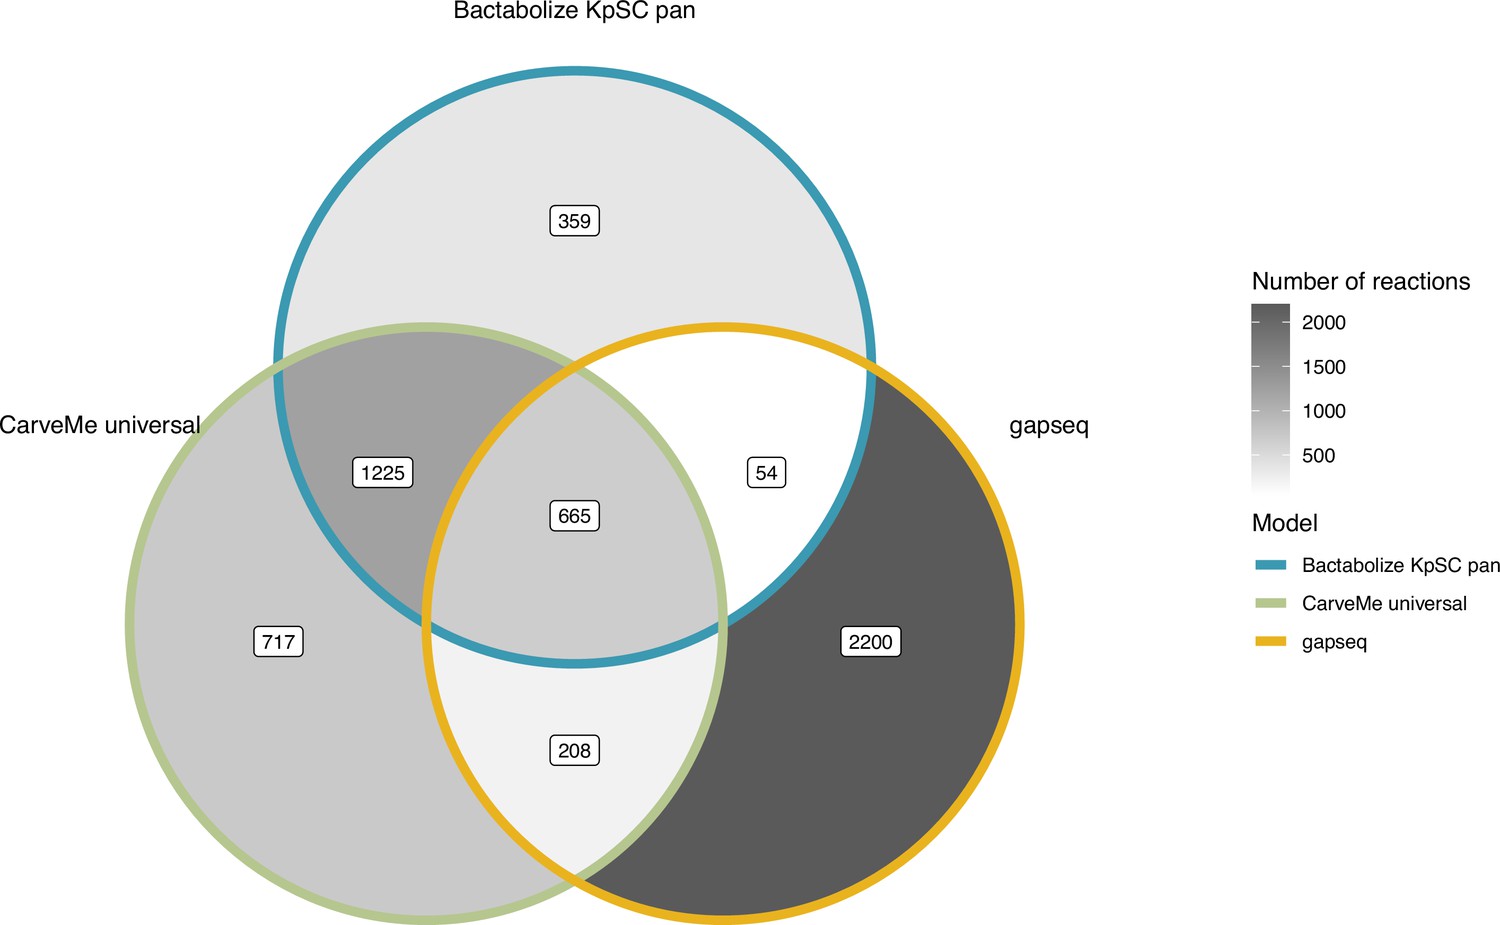
Venn diagram comparing the reactions output of the best-performing tools for K. pneumoniae KPPR1.
Figure 3 with 1 supplement

Scatterplots showing distribution of best-performing assembly metrics ‘assembly graph dead-ends’, ‘contigs’, and ‘N50’ against model feature capture (genes and reactions).
Each point represents the mean values from a single genome (technical triplicate) and is coloured by model quality. ‘Good’ models capture ≥99% of the model metric as compared to the corresponding complete model (shown at each facet), ‘Bad’ models capture <99%. Cubic polynomial line plotted for assembly ‘graph dead-ends’, ‘contigs’, while a segmented linear model was plotted for ‘N50’. R2 is shown on each panel. Figure 3—source data 1 contains additional data.
-
Figure 3—source data 1
Data table showing assembly metrics and model completeness.
- https://cdn.elifesciences.org/articles/87406/elife-87406-fig3-data1-v1.xlsx
Figure 3—figure supplement 1
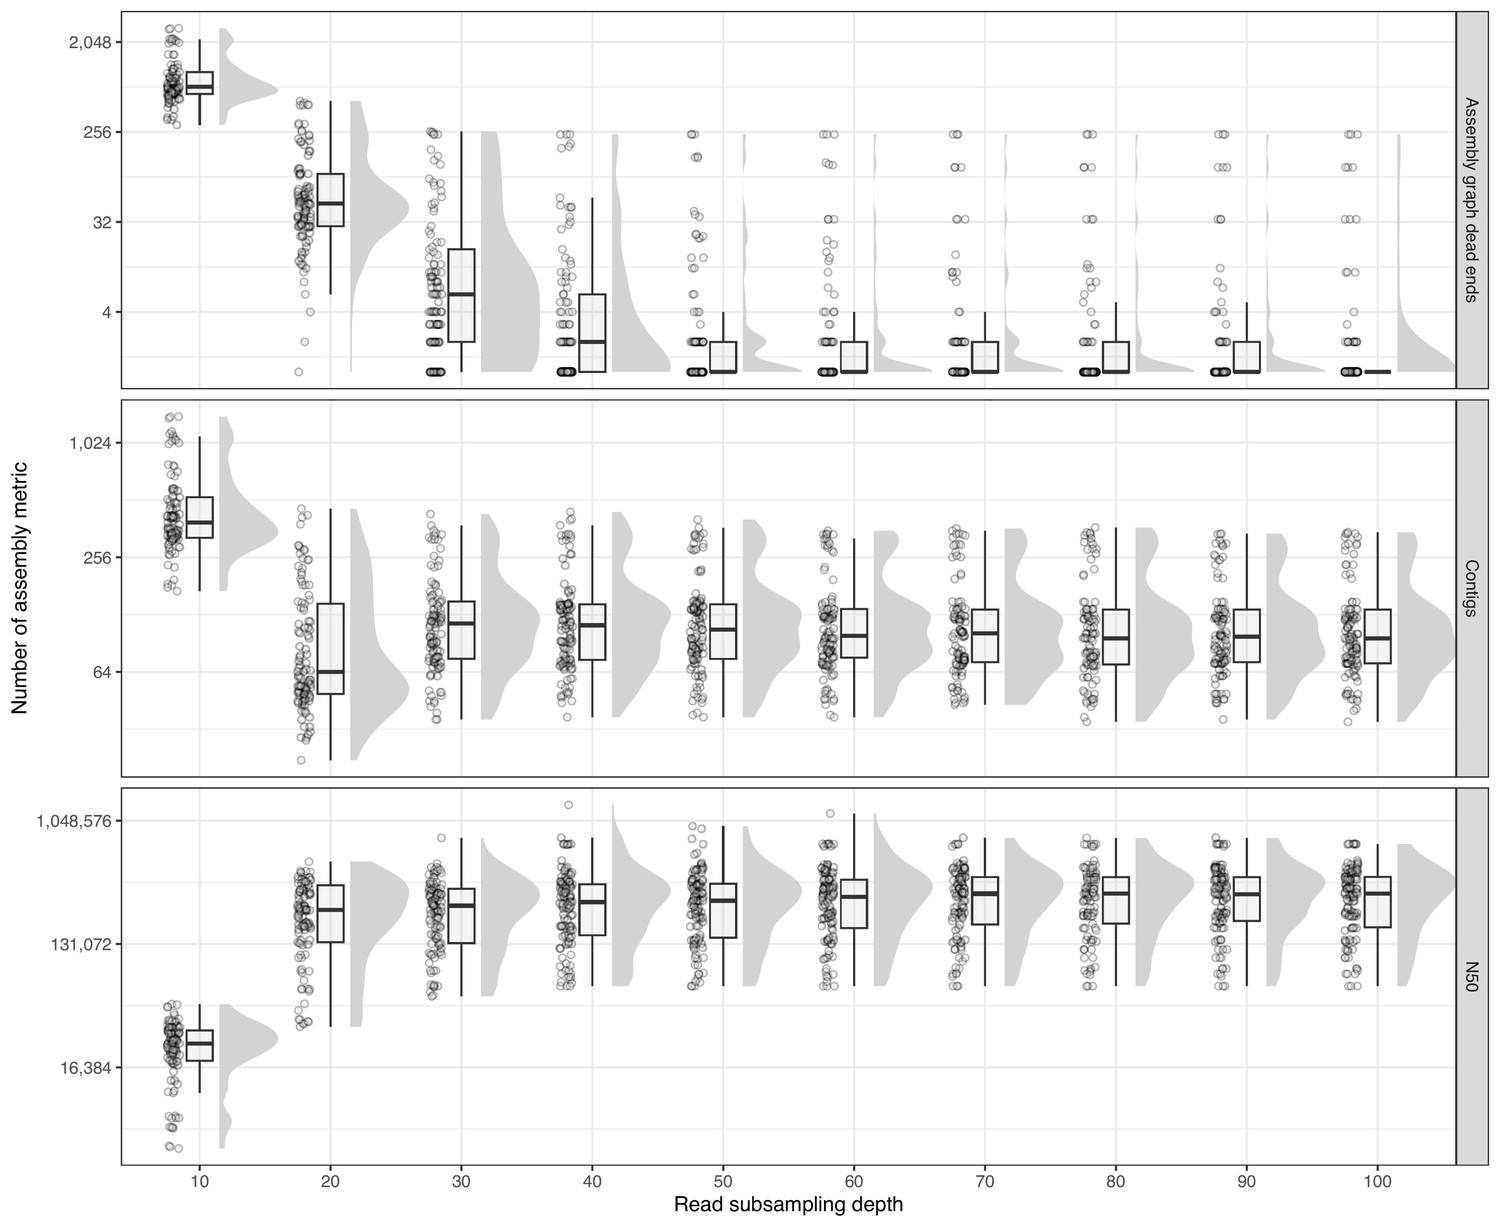
Raincloud plot showing distributions of assembly metrics across various read subsampling depths (10× increments).
Figure 4 with 1 supplement
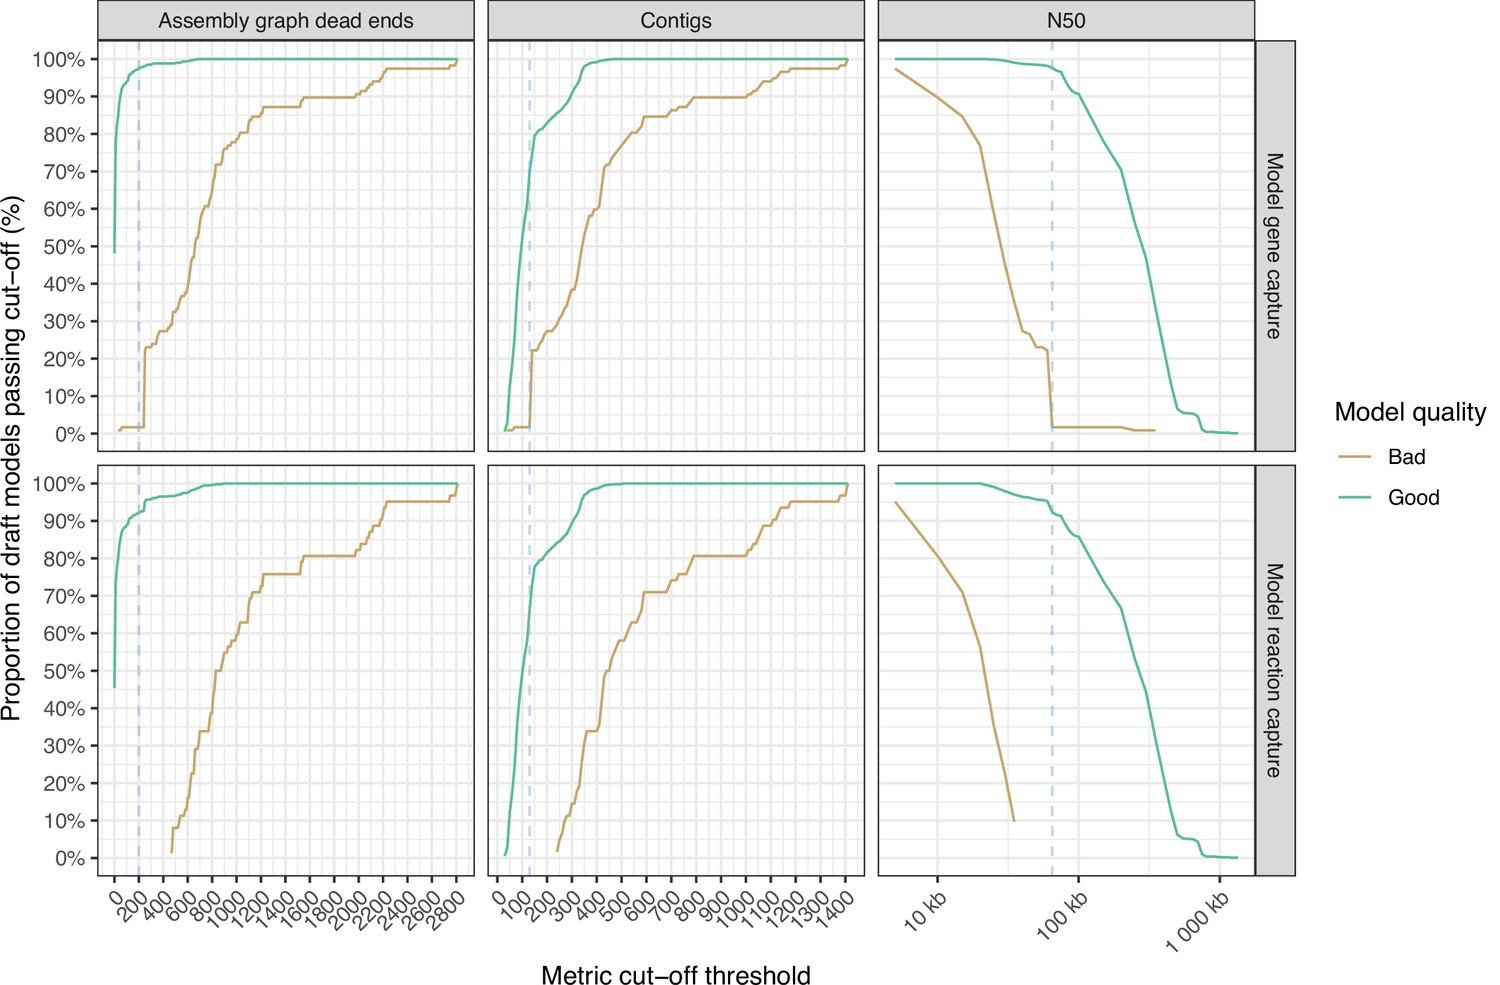
Line graphs showing the impact of assembly metric cut-off thresholds on model feature capture (n=1040).
‘Good’ models which captured ≥99% of model features are shown in green, while ‘bad’ models captured <99% model features are shown in gold. The blue dotted line shows the metric cut-off thresholds, to minimise the number of models that capture <99% model features and maximise models that capture ≥99%. Metric cut-off statistics are calculated in intervals of 10 for assembly graph dead-ends and contigs, and every 5000 for N50.
Figure 4—figure supplement 1
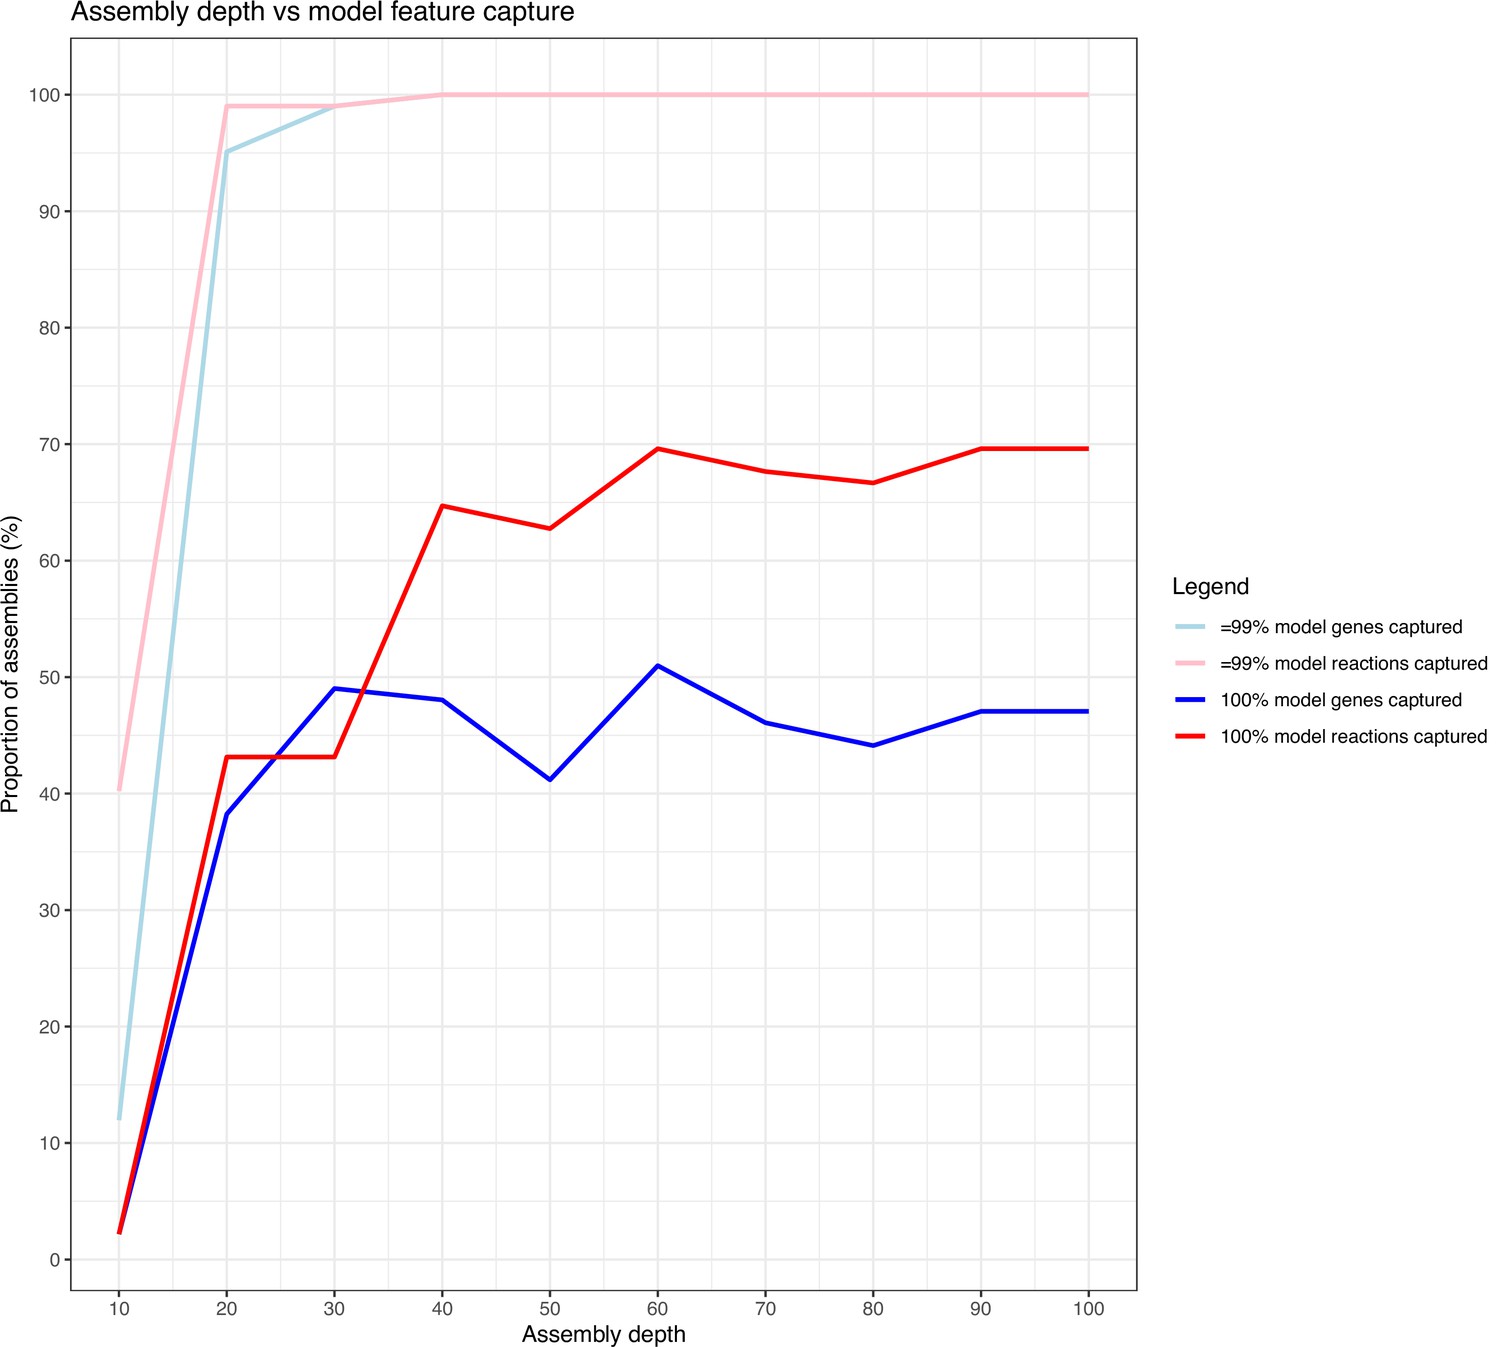
Line graph showing the capture of model features of draft assemblies (short-read only) at various depths, compared to the corresponding completed genome (long-read+short-read assemblies).
Figure 5
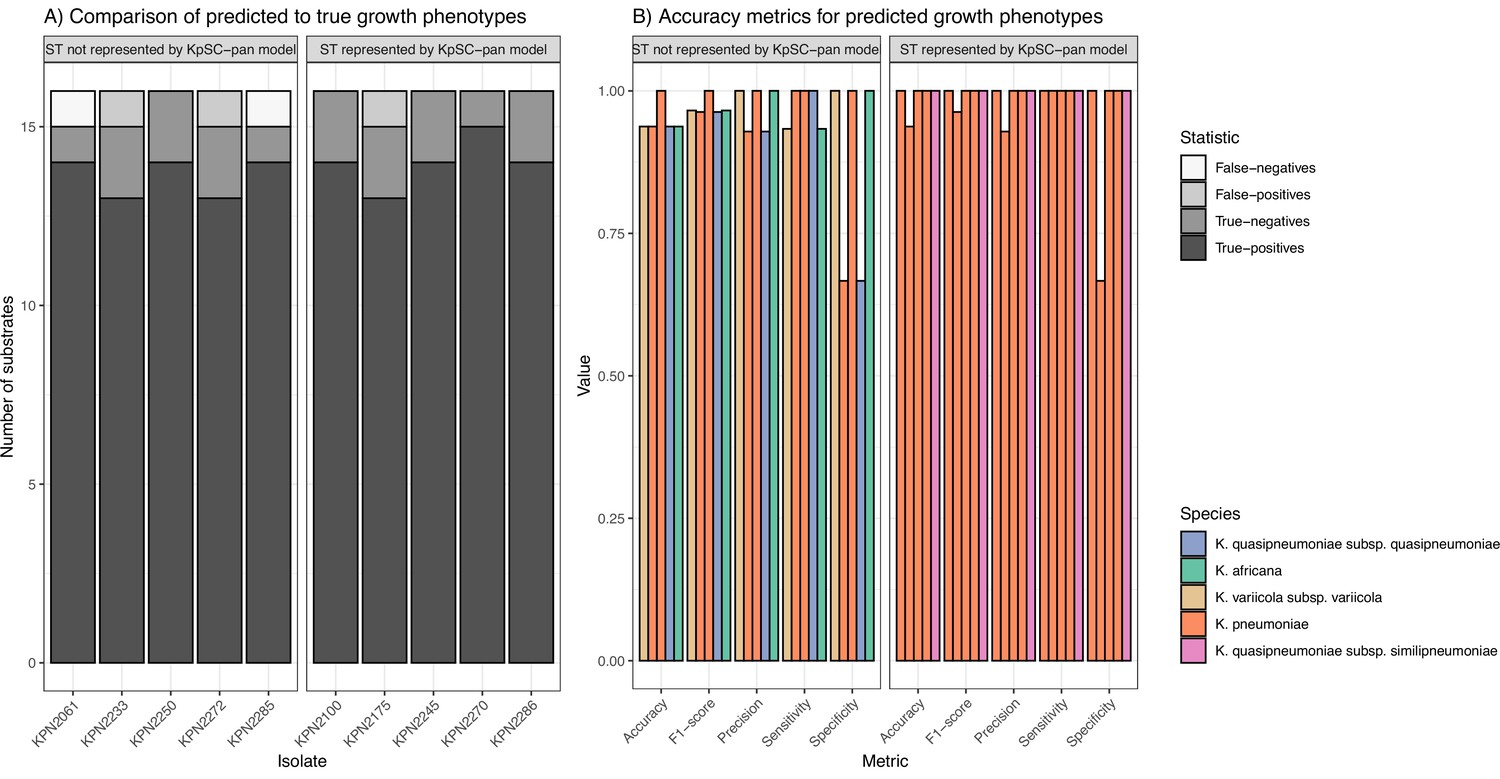
Accuracy of predicted growth phenotypes using additional isolates.
(A) Comparisons of predicted to true phenotypes for 16 carbon source substrates. False-negatives, true-negatives, false-positives, and true-positives are coloured as shown in legend. Each column represents a different isolate, separated by ST representation in the K. pneumoniae species complex (KpSC)-pan model. (B) Accuracy metrics for predicted vs phenotypic growth comparisons shown in A. Each column represents a different isolate, coloured by taxa and separated by ST representation in the KpSC-pan v1 model. Additional information can be found in Figure 5—source data 1.
-
Figure 5—source data 1
Growth phenotyping results for 10 isolates used for validation.
- https://cdn.elifesciences.org/articles/87406/elife-87406-fig5-data1-v1.xlsx
Tables
Key resources table
| Reagent type (species) or resource | Designation | Source or reference | Identifiers | Additional information |
|---|---|---|---|---|
| Software, algorithm | Bactabolize | This study – Data availability section | Software | |
| Software, algorithm | Cobrapy | Ebrahim et al., 2013 | Software | |
| Strain, strain background | K. pneumoniae KPN2061, KPN2100, KPN2175, KPN2233, KPN2245, KPN2250, KPN2270, KPN2272, KPN2285, KPN2286 | This study – See Source data 1 and Figure 5—source data 1 for details and accessions | Isolates used to validate Bactabolize | |
| Commercial assay or kit | VITEK 2 GN ID cards | bioMérieux | Method used to validate Bactabolize |
Additional files
-
Supplementary file 1
Faceted graphs showing the number of substrate usage (fba module) discrepancies of gap-filled models (patch_model module) which initially did not produce biomass (models which failed to simulate growth).
The dots indicate percentage concordance with the completed genome model, while the columns indicate number of substrates with discrepancies (no simulated growth in patched model, but growth in completed genome model).
- https://cdn.elifesciences.org/articles/87406/elife-87406-supp1-v1.pdf
-
MDAR checklist
- https://cdn.elifesciences.org/articles/87406/elife-87406-mdarchecklist1-v1.docx
-
Source data 1
Table showing all BIOLOG phenotypic growth data.
- https://cdn.elifesciences.org/articles/87406/elife-87406-data1-v1.xlsx
Download links
A two-part list of links to download the article, or parts of the article, in various formats.
Downloads (link to download the article as PDF)
Open citations (links to open the citations from this article in various online reference manager services)
Cite this article (links to download the citations from this article in formats compatible with various reference manager tools)
Bactabolize is a tool for high-throughput generation of bacterial strain-specific metabolic models
eLife 12:RP87406.
https://doi.org/10.7554/eLife.87406.3


