Adolescent neurostimulation of dopamine circuit reverses genetic deficits in frontal cortex function
- Unit on Neural Circuits and Adaptive Behaviors, National Institute of Mental Health, United States
- Department of Neuroscience, Del Monte Institute for Neuroscience, University of Rochester Medical Center, United States
- Department of Neuroscience, Mahoney Institute for Neurosciences, Perelman School of Medicine, University of Pennsylvania, United States
Figures
Figure 1 with 1 supplement
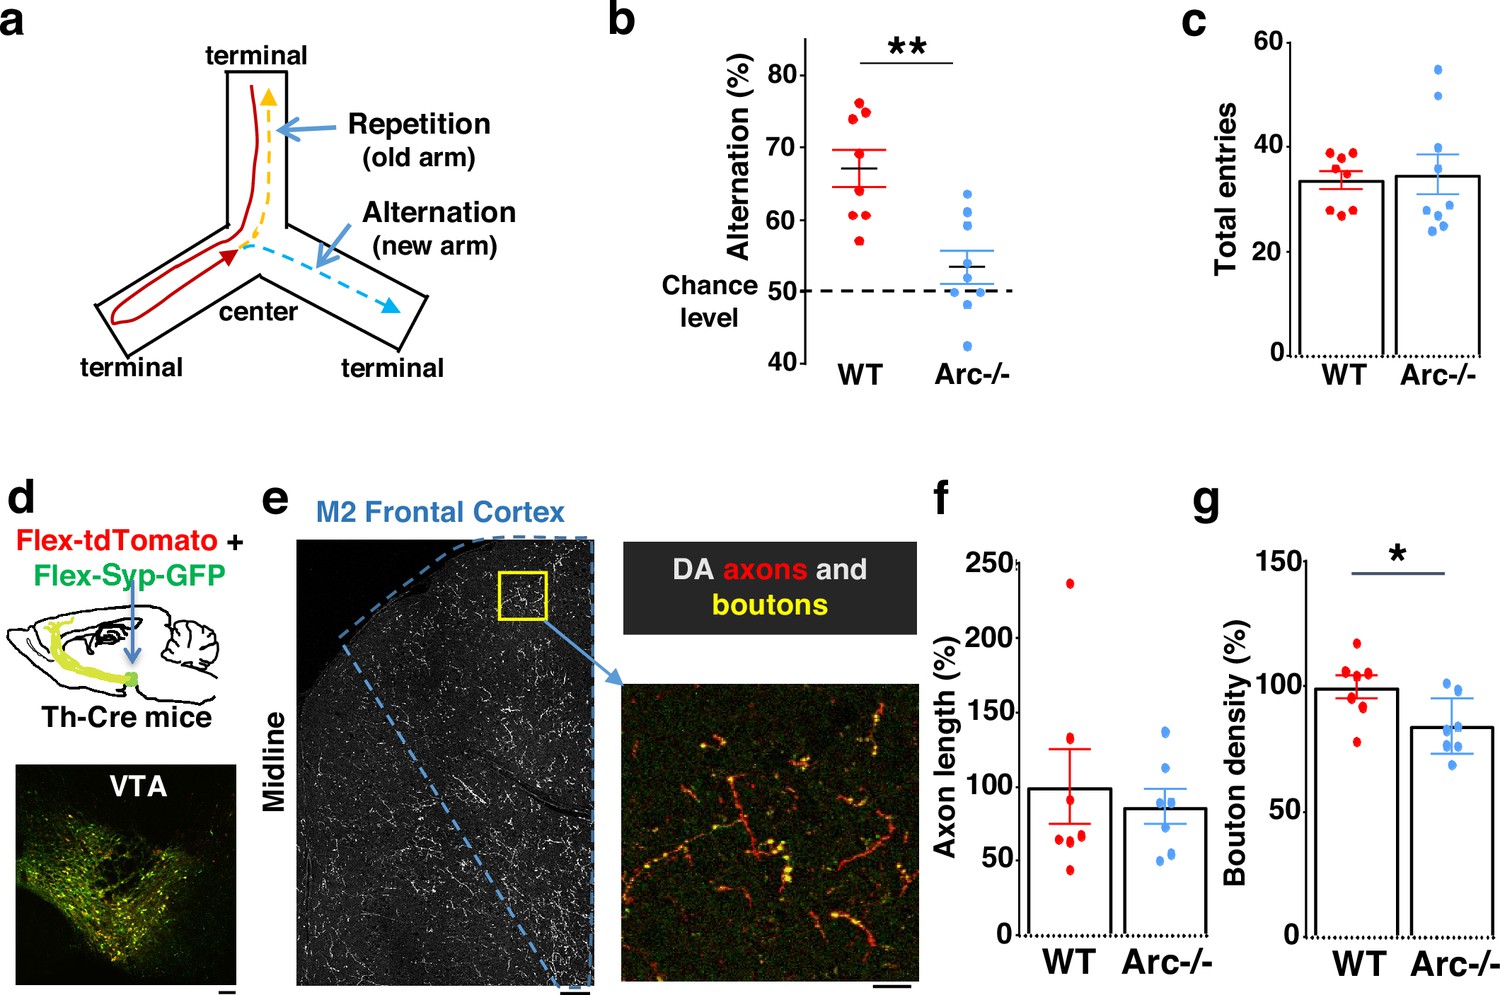
Characterization of cognitive and mesofrontal deficits in Arc mutant mice.
(a) Diagram showing the navigation choices for mice in a Y-maze. At the center of the maze, a mouse has a choice to enter either a new arm (alternation) or a previously visited old arm. (b) Alternation percentage in the Y-maze task showing significant reduction in the Arc-/- animals compared to wild-type animals (**p=0.001, t-test, t(15)=3.975, WT N=8, Arc-/- N=9 mice, both groups passed Shapiro-Wilk normality test at alpha = 0.05). (c) Total arm entries are comparable between Arc-/- and WT. (d) Top, schematic for AAV injection in Th-Cre animals to label dopaminergic neurons. Bottom, confocal image showing tdTomato (red) and SypGFP (green) labeling in the ventral tegmental area (VTA). Scale bar, 100 µm. (e) Left, confocal image showing labeled dopaminergic axons in the frontal cortex. The dotted line indicates the region-of-interest for M2. Scale bar, 100 µm. Right, zoomed-in region showing labeled axons (tdTomato, red) and boutons (tdTomato+SypGFP, yellow). Scale bar, 20 µm. (f, g) The normalized axon length (f) is not significantly different. The normalized bouton density (g) is significantly reduced in Arc-/- animals compared to WT (*p=0.034, t-test, t(12)=2.393, N=7 mice for each group). The axon length is normalized by the number of labeled cells in VTA, the bouton density is normalized by the axon length, and both are expressed as a percentage of the group average in WT mice. All the error bars indicate SEM.
-
Figure 1—source data 1
Characterization of cognitive and mesofrontal deficits in Arc mutant mice.
- https://cdn.elifesciences.org/articles/87414/elife-87414-fig1-data1-v1.xlsx
Figure 1—figure supplement 1

Chemogenetic inhibition of M2 frontal cortex reduces alternation in Y-maze.
(a) Confocal image showing expression of control mCherry or DREADD-Gi-mCherry in M2 frontal cortex. Scale bar, 500 µm. (b) Alternation in the Y-maze task showing significant reduction in the Gi animals compared to control animals (*p=0.017, t-test, t(10)=2.845, Gi N=6, Ctrl N=6, including three saline control in Gi-labeled mice (pink dots) and three mCherry control with CNO injection (red dots). These two control groups showed no significant difference, and their data were pooled together). (c) Total arm entries and (d) left-right turns (percentage of right turns shown) are not significantly different. All the error bars indicate SEM.
Figure 2 with 2 supplements
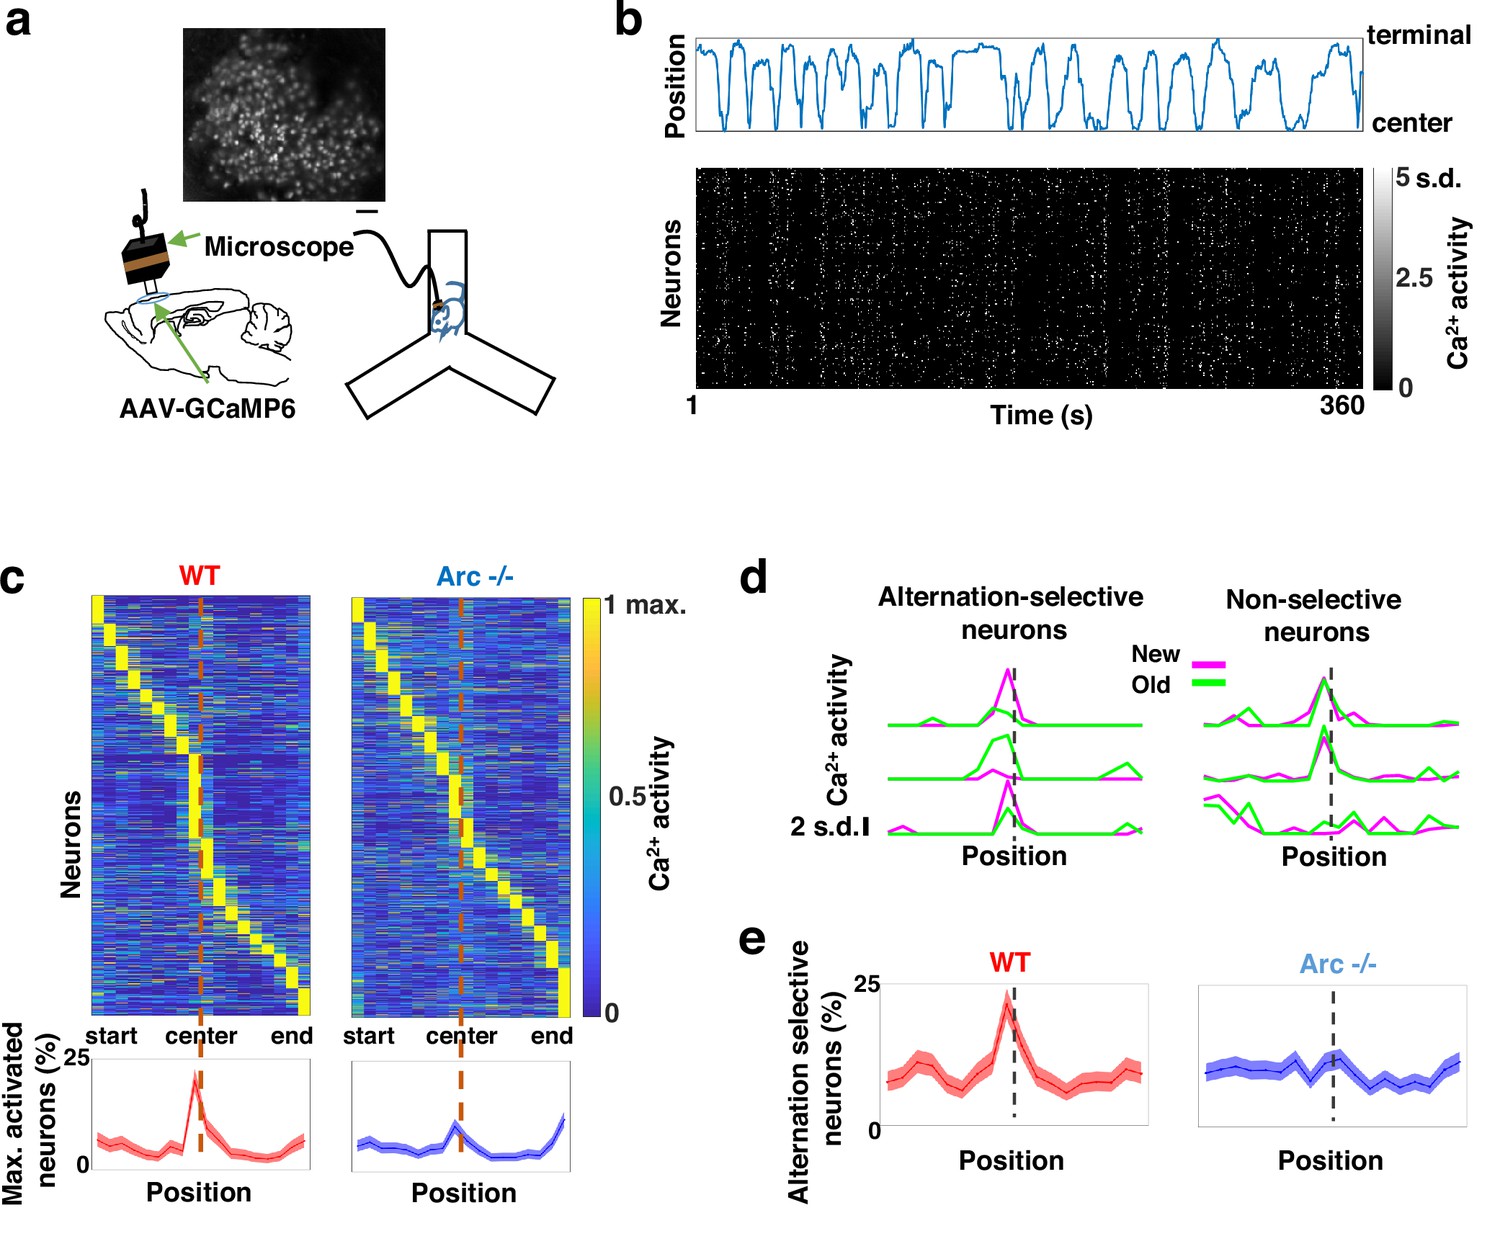
Task-coordinated frontal neuronal ensemble activity is disrupted in Arc mutant mice.
(a) Diagram showing the setup for miniaturized microscope imaging of frontal cortical activity in mice performing the Y-maze task. The example image represents the projection (by standard deviation of ΔF/F) of a calcium activity movie (~500 s), showing labeled M2 frontal cortical neurons. Scale bar, 100 µm. (b) Top, an example plot showing the positions of a wild-type mouse relative to the Y-maze center during navigation. Bottom, raster plot showing the calcium activity of M2 neurons simultaneously recorded during navigation. (c) Top, the average activity of individual frontal cortical neurons at binned positions relative to the center of Y-maze in WT (938 neurons from 8 animals) and Arc-/- (1338 neurons from 7 animals) animals. Bottom, the proportion of neurons showing maximal activation at each maze position. This proportion peaked right before the maze center in WT mice but reduced significantly in Arc-/- mice. Shaded areas indicate 95% confidence intervals. (d) Examples of neurons showing differential (alternation-selective, traces from three neurons on the left) or similar (non-selective, traces from three neurons on the right) activity between new and old arm visits. (e) The proportion of alternation-selective neurons peaked right before the maze center in WT mice but reduced significantly in Arc-/- mice. Shaded areas indicate 95% confidence intervals.
-
Figure 2—source data 1
Task-coordinated frontal neuronal ensemble activity is disrupted in Arc mutant mice.
- https://cdn.elifesciences.org/articles/87414/elife-87414-fig2-data1-v1.xlsx
Figure 2—figure supplement 1

Imaging cortical neuronal activity in Y-maze alternation task with a miniaturized head-attached microscope.
(a) Schematic drawing of the outline of experimental procedures. (b) Confocal fluorescence images of coronal brain sections showing superficial layer cortical neurons that are labeled by infusion of AAV9-GCaMP6 virus from the pial surface. Left:10×, right: 20×. Scale bar, 100 µm. (c) Left: A representative standard deviation projection image of 15,000 frames collected over 8 min in the M2 frontal cortex of a freely moving mouse in a Y-maze. Right: The ΔF/F activity traces of labeled cortical neurons matched in color with the left image. Scale bar, 100 µm. (d–f) Quantifications of average calcium transient amplitude (d), frequency (e), and duration (f) in WT and Arc-/- mice during Y-maze exploration. Each dot on the plot represented the cell average from one mouse. No significant difference was detected. (d) p=0.548, t-test, t(13)=0.617; (e) p=0.117, t-test, t(13)=1.679; (f) p=0.264, t-test, t(13)=1.168. (g) Y-maze alternation percentage for animals in the miniscope imaging experiments, showing reduction in Arc-/- animals compared to WT (*p=0.047, t-test, t(13)=2.196, WT N=8, Arc-/- N=7 mice, both groups passed Shapiro-Wilk normality test at alpha = 0.05). (h) Total entries. (i) Left-right turns (percentage of right turns shown) are not significantly different. (h) p=0.69, t-test, t(13)=0.408; (i) p=0.304, t-test, t(13)=1.07. All the error bars indicate SEM. (j) Pearson pairwise correlation between the frequency of calcium events and the alternation scores or total entries in WT, Arc-/-, and both genotype groups. No significant correlation was found.
Figure 2—video 1
Frontal cortical neuronal ensemble activity in freely moving mice during Y-maze exploration.
Simultaneously recorded behavioral video of a mouse exploring a Y-maze (left) and calcium activity (ΔF/F) movie of M2 cortical neurons imaged through a head-attached miniaturized microscope (right).
Figure 3 with 1 supplement
Adolescent dopamine neuron stimulation leads to long-term reversal of mesofrontal circuit deficits.
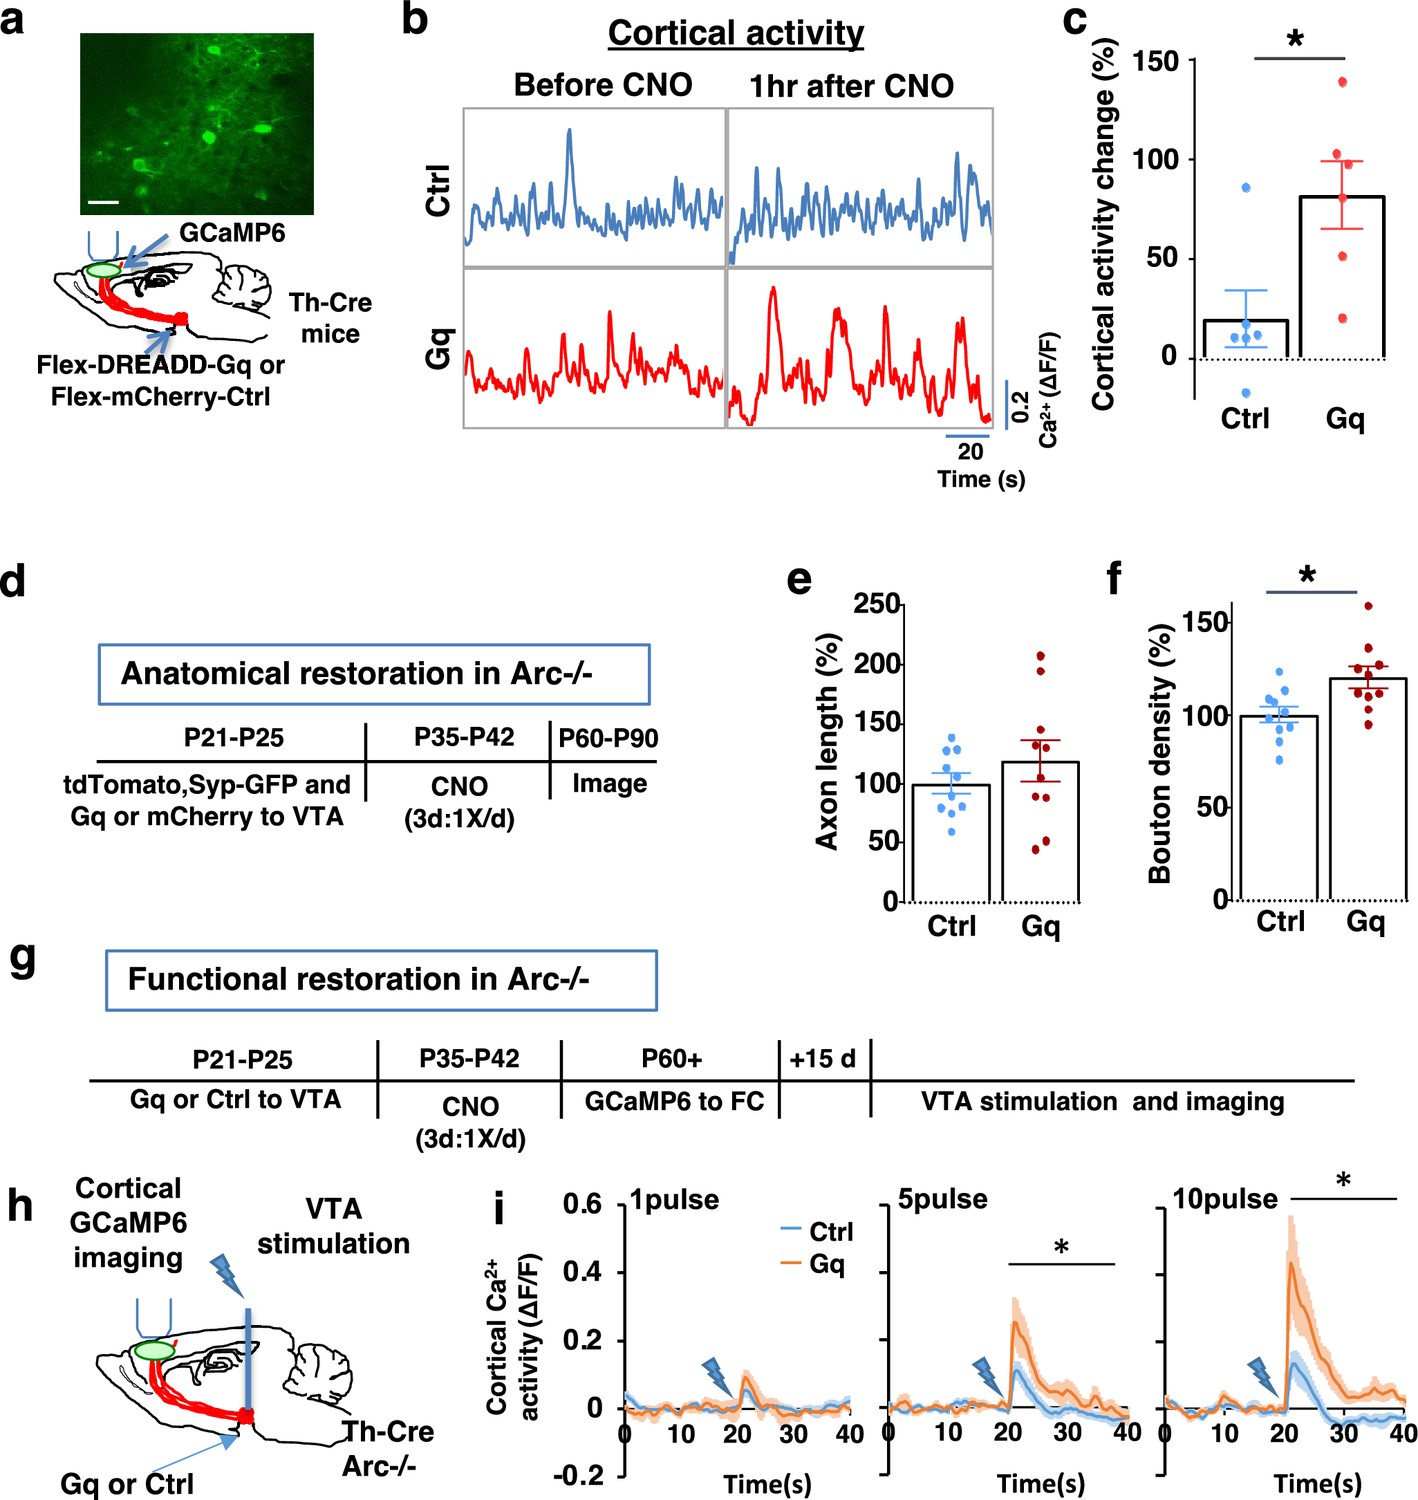
(a) Schematic for labeling dopamine neurons with DREADD-Gq-mCherry and imaging frontal cortical activity with GCaMP6. The example image at the top shows a two-photon image of labeled cortical neurons. Scale bar, 20 μm. (b) Example traces of spontaneous cortical activity averaged from the whole image frame in control mCherry only (blue) and DREADD-Gq (red) animals before and 1 hr after clozapine N-oxide (CNO) injection. (c) Gq animals show significantly higher change in cortical activity after CNO injection compared to control mCherry only animals, suggesting CNO-induced activation of the mesofrontal circuit (*p=0.018, t-test, t(10)=2.814, N=6 mice for each group). Cortical activity is summarized by the standard deviation (SD) of the spontaneous activity traces. Activity change is calculated as (SD2-SD1)/SD1, where SD1 is before and SD2 after treatment. (d) Diagram showing experimental procedures to evaluate the effect of adolescent dopamine neuron stimulation on the structure of frontal dopaminergic projections. (e, f) Normalized axon length (e) is not significantly different. Normalized bouton density (f) is significantly increased in Gq animals compared to Ctrl (*p=0.013, t-test, t(18)=2.763, N=10 for each group). The axon length is normalized by the number of labeled cells in ventral tegmental area (VTA), the bouton density is normalized by the axon length, and both are expressed as a percentage of the group average in Ctrl mice. (g) Diagram showing procedures to determine the effect of adolescent dopamine neuron stimulation on mesofrontal circuit activity in Arc-/-;Th-Cre mice labeled with DREADD-Gq or mCherry-Ctrl. (h) Schematic showing the experimental setup to measure the mesofrontal circuit activity by VTA electrical stimulation and GCaMP6 imaging in the frontal cortex. (i) Time courses of cortical calcium signals in response to VTA stimulation in Arc-/-;mCherry-Ctrl and Arc-/-; DREADD-Gq mice. 1, 5, or 10 pulses of electrical stimuli (50 Hz) were delivered at 20 s after the start of imaging. The cortical calcium activity at each time point is represented by the change in image fluorescence relative to the baseline image fluorescence (ΔF/F). (5 pulse F(1,10)=6.0, *p=0.034, 10 pulse F(1,10)=9.5, *p=0.012, two-way ANOVA, N=6 mice per group).
-
Figure 3—source data 1
Adolescent dopamine neuron stimulation leads to long-term reversal of mesofrontal circuit deficits.
- https://cdn.elifesciences.org/articles/87414/elife-87414-fig3-data1-v1.xlsx
Figure 3—figure supplement 1

Ventral tegmental area (VTA) expression of DREADD-Gq and validation of clozapine N-oxide (CNO)-induced cortical activation.
(a) Example confocal image of DREADD-Gq-mCherry labeling in the midbrain. Scale bar, 100 µm. (b) Top, example images showing standard deviation projection of in vivo two-photon calcium activity movies in the M2 frontal cortex. Bottom, example traces of spontaneous cortical activity in a representative sample of individual cells before and 1 hr after CNO injection in a DREADD-Gq animal. Scale bar, 20 µm. (c) Saline injection in DREADD-Gq-expressing mice did not alter M2 neural activity, and CNO-induced increase in M2 neural activity was suppressed by D1 antagonist SCH23390 (1 mg/kg, i.p.). Two injections (CNO-SAL, CNO-SCH, or SAL-SAL) were done in each animal. Three imaging sessions were conducted: before any injection, 1 hr after the first injection to allow CNO to take effect, and 30 min after the second injection to allow SCH to take effect. Cortical activity is summarized by the standard deviation (SD) of the spontaneous activity traces. Activity changes are calculated as (SD-SD0)/SD0, where SD0 is before any drug or saline injection, and SD is after CNO, saline, or SCH23390 injection (two-way repeated measures ANOVA, group × treatment, F(2,18) = 8.9, p=0.0020; Sidak’s multiple comparison: CNO followed by SAL, p=0.5667; CNO followed by SCH, ***p=0.0002; SAL followed by SAL, p=0.8492; N=7 mice for each group).
Figure 4 with 1 supplement
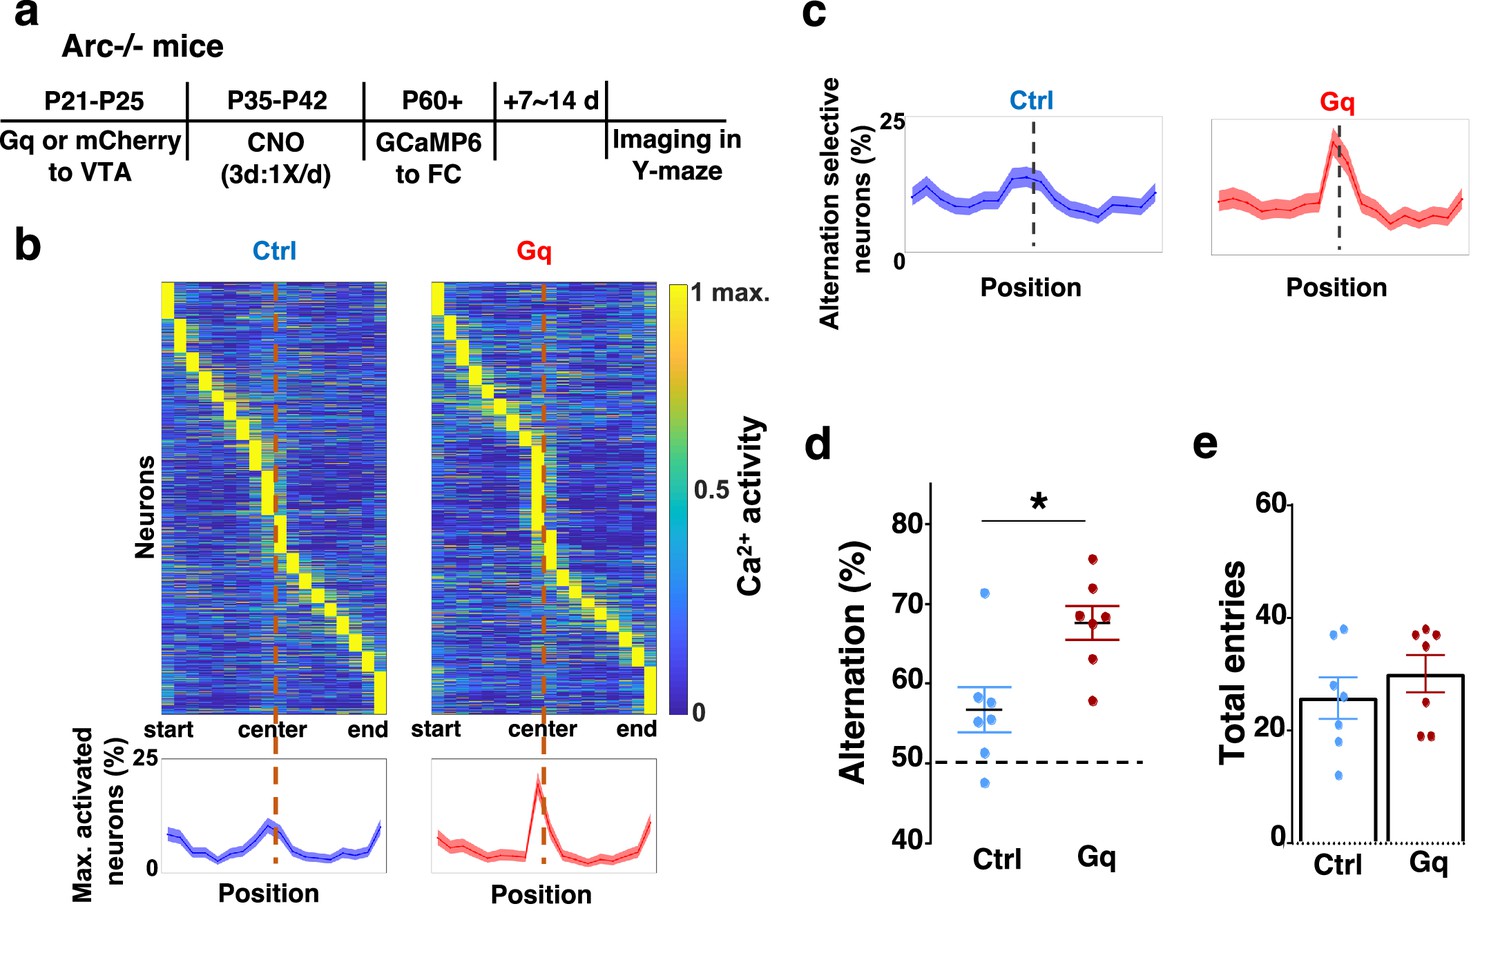
Adolescent dopamine neuron stimulation leads to restoration of coordinated frontal neuronal activity and cognition in adulthood.
(a) Diagram showing procedures for adolescent stimulation of dopamine neurons and functional imaging of frontal cortical neuron activity in adult Arc-/-;Th-Cre mice. (b) The average activity of individual frontal cortical neurons at binned positions relative to the center of Y-maze in Arc -/-; mCherry-Ctrl (1288 neurons from 7 mice) and Arc-/-; DREADD-Gq (1008 neurons from 7 mice) animals. Bottom, the proportion of neurons showing maximal activation at each maze position. This proportion reached a higher peak right before the maze center in Arc-/-; DREADD-Gq mice compared to Arc-/-; mCherry-Ctrl mice. Shaded areas indicate 95% confidence intervals. (c) The proportion of alternation-selective neurons reached a significantly higher peak right before the maze center in Arc-/-; DREADD-Gq compared to Arc-/-; mCherry-Ctrl mice. Shaded areas indicate 95% confidence intervals. (d) Y-maze alternation percentage for the animals used in the miniaturized microscope imaging experiments shows significant increase in Arc-/-;DREADD-Gq animals compared to Arc-/-; mCherry-Ctrl (*p=0.010, t-test, t(12)=3.043, N=7 mice for each group, both groups passed Shapiro-Wilk normality test at alpha = 0.05). (e) Total arm entries are not significantly different (p=0.399, t-test, t(12)=0.875). All the error bars indicate SEM.
-
Figure 4—source data 1
Adolescent dopamine neuron stimulation leads to restoration of coordinated frontal neuronal activity and cognition in adulthood.
- https://cdn.elifesciences.org/articles/87414/elife-87414-fig4-data1-v1.xlsx
Figure 4—figure supplement 1
Average activity of M2 neurons during Y-maze exploration.
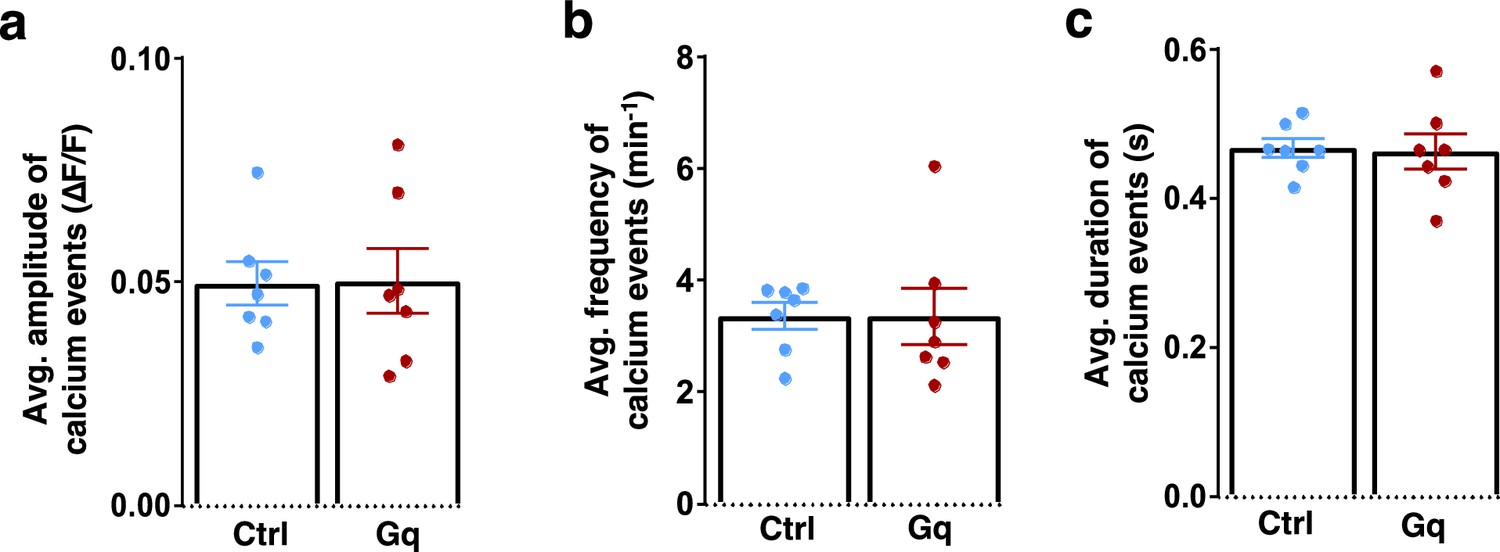
(a–c) Quantifications of calcium transient amplitude (a), frequency (b), and duration (c) in Arc-/-; mCherry-Ctrl and Arc-/-;DREADD-Gq mice during Y-maze exploration show no significant difference. (a) p=0.952, t-test, t(12)=0.062; (b) p=0.985, t-test, t(12)=0.019; (c) p=0.879, t-test, t(12)=0.155. Each dot on the plot represented the cell average from one mouse. All the error bars indicate SEM.
Figure 5 with 1 supplement
Efficacy requirements for adolescent dopamine neuron stimulation.
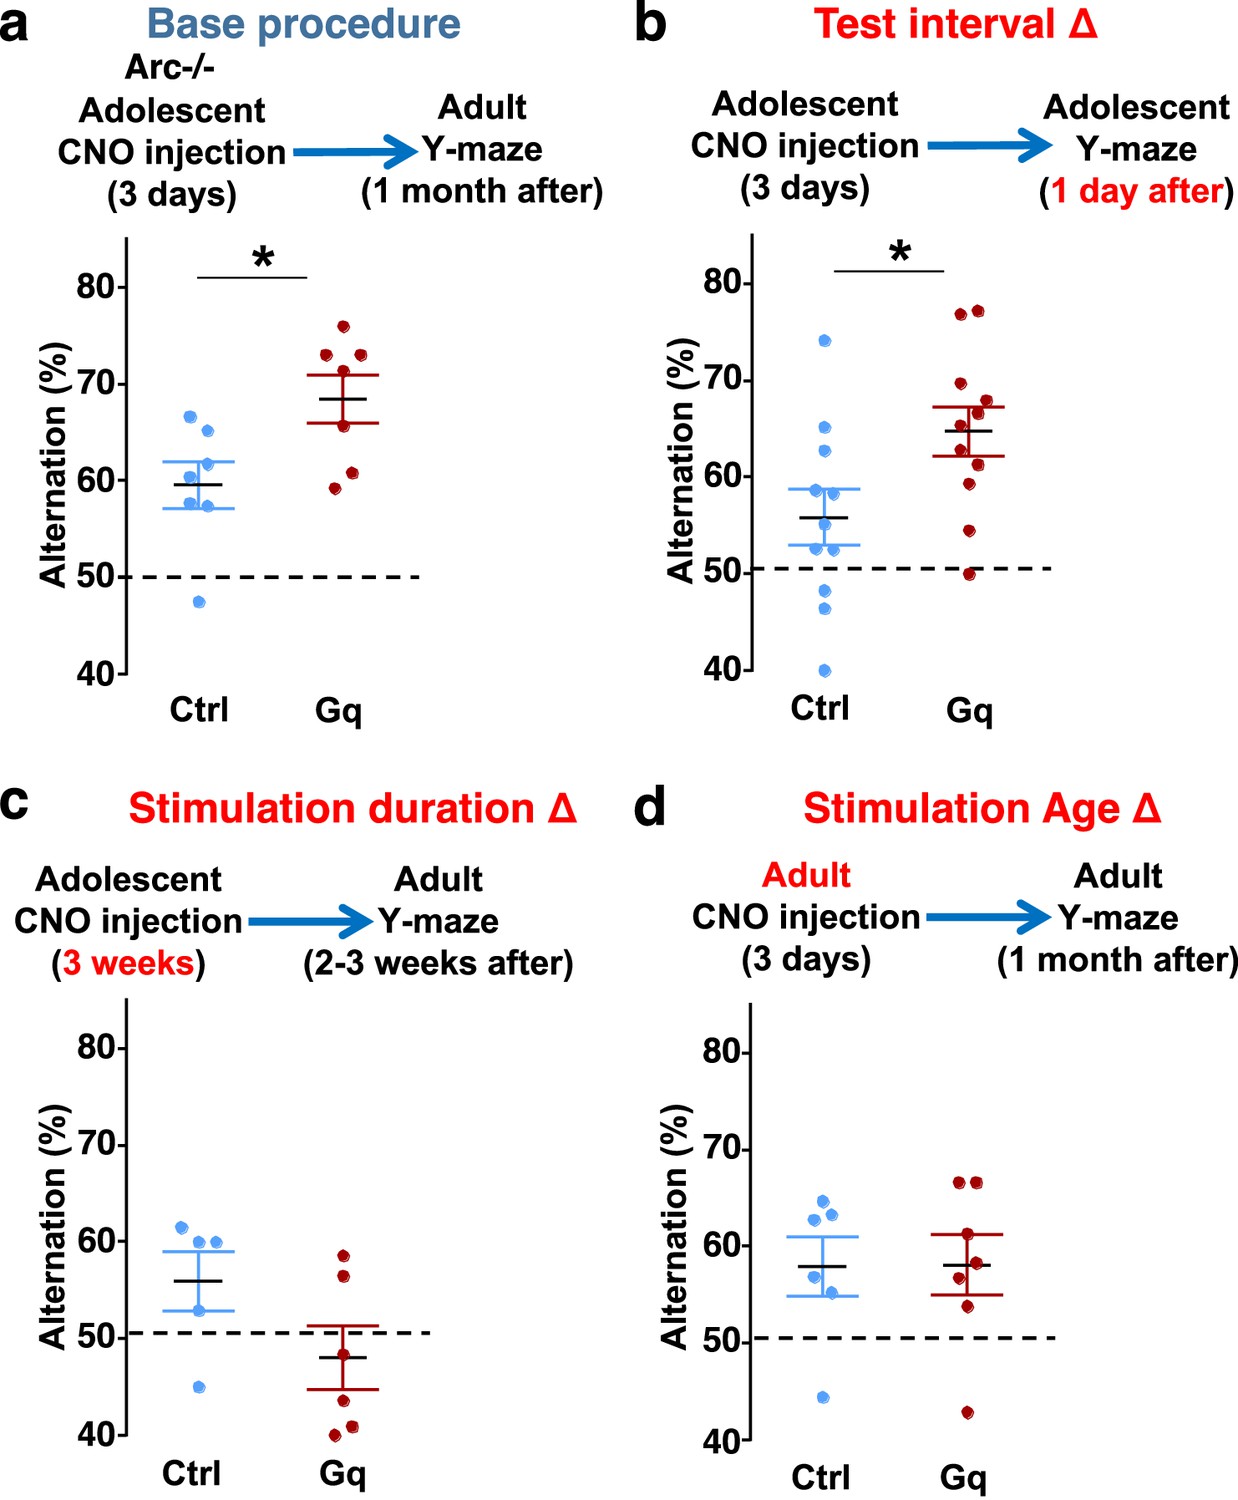
(a) Top, diagram showing the base procedure for the stimulation of midbrain dopamine neurons and Y-maze testing in Arc-/-;Th-Cre mice labeled with DREADD-Gq or mCherry control viruses. Animals were injected with clozapine N-oxide (CNO) (1 mg/kg) once per day for 3 days in adolescence (5 weeks of age) and then tested in the Y-maze at adulthood (~1 month later). Arc-/-; DREADD-Gq animals show significantly higher alternation compared to Arc-/-; mCherry-Ctrl at adulthood (*p=0.023, t-test, t(12)=2.598, N=7 mice for each group, both groups passed Shapiro-Wilk normality test at alpha = 0.05). (b) The behavioral effect at the test interval of 1 day after CNO injection. Arc-/-; DREADD-Gq animals show significantly higher alternation compared to Arc-/-; mCherry-Ctrl (*p=0.031, t-test, t(20)=2.322, N=11 mice for each group, both groups passed Shapiro-Wilk normality test at alpha = 0.05). (c) The behavioral outcome following a long duration stimulation starting in adolescence (2 times per day, 5 days per week, for 3 weeks). These animals did not show any improvement but a declining trend in performance (p=0.12, t-test, t(9)=1.727, Arc-/-; mCherry-Ctrl N=5, Arc-/-; DREADD-Gq, N=6 mice, both groups passed Shapiro-Wilk normality test at alpha = 0.05). (d) The behavioral outcome following 3 days of CNO stimulation administered in adult mice (2–3 months). These animals did not show significant difference (p=0.97, t-test, t(11)=0.037, Arc-/-;mCherry-Ctrl, N=6; Arc-/-;DREADD-Gq, N=7 mice, both groups passed Shapiro-Wilk normality test at alpha = 0.05).
-
Figure 5—source data 1
Efficacy requirements for adolescent dopamine neuron stimulation.
- https://cdn.elifesciences.org/articles/87414/elife-87414-fig5-data1-v1.xlsx
Figure 5—figure supplement 1
Behavioral characterization of Arc-/- mice under different chemogenetic stimulation conditions.
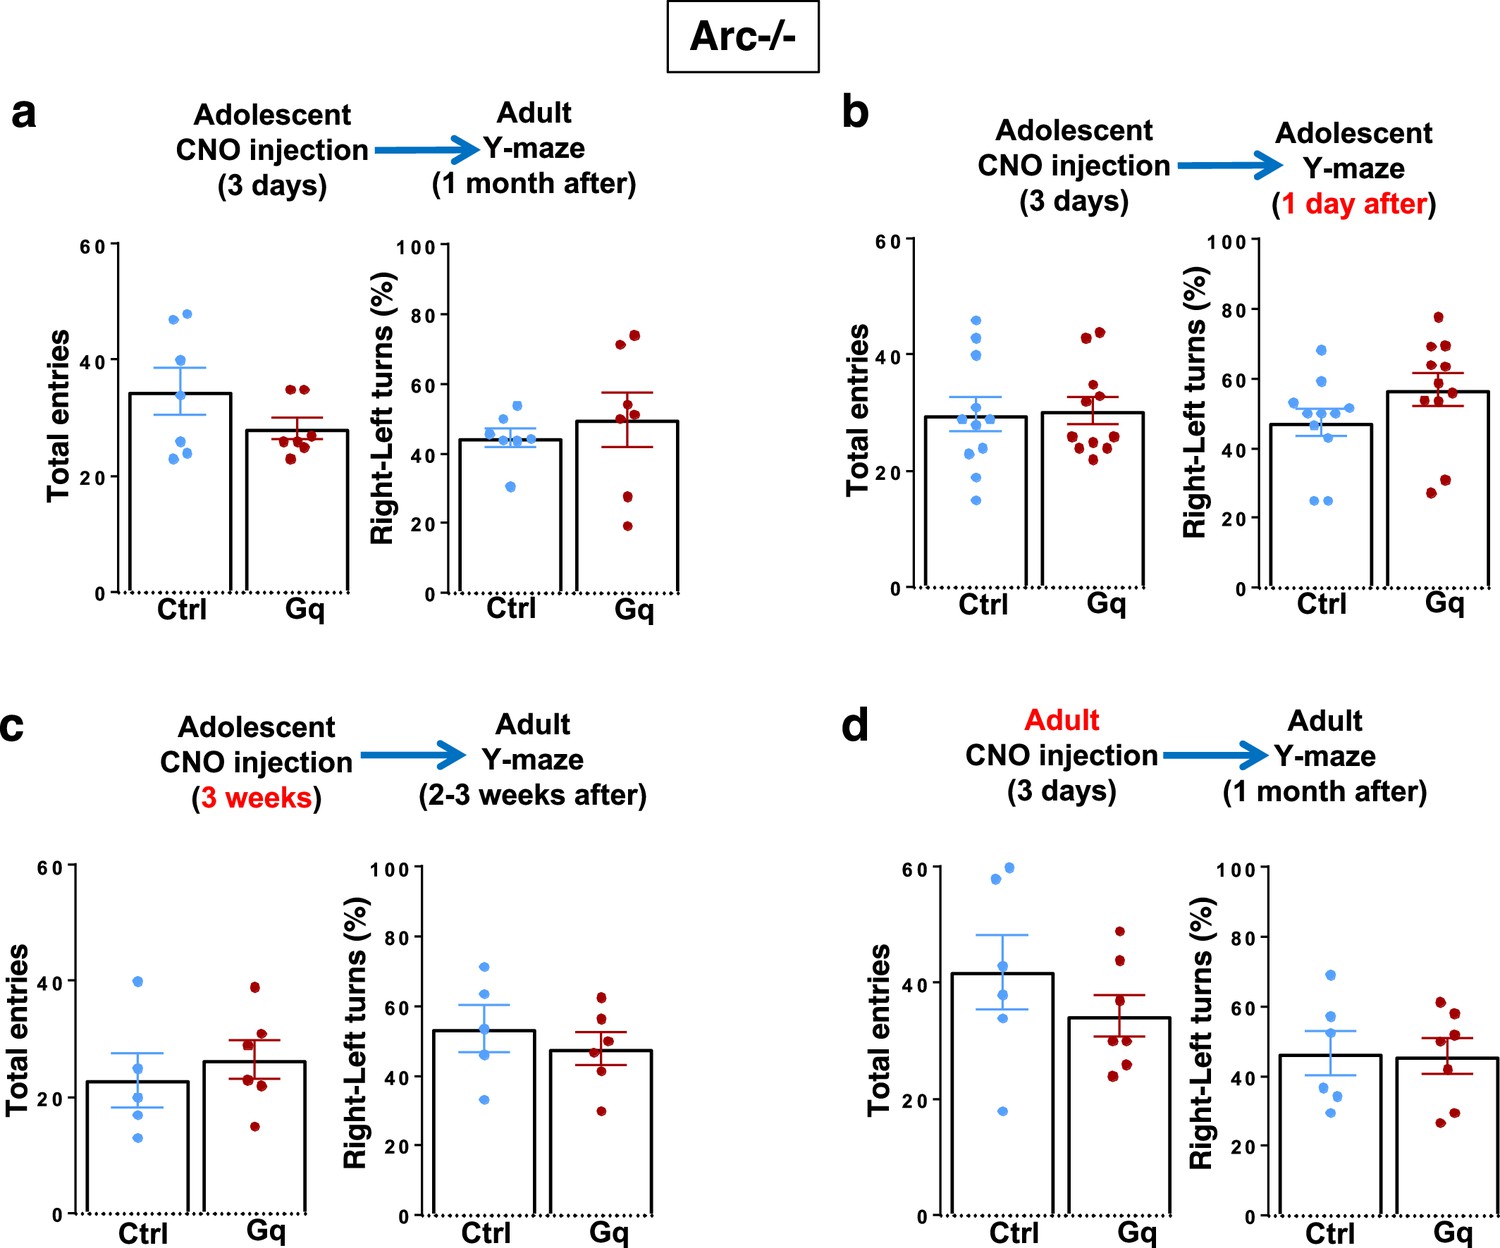
(a) Top, diagram showing procedures for the stimulation of midbrain dopamine neurons and Y-maze testing in Arc-/-;Th-Cre mice labeled with DREADD-Gq or mCherry-Ctrl viruses. Total entries and left-right turns (percentage of right turns shown) in the Y-maze are not significantly different between mCherry-Ctrl and DREADD-Gq animals at adulthood after 3-day adolescent clozapine N-oxide (CNO) stimulation. (b) Total entries and left-right turns (percentage of right turns shown) in the Y-maze are not significantly different between mCherry-Ctrl and DREADD-Gq animals 1 day after 3-day adolescent CNO stimulation. (c) Total entries and left-right turns (percentage of right turns shown) in the Y-maze are not significantly different between mCherry-Ctrl and DREADD-Gq animals at adulthood after 3-week adolescent CNO stimulation. (d) Total entries and left-right turns (percentage of right turns shown) in the Y-maze are not significantly different between mCherry-Ctrl and DREADD-Gq animals after 3-day adult CNO stimulation. All the error bars indicate SEM.
Figure 6 with 1 supplement
Specific stimulation of adolescent frontal dopaminergic axons leads to reversal of both cognitive and psychomotor deficits.
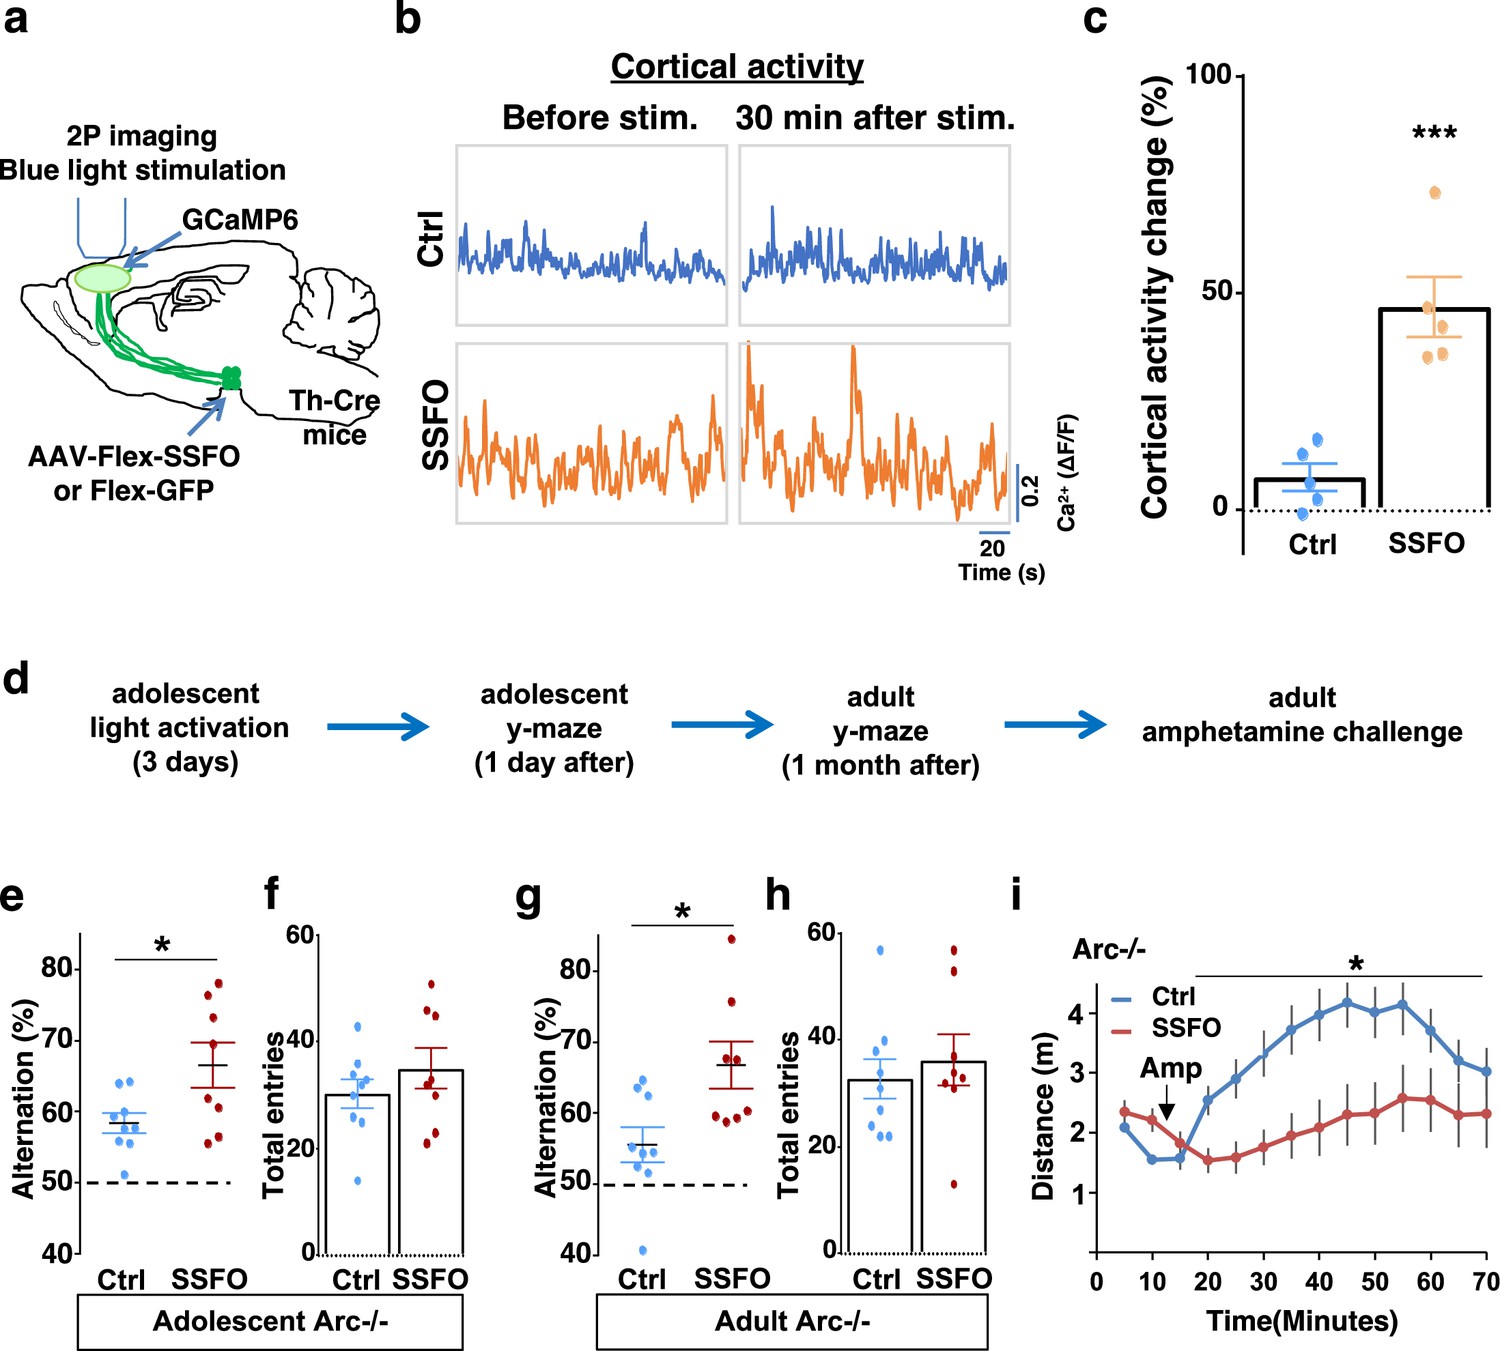
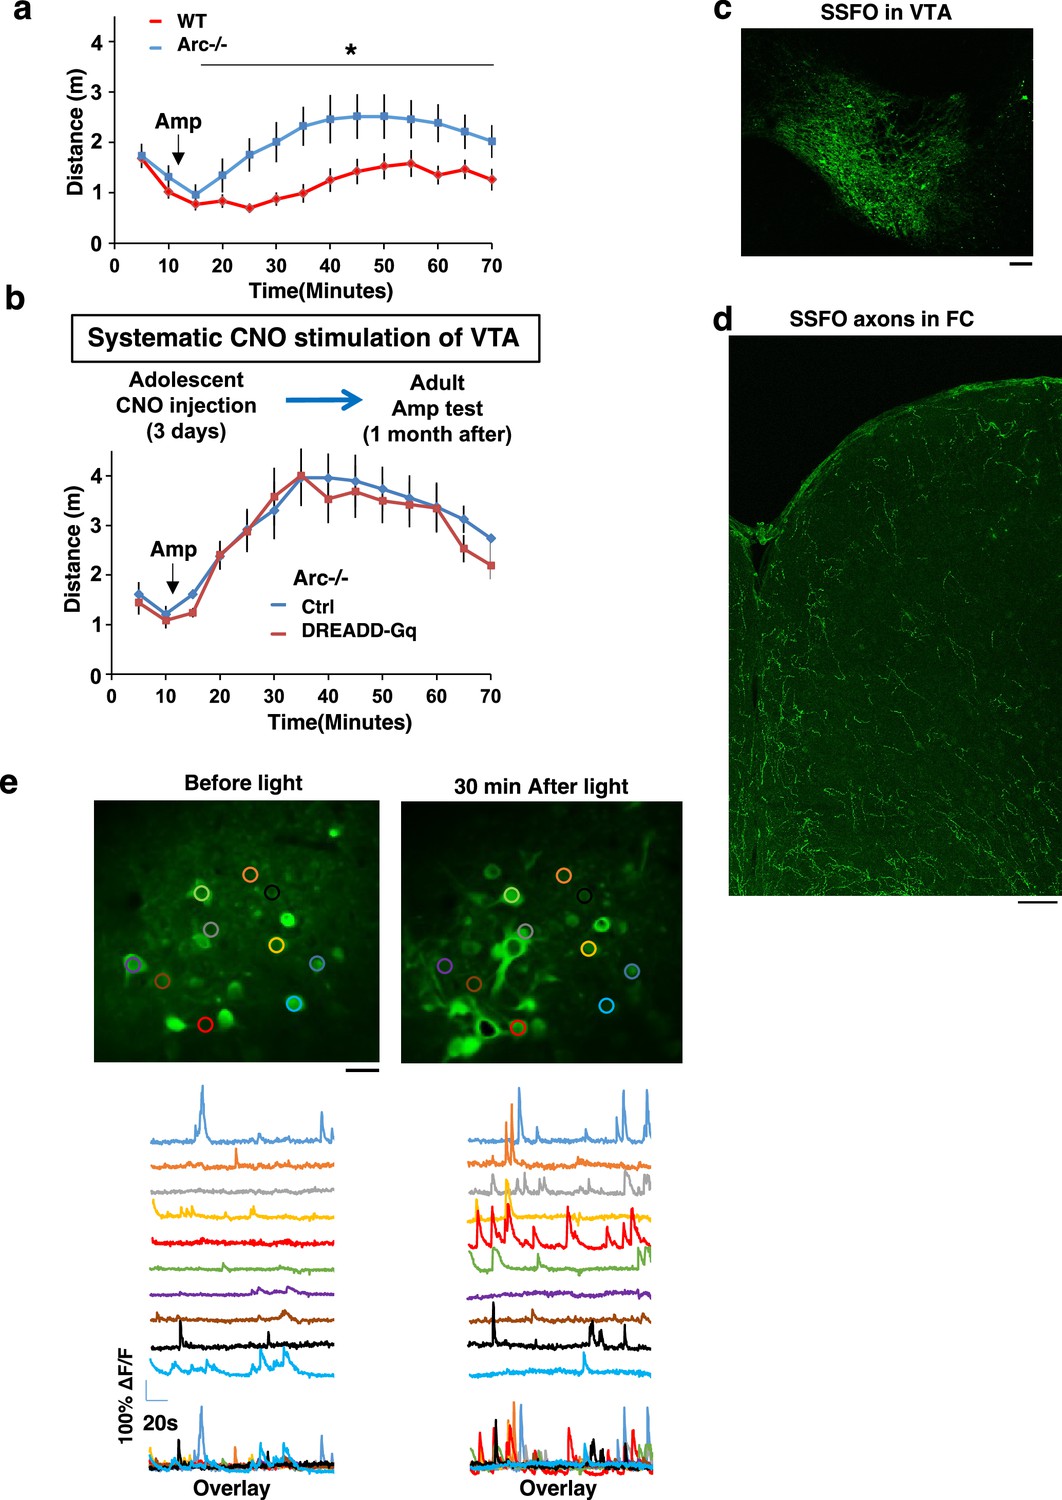
(a) Schematic for labeling dopamine neurons with stabilized step function opsin (SSFO) and two-photon imaging of frontal cortical activity with GCaMP6. (b) Example traces of spontaneous cortical activity averaged from the whole image frame in control EGFP only (blue) and SSFO (orange)-labeled animals before and 30 min after frontal cortical blue light stimulation. (c) SSFO animals show significantly higher change in cortical activity (summarized by the standard deviation of spontaneous activity traces) compared to control EGFP animals after the light activation, suggesting light activation of SSFO expressing dopamine neurons (***p=0.001, t-test, t(8)=5.135, N=5 mice for each group). Cortical activity is summarized by the standard deviation (SD) of the spontaneous activity traces. Activity change is calculated as (SD2-SD1)/SD1, where SD1 is before and SD2 after treatment. (d) Diagram showing procedures for local light activation of frontal dopaminergic projections and Y-maze testing in Arc-/-;Th-Cre mice labeled with SSFO or Ctrl-GFP viruses. Light activation was delivered in adolescence (5 weeks of age) once per day for 3 days. Animals were first tested in the Y-maze 1 day after the last light activation and then tested again in the Y-maze at adulthood, followed by an amphetamine-induced locomotion test. (e–h) SSFO-expressing animals show significantly higher alternation compared to control animals 1 day after light activation (e) (*p=0.028, t-test, t(15)=2.440, N=9 EGFP, N=8 SSFO mice, both groups passed Shapiro-Wilk normality test at alpha = 0.05), with no difference in total entries (f). These animals also show higher alternation at adulthood (g) (*p=0.015, t-test, t(15)=2.748, EGFP N=9, SSFO N=8, both groups passed Shapiro-Wilk normality test at alpha = 0.05) with no difference in total entries (h). (i) In Arc-/-;Th-Cre mice that received adolescent frontal light stimulation, amphetamine-induced locomotion is significantly reduced at adulthood in SSFO animals compared to GFP control animals (F(1,14)=5.3, *p=0.037, two-way ANOVA, N=8 mice per group). All the error bars indicate SEM.
-
Figure 6—source data 1
Specific stimulation of adolescent frontal dopaminergic axons leads to reversal of both cognitive and psychomotor deficits.
- https://cdn.elifesciences.org/articles/87414/elife-87414-fig6-data1-v1.xlsx
Figure 6—figure supplement 1
Amphetamine hyper-reactivity in Arc-/- mice and stabilized step function opsin (SSFO) expression and validation.
(a) Amphetamine-induced locomotion is significantly increased in Arc-/- animals compared to WT. (F(1,14)=9.5, *p=0.032, two-way ANOVA, N=8 mice per group). (b) Amphetamine-induced locomotion at adulthood is not significantly different between Arc-/-;Th-Cre mice labeled with mCherry-Ctrl or DREADD-Gq and treated with clozapine N-oxide (CNO) for 3 days in adolescence. All the error bars indicate SEM. (c) Confocal image of coronal midbrain section showing SSFO expression in the ventral tegmental area (VTA). Scale bar, 100 µm. (d) Confocal image of coronal cortical section showing SSFO expression in the frontal dopaminergic axons projecting from the VTA. Scale bar, 20 µm. (e) Top, example images showing standard deviation projection of in vivo two-photon calcium activity movies in the M2 frontal cortex. Bottom, example traces of spontaneous cortical activity in a representative sample of individual cells before and 30 min after light stimulation in an SSFO-labeled animal. Scale bar, 20 µm.
Figure 7 with 1 supplement
Adolescent dopamine neuron stimulation reverses cognitive deficits in Disc1 mutant mice.
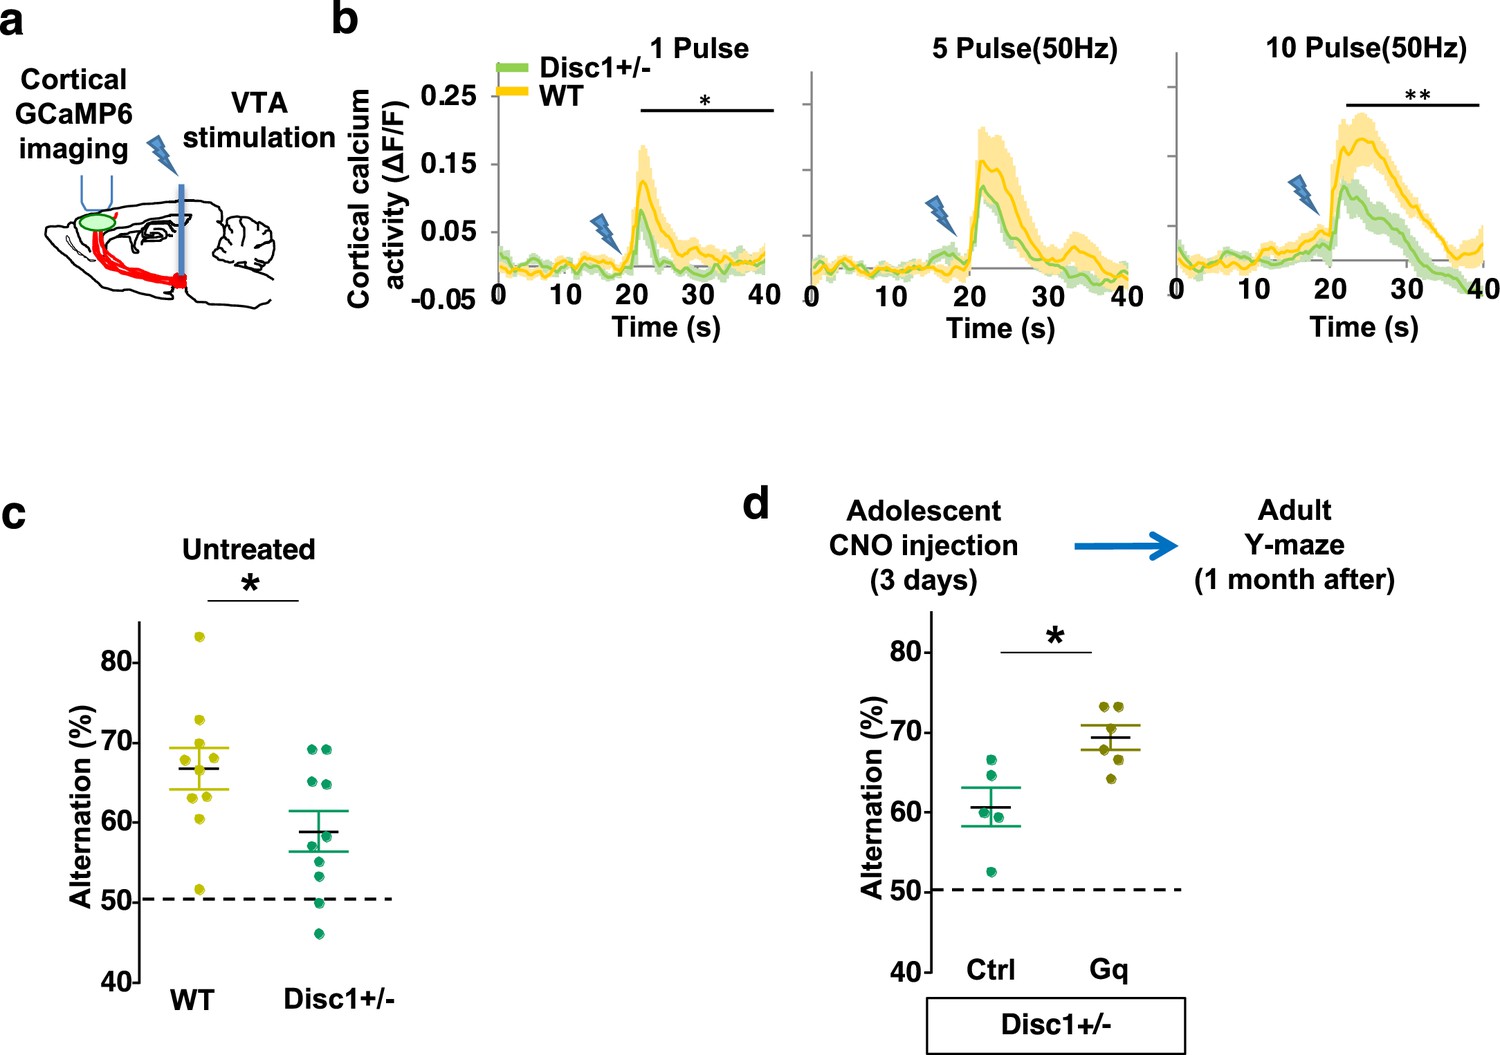
(a) Schematic showing the experimental setup to measure the mesofrontal circuit activity by ventral tegmental area (VTA) electrical stimulation and GCaMP6 imaging in the frontal cortex. (b) Time courses of cortical calcium signals in response to VTA stimulation in WT and Disc1+/- mice. 1, 5, or 10 pulses of electrical stimuli (50 Hz) were delivered at 20 s after the start of imaging. The cortical calcium activity at each time point is represented by the change in image fluorescence relative to the baseline image fluorescence (ΔF/F) (1 pulse F(1,10)=5.7, *p=0.038; 10 pulse F(1,10)=16.5, **p=0.002, two-way ANOVA, N=6 per group). (c) Disc1+/- mice show significant reduction in Y-maze alternation compared to WT (*p=0.044, t-test, t(18)=2.171, N=10 mice for each group, both groups passed Shapiro-Wilk normality test at alpha = 0.05). (d) Disc1+/-;Th-Cre mice with DREADD-Gq-labeled dopamine neurons show significantly higher alternation in the Y-maze at adulthood compared to mCherry-Ctrl-labeled mice after 3-day adolescent clozapine N-oxide (CNO) injections (*p=0.012, t-test, t(9)=3.139, Disc1+/-; mCherry N=5, Disc1+/-;DREADD-Gq, N=6 mice, both groups passed Shapiro-Wilk normality test at alpha = 0.05). All the error bars indicate SEM.
-
Figure 7—source data 1
Adolescent dopamine neuron stimulation reverses cognitive deficits in Disc1 mutant mice.
- https://cdn.elifesciences.org/articles/87414/elife-87414-fig7-data1-v1.xlsx
Figure 7—figure supplement 1

Characterization of Y-maze behavior in Disc1+/- mice.
(a) Total entries and left-right turns (percentage of right turns shown) in the Y-maze are not significantly different between Disc1+/- and WT animals. (b) Top, diagram showing procedures for the stimulation of midbrain dopamine neurons and Y-maze testing in Disc1+/-;Th-Cre mice labeled with DREADD-Gq or mCherry-Ctrl viruses. Total entries and left-right turns (percentage of right turns shown) in the Y-maze are not significantly different between mCherry-Ctrl and DREADD-Gq animals at adulthood after 3-day adolescent clozapine N-oxide (CNO) stimulation. All the error bars indicate SEM.
Author response image 1

Example images from DAT-Cre/Ai14 mice.
Left most panel shows little axonal labeling in Layer 5/6 of M2. The center panel shows sparse axonal label in Layer 1/2 of M2, but also ectopic labeling of cell soma. The right panel shows a lack of labeling in L1/2 of prelimbic cortex as well. Scale bars 50um.
Tables
Key resources table
| Reagent type (species) or resource | Designation | Source or reference | Identifiers | Additional information |
|---|---|---|---|---|
| Gene (Mus musculus) | Arc | NCBI Gene ID | 11838 | |
| Gene (Mus musculus) | Disc1 | NCBI Gene ID | 244667 | |
| Strain, strain background (Mus musculus) | C57BL/6 | The Jackson Laboratory | 000664 | |
| Genetic reagent (Mus musculus) | Arc-/- | The Jackson Laboratory | 007662 | |
| Genetic reagent (Mus musculus) | Disc1+/- | The Jackson Laboratory | 036106 | |
| Genetic reagent (Mus musculus) | Th-Cre | MMRRC | 031029 | |
| Strain, strain background (Adeno-associated Virus) | AAV2/9 -Syn-GCaMP6s | Boston Children’s Hospital Viral Core | ||
| Strain, strain background (Adeno-associated Virus) | AAV8-CaMKIIa-hM4D(Gi)-mCherry | UNC Vector Core | ||
| Strain, strain background (Adeno-associated Virus) | AAV8-Syn-mCherry | Boston Children’s Hospital Viral Core | ||
| Strain, strain background (Adeno-associated Virus) | AAV2/9-phSyn1(S)-Flex-tdTomato-T2A-SynEGFP-WPRE | Boston Children’s Hospital Viral Core | ||
| Strain, strain background (Adeno-associated Virus) | AAV9.CAG.Flex.tdTomato.WPRE.bGH | Penn Vector Core | ||
| Strain, strain background (Adeno-associated Virus) | pAAV8-hSyn-DIO-hM3D(Gq)-mCherry | UNC Vector Core | ||
| Strain, strain background (Adeno-associated Virus) | pAAV8-hSyn-DIO-mCherry | UNC Vector Core | ||
| Strain, strain background (Adeno-associated Virus) | AAV1.Syn.Flex.GCaMP6s.WPRE.SV40 | Penn Vector Core | ||
| Strain, strain background (Adeno-associated Virus) | pAAV9-EF1a-DIO-hChR2(C128S/D156A)-EYFP | Penn Vector Core | ||
| Strain, strain background (Adeno-associated Virus) | AAV2/1.CAG.FLEX.EGFP.WPRE.bGH | Penn Vector Core | ||
| Chemical compound, drug | d-Amphetamine | Sigma | A5880 | |
| Chemical compound, drug | Clozapine N-oxide | Enzo Life Sciences | BML-NS105-0005 | |
| Chemical compound, drug | SCH23390 | Sigma | D054 | |
| Software, algorithm | Matlab | MathWorks | ||
| Software, algorithm | Mosaic | Inscopix | ||
| Software, algorithm | ImageJ | NIH | ||
| Software, algorithm | Prizm | GraphPad |
Additional files
Download links
A two-part list of links to download the article, or parts of the article, in various formats.
Downloads (link to download the article as PDF)
Open citations (links to open the citations from this article in various online reference manager services)
Cite this article (links to download the citations from this article in formats compatible with various reference manager tools)
Adolescent neurostimulation of dopamine circuit reverses genetic deficits in frontal cortex function
eLife 12:RP87414.
https://doi.org/10.7554/eLife.87414.3


