Vaccination with mycobacterial lipid loaded nanoparticle leads to lipid antigen persistence and memory differentiation of antigen-specific T cells
- Department of Microbiology and Immunology, Feinberg School of Medicine, Northwestern University, United States
- Department of Biomedical Engineering, Northwestern University, United States
- Department of Medicine, University of Washington School of Medicine, United States
Figures
Figure 1 with 2 supplements

Physicochemical characterization of bicontinuous nanospheres (BCN) and PLGA nanocarrier formulation (PLGA-NP).
(A) Dynamic light scattering (DLS) analysis of blank BCN and MA-loaded BCN (MA-BCN). (B) Cryo-TEM of MA-BCN (scale = 500 nm). (C) Negative staining transmission electron microscopy (TEM) images of MA-BCN. (D) Small angle X-ray scattering (SAXS) of blank BCN and MA-BCN. (E) Dynamic light scattering (DLS) analysis of blank poly(D,L-lactide-co-glycolide) (PLGA) and MA loaded poly(D,L-lactide-co-glycolide) (MA PLGA). (F) MA encapsulation efficiency for MA-BCN and MA PLGA. N=3 per condition. Data represented as mean ± SD.
Figure 1—figure supplement 1
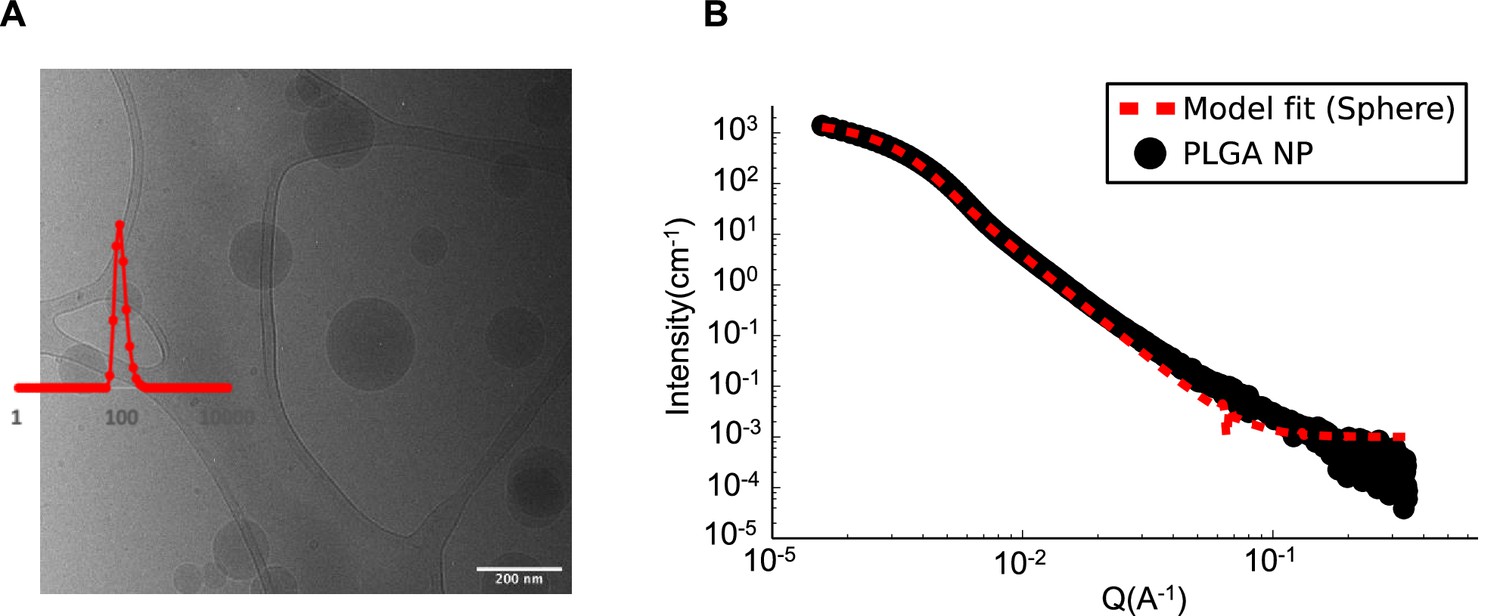
Physicochemical characterization of PLGA nanocarrier formulation (PLGA-NP).
(A) Cryogenic transmission electron microscopy (Cryo-TEM) image and dynamic light scattering (DLS). (B) Small angle X-ray scattering (SAXS) scattering curve fitted with a sphere model.
Figure 1—figure supplement 2
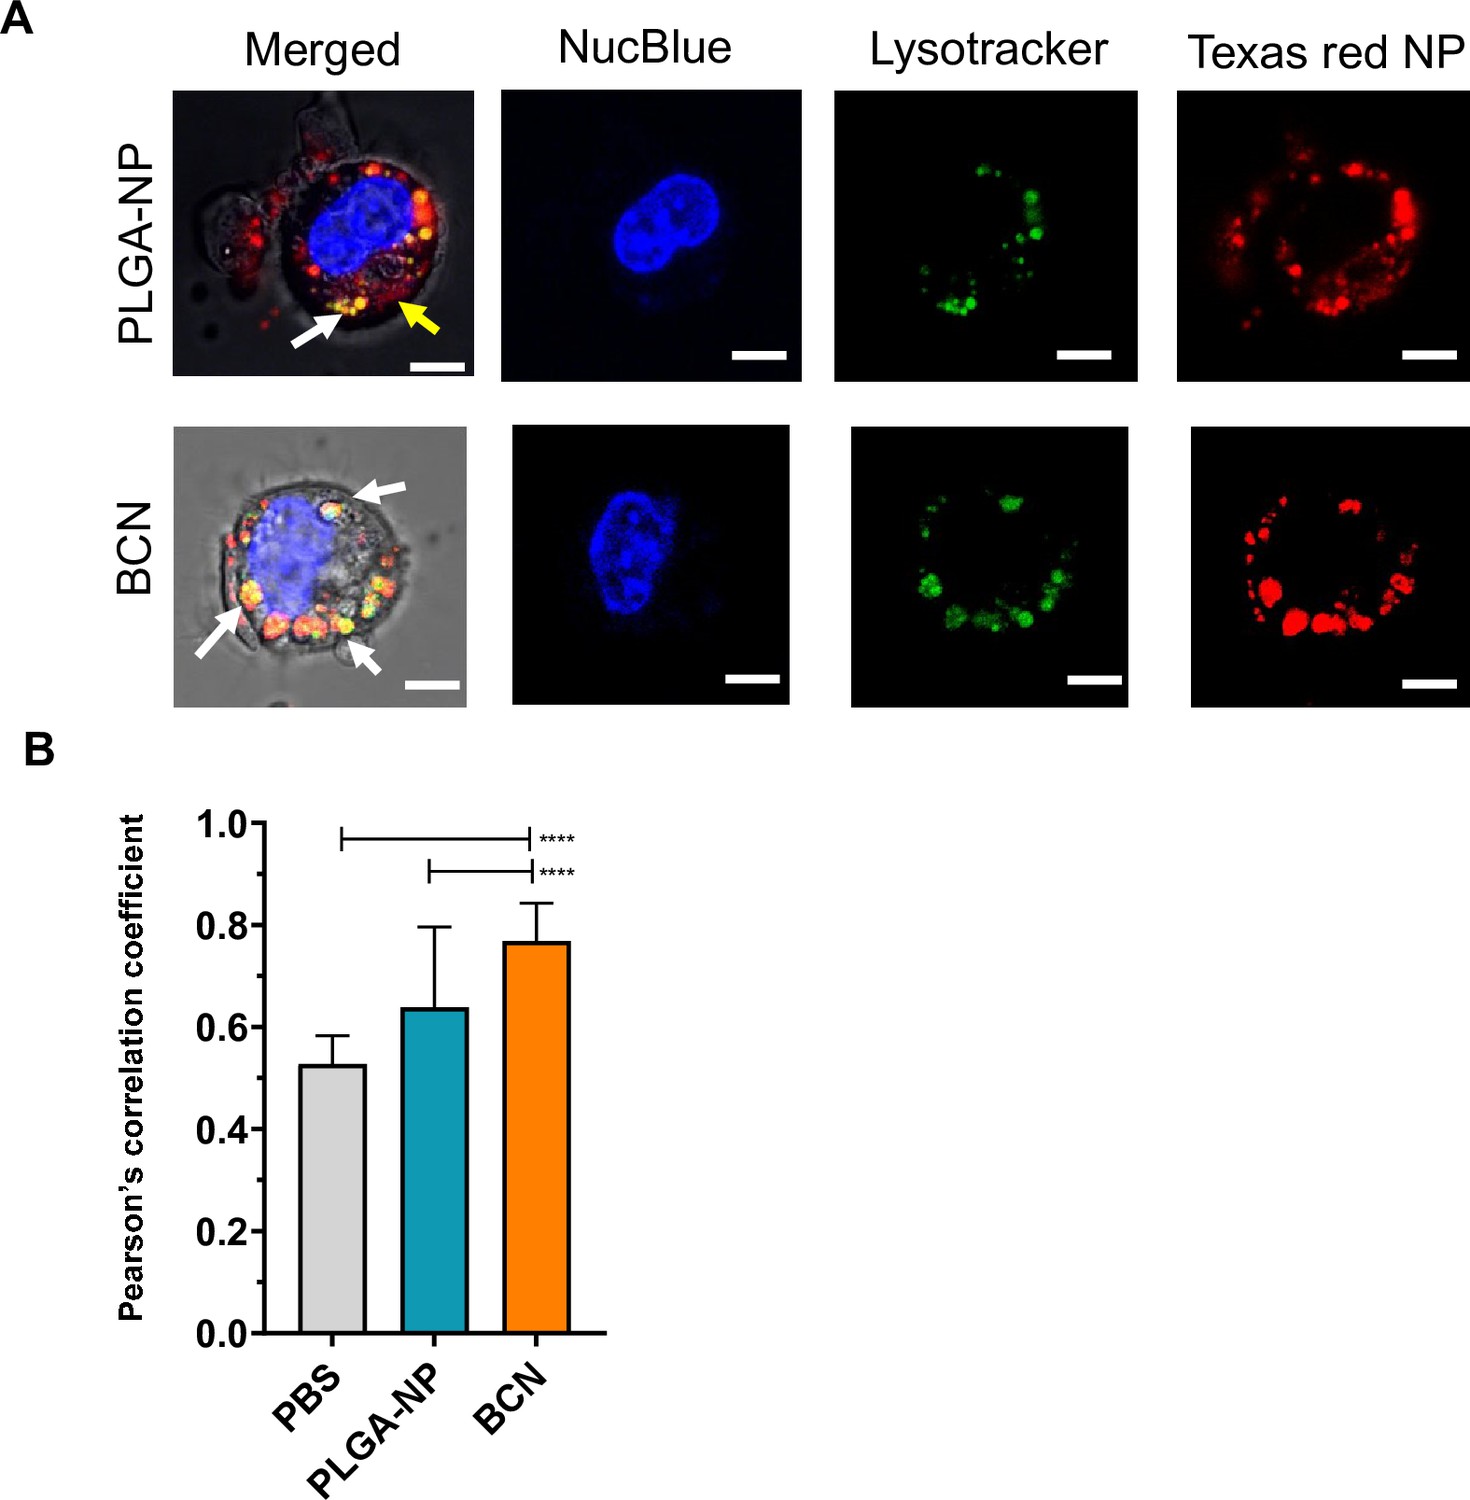
Intracellular localization of poly(D,L-lactide-co-glycolide) nanoparticle (PLGA-NP) and bicontinuous nanospheres (BCN).
(A) Representative confocal image of intracellular localization of PLGA or BCN (Texas red Dextran dye), lysosome (lysotracker), nucleus (NucBlue). (B) Quantification of co-localization of lysotracker with Texas red dye by Pearson correlation. (eight cells were analyzed per experiment, three independent experiments), ****p<0.0001.
Figure 2

MA-loaded bicontinuous nanospheres (MA-BCN) effectively activated MA-specific T cells in vitro and in vivo.
(A, B) Bone marrow-derived dendritic cells (BMDCs) were pulsed for 18 hr. with selected nanoparticles at various concentrations, co-cultured for 48 hr. with DN1 T cells, and T cell activation was measured. (A) Percentage of CD69 and CD25-expressing DN1 T cells. (B) IFN-γ production measured by enzyme-linked immunosorbent assay (ELISA). (N=3). (C, D) ELISPOT of IFN-γ from MA-specific human M11 T cells cultured for 16 hr with monocyte-derived dendritic cells with selected nanoparticles at high (C) and low (D) concentrations. Data are representative of two independent experiments and displayed as mean ± SEM. Statistical analysis: two-way ANOVA, significance designated for MA-BCN vs free MA. (E–G) hCD1Tg mice were IN vaccinated with selected nanoparticles and CellTrace Violet-labeled DN1 T cells were adoptively transferred the next day. After 1 week, DN1 T cell activation and proliferation were measured. (E) Representative FACS plots of DN1 T cells in the lymph nodes (LN). Percentage of proliferating (F) and CD44-expressing (G) DN1 T cells in the LN and lung. Data represented as mean ± SEM. Statistical analysis: two-way ANOVA. *p<0.05, **p<0.01, ***p<0.001, ****p<0.0001.
Figure 3
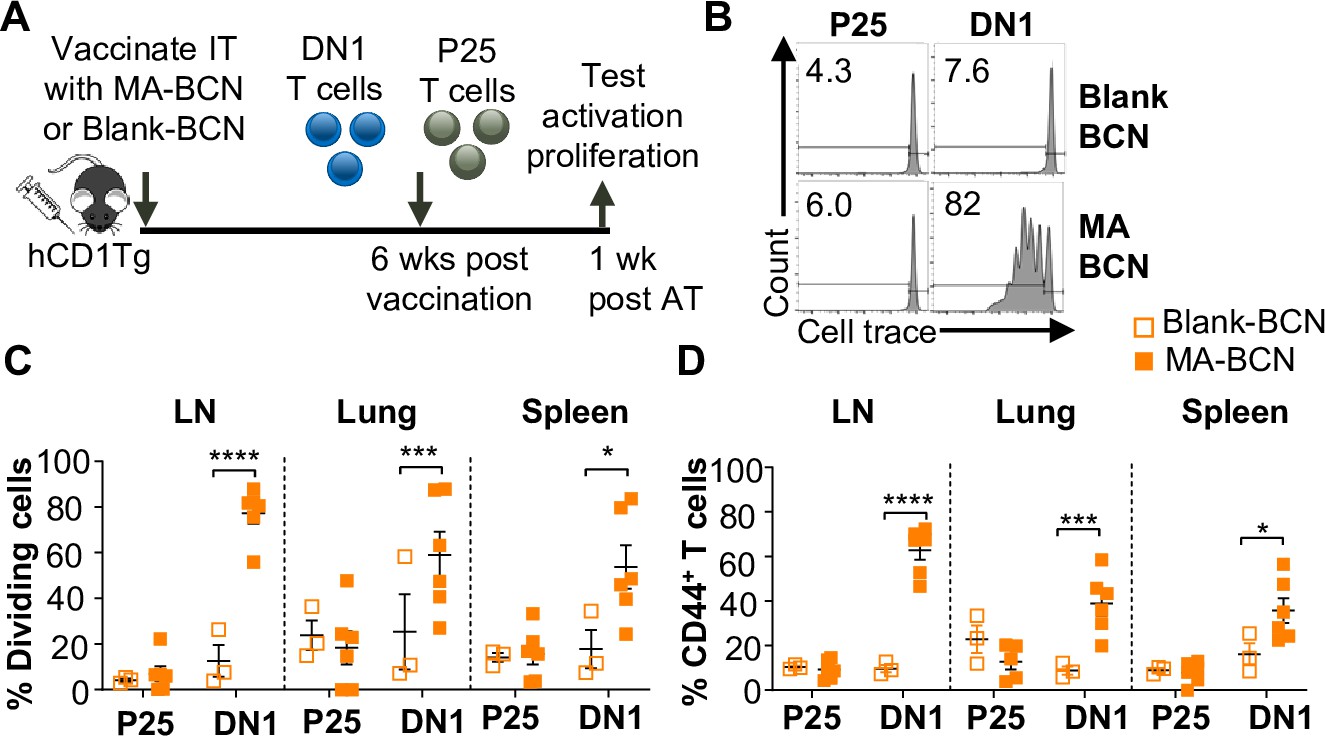
Vaccination with MA-bicontinuous nanospheres (MA-BCN) leads to antigen persistence 6 weeks post-vaccination.
hCD1Tg mice were IT vaccinated with MA-BCN or BCN. 6 weeks later, CellTrace-labeled p25 and DN1 T cells were adoptively transferred, and T cell activation was measured after 1 week. (A) Experimental design. (B) Representative FACS plots of p25 and DN1 T cells in the lymph nodes (LN). Percentage of proliferating (C) and CD44-expressing (D) p25 and DN1 T cells in the LN, lung, and spleen. N=3 or 6 per condition. Outliers were identified through the Grubbs method with alpha = 0.05 with one sample removed. Data represented as mean ± SEM. Statistical analysis: two-way ANOVA. *p<0.05, **p<0.01, ***p<0.001, ****p<0.0001.
Figure 4

Ag85B and Mycolic acid (MA) dual-loaded bicontinuous nanospheres (BCNs) activate antigen-specific T cells without Ag85B persistence.
(A) Dynamic light scattering (DLS) analysis of blank BCN and Ag85B-MA-BCN. (B–D) hCD1Tg mice were IT vaccinated with Ag85B-MA-BCN or BCN and CellTrace-labeled p25 and DN1 T cells were adoptively transferred the next day. After 1 week, T cell activation and proliferation were measured. (B) Representative FACS plots of p25 and DN1 T cells in the lymph nodes (LN). Percentage of proliferating (C) and CD44-expressing (D) p25 and DN1 T cells in the LN, lung, and spleen (N=4 or 5). (E–G) hCD1Tg mice were IT vaccinated with blank BCN or Ag85B-MA-BCN. 6 weeks later, CellTrace-labeled p25 and DN1 T cells were adoptively transferred, and T cell activation was measured after 1 week. (E) Representative FACS plots of p25 and DN1 T cells in the LN. (F) Percentage of proliferating p25 and DN1 T cells. (G) Percentage of CD44-expressing p25 and DN1 T cells in the LN and lung. (N=4). Data represented as mean ± SEM. Statistical analysis: two-way ANOVA. ns = not significant, *p<0.05, **p<0.01, ***p<0.001, ****p<0.0001.
Figure 5 with 2 supplements

Route of vaccination or vector type does not affect antigen persistence.
hCD1Tg BMDCs were pulsed with MA-bicontinuous nanospheres (MA-BCN) or mycolic acid (MA) at concentrations of 5 mg/mL and 10 mg/mL, respectively. hCD1Tg mice were IT vaccinated with MA or MA-BCN pulsed bone marrow-derived dendritic cells (BMDCs) at 6 weeks or 1 week prior to the adoptive transfer of CellTrace-labeled DN1 T cells. T cell activation and proliferation were measured 1 week after adoptive transfer. (A) Experimental design. (B, C) Percentage of proliferating (B) and CD44-expressing (C) DN1 T cells in the lymph nodes (LN), lung, and spleen of vaccinated mice. N=4 per condition. hCD1Tg mice were vaccinated SC (subcutaneously) or IV (intravenously) with blank BCN, MA-BCN, or attenuated Mycobacterium tuberculosis (Mtb) strain and 6 weeks later CellTrace-labeled DN1 T cells were adoptively transferred. (D) Representative FACS plots of DN1 T cells in the LN of mice vaccinated with indicated conditions. (E) Percentage of proliferating DN1 T cells and (F) Percentage of CD44-expressing DN1 T cells in the LN and spleen of mice vaccinated with Blank-BCN (SC), MA-BCN (IV and SC), and attenuated Mtb. N=3–5 per condition. Data represented as mean ± SEM. Statistical analysis: two-way ANOVA. ns = not significant, *p<0.05, **p<0.01, ***p<0.001, ****p<0.0001.
Figure 5—figure supplement 1
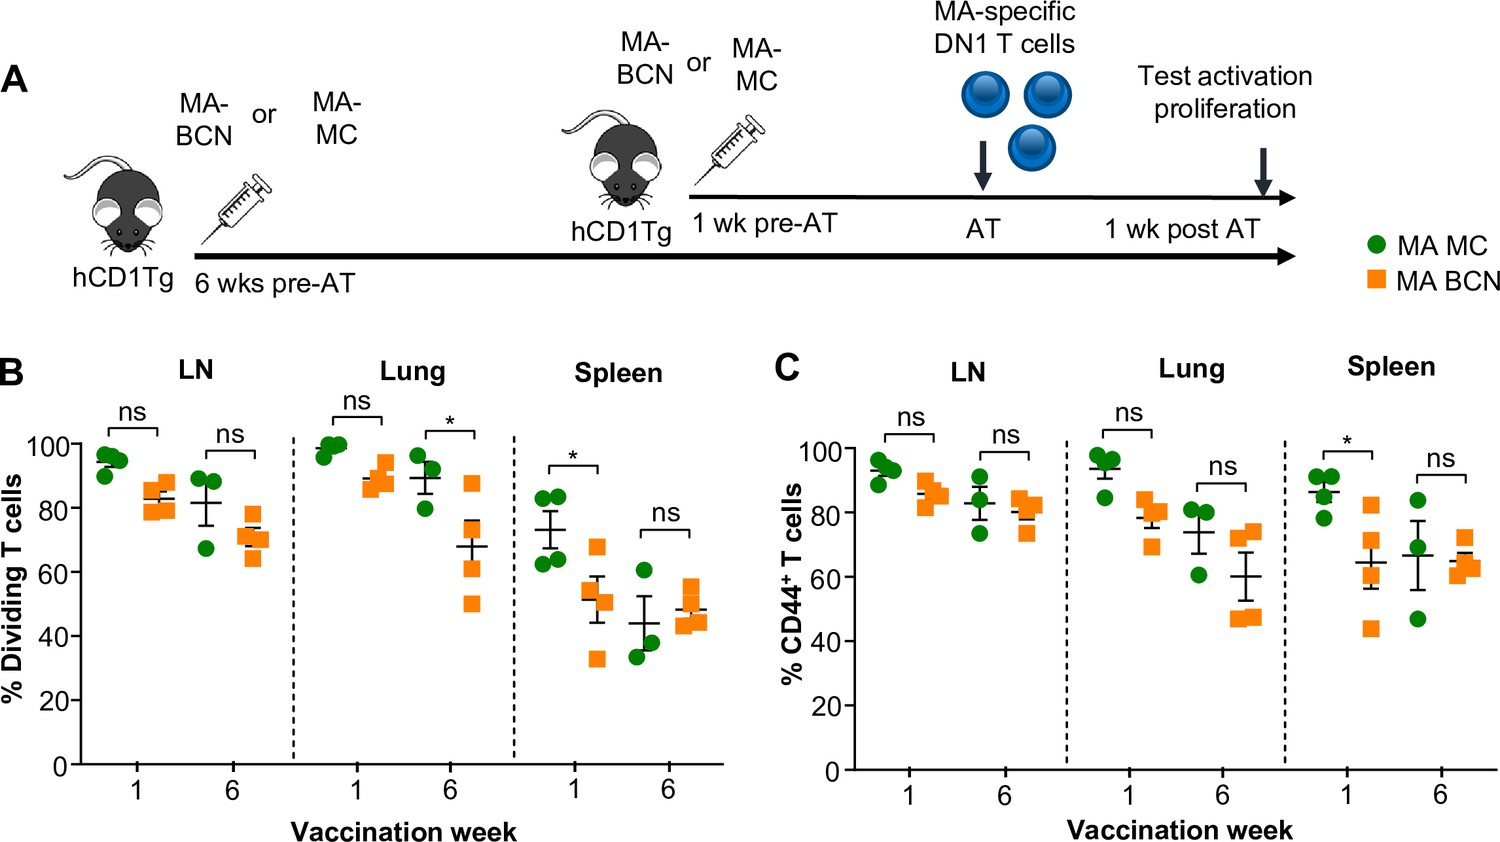
Mycolic acid (MA) encapsulated by either bicontinuous nanospheres (BCN) or MC formulation leads to lipid antigen persistence.
hCD1Tg mice were IT vaccinated with MA-BCN or MA-MC at 6 weeks or 1 week prior to the adoptive transfer of cell trace-stained DN1 T cells. T cell activation and proliferation were measured 1 week after adoptive transfer. (A) Experimental diagram. (B) Percentage of proliferating DN1 T cells in the LN, lung, and spleen. (C) Percentage of CD44-expressing DN1 T cells in the LN, lung, and spleen. N=3 or 4 per condition. Data represented as mean ± SEM. ns = not significant, *p<0.05.
Figure 5—figure supplement 2
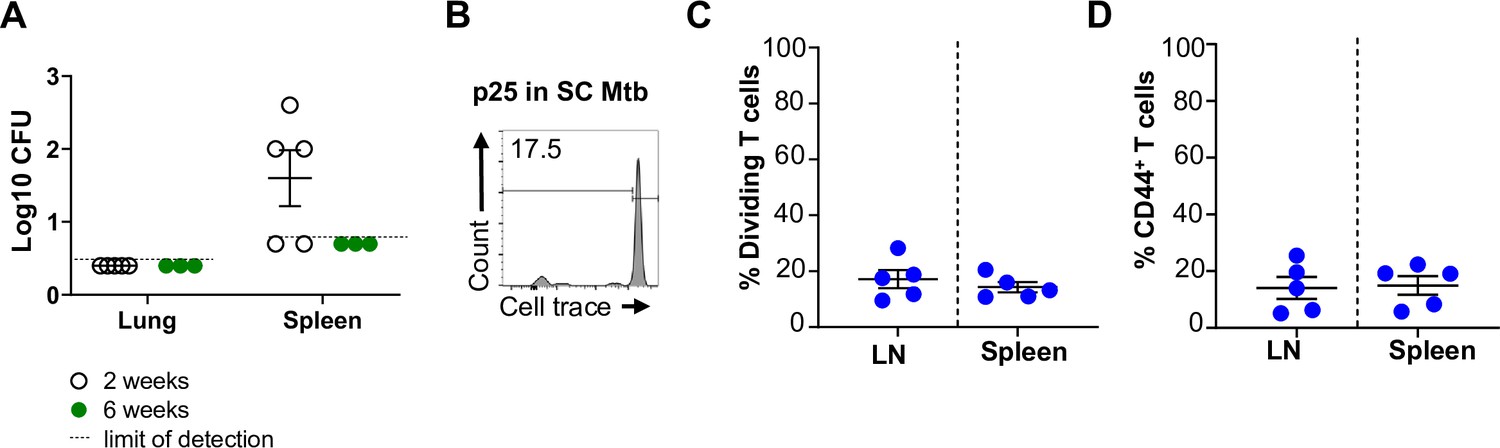
P25-specific T cell activation and proliferation and bacterial burden in attenuated Mycobacterium tuberculosis (Mtb) vaccination.
hCD1Tg were subcutaneous (SC) vaccinated with attenuated Mtb. (A) Bacterial burden in the spleen and lung were determined at 2- or 6 weeks post-vaccination. hCD1Tg mice were vaccinated with attenuated Mtb and after 6 weeks, CellTrace-labeled p25 T cells were adoptively transferred into the mice. After 1 week, T cell activation and proliferation were measured. (B) Representative FACS plots of in LN. (C) Percentage of proliferating P25 T cells in the lymph nodes (LN) and spleen. (D) Percentage of CD44-expressing P25 T cells in the LN and spleen (N=5).
Figure 6 with 2 supplements
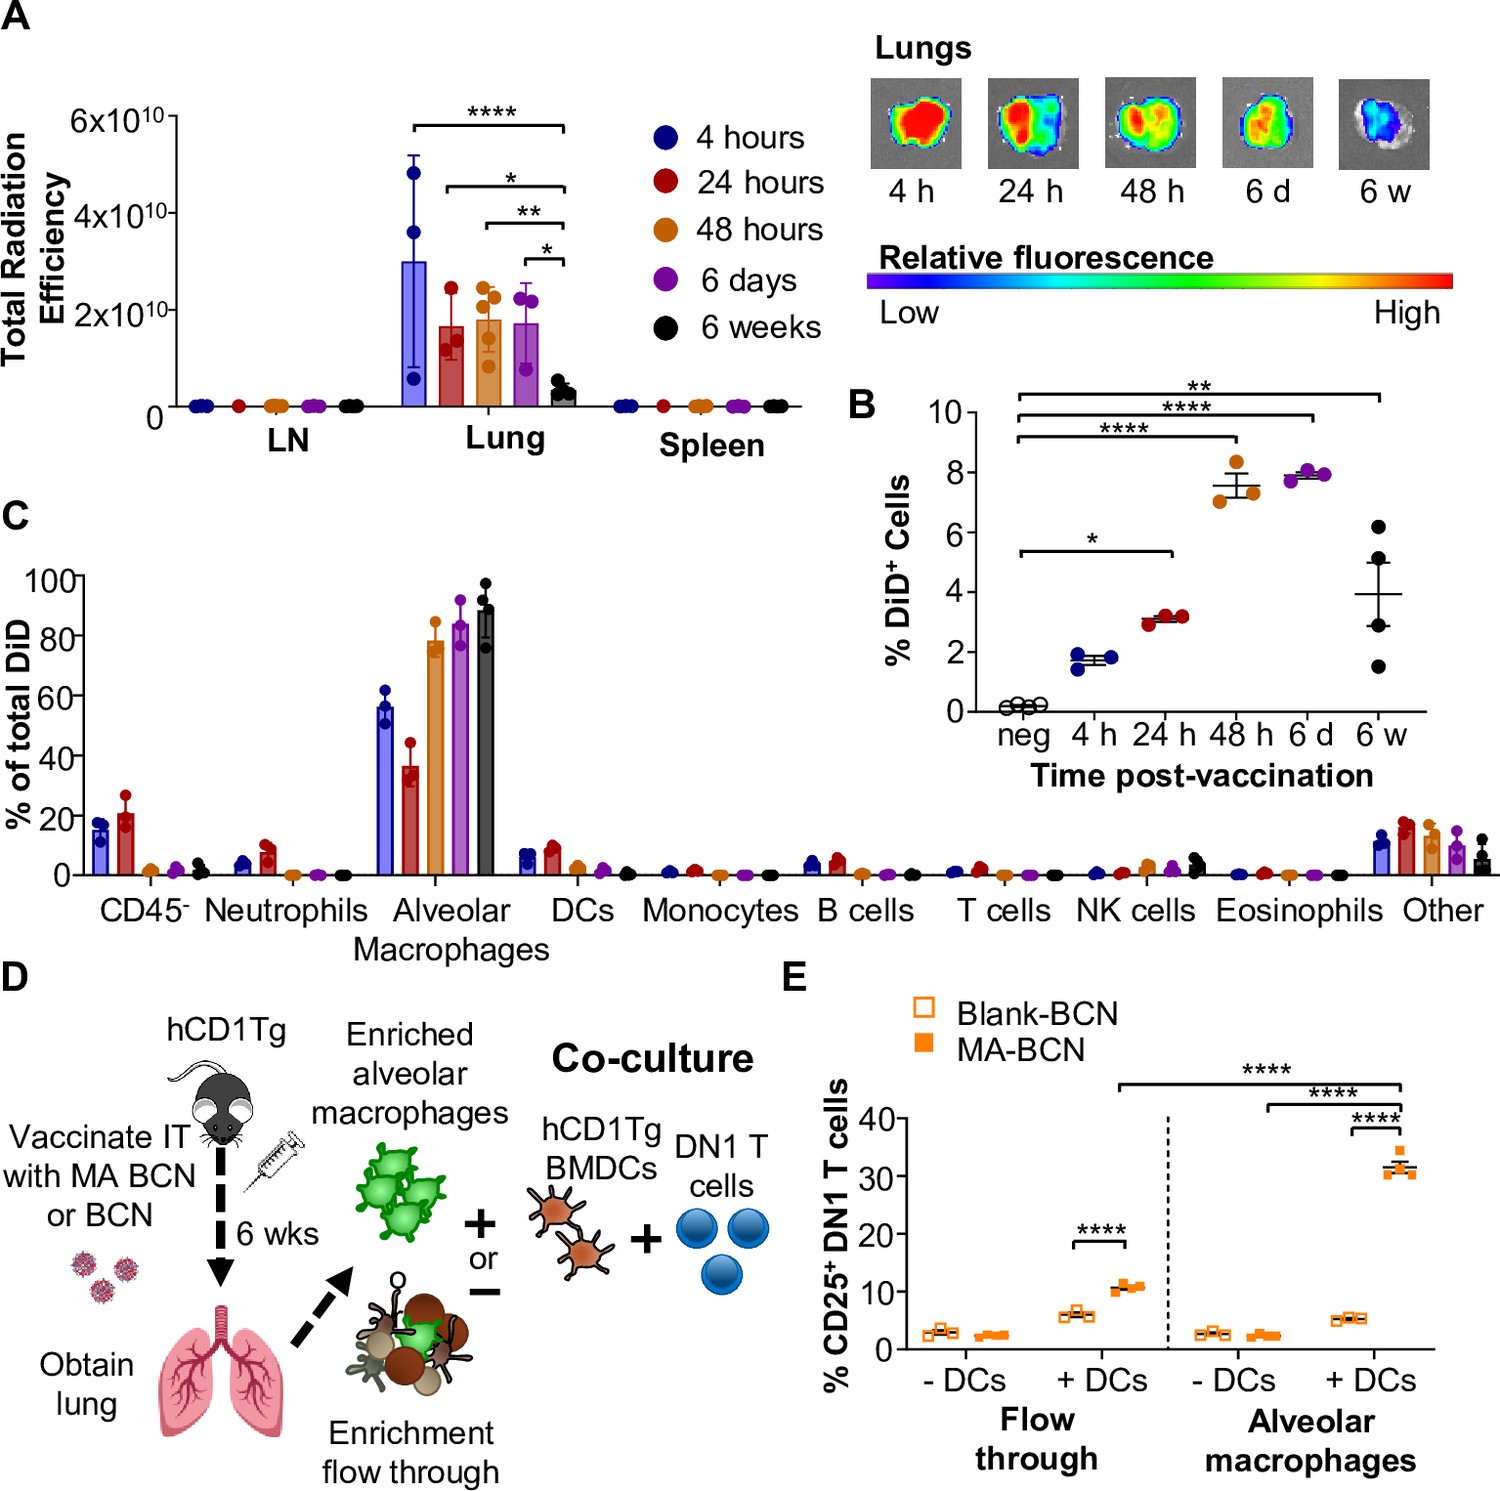
Persistent mycolic acid (MA) remains in part due to encapsulation inside alveolar macrophages and activates T cells through DCs.
B6 or hCD1Tg mice were IT vaccinated with bicontinuous nanospheres (BCN) loaded with a hydrophobic fluorescent dye (DiD) at 6 weeks, 6 days, 48 hr, 24 hr, or 4 hr prior to the experiment. Lymph nodes (LN), lung, and spleen were analyzed using (A) In Vivo Imaging System (IVIS). Single-cell suspension was then obtained and presence of DiD BCN was quantified in (B) total lung, and (C) CD45- cells, neutrophils (Ly6G+), alveolar macrophages (CD11c+SiglecF+), DCs (CD11c+), monocytes (CD11b+CD11c-), B cells (CD19+), T cells (CD3+), NK cells (NK1.1+), eosinophils (CD11c-SiglecF+) by flow cytometry. hCD1Tg mice were IT vaccinated with either BCN or MA-BCN. After 6 weeks, alveolar macrophages were enriched from the lungs using anti-SiglecF. Enriched or flow-through cells were co-cultured with DN1 T cells in the presence or absence of hCD1Tg-expressing bone marrow-derived dendritic cells (BMDCs) for 48 hr, and DN1 T cells activation was measured. (D) Experimental design. (E) Percentage of CD25-expressing DN1 T cells. Data represented as mean ± SEM. Statistical analysis: two-way ANOVA. ns = not significant, *p<0.05, **p<0.01, ***p<0.001.
Figure 6—figure supplement 1
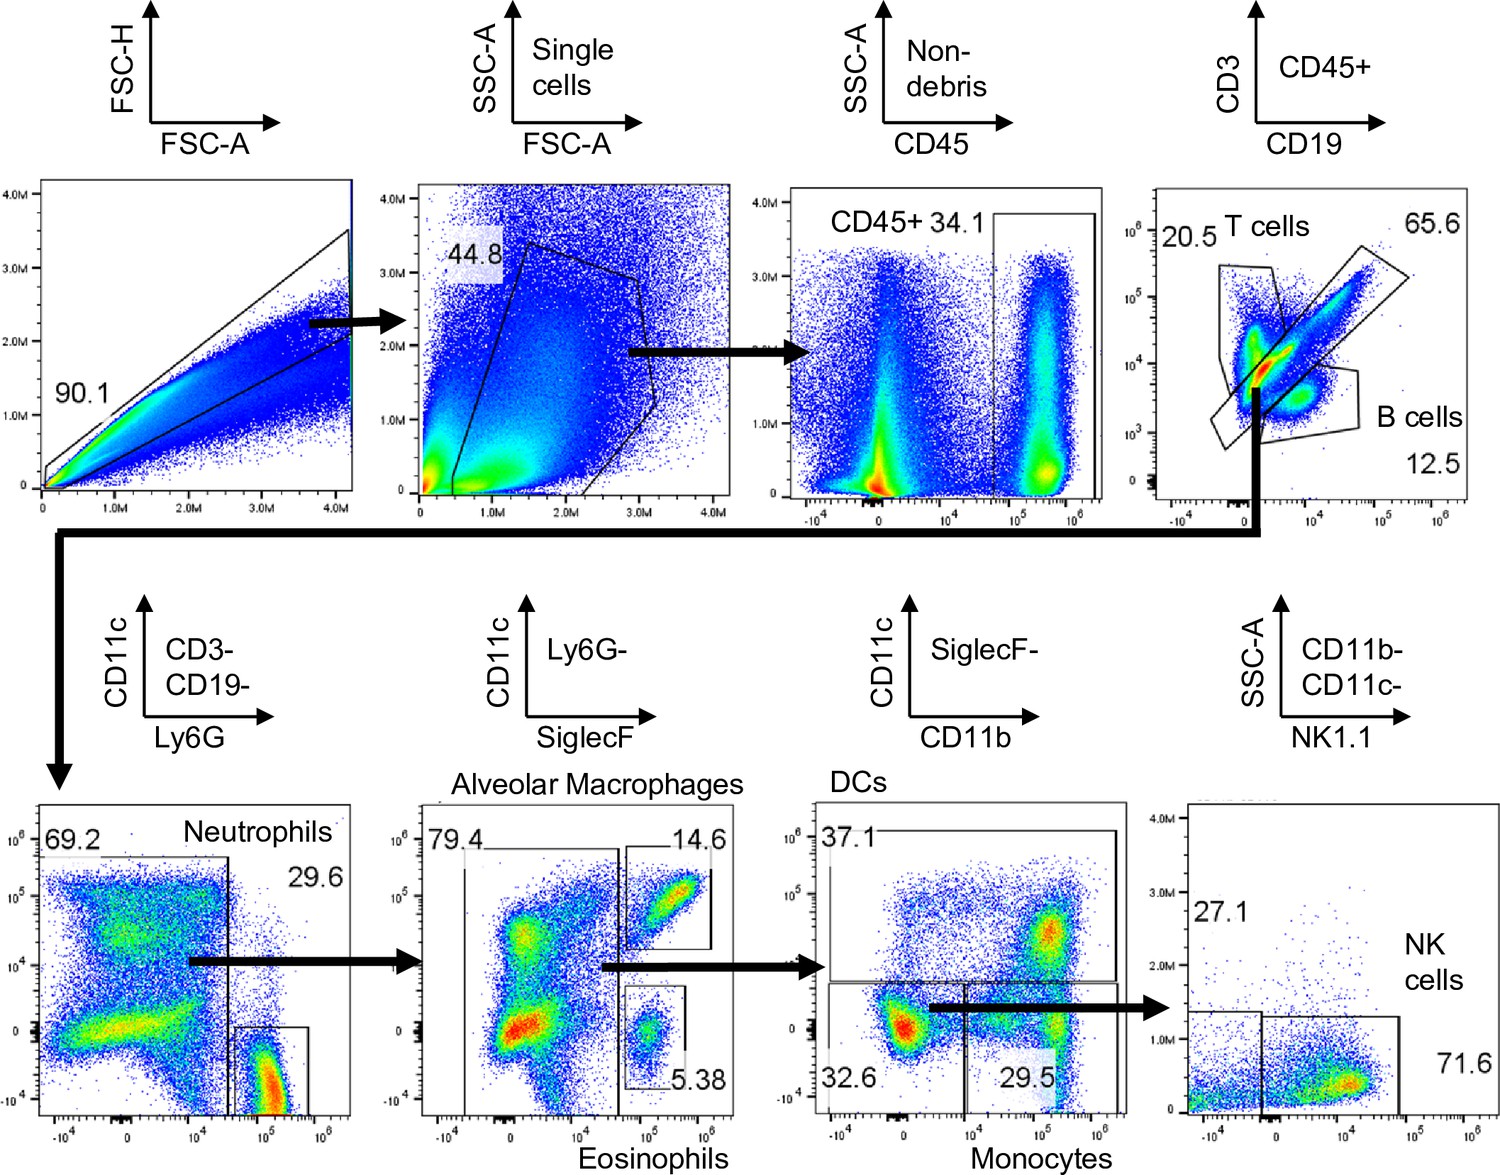
Gating strategy for analyzing biodistribution of bicontinuous nanospheres (BCN) in the lung.
Lung single-cell suspension was gated as follows: CD45- cells, neutrophils (Ly6G+), alveolar macrophages (CD11c+SiglecF+), DCs (CD11c+), monocytes (CD11b+CD11c-), B cells (CD19+), T cells (CD3+), NK cells (NK1.1+), and eosinophils (CD11c-SiglecF+).
Figure 6—figure supplement 2
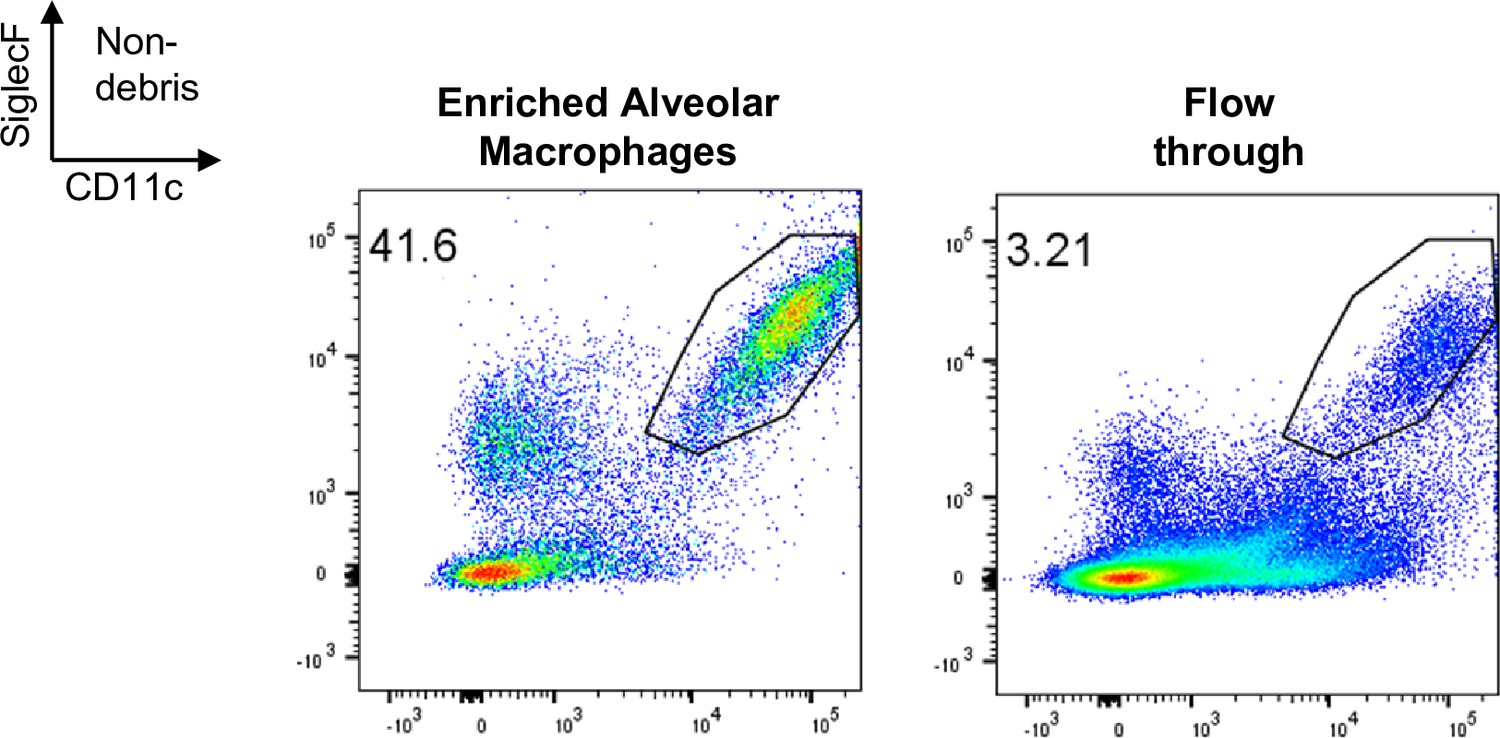
Representative FACS plot of alveolar macrophages within enriched and flow through fractions.
Figure 7 with 1 supplement
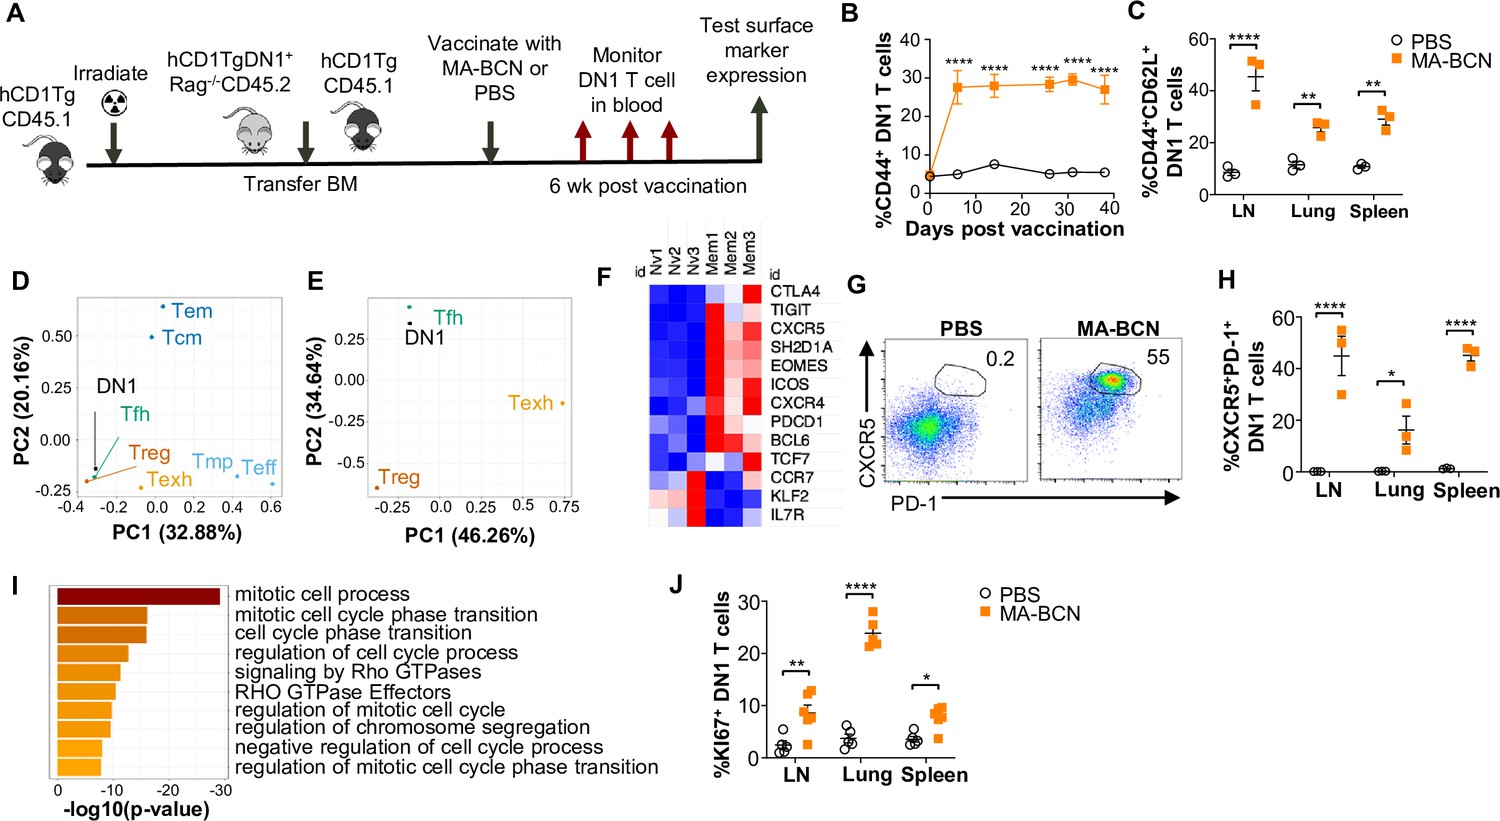
MA-bicontinuous nanospheres (MA-BCN) vaccination leads to DN1 T cell differentiation into T follicular helper-like T cells.
Mixed bone marrow chimeric mice were created by adoptive transfer of DN1 bone marrow and congenic CD45.1 hCD1Tg bone marrow to irradiated hCD1Tg mice. After 5weeks, mice were vaccinated with either MA-BCN or PBS, and DN1 surface marker expression was monitored in the blood and in organs at 6weeks. (A) Experimental design. (B) Percent CD44+ DN1 T cells in the blood at various time points post-vaccination. (C) Percent CD44+CD62L+ DN1 T cells in indicated organs at 6weeks post-vaccination. Memory (CD44+CD62L+) and naïve (CD44-CD62L+) DN1 T cells were sorted from MA-BCN vaccinated hCD1Tg-DN1 BM chimeras at 6weeks post-vaccination and subjected to RNA-seq analysis. N=3 per condition. (D, E) PCA of log fold change of gene expression for each T cell subset was performed relative to internal naïve T cell control. (F) Relative expression of key TFH cell and differentially expressed genes (DEGs) in memory subset. (G) Representative FACS plots of DN1 T cells in the lymph nodes (LN) of mice. Percentage of (H) CXCR5+PD1+ or (J) KI67+ DN1 T cells DN1 T cells in LN, lung, and spleen. N=3–5 per condition. (I) Gene enrichment analysis of upregulated DEGs was performed using Metascape. Data represented as mean ± SEM. Statistical analysis: two-way ANOVA. *p<0.05, **p<0.01, ****p<0.0001.
Figure 7—figure supplement 1
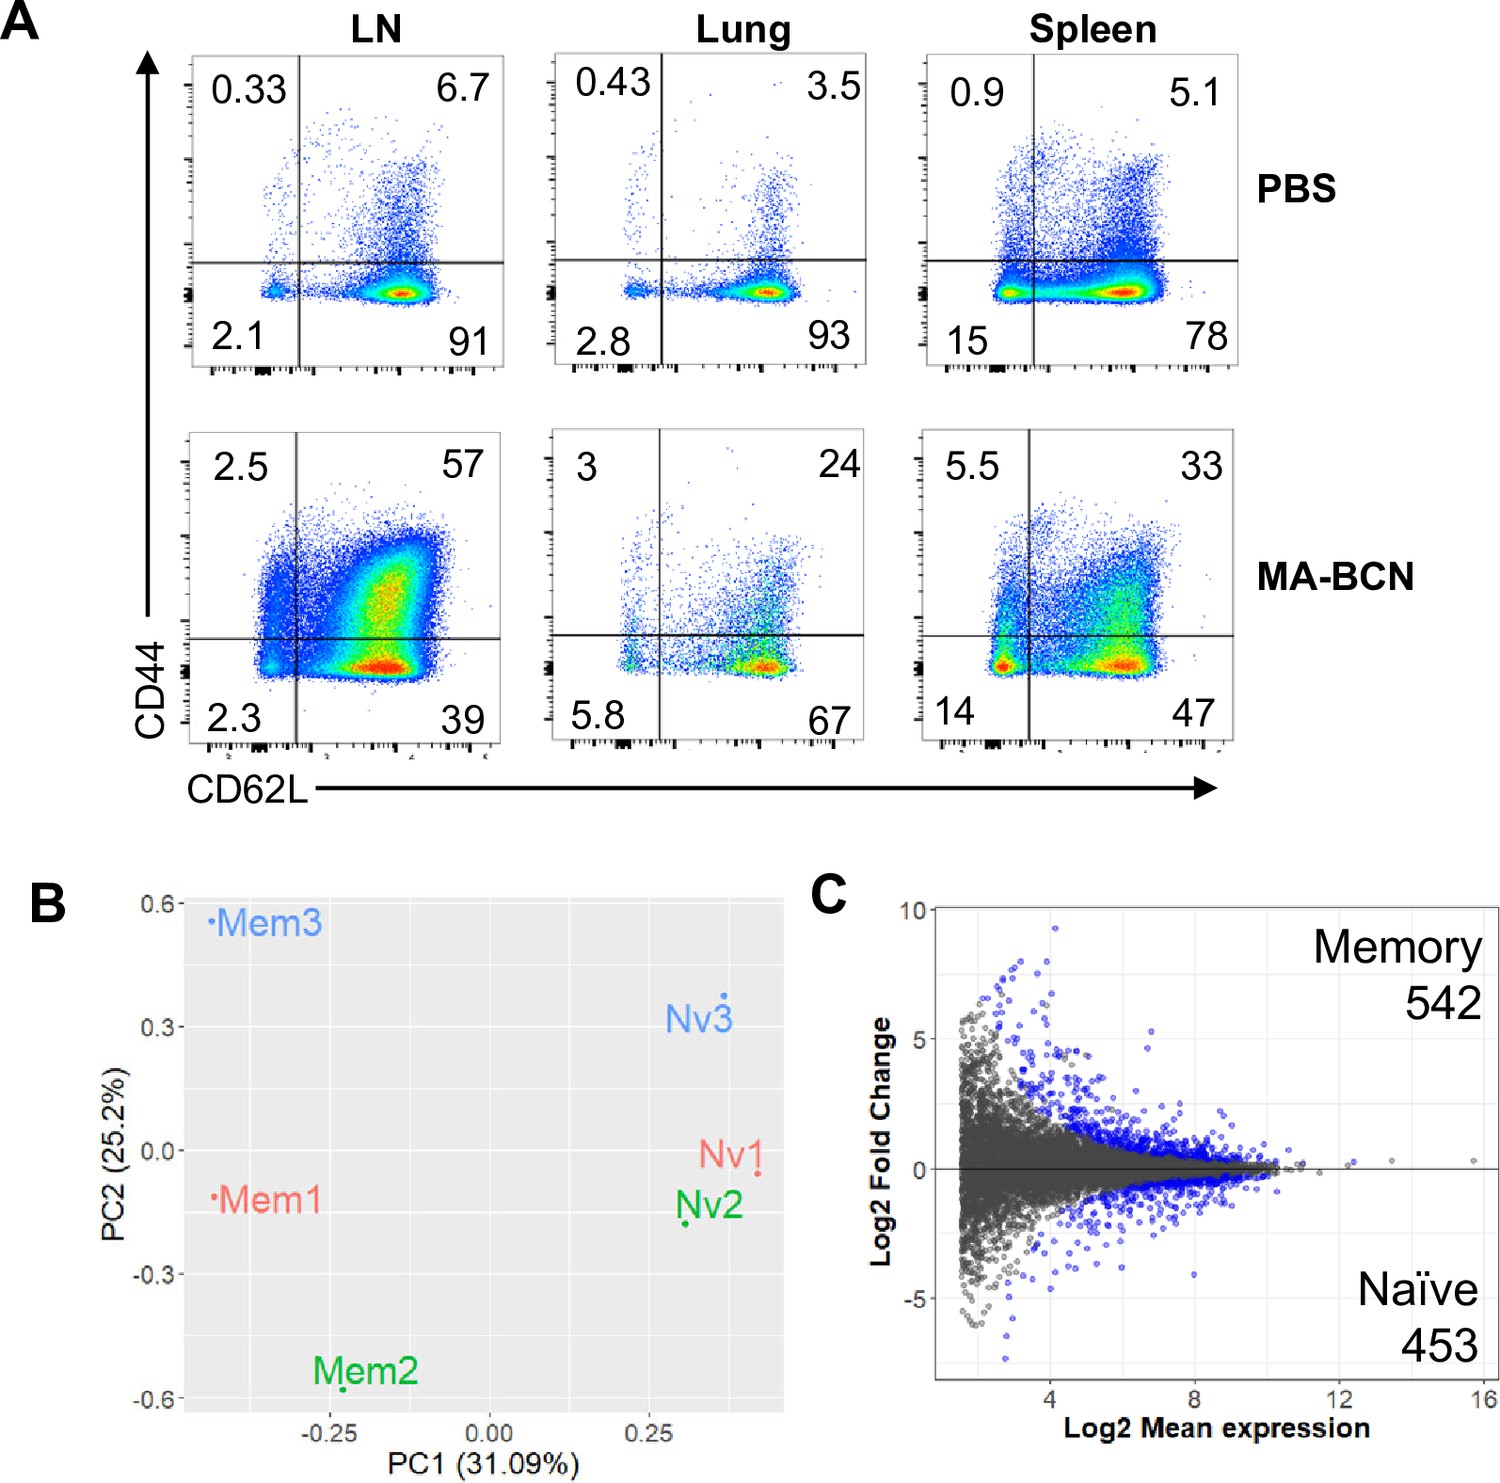
Memory and naïve DN1 T cells display distinct gene expression profiles.
Memory (CD44+CD62L+) and naïve (CD44-CD62L+) DN1 T cells were sorted from lymph nodes (LNs) of MA-bicontinuous nanospheres (MA-BCN) vaccinated hCD1Tg-DN1 BM chimeras at 6 weeks post-vaccination and subjected to RNA-seq analysis (A) Representative figure of CD44 and CD62L expression in DN1 T cells in LN, lung, and spleen. (B) Mycolic acid (MA) plot representing memory vs naïve analysis. (C) Principal component analysis (PCA) of normalized counts. N=3 per condition.
Figure 8

Summary schematic illustrates MA antigen persistence and memory differentiation of antigen-specific T cells induced by vaccination with MA-loaded nanoparticle vaccine.
Mycobacterium tuberculosis (Mtb) derived mycolic acid (MA) lipid and Ag85B protein are encapsulated into bicontinuous nanosphere (BCNs) composed of PEG-b-PPS polymer. These MA-BCN or Ag85B-MA-BCN are used for intratracheal (IT) vaccination of human CD1 transgenic (hCD1Tg) mice. Following vaccination, dendritic cells (DCs) present the antigens, leading to the activation of CD1b-restricted MA-specific or MHCII-restricted Ag85B-specific T cells (DN1 or p25-specific T cells, respectively). Notably, MA can persist within alveolar macrophages and continue to activate MA-specific T cells even at 6 weeks post-vaccination. These MA-specific T cells have the capacity to differentiate into memory T cells with a T follicular-like phenotype.
Additional files
Download links
A two-part list of links to download the article, or parts of the article, in various formats.
Downloads (link to download the article as PDF)
Open citations (links to open the citations from this article in various online reference manager services)
Cite this article (links to download the citations from this article in formats compatible with various reference manager tools)
Vaccination with mycobacterial lipid loaded nanoparticle leads to lipid antigen persistence and memory differentiation of antigen-specific T cells
eLife 12:RP87431.
https://doi.org/10.7554/eLife.87431.3


