Styxl2 regulates de novo sarcomere assembly by binding to non-muscle myosin IIs and promoting their degradation
- Division of Life Science, Hong Kong University of Science & Technology, China
- School of Life Sciences, Chinese University of Hong Kong, China
- Department of Applied Biology and Chemical Technology, Hong Kong Polytechnic University, China
- Department of Orthopaedics and Traumatology, Li Ka Shing Institute of Health Sciences, Chinese University of Hong Kong, China
Figures
Figure 1 with 1 supplement
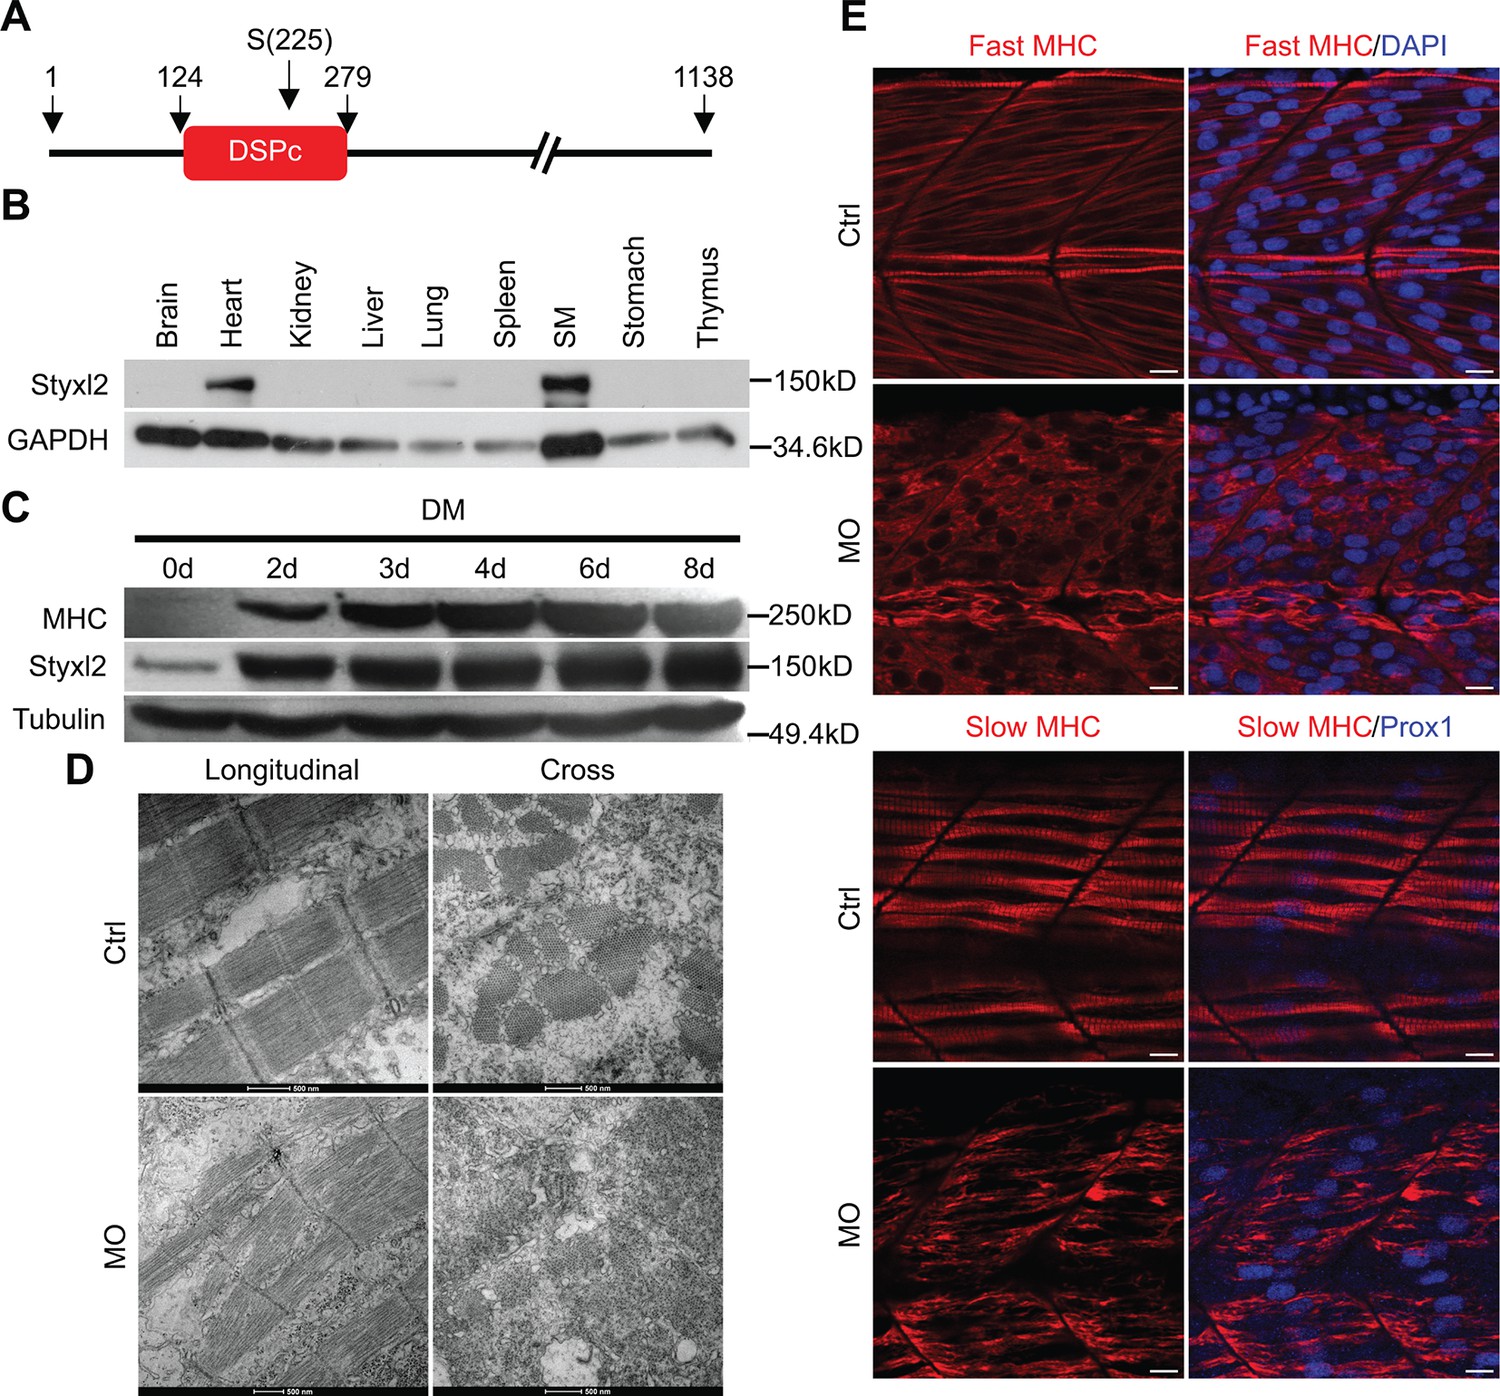
Styxl2 regulates sarcomere integrity during zebrafish muscle development.
(A) A schematic of mouse Styxl2 protein. DSPc (red): dual-specificity phosphatase, catalytic domain. The numbers denote the positions of various amino acids in mouse Styxl2 including Ser (S) –225. (B) The expression of Styxl2 protein in different mouse tissues. 100 μg of soluble mouse tissue lysates were subjected to Western blot analysis. GAPDH: glyceraldehyde-3-phosphate dehydrogenase. SM: skeletal muscles. (C) The expression of Styxl2 protein in C2C12 myoblasts before and after differentiation in culture. MHC: myosin heavy chain. (D) Zebrafish zygotes were either mock-injected or injected with a Styxl2-specific morpholino (MO). Sarcomeres in muscles at 48 hpf were revealed by transmission electron microscopy (TEM). Representative images were shown. Scale bar: 500 nm. (E) Sarcomeres in fast and slow muscles of zebrafish embryos at 24 hpf were revealed by immunostaining using specific antibodies as indicated. Ctrl: control (non-treated); MO: Styxl2-morpholino-treated. The nuclei of slow and fast muscle fibers were counter-stained with an anti-Prox1 antibody and DAPI, respectively. Scale bar: 10 μm.
-
Figure 1—source data 1
Original scans for the Western blot analysis in Figure 1B (anti-Styxl2 and anti-GAPDH).
- https://cdn.elifesciences.org/articles/87434/elife-87434-fig1-data1-v1.zip
-
Figure 1—source data 2
A PDF file showing original scans of the relevant Western blot analysis in Figure 1B (anti-Styxl2 and anti-GAPDH) with highlighted bands and sample labels.
- https://cdn.elifesciences.org/articles/87434/elife-87434-fig1-data2-v1.zip
-
Figure 1—source data 3
Original scans for the Western blot analysis in Figure 1C (anti-MHC, anti-Styxl2, and anti-Tubulin).
- https://cdn.elifesciences.org/articles/87434/elife-87434-fig1-data3-v1.zip
-
Figure 1—source data 4
A PDF file showing original scans of the relevant Western blot analysis in Figure 1C (anti-MHC, anti-Styxl2, and anti-Tubulin) with highlighted bands and sample labels.
- https://cdn.elifesciences.org/articles/87434/elife-87434-fig1-data4-v1.zip
Figure 1—figure supplement 1
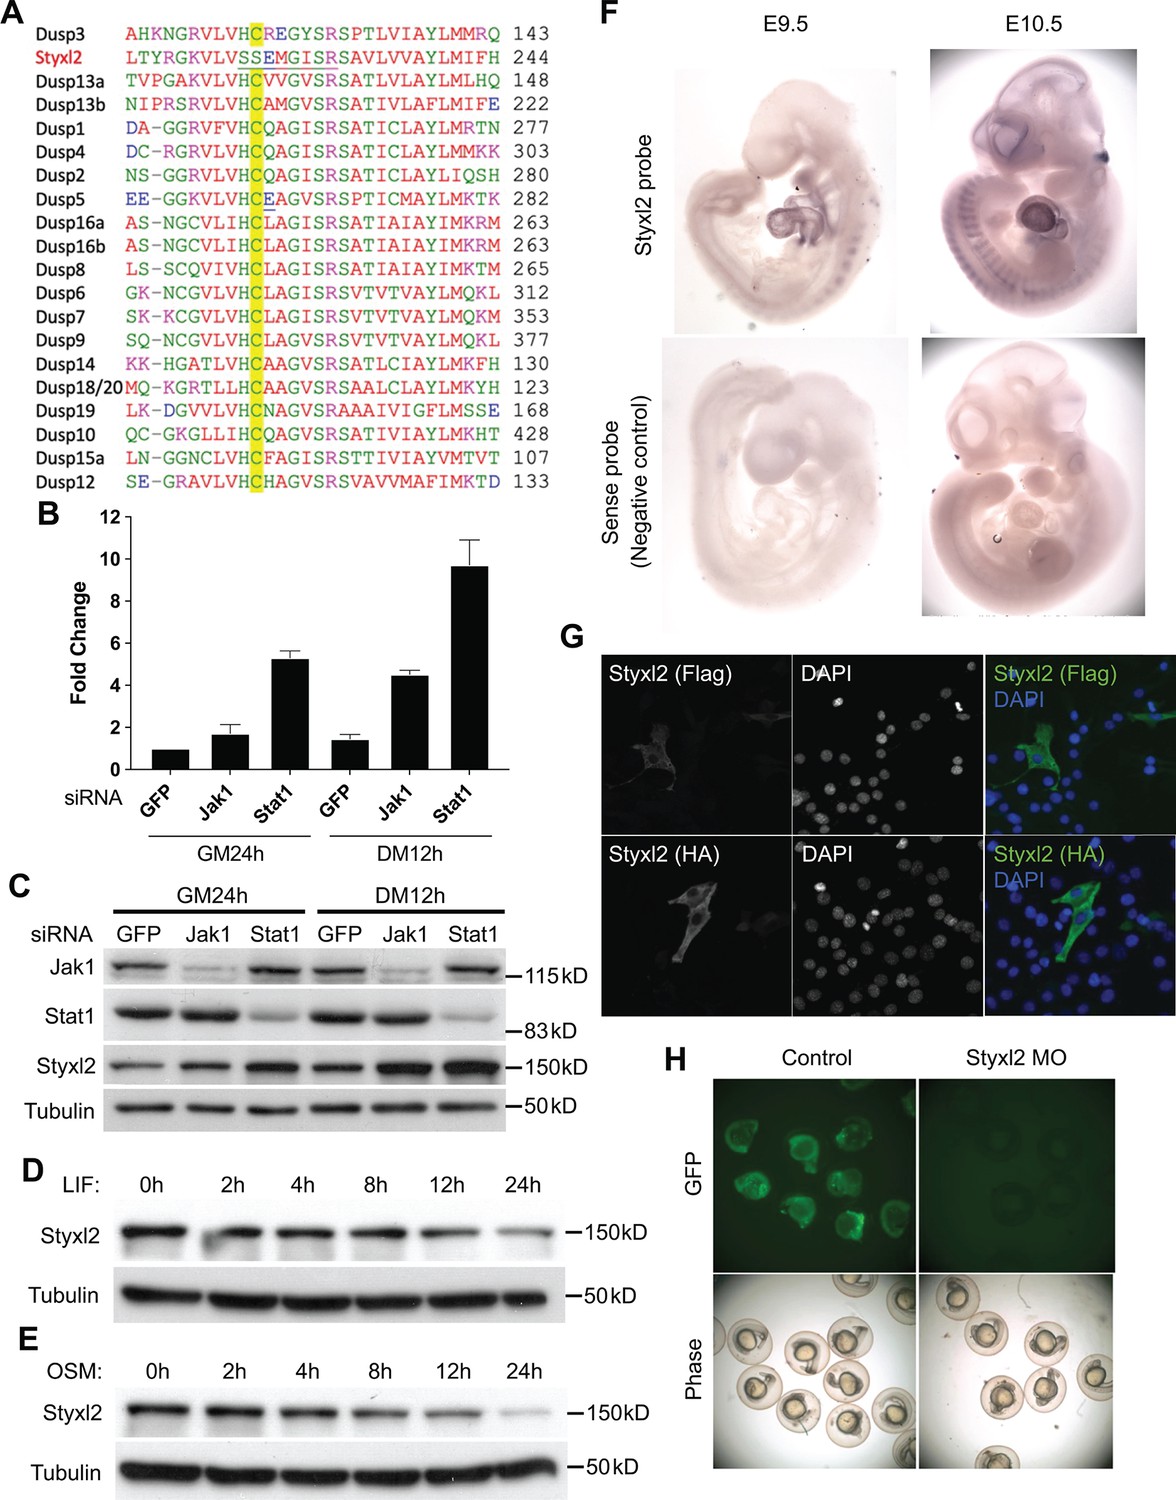
Styxl2 was downstream target of Jak1-Stat1 pathway.
(A) Multiple sequence alignment of the region surrounding the active motif of the dual-specificity phosphatase catalytic (DSPc) domain among mouse dual-specificity phosphatases and Styxl2. The conserved Cys in functional phosphatases was highlighted in yellow. (B, C) C2C12 cells were transfected with various siRNAs as indicated. After growing in growth medium (GM) for 24 hr (h), cells were harvested either right away (GM 24 h) or after growing in differentiation medium (DM) for an additional 12 hr (DM 12 h). The total RNA and soluble whole cell lysates were subjected to RT-qPCR (B) or Western blot analysis (C), respectively. (D, E) C2C12 cells were treated with 10 ng/ml of leukemia inhibitory factor (LIF) or oncostatin M (OSM) for various times. Cell extracts were subjected to Western blot analysis. (F) Mouse embryos at E9.5 and E10.5 were subjected to in situ hybridization using either sense (control) or antisense probe specific for mouse Styxl2. (G) C2C12 cells were transfected with constructs expressing Flag- or HA-tagged Styxl2 for 24 hr. Cells were then fixed and subjected to immunostaining for Flag or HA. (H) Zebrafish zygotes were co-injected with a plasmid encoding GFP fused with the sequence targeted by Styxl2-morpholino oligo (MO) at the start codon together with or without Styxl2-MO. The phase-contrast and fluorescent images were taken and the representative images were shown.
-
Figure 1—figure supplement 1—source data 1
Original scans for the Western blot analysis in Figure 1—figure supplement 1C (anti-Jak1, anti-Stat1, anti-Styxl2, and anti-Tubulin).
- https://cdn.elifesciences.org/articles/87434/elife-87434-fig1-figsupp1-data1-v1.zip
-
Figure 1—figure supplement 1—source data 2
A PDF file showing original scans of the relevant Western blot analysis in Figure 1—figure supplement 1C (anti-Jak1, anti-Stat1, anti-Styxl2, and anti-Tubulin) with highlighted bands and sample labels.
- https://cdn.elifesciences.org/articles/87434/elife-87434-fig1-figsupp1-data2-v1.zip
-
Figure 1—figure supplement 1—source data 3
Original scans for the Western blot analysis in Figure 1—figure supplement 1D (anti-Styxl2).
- https://cdn.elifesciences.org/articles/87434/elife-87434-fig1-figsupp1-data3-v1.zip
-
Figure 1—figure supplement 1—source data 4
Original scans for the Western blot analysis in Figure 1—figure supplement 1D and E (anti-Tubulin in D, anti-Styxl2, and anti-Tubulin in E).
- https://cdn.elifesciences.org/articles/87434/elife-87434-fig1-figsupp1-data4-v1.zip
-
Figure 1—figure supplement 1—source data 5
A PDF file showing original scans of the relevant Western blot analysis in Figure 1—figure supplement 1D and E (anti-Styxl2 and anti-Tubulin in D, anti-Styxl2, and anti-Tubulin in E) with highlighted bands and sample labels.
- https://cdn.elifesciences.org/articles/87434/elife-87434-fig1-figsupp1-data5-v1.zip
Figure 2 with 1 supplement
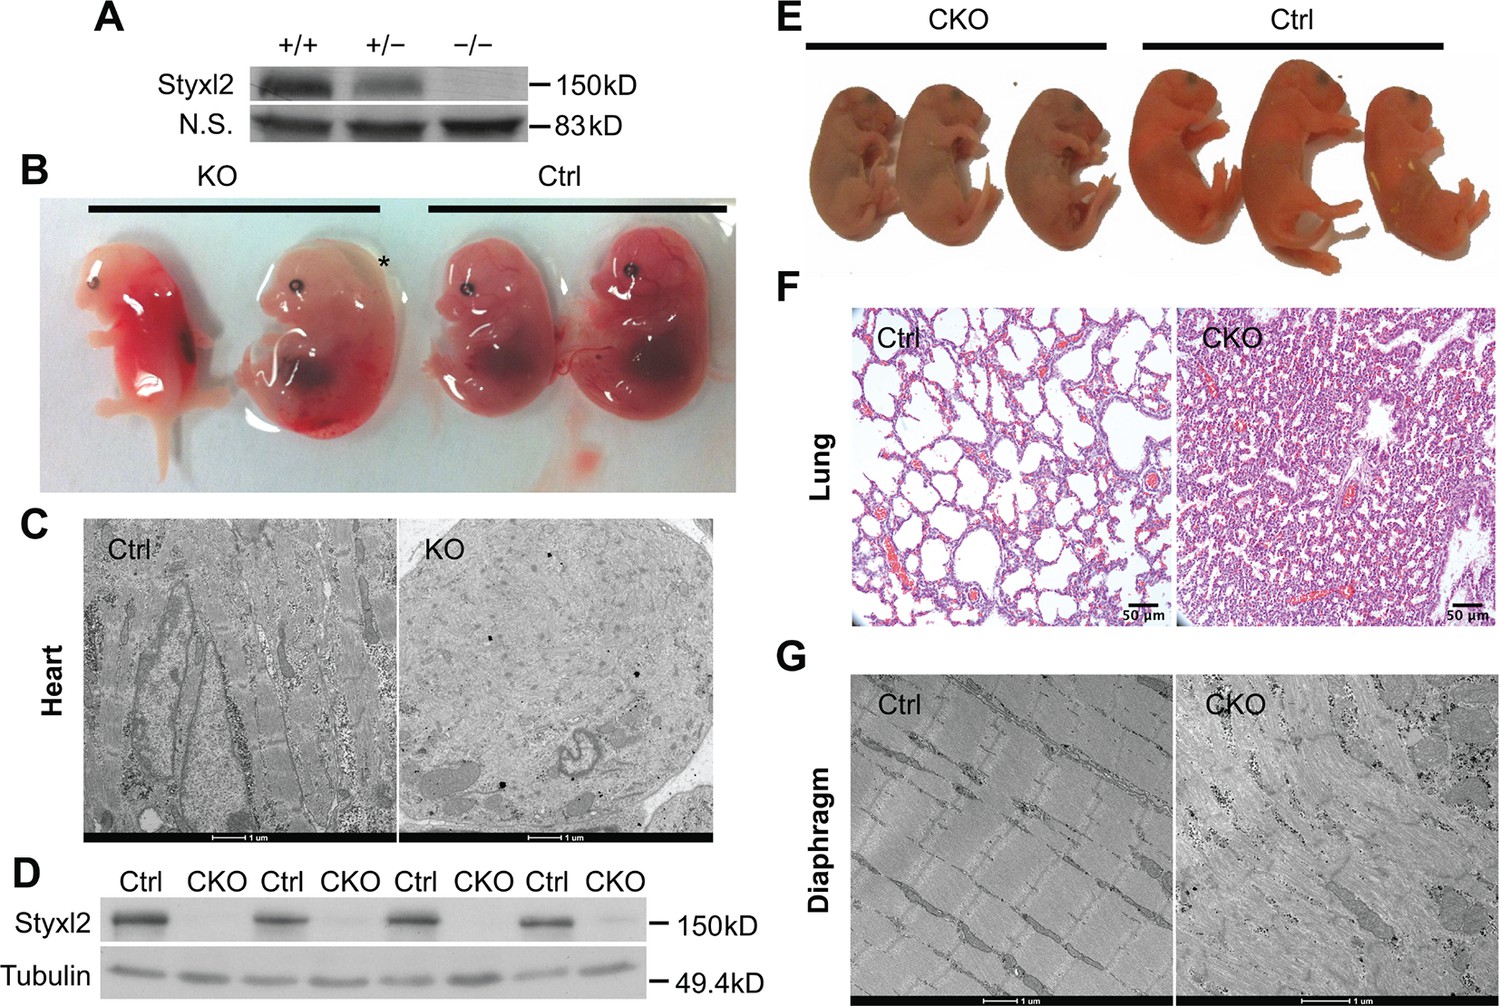
Conditional deletion of mouse Styxl2 leads to defective sarcomeres in striated muscles.
(A) The expression of Styxl2 protein in skeletal muscles of wild-type (+/+), heterozygous (+/−), and Styxl2 knockout (KO) (−/−) (driven by EIIA-Cre) mice. Soluble tissue lysates from limbs of E14.5 mouse embryos were subjected to Western blot analysis. N.S.: non-specific. (B) E14.5 embryos of control (Ctrl) and EIIA-Cre; Styxl2f/f KO mice. *: edema was found in some Styxl2 KO foetuses. (C) The sarcomere structures of cardiomyocytes in the heart of E14.5 embryos from control and EIIA-Cre; Styxl2f/f KO mice were revealed by transmission electron microscopy (TEM). Scale bar: 1 μm. (D) The expression of Styxl2 protein in skeletal muscles of control (Ctrl) and Styxl2 CKO P1 mice. (E) The new-born pups (P1) from control (Ctrl) and Pax7Cre/+; Styxl2f/f KO mice (CKO). (F) Lung sections of control and Styxl2 CKO P1 mice. Scale bar: 50 μm. (G) The sarcomere structure of diaphragm muscles from control (Ctrl) and Styxl2 conditional KO (CKO) P1 mice revealed by TEM. Scale bar: 1 μm.
-
Figure 2—source data 1
Original scans for the Western blot analysis in Figure 2A (anti-Styxl2 and N.S.).
- https://cdn.elifesciences.org/articles/87434/elife-87434-fig2-data1-v1.zip
-
Figure 2—source data 2
A PDF file showing original scans of the relevant Western blot analysis in Figure 2A (anti-Styxl2 and N.S.) with highlighted bands and sample labels.
- https://cdn.elifesciences.org/articles/87434/elife-87434-fig2-data2-v1.zip
-
Figure 2—source data 3
Original scans for the Western blot analysis in Figure 2D (anti-Styxl2 and anti-Tubulin).
- https://cdn.elifesciences.org/articles/87434/elife-87434-fig2-data3-v1.zip
-
Figure 2—source data 4
A PDF file showing original scans of the relevant Western blot analysis in Figure 2D (anti-Styxl2 and anti-Tubulin) with highlighted bands and sample labels.
- https://cdn.elifesciences.org/articles/87434/elife-87434-fig2-data4-v1.zip
Figure 2—figure supplement 1
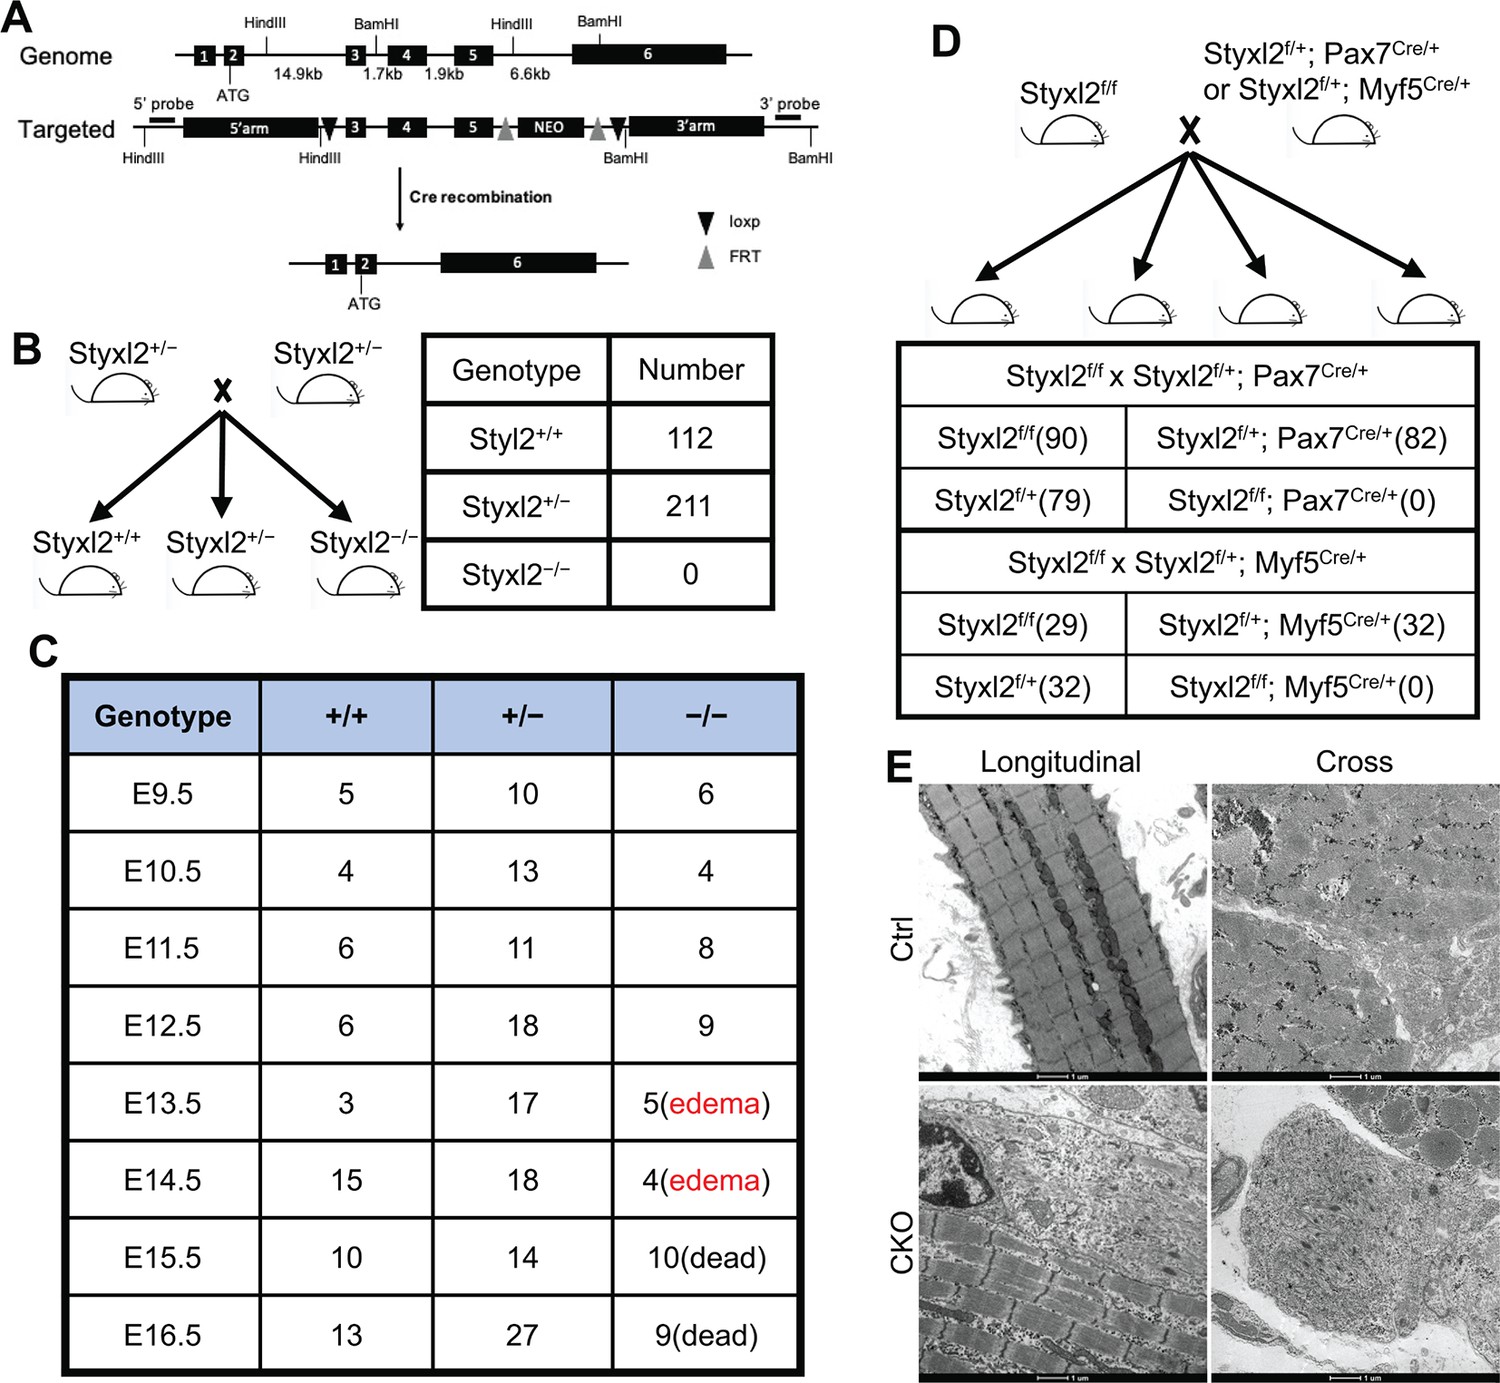
Both germline and conditional deletion of Styxl2 caused lethality.
(A) The schematic of the genomic locus of mouse Styxl2 and the targeting strategy. The probes used for Southern blot are indicated by black bars. (B, C) The schematic of the mating strategy to generate Styxl2 germ-line knockout (KO) mice was shown (B). The number of live pups (B) and that of embryos (C) of different genotypes at different embryonic stages were counted and presented. (D) The schematic of the mating strategy to generate conditional Styxl2 KO mice and the number of live pups (in brackets) older than 1 day were shown. (E) Hindlimb muscle sections from control (Ctrl) and Styxl2 conditional KO (CKO) P1 mice were subjected to electron microscopy analysis. Scale bar: 1 μm.
Figure 3
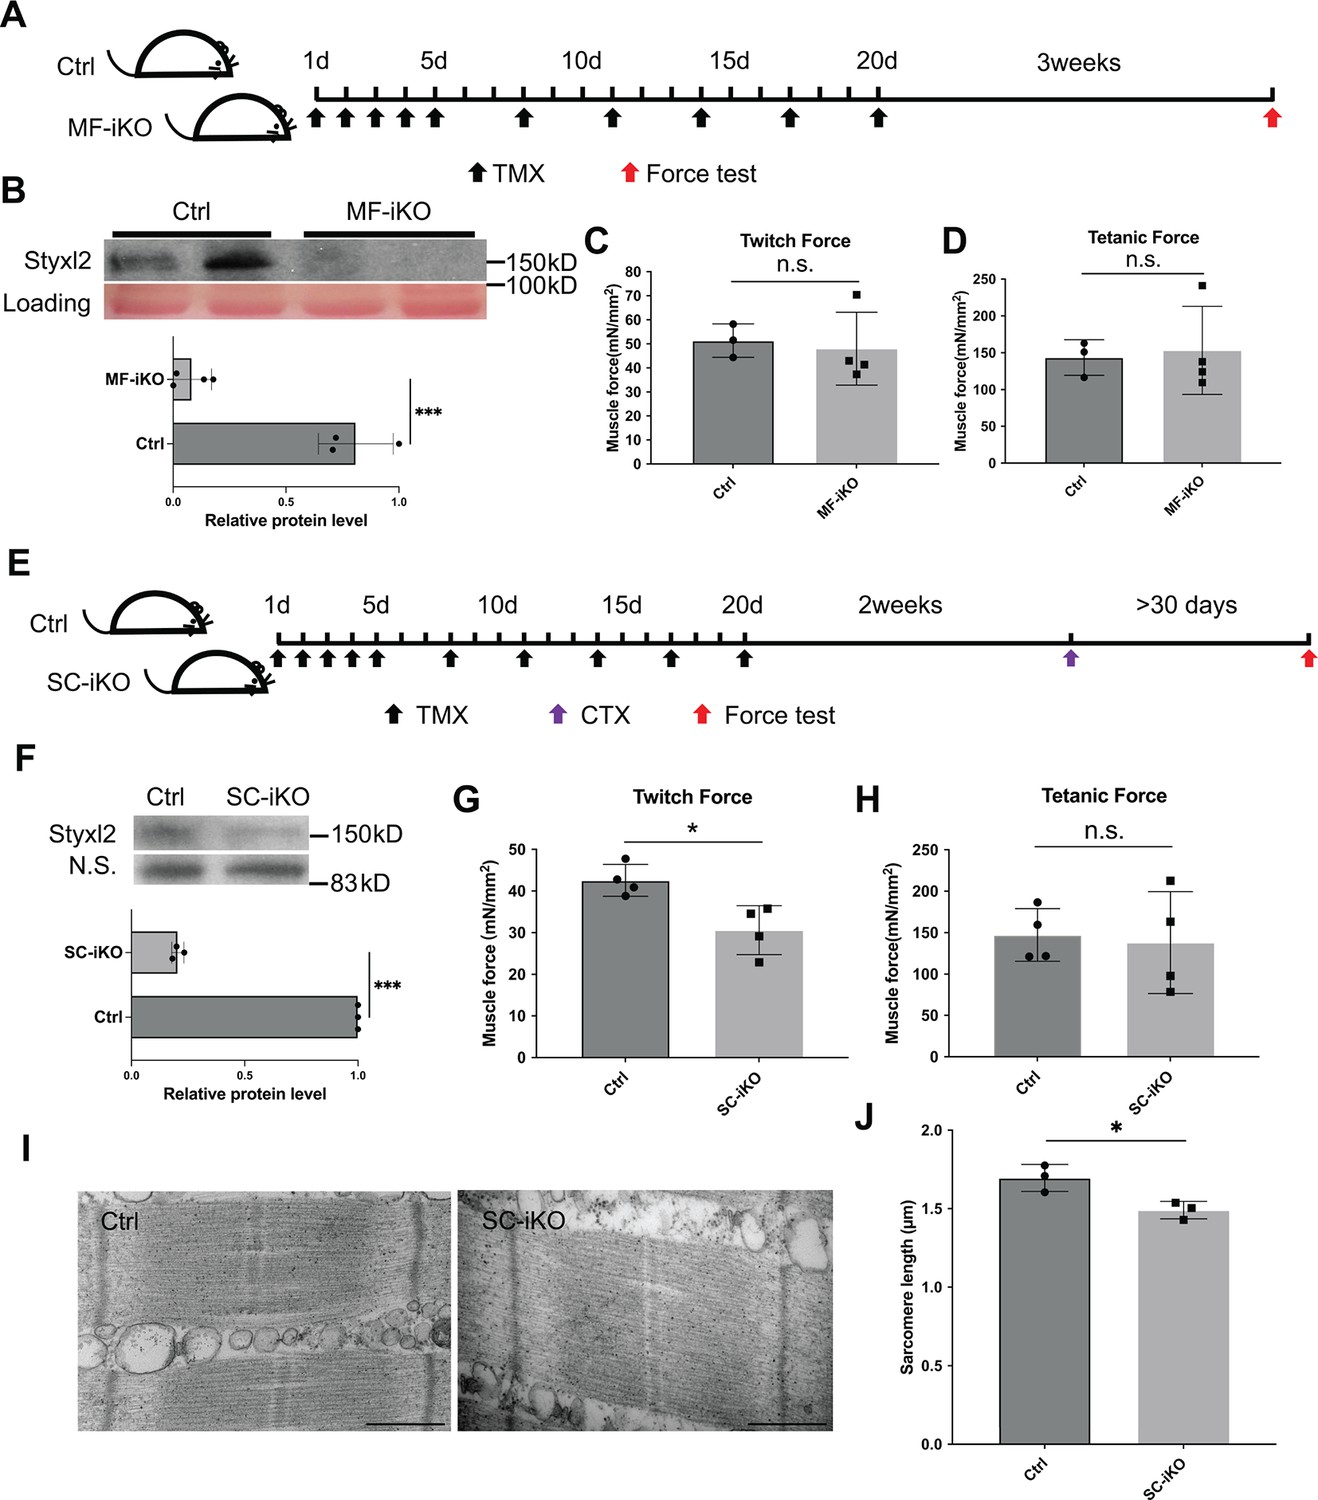
Styxl2 is not required for sarcomere maintenance but involved in de novo sarcomere assembly in adult muscles.
(A) The schematic to assess the role of Styxl2 in sarcomere maintenance in adult muscles. TMX: tamoxifen. (B) Styxl2 protein levels in control (Ctrl) and myofiber-specific Styxl2 knockout (MF-iKO) mouse gastrocnemius muscles used for force test. The band intensity of Styxl2 was quantified by ImageJ. (C, D) The twitch and tetanic force generated by gastrocnemius muscles of three Ctrl and four MF-iKO mice were measured. In (A–D), Ctrl: Styxl2f/f mice; MF-iKO: Tg: HSA-MerCreMer; Styxl2f/f mice. (E) The schematic to assess the role of Styxl2 in de novo sarcomere assembly in adult muscles. CTX: cardiotoxin. (F) Styxl2 protein levels in regenerated gastrocnemius muscles used for force test. N.S.: non-specific. The band intensity of Styxl2 was quantified. (G, H) Twitch and tetanic force by regenerated gastrocnemius muscles were measured from four pairs of control and MuSC-specific Styxl2 KO (SC-iKO) mice. (I) Transmission electron microscopy (TEM) images of the muscle used for force generation test. Scale bar: 500 nm. (J) Quantification of sarcomere length in (I). TEM images from three pairs of mice were examined and the length of 3–5 sarcomeres from each mouse was measured. In (E–J), Ctrl: Pax7CreERT2/CreERT2 mice; SC-iKO: Pax7CreERT2/CreERT2; Styxl2f/f mice. n.s.: not significant. *p-value <0.05. ***p-value <0.001.
-
Figure 3—source data 1
Original scans for the Western blot analysis in Figure 3B (anti-Styxl2 and Loading).
- https://cdn.elifesciences.org/articles/87434/elife-87434-fig3-data1-v1.zip
-
Figure 3—source data 2
A PDF file showing original scans of the relevant Western blot analysis in Figure 3B (anti-Styxl2 and Loading) with highlighted bands and sample labels.
- https://cdn.elifesciences.org/articles/87434/elife-87434-fig3-data2-v1.zip
-
Figure 3—source data 3
Original scans for the Western blot analysis in Figure 3F (anti-Styxl2 and N.S.).
- https://cdn.elifesciences.org/articles/87434/elife-87434-fig3-data3-v1.zip
-
Figure 3—source data 4
A PDF file showing original scans of the relevant Western blot analysis in Figure 3F (anti-Styxl2 and N.S.) with highlighted bands and sample labels.
- https://cdn.elifesciences.org/articles/87434/elife-87434-fig3-data4-v1.zip
Figure 4 with 1 supplement
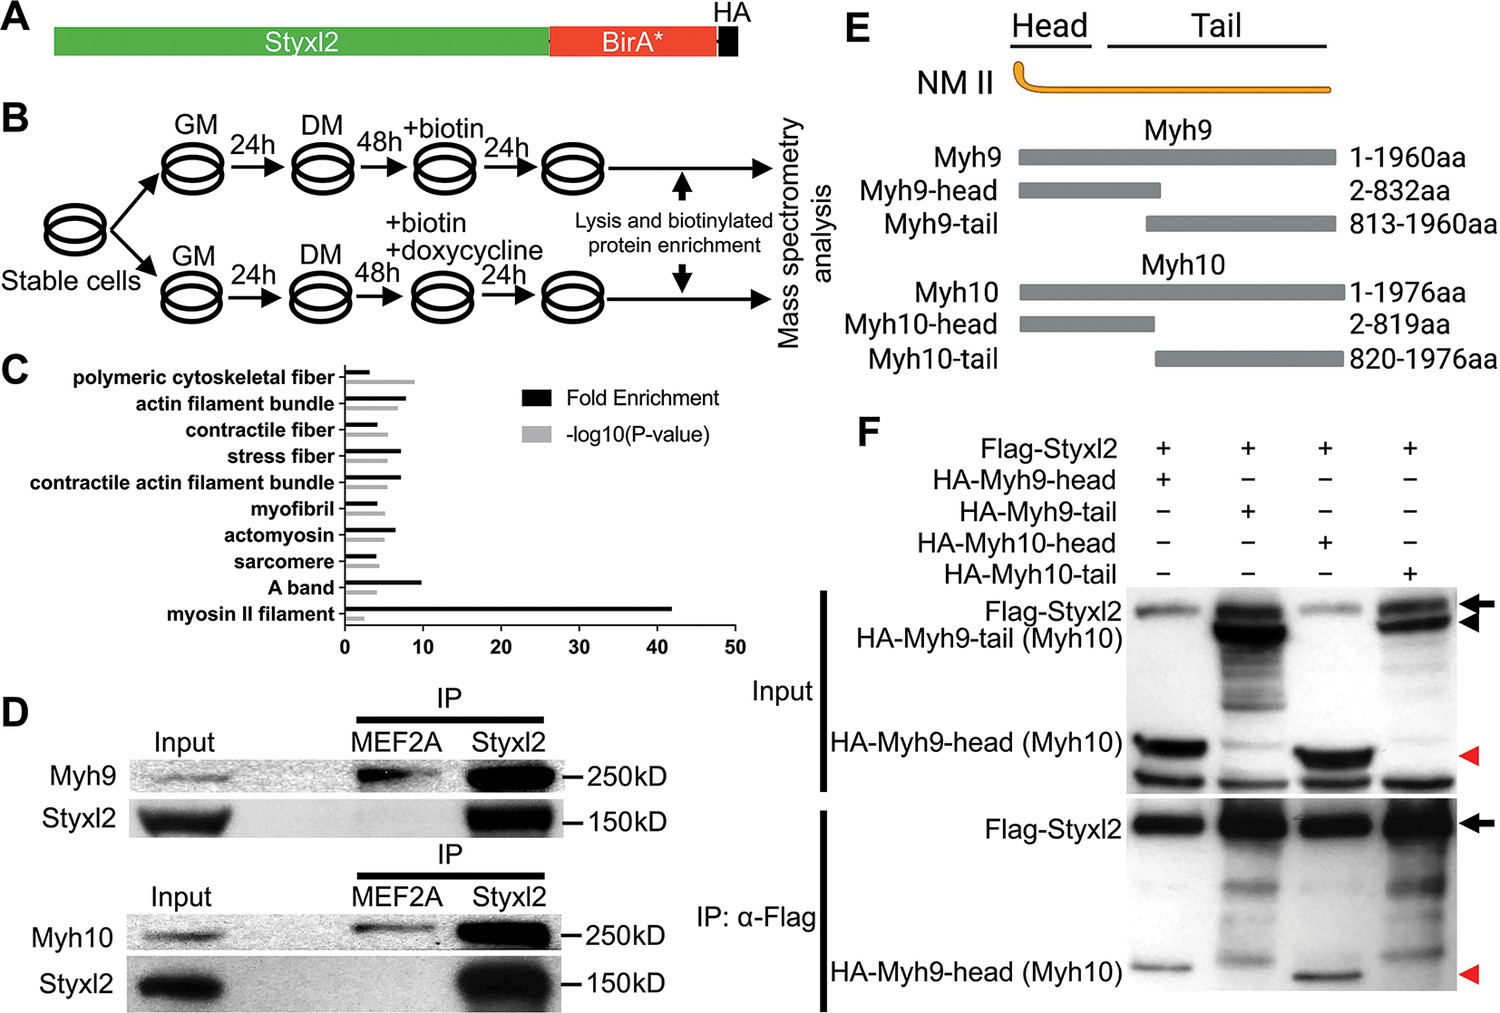
Styxl2 binds to non-muscle myosin IIs.
(A) The schematic of the fusion protein Styxl2-BirA*-HA. (B) The workflow of sample preparation for BioID. (C) Enriched (with Enrichment score >1) biotinylated proteins in cells expressing Styxl2-BirA*-HA relative to that in control cells were identified by mass spectrometry followed by Gene Ontology (GO) analysis. Myofibril-related terms were shown. (D) C2C12 cells were harvested after 2 days in differentiation medium (DM) and the soluble whole cell lysates were subjected to immunoprecipitation (IP) using either an anti-MEF2A (negative control) or an anti-Styxl2 antibody. The endogenous Myh9 or Myh10 was detected by Western blot. (E) The schematic shows the domains of non-muscle myosin IIs (NM II). (F) HEK 293T cells were transfected with Flag-Styxl2 (black arrow) together with HA-NM II-head (red arrowheads) or HA-NM II-tail (black arrowheads). The soluble whole cell lysates were subjected to IP with an anti-Flag antibody and the co-immunoprecipitated proteins were detected by Western blot.
-
Figure 4—source data 1
Original scans for the Western blot analysis of input and IP in Figure 4D (anti-Styxl2, anti-Myh9, and anti-Myh10).
- https://cdn.elifesciences.org/articles/87434/elife-87434-fig4-data1-v1.zip
-
Figure 4—source data 2
A PDF file showing original scans of the relevant Western blot analysis in Figure 4D (anti-Styxl2, anti-Myh9, and anti-Myh10) with highlighted bands and sample labels.
- https://cdn.elifesciences.org/articles/87434/elife-87434-fig4-data2-v1.zip
-
Figure 4—source data 3
Original scans for the Western blot analysis of input and IP in Figure 4F (anti-Flag and anti-HA).
- https://cdn.elifesciences.org/articles/87434/elife-87434-fig4-data3-v1.zip
-
Figure 4—source data 4
A PDF file showing original scans of the relevant Western blot analysis in Figure 4F (anti-Flag and anti-HA) with highlighted bands and sample labels.
- https://cdn.elifesciences.org/articles/87434/elife-87434-fig4-data4-v1.zip
Figure 4—figure supplement 1
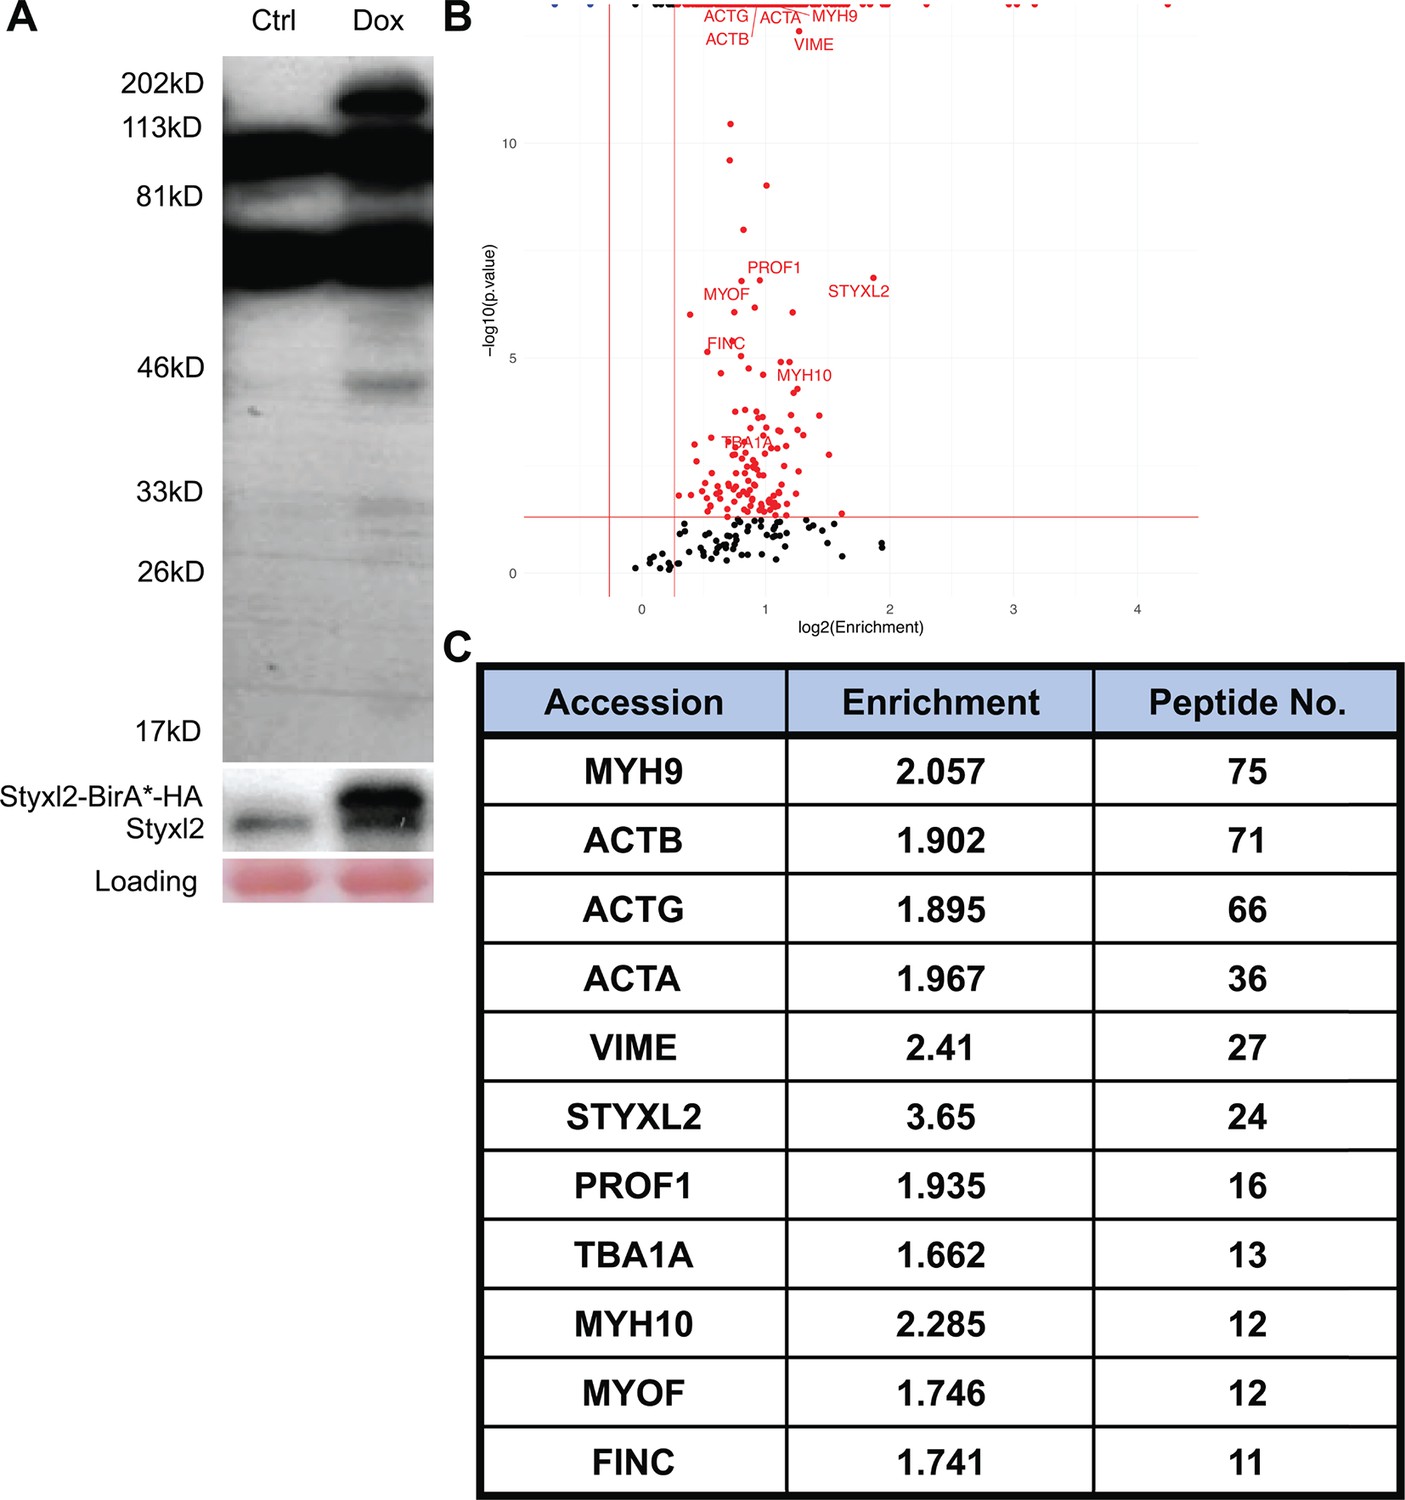
Identification of Styxl2-interacting partners by BioID.
(A) A representative gel of samples from BioID before mass spectrometry analysis. Whole cell lysates from control (Ctrl) and Doxycycline-treated (Dox) cells were subjected to Western blot using Streptavidin-HRP (top panel) or an anti-Styxl2 antibody (middle panel). (B) The biotinylated proteins identified by mass spectrometry were plotted with the log2Enrichment scores on the X-axis and the minus log10(p.value) on the Y-axis. The Enrichment score denotes the ratio of the peak intensity of reporter ions. Red dots indicate proteins with the Enrichment score >1.2 and p-value <0.05. Blue dots indicate proteins with the Enrichment score <0.83 and p-value <0.05. (C) Selected candidate proteins with more than 10 recovered peptides were shown.
-
Figure 4—figure supplement 1—source data 1
Original scans for the Western blot analysis in Figure 4—figure supplement 1A (Streptavidin-HRP, anti-Styxl2, and Loading).
- https://cdn.elifesciences.org/articles/87434/elife-87434-fig4-figsupp1-data1-v1.zip
-
Figure 4—figure supplement 1—source data 2
A PDF file showing original scans of the relevant Western blot analysis in Figure 4—figure supplement 1A (Streptavidin-HRP, anti-Styxl2, and Loading) with highlighted bands and sample labels.
- https://cdn.elifesciences.org/articles/87434/elife-87434-fig4-figsupp1-data2-v1.zip
-
Figure 4—figure supplement 1—source data 3
An Excel file showing raw data of iTRAQ-based mass spectrometry analysis for potential Styxl2 interactors in Figure 4—figure supplement 1B.
- https://cdn.elifesciences.org/articles/87434/elife-87434-fig4-figsupp1-data3-v1.zip
Figure 5 with 1 supplement
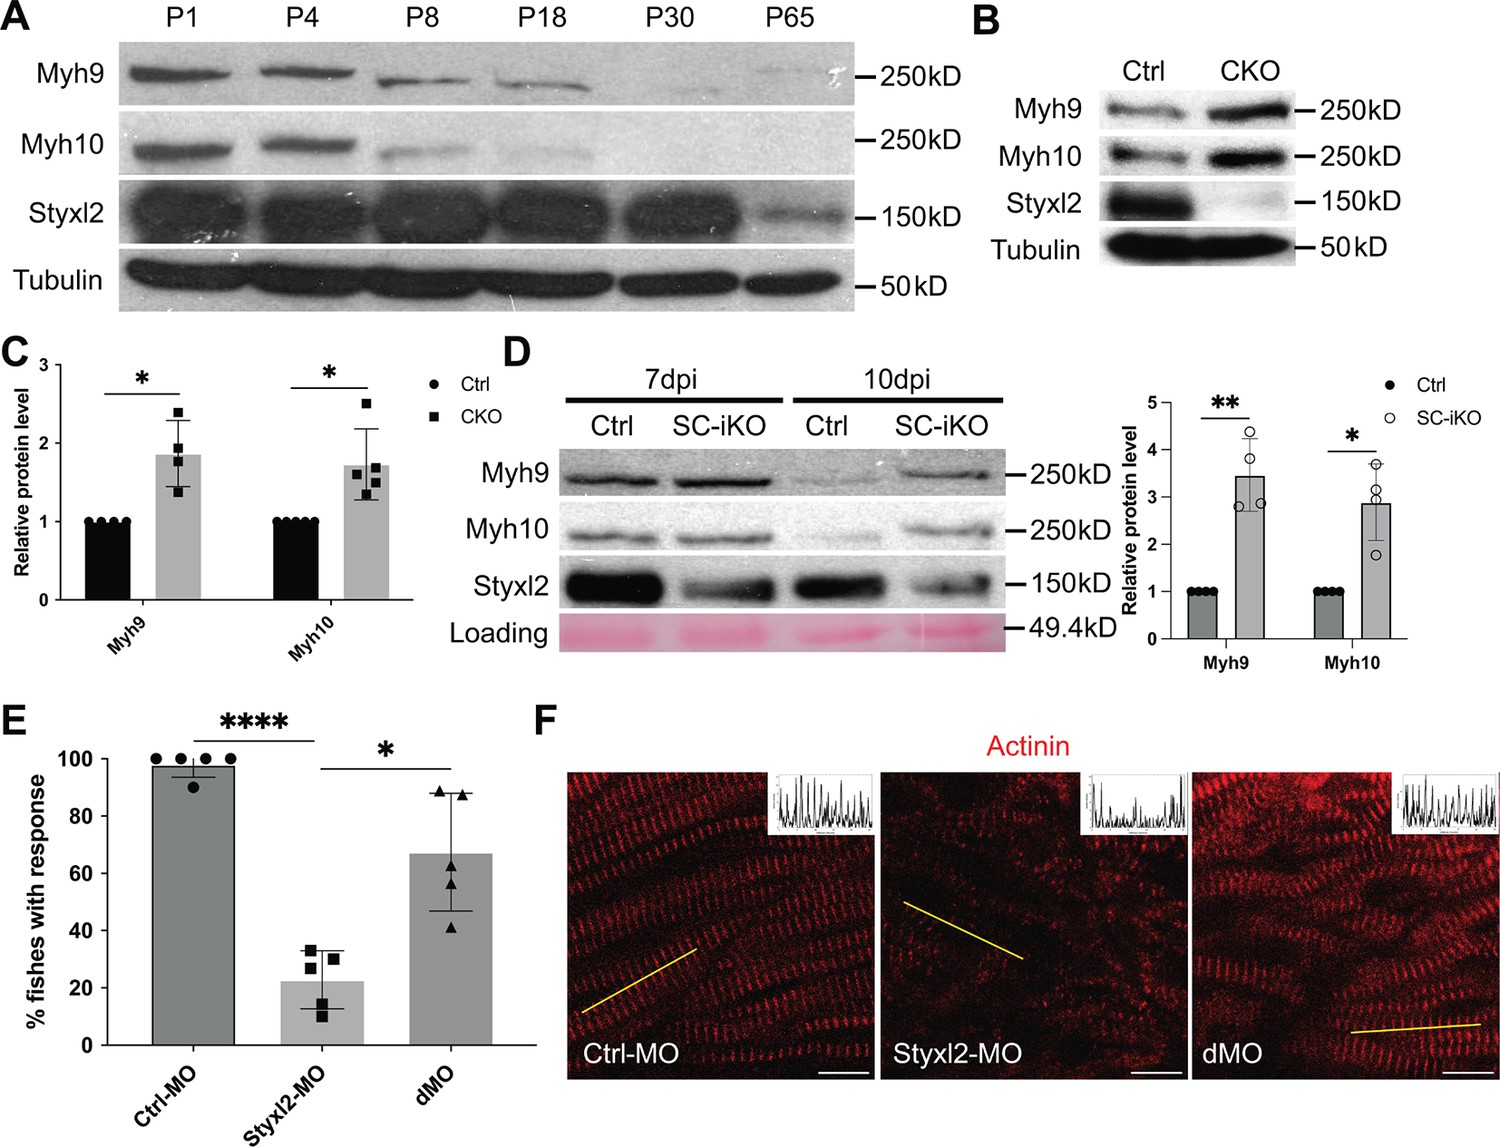
Styxl2 protein levels inversely correlates with that of non-muscle myosin IIs.
(A) Protein levels of Styxl2 and non-muscle myosin IIs in skeletal muscles of wild-type mice of different ages were determined by Western blot. (B) Protein levels of Styxl2 and non-muscle myosin IIs in skeletal muscles of control and Styxl2 conditional KO (CKO) P1 mice were determined by Western blot. (C) Relative ratios of non-muscle myosin II protein levels in control and Styxl2 CKO P1 mice were quantified by ImageJ based on the data from four (for Myh9) or five (for Myh10) sets of Western blots. (D) Protein levels of Styxl2 and non-muscle myosin IIs in regenerating tibialis anterior muscles were determined by Western blot. The experiments were done for four times with similar results and a representative gel was shown. The protein levels of NM IIs in 10 dpi muscles revealed by Western blot were quantified in the right panel. Ctrl: Pax7CreERT2/CreERT2 mice; SC-iKO: Pax7CreERT2/CreERT2; Styxl2f/f mice; dpi: days post-injury. (E) Zebrafish zygotes were separately injected with the following morpholinos (MO): control (Ctrl-MO), Styxl2-MO, and mixed morpholinos targeting both Styxl2 and Myh10 (dMO). At 48 hpf, zebrafishes were poked by a fine needle and their responses were recorded. Quantification of responses of zebrafish to needle touch was shown. In each group, at least eight zebrafishes were tested and the percentage of zebrafishes responding to needle touch was calculated. Each dot represents one group of experiment. (F) Zebrafishes from each condition in (E) were subjected to immunostaining for α-actinin to visualize sarcomere structures. Representative images were shown. The inset at the top right corner of each image shows the actinin intensity along the yellow line. Scale bar: 10 μm. *p-value <0.05. **p-value <0.01. ****p-value <0.0001.
-
Figure 5—source data 1
Original scans for the Western blot analysis in Figure 5A (anti-Styxl2, anti-Myh9, anti-Myh10 and anti-Tubulin).
- https://cdn.elifesciences.org/articles/87434/elife-87434-fig5-data1-v1.zip
-
Figure 5—source data 2
A PDF file showing original scans of the relevant Western blot analysis in Figure 5A (anti-Styxl2, anti-Myh9, anti-Myh10, and anti-Tubulin) with highlighted bands and sample labels.
- https://cdn.elifesciences.org/articles/87434/elife-87434-fig5-data2-v1.zip
-
Figure 5—source data 3
Original scans for the Western blot analysis in Figure 5B (anti-Styxl2, anti-Myh9, anti-Myh10, and anti-Tubulin).
- https://cdn.elifesciences.org/articles/87434/elife-87434-fig5-data3-v1.zip
-
Figure 5—source data 4
A PDF file showing original scans of the relevant Western blot analysis in Figure 5B (anti-Styxl2, anti-Myh9, anti-Myh10, and anti-Tubulin) with highlighted bands and sample labels.
- https://cdn.elifesciences.org/articles/87434/elife-87434-fig5-data4-v1.zip
-
Figure 5—source data 5
Original scans for the Western blot analysis in Figure 5D (anti-Styxl2, anti-Myh9, anti-Myh10, and Loading).
- https://cdn.elifesciences.org/articles/87434/elife-87434-fig5-data5-v1.zip
-
Figure 5—source data 6
A PDF file showing original scans of the relevant Western blot analysis in Figure 5D (anti-Styxl2, anti-Myh9, anti-Myh10, and Loading) with highlighted bands and sample labels.
- https://cdn.elifesciences.org/articles/87434/elife-87434-fig5-data6-v1.zip
Figure 5—figure supplement 1

The protein levels of NM IIs in differentiating C2C12 cells and the knockdown efficiency of Myh10-MO.
(A) Confluent C2C12 cells were induced to differentiate in differentiation medium (DM) and harvested at different time points. Soluble whole cell lysates were subjected to Western blot analysis. (B) Zebrafish zygotes were injected with control (Ctrl) or Myh10-morpholino oligo (MO) and the fish were collected for Western blot analysis at 48 hpf.
-
Figure 5—figure supplement 1—source data 1
Original scans for the Western blot analysis in Figure 5—figure supplement 1A (anti-MHC, anti-Myh9, anti-Myh10, anti-Styxl2, and anti-Tubulin).
- https://cdn.elifesciences.org/articles/87434/elife-87434-fig5-figsupp1-data1-v1.zip
-
Figure 5—figure supplement 1—source data 2
A PDF file showing original scans of the relevant Western blot analysis in Figure 5—figure supplement 1A (anti-MHC, anti-Myh9, anti-Myh10, anti-Styxl2, and anti-Tubulin) with highlighted bands and sample labels.
- https://cdn.elifesciences.org/articles/87434/elife-87434-fig5-figsupp1-data2-v1.zip
-
Figure 5—figure supplement 1—source data 3
Original scans for the Western blot analysis in Figure 5—figure supplement 1B (anti-Myh10 and anti-Tubulin).
- https://cdn.elifesciences.org/articles/87434/elife-87434-fig5-figsupp1-data3-v1.zip
-
Figure 5—figure supplement 1—source data 4
A PDF file showing original scans of the relevant Western blot analysis in Figure 5—figure supplement 1B (anti-Myh10 and anti-Tubulin) with highlighted bands and sample labels.
- https://cdn.elifesciences.org/articles/87434/elife-87434-fig5-figsupp1-data4-v1.zip
Figure 6 with 1 supplement
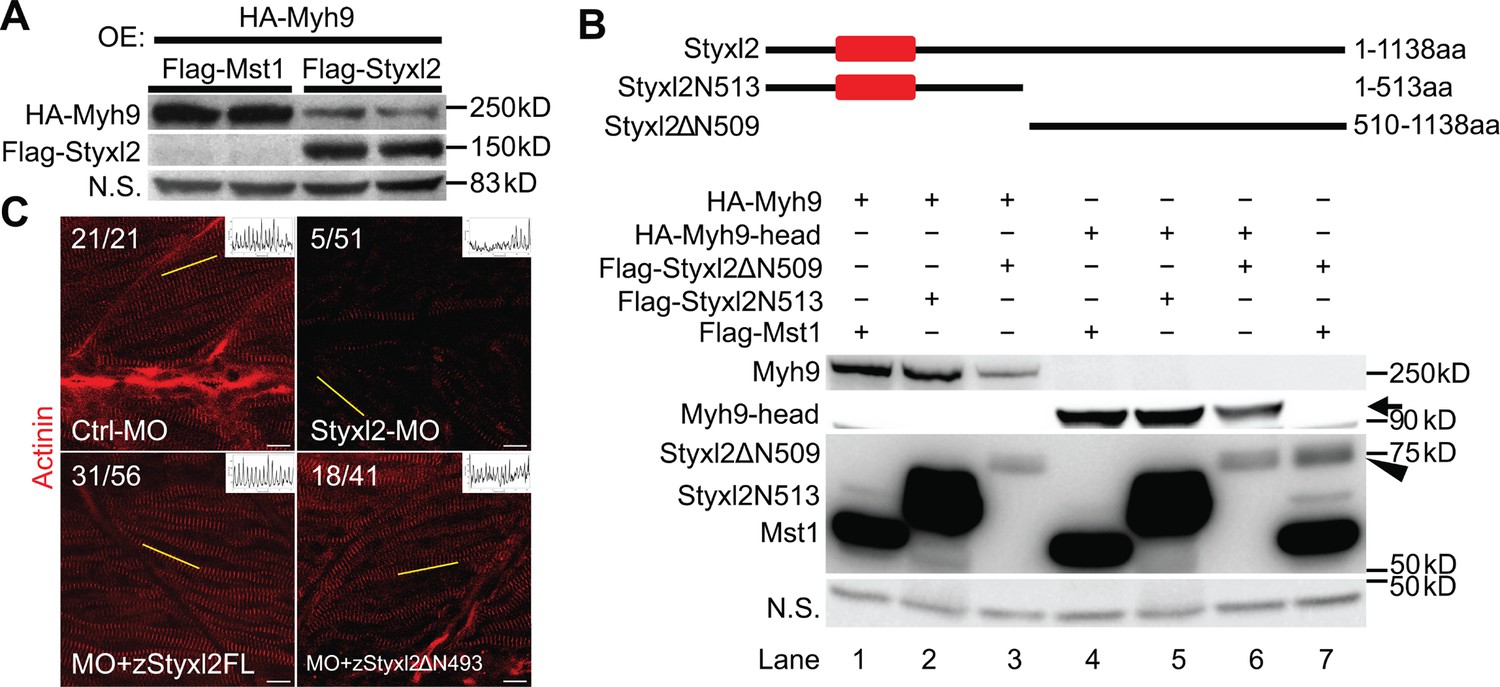
The dual-specificity phosphatase catalytic (DSPc) domain of Styxl2 is dispensable for degradation of non-muscle myosin IIs.
(A) DNA constructs encoding Myh9, Styxl2, or Mst1 (negative control) were co-expressed in C2C12 cells. Soluble whole cell extracts were subjected to Western blot analysis. OE: overexpression. (B) The schematic shows the truncated fragments of Styxl2 protein. The red blocks indicate the DSPc domain of Styxl2. HEK 293T cells were transfected with different plasmids as indicated. 24 hr after transfection, cells were harvested, and soluble whole cell extracts were subjected to Western blot analysis. The arrow indicates the head domain of Myh9, and the arrowhead indicates Styxl2 missing the N-terminal 509 aa (Styxl2ΔN509). Mst1: negative control. N.S.: non-specific. (C) Zebrafish zygotes were injected with various morpholinos as indicated with or without the co-injected Styxl2 mRNAs. zStyxl2FL: the full-length fish Styxl2 mRNA; zStyxl2ΔN493: the truncated fish Styxl2 mRNA missing the 5’ region encoding the N-terminal 493 aa. Representative α-actinin immunofluorescent images were shown. The number in numerator at the top left corner of each image represents fish embryos showing normal α-actinin staining pattern, while that in denominator represents the total number of embryos examined. The inset at the top right corner of each image shows the actinin intensity along the yellow line. Scale bar: 10 μm.
-
Figure 6—source data 1
Original scans for the Western blot analysis in Figure 6A (anti-Flag, anti-HA, and N.S.).
- https://cdn.elifesciences.org/articles/87434/elife-87434-fig6-data1-v1.zip
-
Figure 6—source data 2
A PDF file showing original scans of the relevant Western blot analysis in Figure 6A (anti-Flag, anti-HA, and N.S.) with highlighted bands and sample labels.
- https://cdn.elifesciences.org/articles/87434/elife-87434-fig6-data2-v1.zip
-
Figure 6—source data 3
Original scans for the Western blot analysis in Figure 6B (anti-Flag, anti-HA, and N.S.).
- https://cdn.elifesciences.org/articles/87434/elife-87434-fig6-data3-v1.zip
-
Figure 6—source data 4
A PDF file showing original scans of the relevant Western blot analysis in Figure 6B (anti-Flag, anti-HA, and N.S.) with highlighted bands and sample labels.
- https://cdn.elifesciences.org/articles/87434/elife-87434-fig6-data4-v1.zip
Figure 6—figure supplement 1
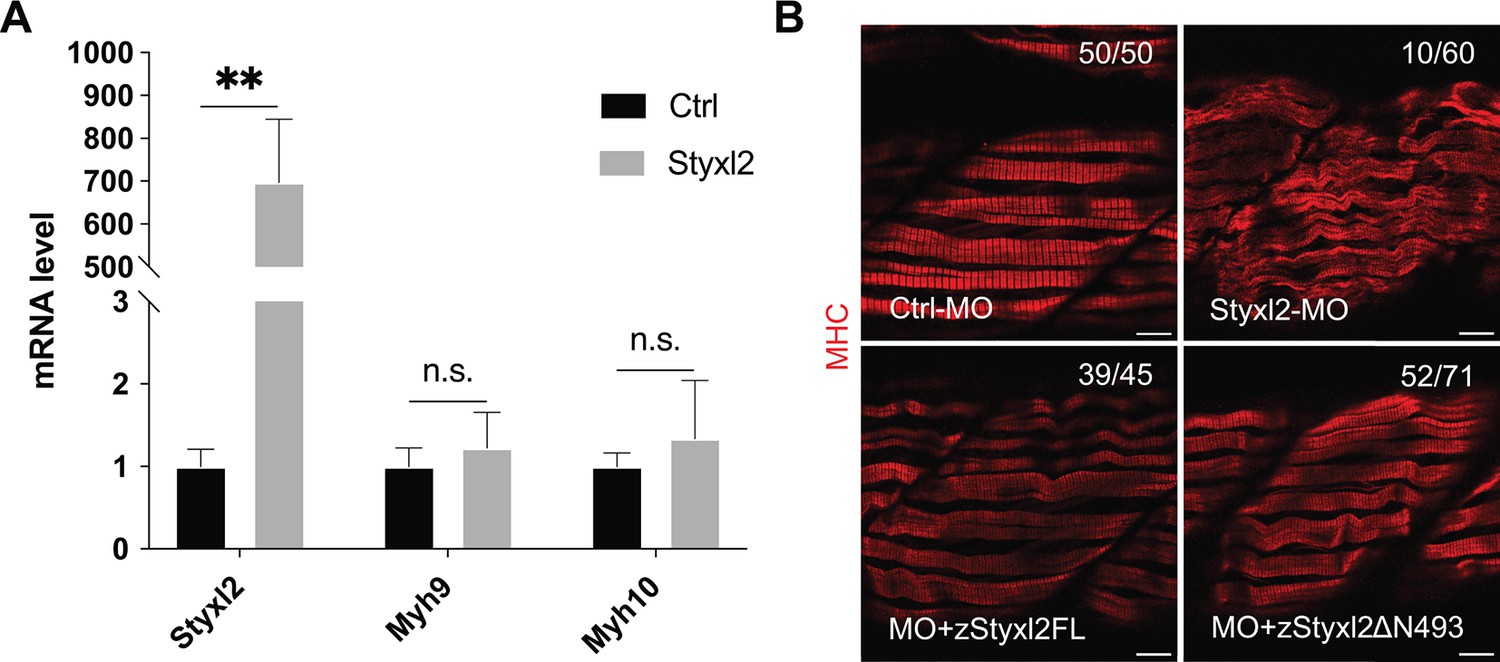
Styxl2 regulates the protein levels of NM IIs without affecting their mRNA.
(A) Control (Ctrl) or Styxl2 DNA constructs were transfected into C2C12 cells. 24 hr later, the mRNA levels of different genes were determined by qPCR. **p-value <0.01. n.s.: not significant. (B) Zebrafish zygotes were injected with various morpholinos as indicated with or without the co-injected Styxl2 mRNAs. zStyxl2FL: the full-length fish Styxl2 mRNA; zStyxl2ΔN493: the truncated fish Styxl2 mRNA missing the 5’ region encoding the N-terminal 493 aa. Representative immunofluorescent images of myosin heavy chain (MHC) were shown. The number in numerator at the top right corner of each image represents fish embryos showing normal MHC staining pattern, while that in denominator represents the total number of embryos examined. Scale bar: 10 μm.
Figure 7 with 1 supplement
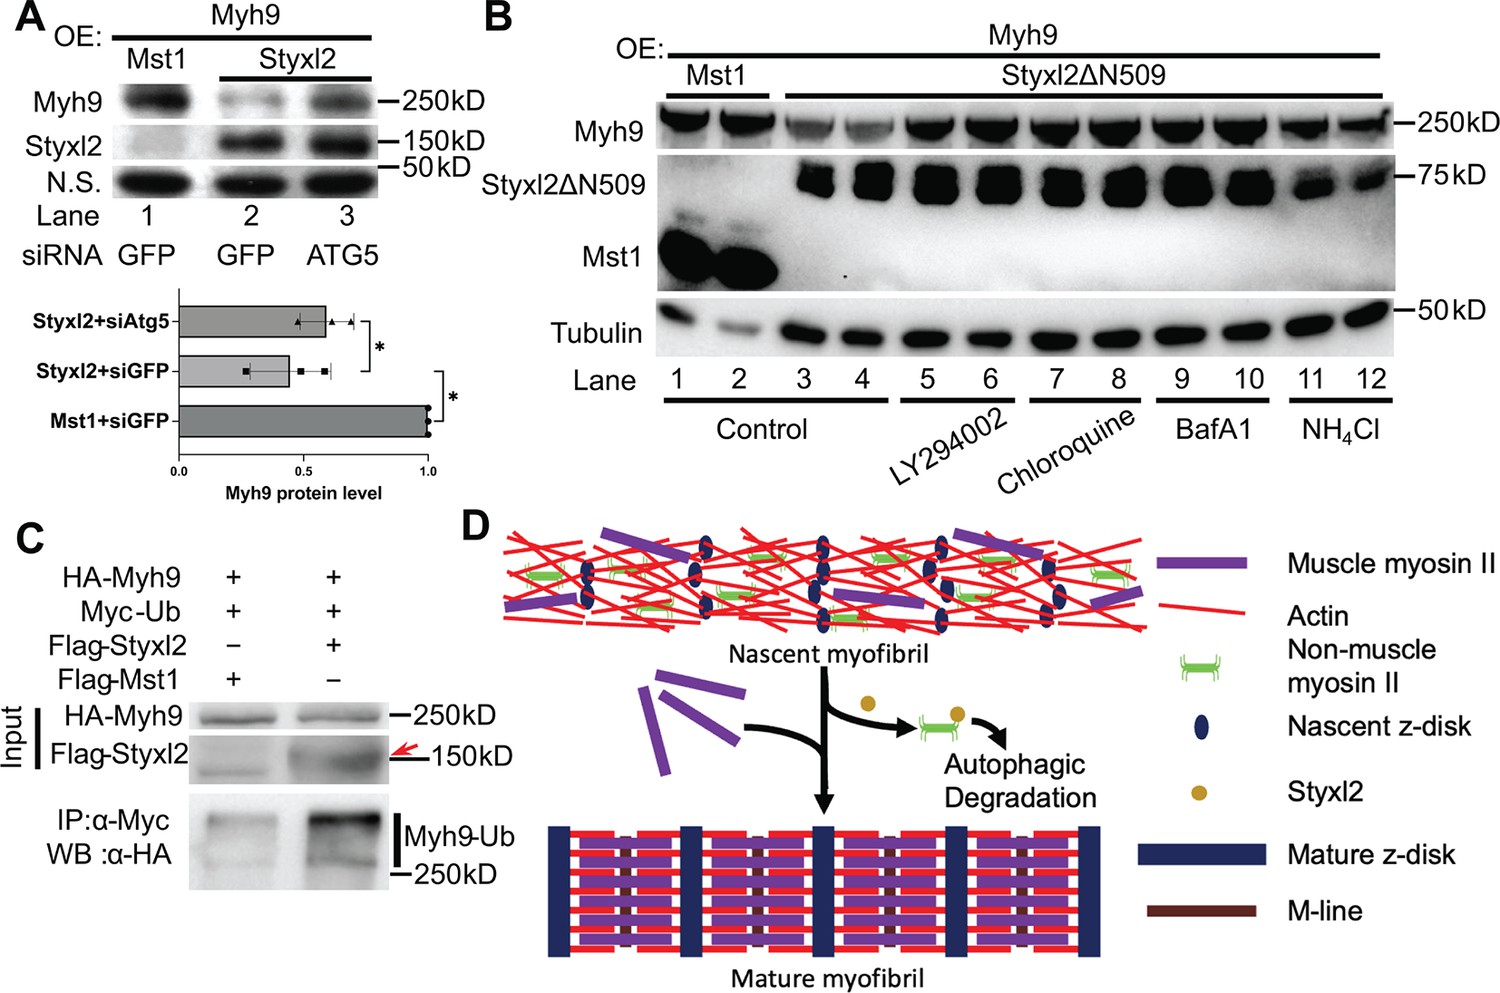
The Styxl2-mediated degradation of non-muscle myosin IIs is autophagy dependent.
(A) Plasmids encoding Myh9, Styxl2, or Mst1 (negative control) were co-expressed in C2C12 cells together with various siRNAs as indicated. Soluble whole cell extracts were subjected to Western blot analysis. OE: overexpression. N.S.: non-specific. The protein level of Myh9 was quantified at the bottom panel. *p-value <0.05. (B) HEK 293T cells were transfected with various constructs as indicated. Various inhibitors of the autophagy-lysosome pathway (50 μM LY294002, 100 μM Chloroquine, 100 nM BafA1, 20 mM NH4Cl) were added to the cell culture 6 hr before harvest. OE: overexpression. (C) HEK 293T cells were co-transfected with the plasmids as indicated. 18 hr later, 100 nM of BafA1 was added to the culture medium. After another 6 hr, the soluble whole cell lysates were subjected to immunoprecipitation (IP) with an anti-Myc antibody, and the immunoprecipitated proteins were further analysed by Western blot (WB). The red arrow indicates Flag-Styxl2. (D) The schematic shows that Styxl2 promotes sarcomere assembly by binding to and targeting non-muscle myosin IIs for degradation, which facilitates their eventual replacement by muscle myosin II during sarcomere maturation.
-
Figure 7—source data 1
Original scans for the Western blot analysis in Figure 7A (anti-Styxl2, anti-Myh9, and N.S.).
- https://cdn.elifesciences.org/articles/87434/elife-87434-fig7-data1-v1.zip
-
Figure 7—source data 2
A PDF file showing original scans of the relevant Western blot analysis in Figure 7A (anti-Styxl2, anti-Myh9, and N.S.) with highlighted bands and sample labels.
- https://cdn.elifesciences.org/articles/87434/elife-87434-fig7-data2-v1.zip
-
Figure 7—source data 3
Original scans for the Western blot analysis in Figure 7B (anti-Myh9, anti-Styxl2ΔN509, anti-Mst1, and anti-Tubulin).
- https://cdn.elifesciences.org/articles/87434/elife-87434-fig7-data3-v1.zip
-
Figure 7—source data 4
A PDF file showing original scans of the relevant Western blot analysis in Figure 7B (anti-Myh9, anti-Styxl2ΔN509, anti-Mst1, and anti-Tubulin) with highlighted bands and sample labels.
- https://cdn.elifesciences.org/articles/87434/elife-87434-fig7-data4-v1.zip
-
Figure 7—source data 5
Original scans for the Western blot analysis of input and IP in Figure 7C (anti-Flag and anti-HA).
- https://cdn.elifesciences.org/articles/87434/elife-87434-fig7-data5-v1.zip
-
Figure 7—source data 6
A PDF file showing original scans of the relevant Western blot analysis in Figure 7C (anti-Flag and anti-HA) with highlighted bands and sample labels.
- https://cdn.elifesciences.org/articles/87434/elife-87434-fig7-data6-v1.zip
Figure 7—figure supplement 1
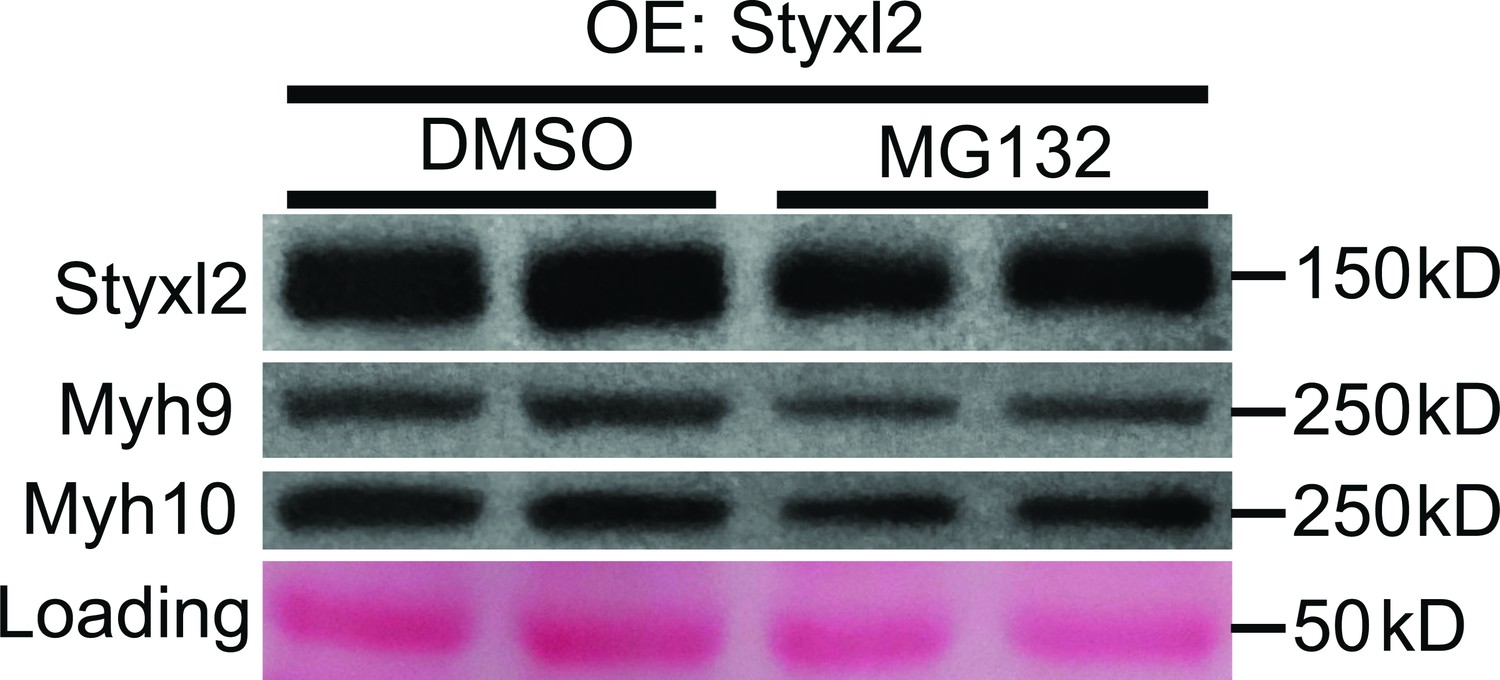
Proteasome is not involved in Styxl2-mediated degradation of NM IIs.
C2C12 cells were transfected with a Styxl2-expressing plasmid. 12 hr later, MG132 (4 μM) or DMSO was added into the medium. After another 12 hr, the cells were harvested for Western blot analysis. OE: overexpression.
-
Figure 7—figure supplement 1—source data 1
Original scans for the Western blot analysis in Figure 7—figure supplement 1 (anti-Myh9, anti-Myh10, anti-Styxl2, and Loading).
- https://cdn.elifesciences.org/articles/87434/elife-87434-fig7-figsupp1-data1-v1.zip
-
Figure 7—figure supplement 1—source data 2
A PDF file showing original scans of the relevant Western blot analysis in Figure 7—figure supplement 1 (anti-Myh9, anti-Myh10, anti-Styxl2, and Loading) with highlighted bands and sample labels.
- https://cdn.elifesciences.org/articles/87434/elife-87434-fig7-figsupp1-data2-v1.zip
Author response image 1

The fish zygotes were injected with Atg5 or Ctrl MO.
48 hpf, the fish were stained with an anti-Actinin antibody. Some fast muscle fibers were disrupted when Atg5 was knocked down. The number in numerator at the bottom of each image represents fish embryos showing normal Actinin staining pattern, while that in denominator represents the total number of embryos examined. Scale bar, 10 µm.
Author response image 2

C2C12 cells were transfected with negative control siRNA (NC), siNek9#2 or siNek9#3.
18 h later, the cells were transfected with plasmids HA-Myh9 and Flag-Styxl2 or Flag-Stk24. After another 24 h, the cells were harvested for RT-qPCR (left panel) or western blot (right panel).
Author response image 3

The TA muscles were collected from male and female P1 mice.
The muscles were sectioned and co-stained for a-actinin (Actn) and Myh9. The majority of myofibrils is mature without the NM II signal. Scale bar, 10 µm.
Tables
Table 1
Candidate genes regulated by both Jak1 and Stat1.
Selected candidate genes targeted by both si-Jak1 and si-Stat1 were shown. The fold change was determined by the relative levels of a gene in cells treated with si-Jak1 or si-Stat1 over that in control cells. Genes with fold change >1.5 for si-Jak1 and >2 for si-Stat1 were listed in this table. Genes with positive fold change are up-regulated (positive value), while those with negative fold change are down-regulated (negative value). P Stage and D Stage denote the proliferation stage (growth medium. GM 24 hr) and early differentiation stage (differentiation medium, DM 12 hr), respectively.
| Probe set ID | Gene | Fold change | |||
|---|---|---|---|---|---|
| P Stage | D Stage | ||||
| siJak1 | siStat1 | siJak1 | siStat1 | ||
| 1417889_at | apolipoprotein B editing complex 2 | 1.53 | 4.43 | 2.43 | 4.07 |
| 1419391_at | myogenin | 4.29 | 9.99 | 2.62 | 4.26 |
| 1422088_at | v-myc myelocytomatosis viral oncogene homolog 1 | 2.12 | 3.9 | 1.88 | 3.68 |
| 1422606_at | C1q and tumor necrosis factor related protein 3 | 2.23 | 13.4 | 1.68 | 5.45 |
| 1426971_at | ubiquitin-activating enzyme E1-like | 3.53 | 7.05 | 2.42 | 3.03 |
| 1427306_at | ryanodine receptor 1 | 2.11 | 6 | 2.71 | 4.52 |
| 1449178_at | PDZ and LIM domain 3 | 3.45 | 12.3 | 2.94 | 7 |
| 1451453_at | death-associated kinase 2 | 1.52 | 3.14 | 1.96 | 3.81 |
| 1452520_a_at | cholinergic receptor | 6.76 | 15.5 | 2.6 | 4.13 |
| 1429223_a_at | hemochromatosis type 2 (juvenile) (human homolog) | 2.16 | 28.8 | 2 | 7.66 |
| 1429459_at | sema domain | 2.77 | 4.43 | 2.27 | 5.58 |
| 1435828_at | avian musculoaponeurotic fibrosarcoma (v-maf) AS42 oncogene homolog | 1.96 | 3.38 | 1.63 | 3.27 |
| 1439658_at | leiomodin 3 (fetal) | 1.91 | 17.9 | 2.83 | 18.8 |
| 1439746_at | dual specificity phosphatase 27 (putative) (dusp27) | 1.82 | 4.78 | 1.73 | 2.36 |
| 1444494_at | kelch repeat and BTB (POZ) domain containing 10 | 2.46 | 9.63 | 2.79 | 6.38 |
| 1421426_at | Hedgehog-interacting protein | –2.04 | –3.55 | –1.62 | –6.65 |
| 1435438_at | SRY-box containing gene 8 (sox8) | 1.85 | 4.01 | 1.51 | 5.7 |
Key resources table
| Reagent type (species) or resource | Designation | Source or reference | Identifiers | Additional information |
|---|---|---|---|---|
| Gene (M. musculus) | Styxl2 | GenBank | MGI:MGI:2685055 | |
| Gene (D. rerio) | zStyxl2 (dusp27) | GenBank | ZFIN:ZDB-GENE-140513–1 | |
| Genetic reagent (M. musculus) | Styxl2flox/flox | This paper | See Materials and methods, Section 1. | |
| Genetic reagent (M. musculus) | EIIA-Cre | The Jackson Laboratory | Strain #:003724 | |
| Genetic reagent (M. musculus) | Pax7CreERT2/+ | The Jackson Laboratory | Strain #:017763 | |
| Genetic reagent (M. musculus) | Myf5Cre/+ | Tallquist et al., 2000 | ||
| Genetic reagent (M. musculus) | Pax7Cre/+ | Keller et al., 2004 | ||
| Genetic reagent (M. musculus) | Tg (HSA-MerCreMer) | McCarthy et al., 2012 | ||
| Strain, strain background (D. rerio) | ABSR wild type fish | Prof. Zilong Wen (HKUST) | ||
| Cell line (M. musculus) | C2C12 | ATCC | CRL-1772 | |
| Cell line (Homo-sapiens) | HEK 293T | ATCC | CRL-3216 | |
| Transfected construct (M. musculus) | Flag-Styxl2 | This paper | See Materials and methods, Section 2. | |
| Transfected construct (M. musculus) | Flag-Styxl2ΔN509 | This paper | See Materials and methods, Section 2. | |
| Transfected construct (M. musculus) | Flag-Styxl2N513 | This paper | See Materials and methods, Section 2. | |
| Transfected construct (M. musculus) | Myosin-IIA-GFP | addgenen | #38297 | |
| Transfected construct (M. musculus) | HA-Myh9 | This paper | See Materials and methods, Section 2. | |
| Transfected construct (M. musculus) | HA-Myh9-head | This paper | See Materials and methods, Section 2. | |
| Transfected construct (M. musculus) | HA-Myh9-tail | This paper | See Materials and methods, Section 2. | |
| Transfected construct (M. musculus) | HA-Myh10-head | This paper | See Materials and methods, Section 2. | |
| Transfected construct (M. musculus) | HA-Myh10-tail | This paper | See Materials and methods, Section 2. | |
| Transfected construct (E. coli) | pcDNA3.1 mycBioID | addgene | #35700 | Re-cloned into pcDNA3.0. |
| Transfected construct (D. rerio) | zStyxl2 | This paper | See Materials and methods, Section 2. | |
| Transfected construct (D. rerio) | zStyxl2ΔN493 | This paper | See Materials and methods, Section 2. | |
| Antibody | anti-Jak1 (Rabbit Polyclonal) | Upstate | Cat#: 06–272 | IB(1:2000) |
| Antibody | anti-Stat1 (Rabbit Polyclonal) | Upstate | Cat#: 06–501 | IB(1:2000) |
| Antibody | anti-β-Tubulin (Mouse monoclonal) | Sigma | Cat#: T4026 | IB(1:5000) |
| Antibody | anti-sarcomere MHC (Mouse monoclonal) | DSHB | MF20 | IB(1:1000) IF(1:200) |
| Antibody | anti-GAPDH (Mouse Monoclonal) | Ambion | Cat#: AM4300 | IB(1:10000) |
| Antibody | anti-Myh9 (Rabbit Polyclonal) | Cell Signaling | Cat#: 3403 | IB(1:2000) IF(1:200) |
| Antibody | anti-Myh10 (Mouse monoclonal) | Santa Cruz | Cat#: sc-376942 | IB(1:1000) |
| Antibody | anti-Flag (Mouse monoclonal) | Sigma | F3165 | IF(1:5000) |
| Antibody | anti-HA (Mouse monoclonal) | Roche | 12CA5 | IB(1:5000) |
| Antibody | anti-Styxl2 (Rabbit Polyclonal) | This paper | See Materials and methods, Section 7. IB(1:500) | |
| Antibody | anti-MEF2A (Rabbit Polyclonal) | This paper | Immunize rabbits with mouse MEF2A. | |
| Antibody | anti-Flag (Rabbit Polyclonal) | Sigma | F7425 | IF(1:200) |
| Antibody | anti-HA (Rabbit polyclonal) | Santa Cruz | Cat#: sc-805 | IF(1:200) |
| Antibody | anti-Myc (Mouse monoclonal) | Santa Cruz | Cat#: sc-40 | IB(1:1000) |
| Antibody | anti-α-Actinin (Mouse monoclonal) | Sigma | Cat#: A7732 | IF(1:200) |
| Antibody | anti-Prox1 (Rabbit polyclonal) | Angiobio | Cat#: 11–002 P | IF(1:200) |
| Antibody | anti-slow myosin heavy chain (Mouse monoclonal) | DSHB | F59 | IF(1:200) |
| Antibody | anti-myosin heavy chain (Mouse monoclonal) | DSHB | A4.1025 | IF(1:200) |
| Recombinant DNA reagent | pRetroX-Tet-On Advanced (plasmid) | Dr. Yusong Guo (HKUST) | ||
| Sequence-based reagent | Styxl2-F | This paper | PCR primers | GCCCATCCACCTCTCCTC |
| Sequence-based reagent | Styxl2-R | This paper | PCR primers | GCTCCTGTCATCCATCTTCTC |
| Sequence-based reagent | Myh9-F | This paper | PCR primers | GGCCCTGCTAGATGAGGAGT |
| Sequence-based reagent | Myh9-R | This paper | PCR primers | CTTGGGCTTCTGGAACTTGG |
| Sequence-based reagent | Myh10-F | This paper | PCR primers | GGAATCCTTTGGAAATGCGAAGA |
| Sequence-based reagent | Myh10-R | This paper | PCR primers | GCCCCAACAATATAGCCAGTTAC |
| Sequence-based reagent | Gapdh-F | This paper | PCR primers | CCCACTCTTCCACCTTCG |
| Sequence-based reagent | Gapdh-R | This paper | PCR primers | TCCTTGGAGGCCATGTAG |
| Sequence-based reagent | siGFP (negative control) | This paper | siRNA | GCTGACCCTGAAGTTCATC |
| Sequence-based reagent | siJak1 | This paper | siRNA | GCCTGAGAGTGGAGGTAAC |
| Sequence-based reagent | siStat1 | This paper | siRNA | GGATCAAGTCATGTGCATA |
| Sequence-based reagent | siATG5 | This paper | siRNA | GGCTCCTGGATTATGTCAT |
| Sequence-based reagent | Ctrl (negative control) | This paper | morpholino | AGCACACAAAGGCGAAGGTCAACAT |
| Sequence-based reagent | Styxl2 | This paper | morpholino | GCTGATCCTCCACAGACGACGCCAT |
| Sequence-based reagent | Myh10 | This paper | morpholino | CTTCACAAATGTGGTCTTACCTTGA |
| Sequence-based reagent | Atg5 | This paper | morpholino | CACATCCTTGTCATCTGCCATTATC |
| Chemical compound, drug | Cardiotoxin | Sigma Aldrich | Cat#: 217503 | |
| Software, algorithm | ImageJ | National Institutes of Health |
Additional files
Download links
A two-part list of links to download the article, or parts of the article, in various formats.
Downloads (link to download the article as PDF)
Open citations (links to open the citations from this article in various online reference manager services)
Cite this article (links to download the citations from this article in formats compatible with various reference manager tools)
Styxl2 regulates de novo sarcomere assembly by binding to non-muscle myosin IIs and promoting their degradation
eLife 12:RP87434.
https://doi.org/10.7554/eLife.87434.3


