Opposing, spatially-determined epigenetic forces impose restrictions on stochastic olfactory receptor choice
- Integrated Program in Cellular, Molecular and Biomedical Studies, Vagelos College of Physicians and Surgeons, Columbia University Irving Medical Center, Columbia University, United States
- Zuckerman Mind, Brain, and Behavior Institute, Columbia University, United States
- Department of Neuroscience, Division of Biology and Medicine and Robert J. and Nancy D. Carney Institute for Brain Science, Brown University, United States
- Department of Biochemistry and Molecular Biology, Rutgers University, United States
- Department of Biochemistry, University at Buffalo and New York State Center of Excellence in Bioinformatics and Life Sciences, United States
- Genetics, Genomics, and Bioinformatics Graduate Program, University at Buffalo and New York State Center of Excellence in Bioinformatics and Life Sciences, United States
- Department of Bioengineering, Stanford University, United States
- Beijing Innovation Center for Genomics, Peking University, China
- Biomedical Pioneering Innovation Center, Peking University, China
- Prevail Therapeutics- a wholly-owned subsidiary of Eli Lilly and Company, United States
- Department of Biochemistry and Molecular Biophysics, Vagelos College of Physicians and Surgeons, Columbia University Irving Medical Center, Columbia University, United States
Figures
Figure 1 with 1 supplement
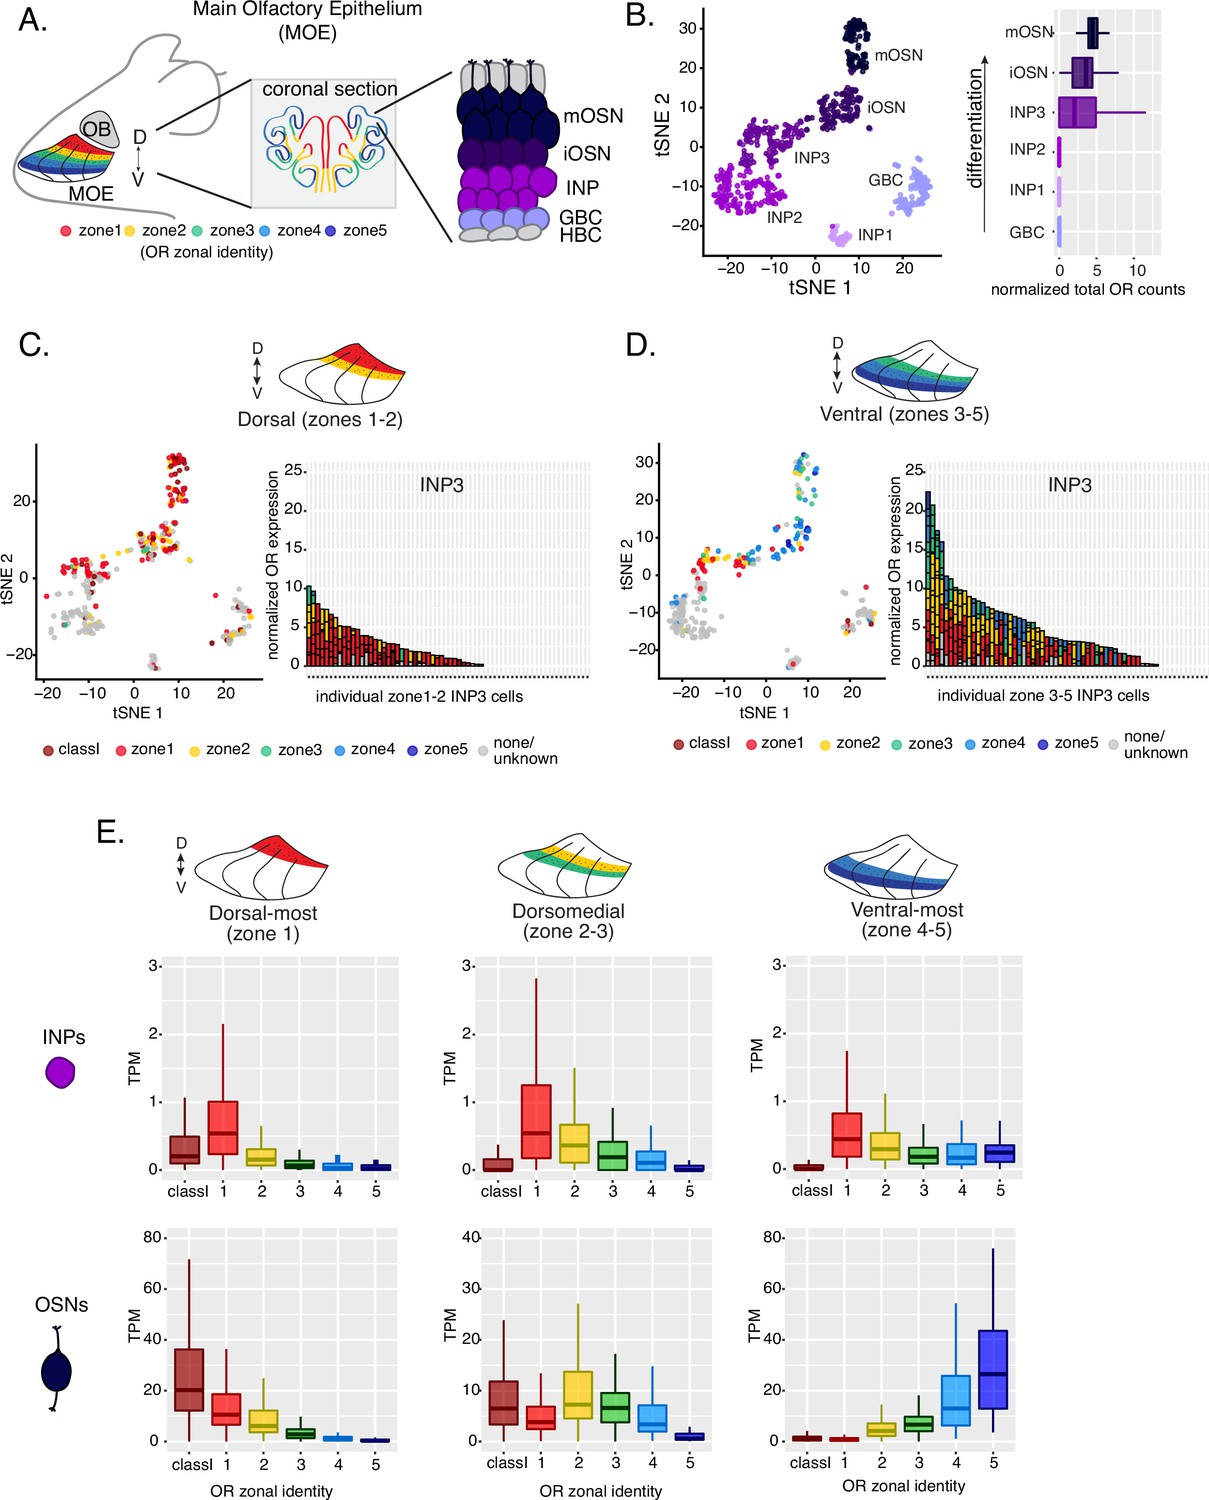
Polygenic transcription of olfactory receptor (OR) genes in olfactory progenitors follows a zonal expression pattern.
(A) Schematic illustrating OR zones along the dorsoventral axis in whole mount views of the MOE (left) and coronal sections (middle). Zone 1 (red) is the dorsal-most zone and zone 5 (blue) is the ventral-most zone. Zoomed-in view of the MOE (right) shows cell populations at different stages of olfactory sensory neuron (OSN) differentiation organized in a pseudostratified fashion from the basal (least differentiated) to apical (most differentiated) layers: HBC, horizontal basal cell; GBC, globose basal cell; INP, immediate neuronal precursor; iOSN, immature olfactory sensory neuron; mOSN, mature olfactory sensory neuron. MOE: main olfactory epithelium, OB: olfactory bulb. (B) t-SNE (t-distributed Stochastic Neighborhood Embedding) dimensionality reduction used to visualize the clustering of single cells from FAC-sorted MOE cell populations with Seurat, based on expression of the most variable genes. Plot (left panel) shows the separation of single cells into six populations, to which we assigned cell identities based on the expression of known MOE markers (Fletcher et al., 2017) (See also Figure 1—figure supplement 1). Olfactory receptor expression is first detected in INP3 cells (right panel). (C, D, left panel) t-SNE plot (as in B) of cell populations isolated from either dorsal (zones 1–2) in (C) or ventral (zones 3–5) in (D) MOE microdissections. Cells are colored according to the zonal identity of the most highly expressed OR. (C, D, right panel) Plots depicting zonal identities of all the OR genes detected in individual INP3 cells from dorsal (C) or ventral (D) MOE. Y-axis shows OR expression in normalized counts of unique transcripts (UMIs) for different OR genes (separated by black lines). On the X-axis, each point is a different INP3 cell. ORs are colored according to their zonal identity. Note that while class I OR genes are expressed within zone 1 of the MOE, they may be regulated through a different mechanism and are thus displayed separately. Single-cell analysis shows data from two biological replicates. (E) Expression of OR genes of different zonal identities in olfactory progenitor INP cells (top) and mOSNs (bottom), determined with bulk RNA-seq, in cells isolated from dorsal-most (zone 1) (left), dorsomedial (zones 2–3) (middle), and ventral-most (zones 4–5) MOE microdissections (right). Note that INP and mOSN cells were FAC-sorted from the same exact dissection, thus the mOSN OR expression patterns confirm the accuracy of the dissection. RNA-seq was performed on INP and mOSNs from two or three biological replicates (from dorsal-most and ventral-most MOE segments or dorsomedial MOE segments, respectively).
Figure 1—figure supplement 1
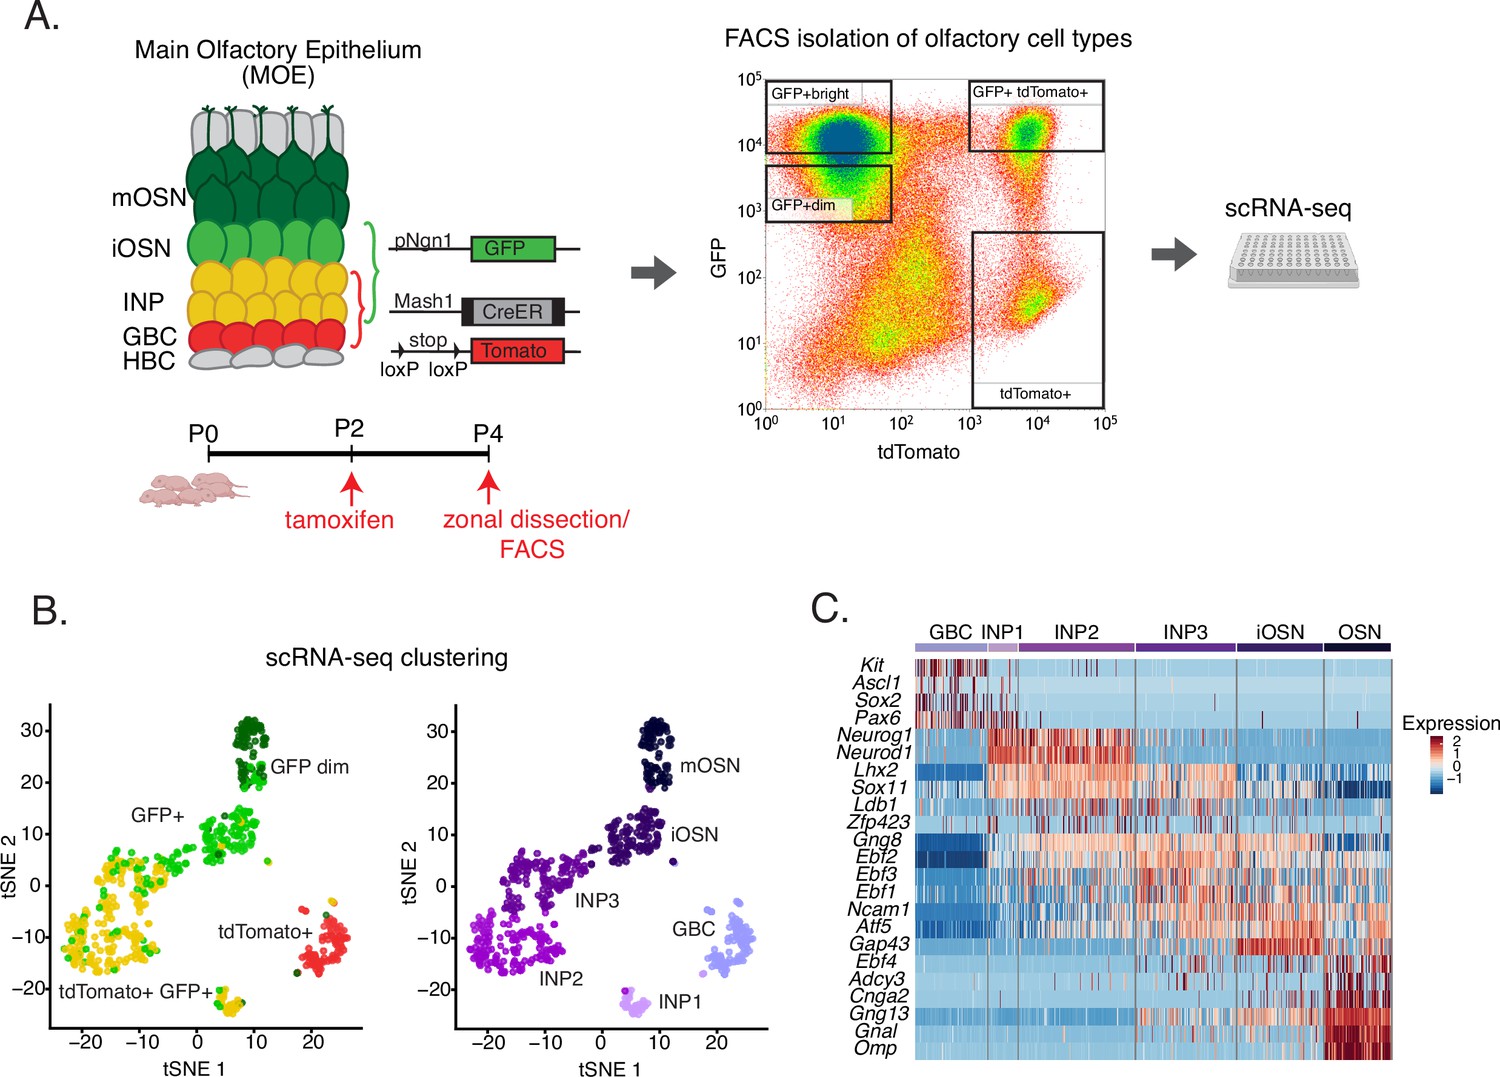
Experimental strategy for isolating cells at different stages of olfactory sensory neuron development for single-cell RNA-seq.
(A) Genetic and experimental strategy for isolating four cell populations at different stages of olfactory sensory neuron development (GBCs, INPs, iOSNs, and mOSNs) from the same tissue. A representative FACS plot is shown. GBC, globose basal cell; INP, immediate neuronal precursor; iOSN, immature olfactory sensory neurons; mOSN, mature olfactory sensory neuron. (B) t-distributed stochastic neighborhood embedding (t-SNE) plots of clustering of FAC-sorted cell populations with Seurat based on the most variable genes showing the separation of single cells into six populations. Plots show the relationship between the FAC-sorted populations (left) and cell lineage (right). (C) The six populations in (B) were assigned cell identities based on the expression of known main olfactory epithelium (MOE) markers, whose expression is shown in the heatmap. Expression for each gene is represented in terms of log2 fold change relative to its average expression.
Figure 2 with 1 supplement
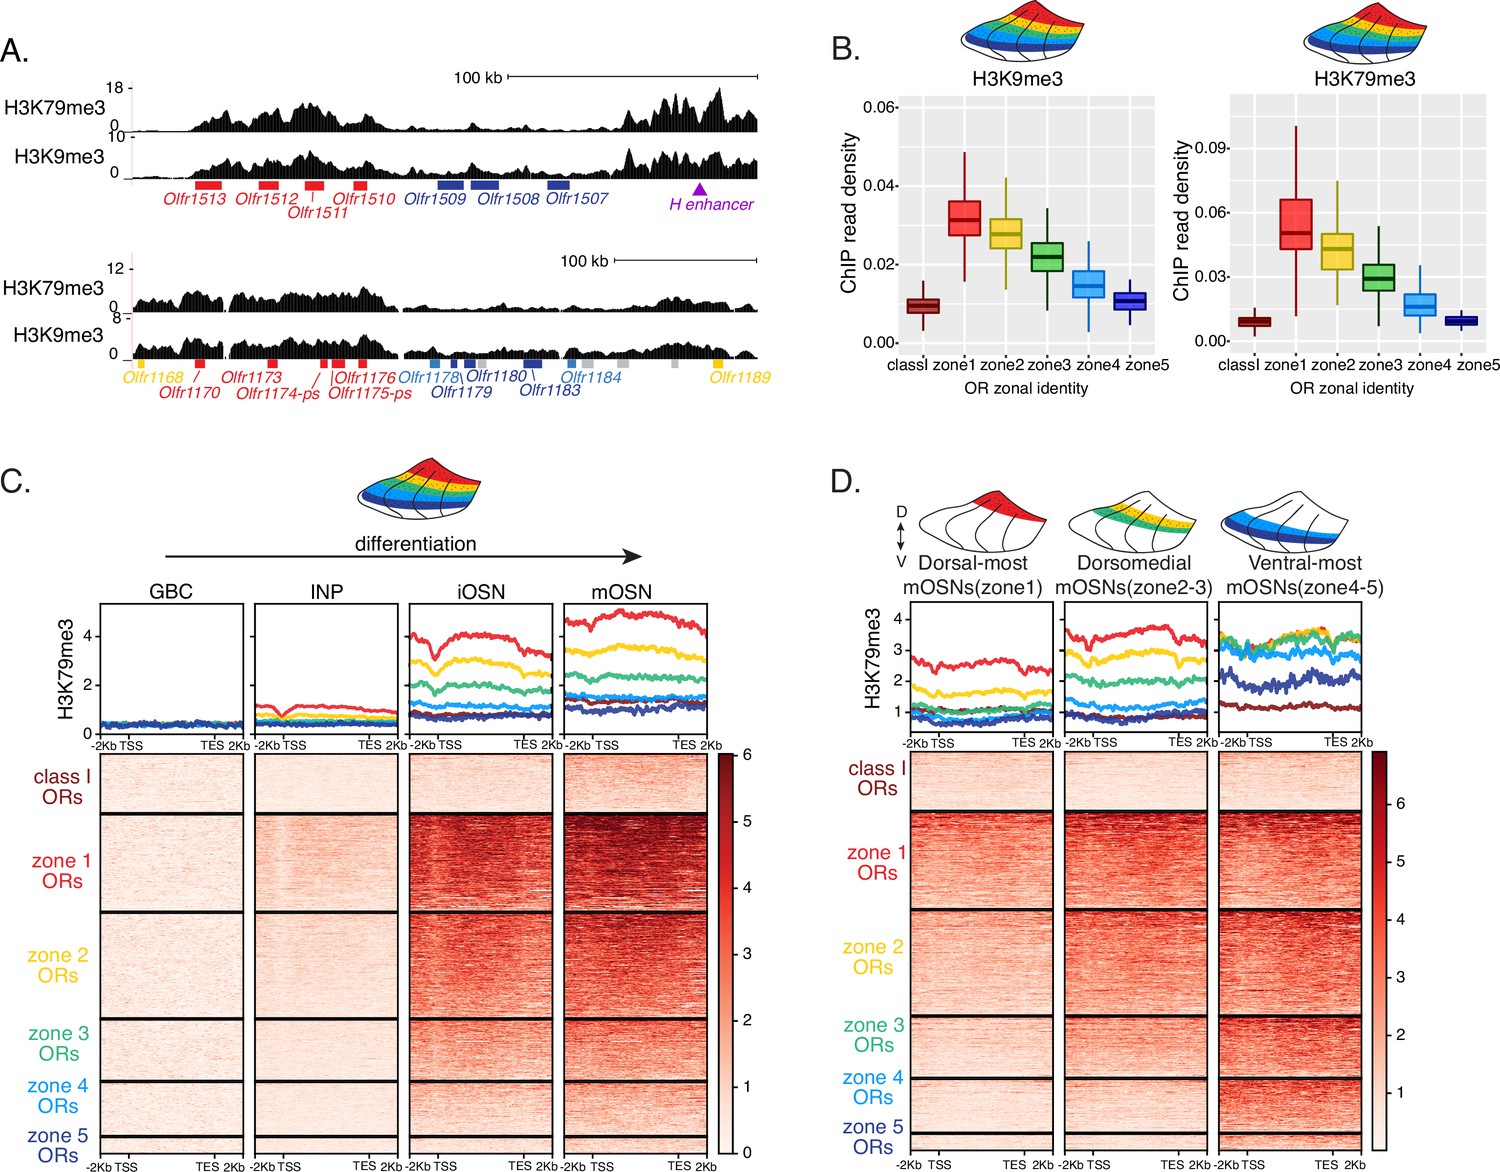
Heterochromatin deposition silences olfactory receptor (OR) genes from lower zones.
(A) Signal tracks of H3K9me3 and H3K79me3 native ChIP-seq from the whole main olfactory epithelium (MOE) show heterochromatin deposition over two representative OR gene clusters. These clusters were selected because they harbor OR genes with both dorsal (zone 1) and ventral (zone 5) identities. OR genes are colored according to their zonal identity: zone 1 ORs in red, zone 2 ORs in yellow, zone 5 ORs in blue, and ORs with unknown zonal identity in gray. Purple triangle marks the ‘H’ OR gene enhancer that is present within that OR gene cluster. (B) H3K9me3 (left) and H3K79me3 (right) native ChIP-seq in the whole MOE. Box plots of read density over OR gene bodies, separated by their zonal identity, depict a pattern of deposition that is high on dorsal-most (zone 1) OR genes, progressively decreases with more ventral zonal OR identities, and is absent on class I ORs. (C) H3K79me3 native ChIP seq in globose basal cell (GBC), immediate neuronal precursor (INP), immature OSN (iOSN), and mature OSNs (mOSN) populations shows an onset of H3K79me3 deposition as cells transition from INPs to iOSNs. Each row of the heatmaps shows coverage over an OR gene body (separated into categories by their zonal identity). (See also Figure 2—figure supplement 1A for H3K9me3 heatmap). (D) H3K79me3 native ChIP-seq in mOSNs from zonally dissected MOE. Colored schematics above each heatmap depict the zone of dissection. (See also Figure 2—figure supplement 1B for H3K9me3 heatmap). (A–D) Pooled data from two biological replicates is shown for all ChIP experiments.
Figure 2—figure supplement 1
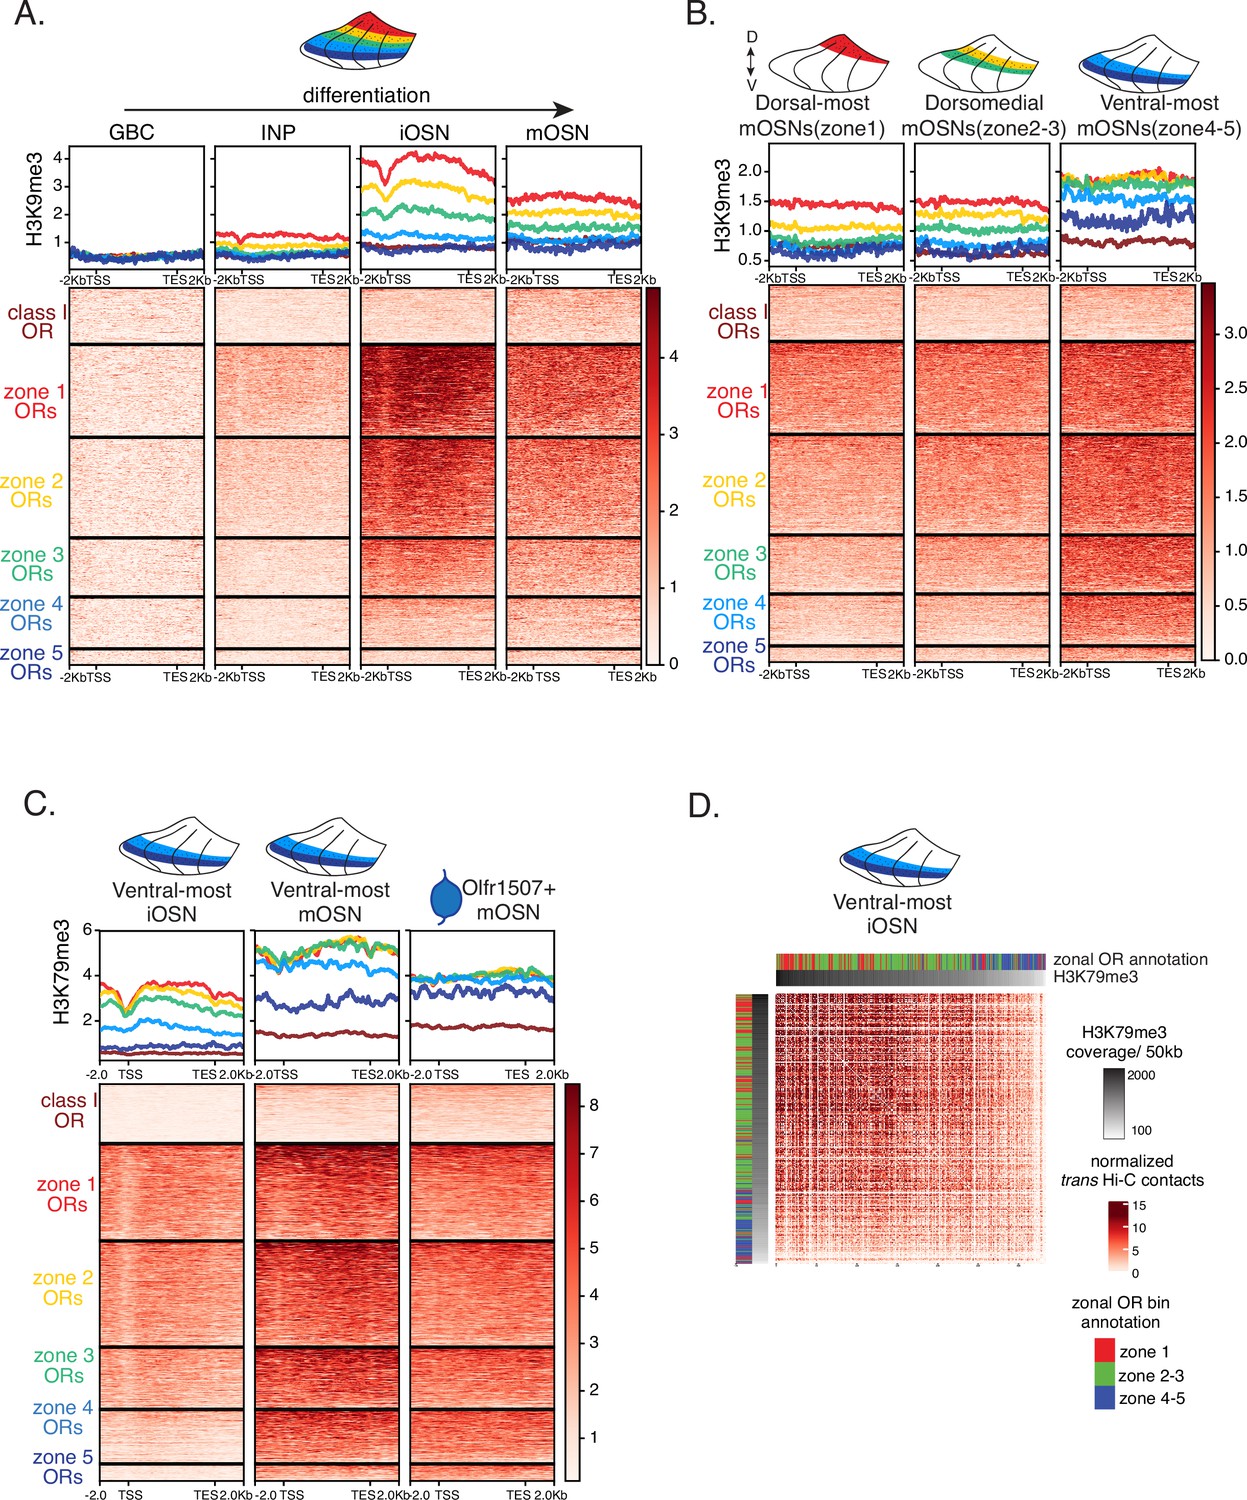
Progressive accumulation of heterochromatin on olfactory receptor (OR) genes in space and time.
(A) H3K9me3 native ChIP seq in globose basal cell (GBC), immediate neuronal precursor (INP), immature OSN (iOSN), and mature OSN (mOSN) populations shows a similar onset of deposition to that of H3K79me3. Each row of the heatmaps shows coverage over an OR gene body (scaled to 6 kb with 2 kb flanking on either side), separated into categories by their zonal identity. (B) H3K9me3 native ChIP-seq in mOSNs from zonally dissected main olfactory epithelium (MOE). Colored schematics above each heatmap depict the zone of dissection. (C) H3K79me3 native ChIP-seq in cells at different developmental stages from ventral-most dissected MOE: iOSN (left), mOSN (middle), and a pure population of Olfr1507-expressing mOSNs (a zone 5 OR) (right). H3K79me3 heterochromatin is absent from zone 5 ORs in ventral-most iOSNs and is deposited progressively as the cells mature. (D) Increased H3K79me3 deposition is correlated with increased interchromosomal interactions between OR gene loci. Heatmap of normalized interchromosomal Hi-C contacts between OR cluster bins. Each bin is ordered by H3K79me3 ChIP signal (gray color bar on top) and annotated according to the zonal identity of its resident OR genes: zone 1 ORs, red; zone 2-3 ORs, green; zone 4-5 ORs, blue. Class I OR genes (which are also expressed in zone 1) make few interchromosomal interactions throughout all zones of the MOE and were thus excluded from this analysis. OR cluster regions that have higher levels of H3K79me3 and are enriched for zone 1 ORs have increased trans Hi-C contacts. (A–D) Pooled data from two biological replicates is shown for all ChIP experiments.
Figure 3 with 1 supplement
Zonal olfactory receptor (OR) compartmentalization permits OR genes from more ventral zones to be recruited into the OR compartment.
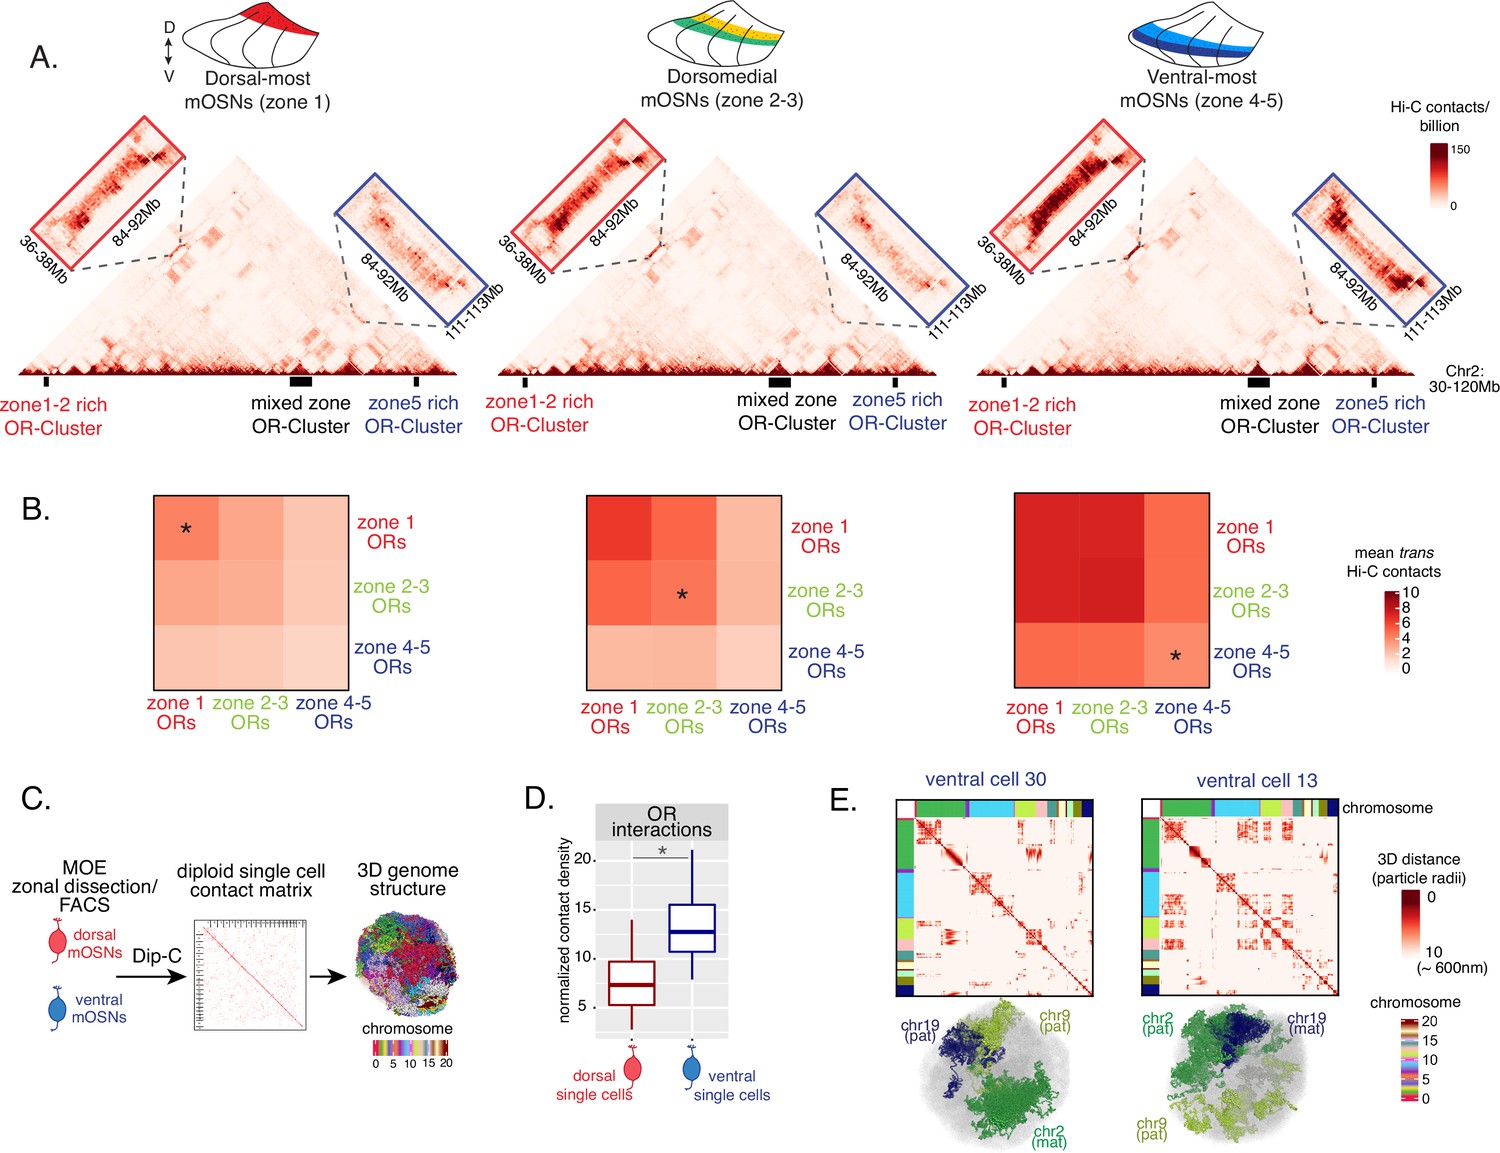
(A) In situ Hi-C contact matrices of a 90 Mb region of chromosome 2 that contains three large OR gene clusters, depicted with boxes under the contact matrices. Hi-C libraries were prepared from mature OSNs (mOSNs) FAC-sorted from dorsal-most (zone 1) and ventral-most (zone 4–5) main olfactory epithelium (MOE) microdissections, as well as a pure population of Olfr17 (a zone 2 OR) expressing dorsomedial mOSNs. For each zonal contact matrix, magnified views show long-range cis Hi-C contacts between the large OR gene cluster in the middle that contains ORs of every zonal identity with the OR cluster on the left that contains mostly zone 1–2 identity ORs (red box) and the OR cluster on the right that contains mostly zone 4–5 identity ORs (blue box). Cis contacts between OR genes increase from dorsal to ventral mOSNs, but the zone 4–5 identity OR cluster associates with the other ORs only in the ventral-most OSNs (as seen when comparing Hi-C contacts in the blue boxes). (B) Heatmaps of average interchromosomal Hi-C contacts between OR genes annotated by their zonal identity at 50 Kb resolution show increased trans contacts in mOSNs from more ventral zones. OR genes have a similar, intermediate frequency of contacts in the mOSN population where they are expressed, marked with an asterisk. Class I OR genes (which are also expressed in zone 1) make few interchromosomal interactions in all zones (data not shown) and were thus excluded from this analysis. (A–B) Pooled data from two biological replicates is shown for all Hi-C analysis. (C) Dip-C in mOSNs from dorsal and ventral dissected MOE was used to generate haplotype-resolved single-cell contact matrices and 3D genome structures, as previously described (Tan et al., 2019). (D) Analysis of Dip-C contact densities of interchromosomal contacts between ORs genes confirms that ventral mOSNs have increased OR compartment interactions. Wilcoxon rank sum test: p-value = 9.164e-11. (E) Single-cell heatmaps of pairwise distances between OR genes generated from 3D genome structures in two ventral mOSNs show OR genes from different chromosomes intermingle in a different pattern in the two cells (top). For each cell, heatmaps are sorted by chromosome order and show all OR interactions within 10 particle radii (approximately ~600 nm). Representative 3D structures show the different positioning of three chromosomes (chr19, chr9, and chr2) in the two cells, resulting in a different pattern of OR cluster contacts (bottom). See also Figure 3—figure supplement 1 for heatmaps of Dip-C distances in each of the 48 dorsal and ventral mOSNs.
Figure 3—figure supplement 1
Olfactory receptor (OR) compartments are highly variable between single cells but show a consistent difference between cells of different zones.
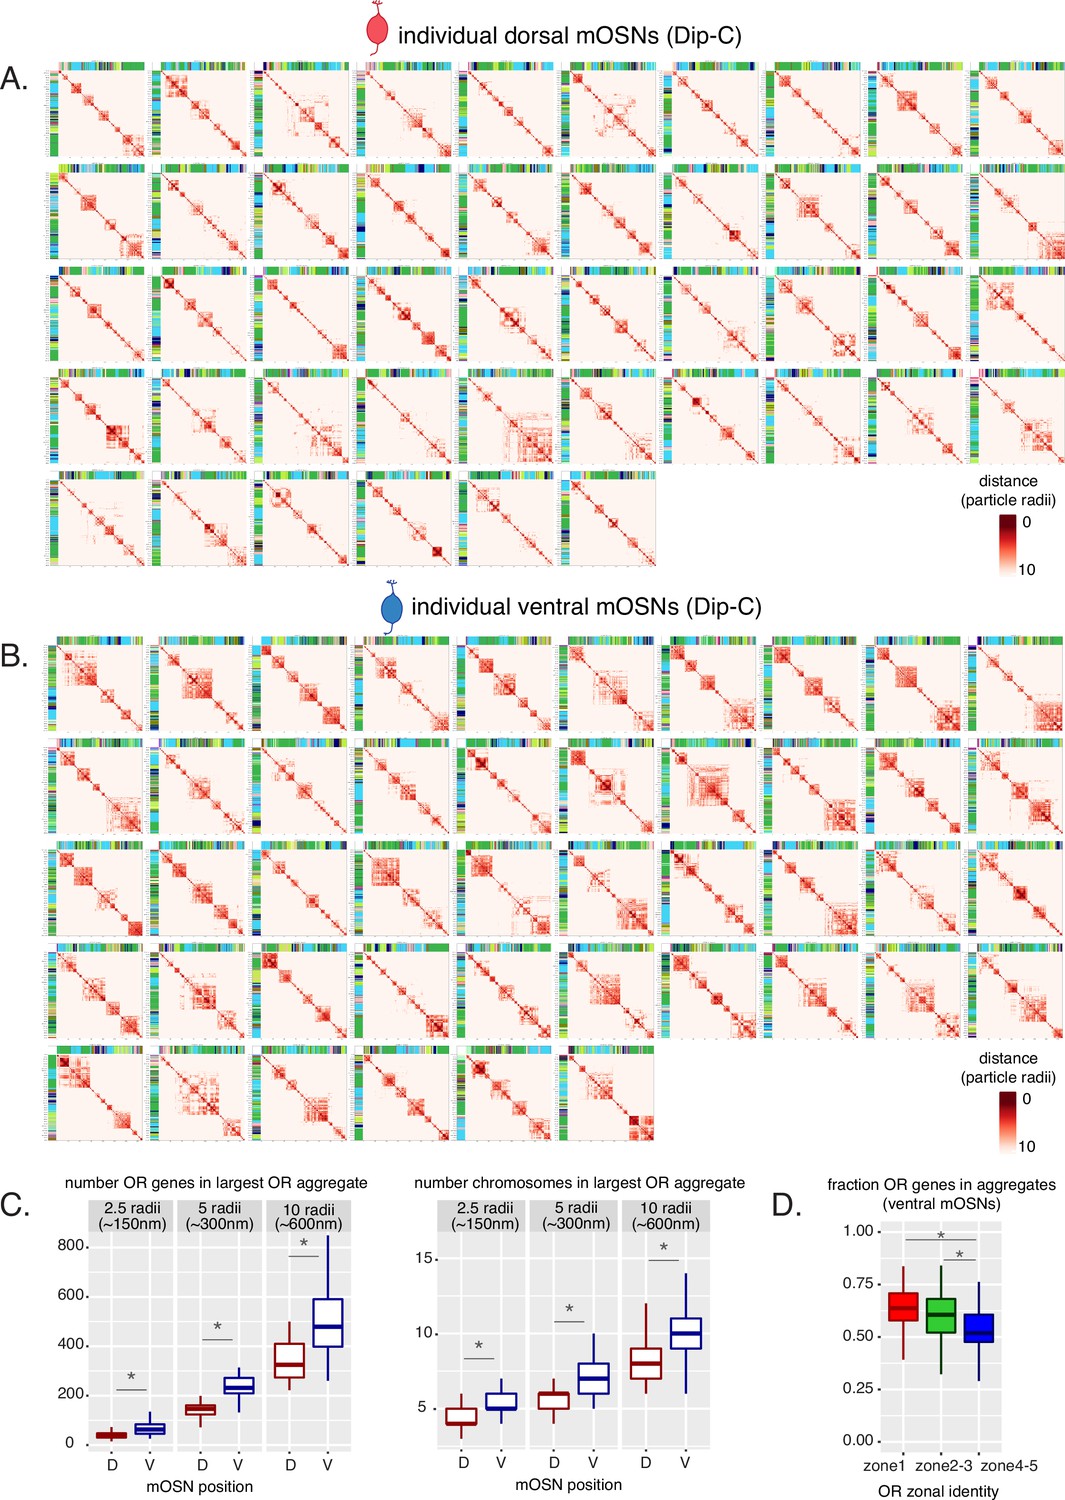
(A, B) Heatmaps of distances between OR genes computed from Dip-C 3D genome structures show OR genes within 10 particle radii (~600 nm) in each dorsal mature OSN (mOSN) (A) and ventral mOSN (B). Heatmaps are hierarchically clustered to show intrachromosomal OR gene aggregates. (C) Analysis of all OR genes within either 2.5, 5, or 10 particle radii (analogous to ~150, 300, and 600 nm) of one another in 3D nuclear structures shows that OR genes in ventral mOSNs form larger (composed of more OR genes) (left) and more complex (composed of ORs residing on more chromosomes) (right) OR compartments. D=dorsal, V=ventral. Wilcoxon rank sum test: *p-value <0.01 [Benjamini-Hochberg FDR = 0.05]. (D) In each ventral mOSN a significantly smaller fraction of ventral identity (zone 4–5) OR genes are in proximity of ORs from other chromosomes than dorsomedial (zone 2–3) or dorsal (zone 1) identity ORs. Proximity is defined as within 2.5 particle radii (analogous to ~150 nm) in 3D nuclear structures. Wilcoxon rank sum test: *p-value <0.01 [Benjamini-Hochberg FDR = 0.05].
Figure 4 with 1 supplement
NFI paralogue gradients regulate zonal olfactory receptor (OR) expression.
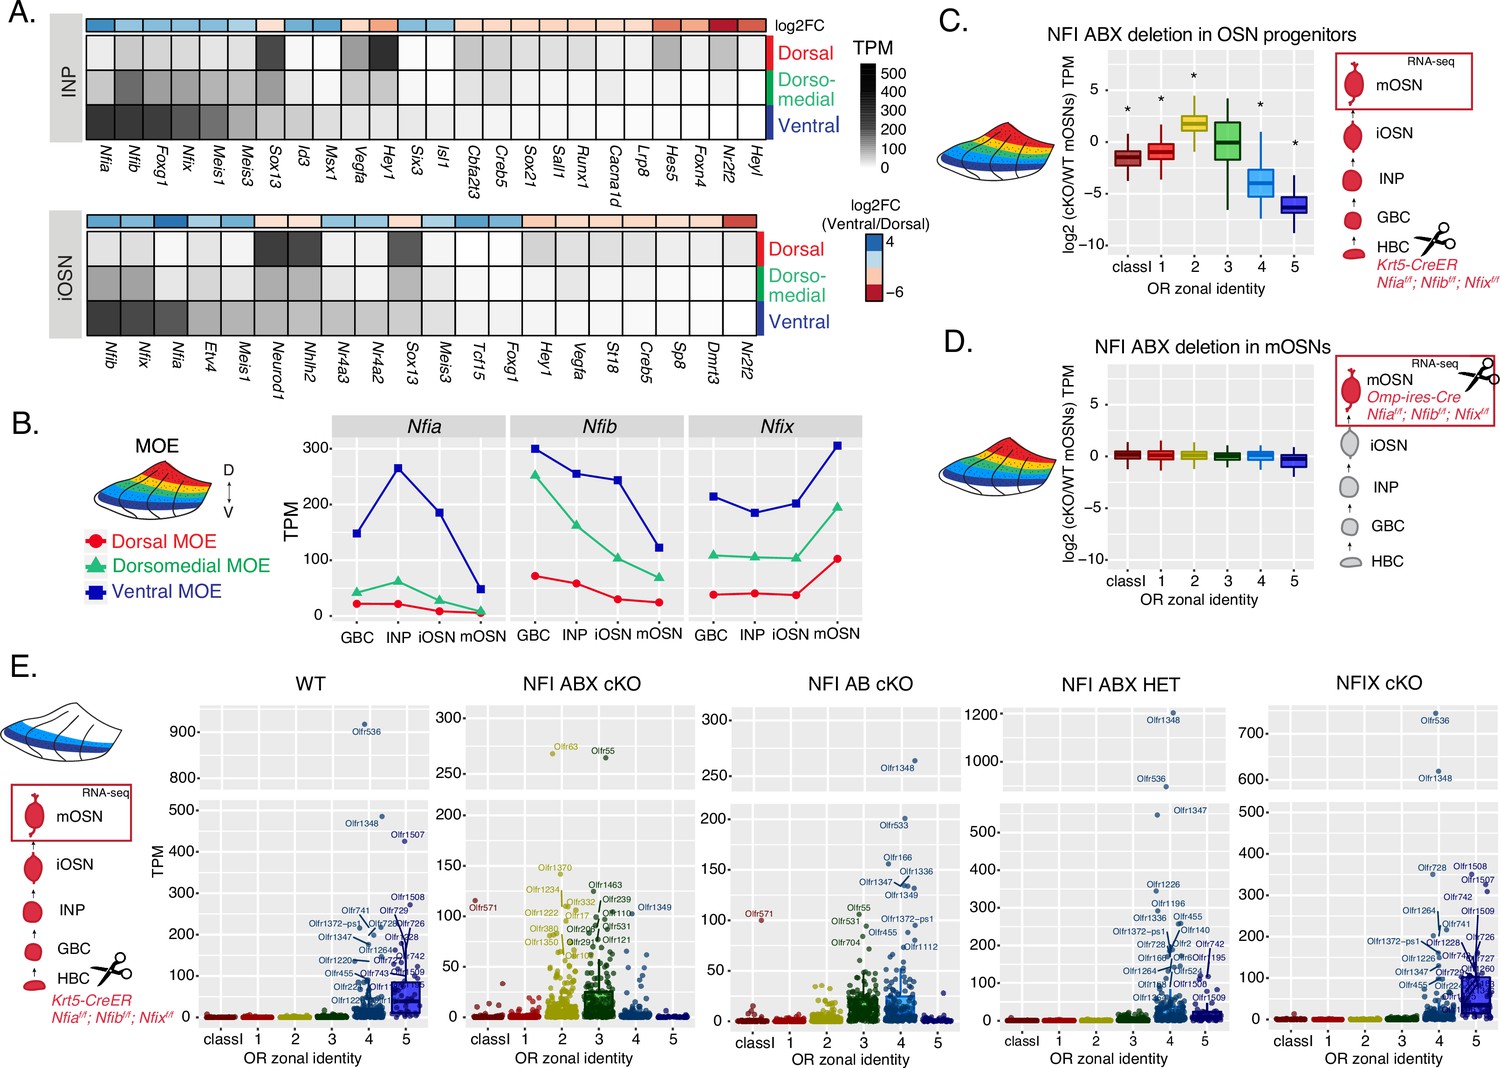
(A) Heatmaps showing differentially expressed transcription factors in the immediate neuronal precursor (INP) and immature olfactory sensory neuron (iOSN) cells isolated from the either dorsal, dorsomedial, or ventral olfactory epithelium. The shown transcription factors are significantly differentially expressed between dorsal and ventral cells with an adjusted p-value of <0.05, at least a threefold change in expression, and an expression level of at least 15 TPM (transcripts per million). Adjusted p-values use the Benjamini-Hochberg method to control for multiple hypothesis testing. A broader list of zonal transcription factors is included in Supplementary file 1. The heatmaps are sorted based on expression in ventral cells and the color bar above each heatmap shows the log2 fold change in ventral cells relative to dorsal cells. Three biological replicates were analyzed for INP and iOSNs from dorsal-most and ventral-most main olfactory epithelium (MOE), and two biological replicates were analyzed for INP and iOSNs from dorsomedial MOE. (B) Expression levels of Nfia, Nfib, and Nfix at four stages of olfactory sensory neuron (OSN) development in dorsal cells (red), dorsomedial cells (green) and ventral cells (blue). (C, D) Comparison of OR gene expression in NFI ABX triple knockout (Nfia, Nfib, and Nfix deletion) and control cells from the whole MOE. NFI transcription factors are deleted either in olfactory progenitors (C) using the Krt5-CreER driver or in mOSNs (D) using the Omp-IRES-Cre driver (as illustrated in Figure 4—figure supplement 1). At the right of each panel, scissors indicate the differentiation stage of Nfia, Nfib, and Nfix deletion, and a red box marks the cell type that was FAC-sorted for RNA-seq analysis. Two biological replicates were compared for NFI ABX triple knockout in olfactory progenitors and controls (C), and three biological replicates were compared for NFI ABX triple knockout in mOSNs and controls (D). Wilcoxon rank sum test: *p-value <0.01 [Benjamini-Hochberg FDR = 0.05]. (E) OR expression in NFI ABX triple knockout, NFI AB double knockout, NFIX knockout, NFI ABX triple heterozygous and control mOSNs from ventrally dissected MOE. Knockout was induced in progenitors with the Krt5-CreER driver. Plots show a different pattern of OR gene transcription in the different genotypes. Quantification of differentially expressed ORs for the three knockout genotypes is shown in Figure 4—figure supplement 1. Three biological replicates were compared for NFI ABX triple knockout mOSNs, two replicates for NFI AB double knockout, NFIX knockout, and NFI ABX triple heterozygous mOSNs, and four replicates for control mOSNs.
Figure 4—figure supplement 1
NFI ABX deletion in zone 5 olfactory epithelium results in a shift in the olfactory receptor (OR) repertoire.
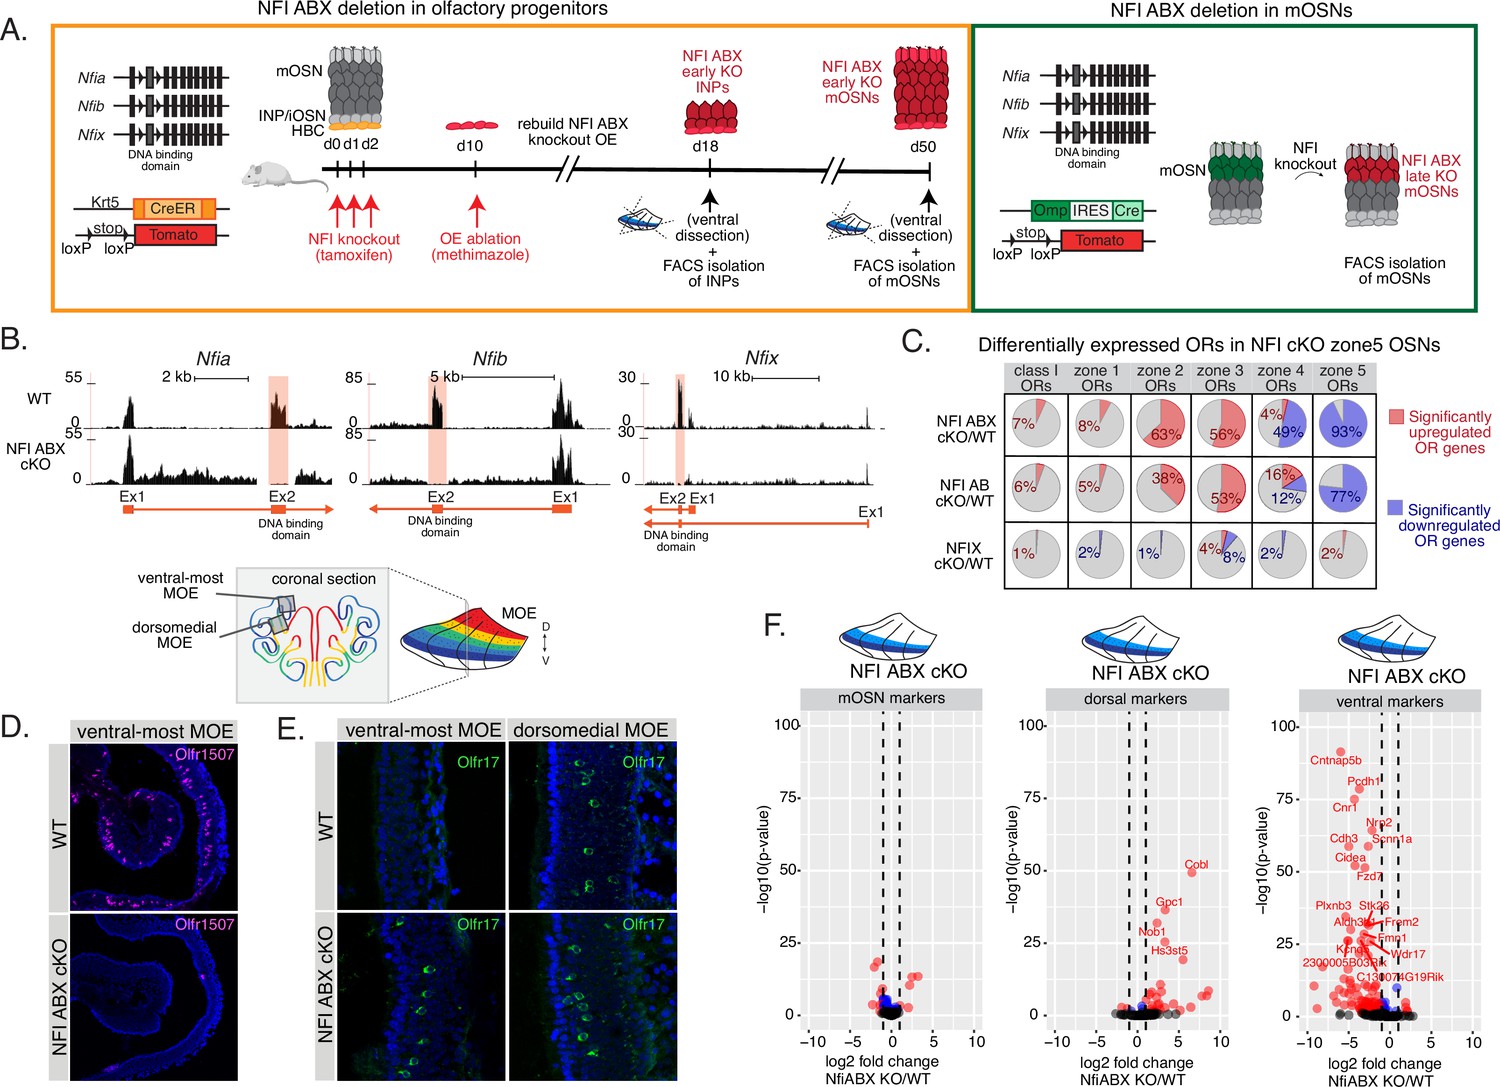
(A) Schematic showing the experimental and genetic strategy for deleting NFI transcription factors using Nfia, Nfib, and Nfix triple fl/fl mice in olfactory progenitor horizontal basal cell (HBC) cells using the Krt5-CreER driver (left), and in mature OSNs (mOSNs) using the Omp-IRES-Cre driver (right). Upon induction of NFI deletion in HBCs with tamoxifen, we chemically ablate the main olfactory epithelium (MOE) with methimazole, allowing the quiescent HBCs to rebuild the epithelium. After 40 days, olfactory sensory neurons (OSNs) that were produced from the triple NFI conditional knockout (NFI ABX cKO) or control HBCs will be marked with a tomato reporter, and isolated by FACS. (B) Olfr1507 (a zone 5 identity OR) immunofluorescence (magenta) in MOE sections of adult NFI ABX triple cKO mice and age-matched control (wt) mice. Nuclei are stained with Dapi (blue). Images were taken in the same ventral location, indicated on the schematic of a coronal section of the MOE. (C) Olfr17 (a zone 2 identity OR) immunofluorescence (green) in MOE sections of adult NFI ABX triple conditional knockout (cKO) mice and age-matched control mice (wt), shows normal Olfr17 expression in dorsomedial MOE and ectopic spreading of Olfr17 expression into more ventral zones. Images were taken in the same spots in the MOE, indicated in the schematic. Nuclei are stained with Dapi (blue). (D) Differential expression analysis of OR genes in the different NFI cKO genotypes (see Figure 4E). Percentages of significantly upregulated ORs (red) and downregulated ORs (blue) are shown. Adjusted p-value <0.5. (E) Volcano plot showing expression of non-zonal mOSN markers, dorsal mOSN markers, and ventral mOSN markers in ventral mOSNs isolated from NFI ABX triple cKO relative to wt MOE. Only 13/200 non-zonal mOSN markers are significantly differentially expressed with at least a twofold change in expression in NFI ABX triple knockout (eight of these were downregulated and four upregulated), compared to 86/207 ventral markers significantly downregulated with a twofold change and 27/138 dorsal markers that were significantly upregulated with a twofold change. Blue: significantly differentially expressed genes (adjusted p-value <0.5), red: significantly differentially expressed genes with a>twofold change in expression.
Figure 5 with 1 supplement
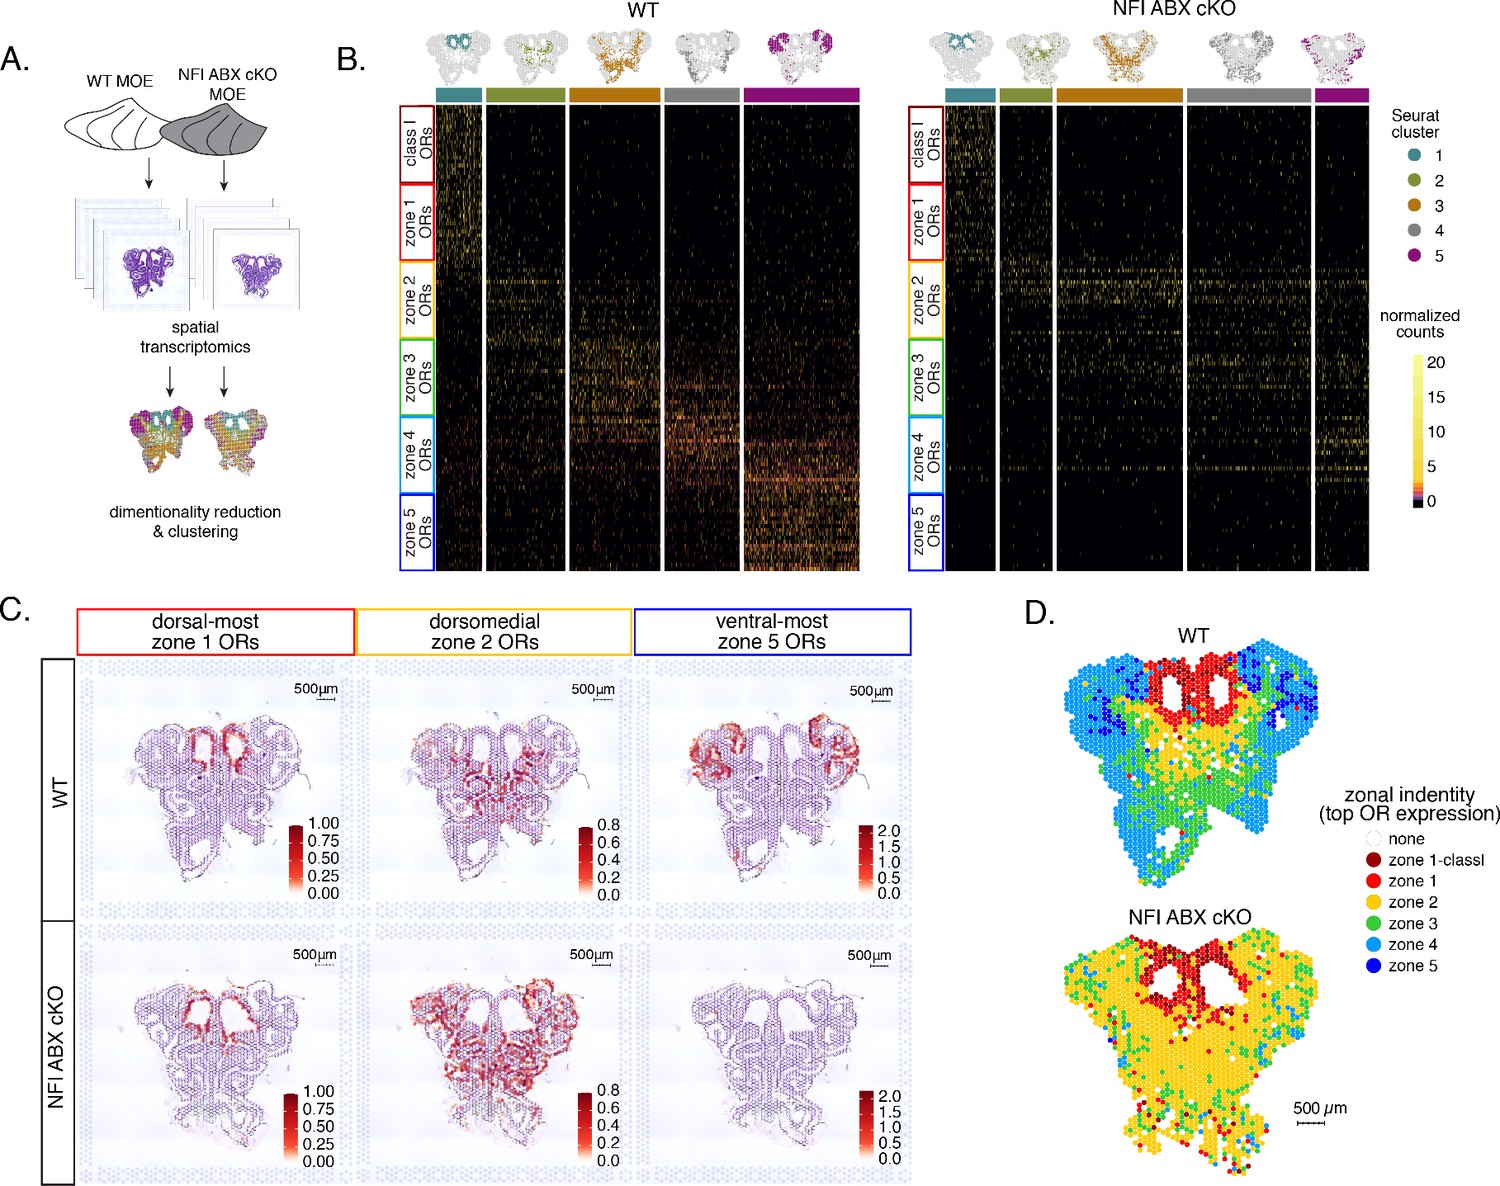
Spatial transcriptomics shows dorsalization and homogenization of the main olfactory epithelium (MOE) upon NFI A, B, and X deletion.
(A) Schematic depicting our analysis pipeline: Spatial transcriptomics was performed on sections of wt control and NFI ABX conditional knockout (cKO) MOE. Dimensionality reduction was performed, and spatial spots were clustered based on normalized expression of olfactory receptor (OR) genes. (B) Heatmaps showing scaled, normalized expression levels of the top 20 highest expressed OR genes per zone in the control dataset. Unbiased neighborhood analysis and clustering grouped spatial spots into five clusters for both control and cKO MOE (depicted in distinct colors on the top of the heatmaps). Clustering of spatial spots in the control sample reproduces anatomical zones, as spots within each cluster express OR genes with the corresponding zonal identity (left heatmap). The same clusters were generated for NFI cKO sample (right heatmap). Although cluster 1 expresses exclusively zone 1 ORs, like in control MOEs, clusters 2–5 exhibit homogenous OR expression, with ventral expansion of zone 2/3 ORs, and reduced representation of zone 4/5 ORs. Heatmaps show deeply sequenced data from four sections from one mouse for wt and cKO sample. More shallowly sequenced data from four sections each from two biological replicates for wt and cKO sample showed similar results and are not shown. (C) Average normalized per-spot expression of the 20 highest expressed OR genes from zone 1, zone 2, and zone 5 is overlaid against H&E histological image of control (top) and NFI cKO (bottom) MOE sections. Expression of zone 1 OR genes is confined to the same anatomical region for both control and NFI cKO sections. Zone 2 OR gene expression is spread to more ventral regions in the NFI cKO compared to control sections, while expression of zone 5 OR genes is almost completely absent in the NFI cKO sample. (D) Spatial spots are colored according to their zonal assignment, which was determined based on the highest summed normalized expression of OR genes per zonal identity within that spot. Zonal spot assignment of the control sample visually reproduces known anatomical zones. In the NFI cKO sample, spots in the dorsal region have the highest expression of class I and zone 1 OR genes, similar to the control sample. However, in the rest of the NFI cKO MOE, most spots have a zone 2 OR identity. Spots assigned the identity ‘none’ did not contain any OR transcripts and were excluded from cluster analysis.
Figure 5—figure supplement 1
Expression of zone 2 olfactory receptors (ORs) genes spreads ventrally in NFI ABX knockout main olfactory epithelium (MOE).
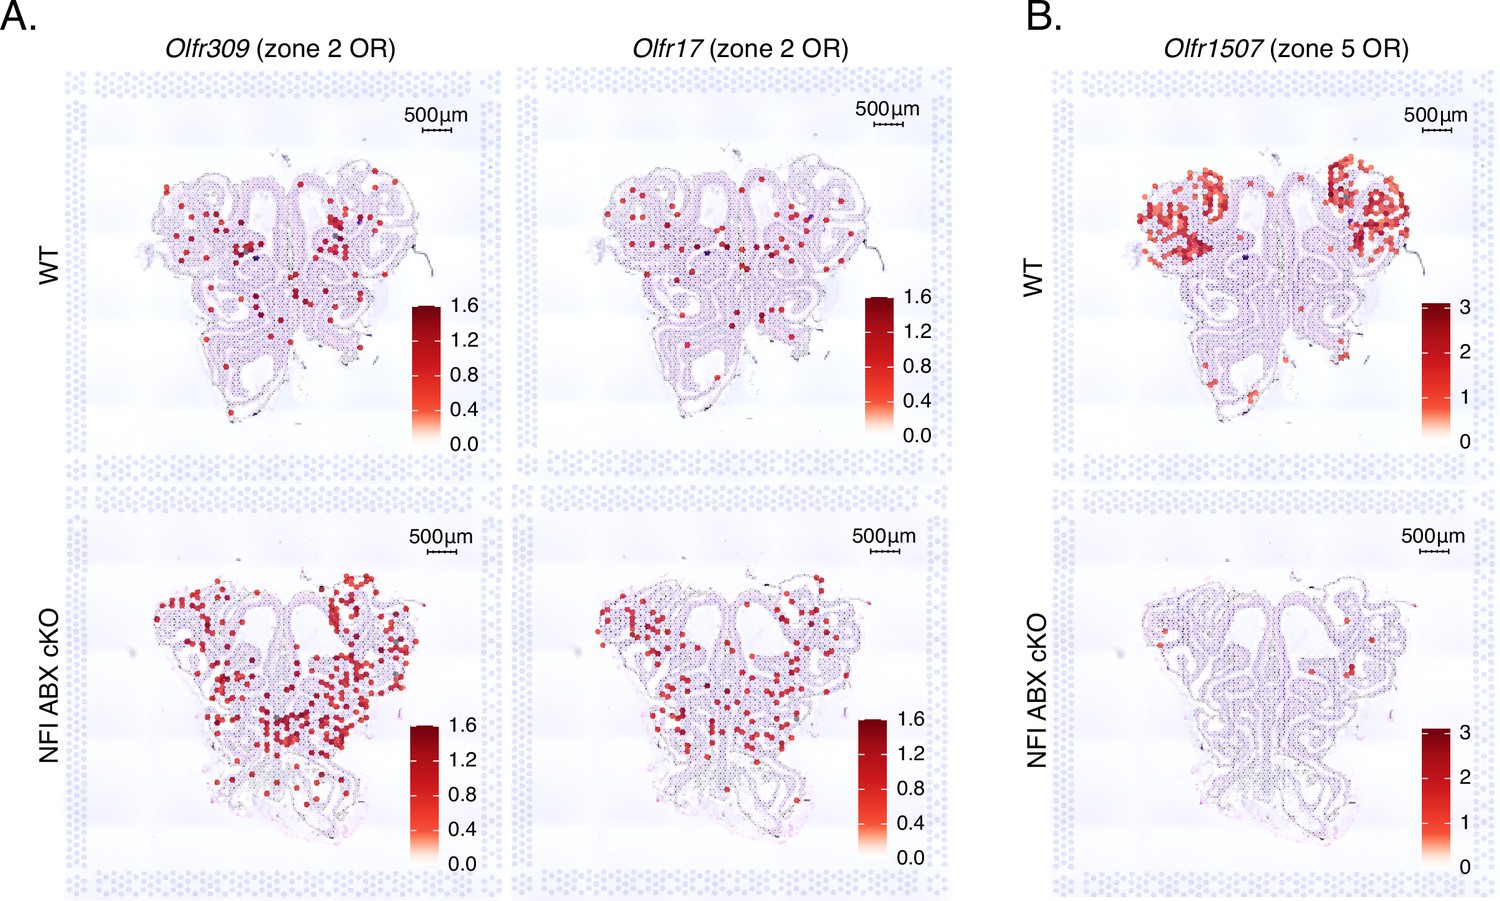
(A) Normalized expression per spatial spot of the zone 2 identity OR genes Olfr309 and Olfr17 overlaid against histological H&E tissue image of wt control and NFI ABX knockout MOE. Olfr309 is the highest expressed zone 2 OR gene in the control dataset. Expression of Olfr309 and Olfr17 in the NFI ABX knockout sample spreads to more ventral areas of the MOE compared to the control. (B) Normalized expression per spatial spot of Olfr1507, the most highly expressed zone 5 OR gene in the control MOE dataset. As expected, Olfr1507 is expressed in the ventral zone 5 anatomical region in the control MOE, while its expression is almost completely absent in the NFI ABX knockout MOE.
Figure 6 with 1 supplement
NFI A, B, and X regulate chromatin state and olfactory receptor (OR) compartment formation .
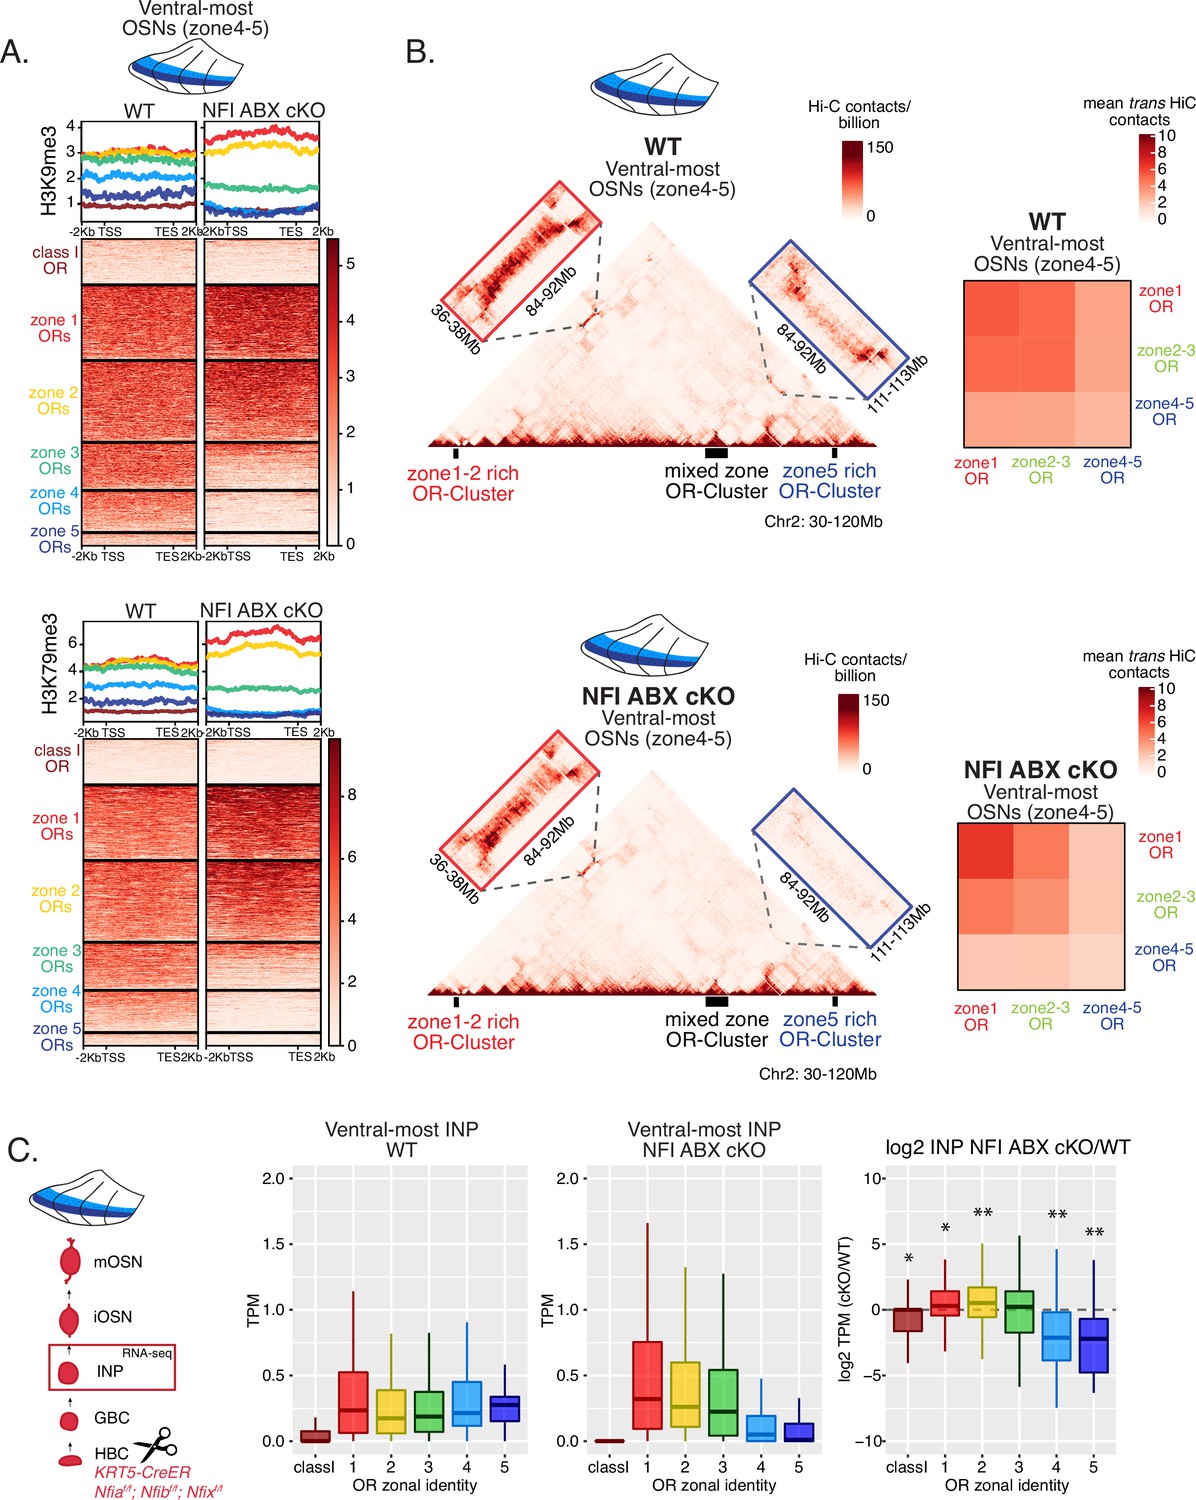
(A) Native ChIP-seq for H3K9me3 (top) and H3K79me3 (bottom) in NFI ABX knockout mature OSNs (mOSNs) from ventral main olfactory epithelium (MOE). Heatmaps show ChIP signal over OR gene bodies, scaled to 6 kb with 2 kb flanking on either side. There is a decrease of both histone marks on zone 3–5 identity OR genes in NFI ABX knockout compared to control. Triple NFI deletion was induced with the Krt5-CreER driver (before OSN differentiation). (B) Hi-C in NFI ABX knockout and control mOSNs from ventral MOE. Left: In situ Hi-C contact matrices of a 90 Mb region of chromosome 2 from control (top) and NFI ABX triple knockout (bottom) ventral mOSNs, as described in Figure 3A. The contact matrix shows long-range cis interactions between three large OR gene clusters: one enriched for dorsal, zone 1–2, identity ORs (left), one containing ORs of every zonal identity (middle), and one enriched for ventral, zone 4–5, identity ORs. Note that long-range cis contacts between the zone 4–5 identity enriched cluster and the mixed identity cluster dissipate in the triple NFI cKO (bottom, blue box), whereas the contacts of the mixed identity cluster with the zone 1–2 identity enriched cluster are preserved (bottom, red box). Right: Heatmaps of average interchromosomal Hi-C contacts between OR genes annotated by their zonal identity (as described in Figure 3B) in control (top) and triple NFI cKO (bottom) mOSNs from ventral MOE. Trans contacts between zone 4–5 ORs dissipate, whereas trans contacts between zone 2–3 ORs reach intermediate levels typically detected between OR genes with the ‘correct’ zonal identity for a given MOE segment (see Figure 3). (A–B) Pooled data from two biological replicates is shown. (C) OR expression by zonal identity in immediate neuronal precursor (INP) cells isolated from ventral NFI ABX knockout and control MOE. Triple NFI deletion was induced with the Krt5-CreER driver (before OSN differentiation) and NFI ABX INP cells were isolated as described in Figure 4—figure supplement 1. Log2 fold change of OR expression in NFI ABX vs control INP cells shows a significant decrease in expression of zone 4–5 ORs (right). Wilcoxon rank sum test: *p-value <0.05, **p-value <0.001 [Benjamini-Hochberg FDR = 0.05]. Two biological replicates of NFI ABX cKO and control were analyzed.
Figure 6—figure supplement 1

Ventral NFI ABX cKO cells closely resemble dorsomedial cells in chromatin state and compartment formation.
(A) Heatmap with a side-by-side comparison of H3K79me3 native ChIP-seq signal over olfactory receptor (OR) genes in wt control dorsal, dorsomedial, and ventral mature OSNs (mOSNs) compared to ventral NFI ABX cKO mOSNs. Ventral NFI ABX cKO mOSNs have a chromatin state most similar to that of wt control dorsomedial mOSNs. (B) Side-by-side heatmaps of average interchromosomal Hi-C contacts between OR genes of different zonal identities show the nuclear OR gene interactome in ventral NFI ABX cKO OSNs is most similar to that of wt control dorsomedial mOSNs, especially regarding the intermediate Hi-C contact frequency of zone 2–3 identity ORs. (A–B) Pooled data from two biological replicates is shown for all ChIP and Hi-C experiments.
Figure 7 with 1 supplement
Genetic induction of olfactory receptor (OR) transcription in olfactory progenitors determines OR choice in mature OSNs (mOSNs).
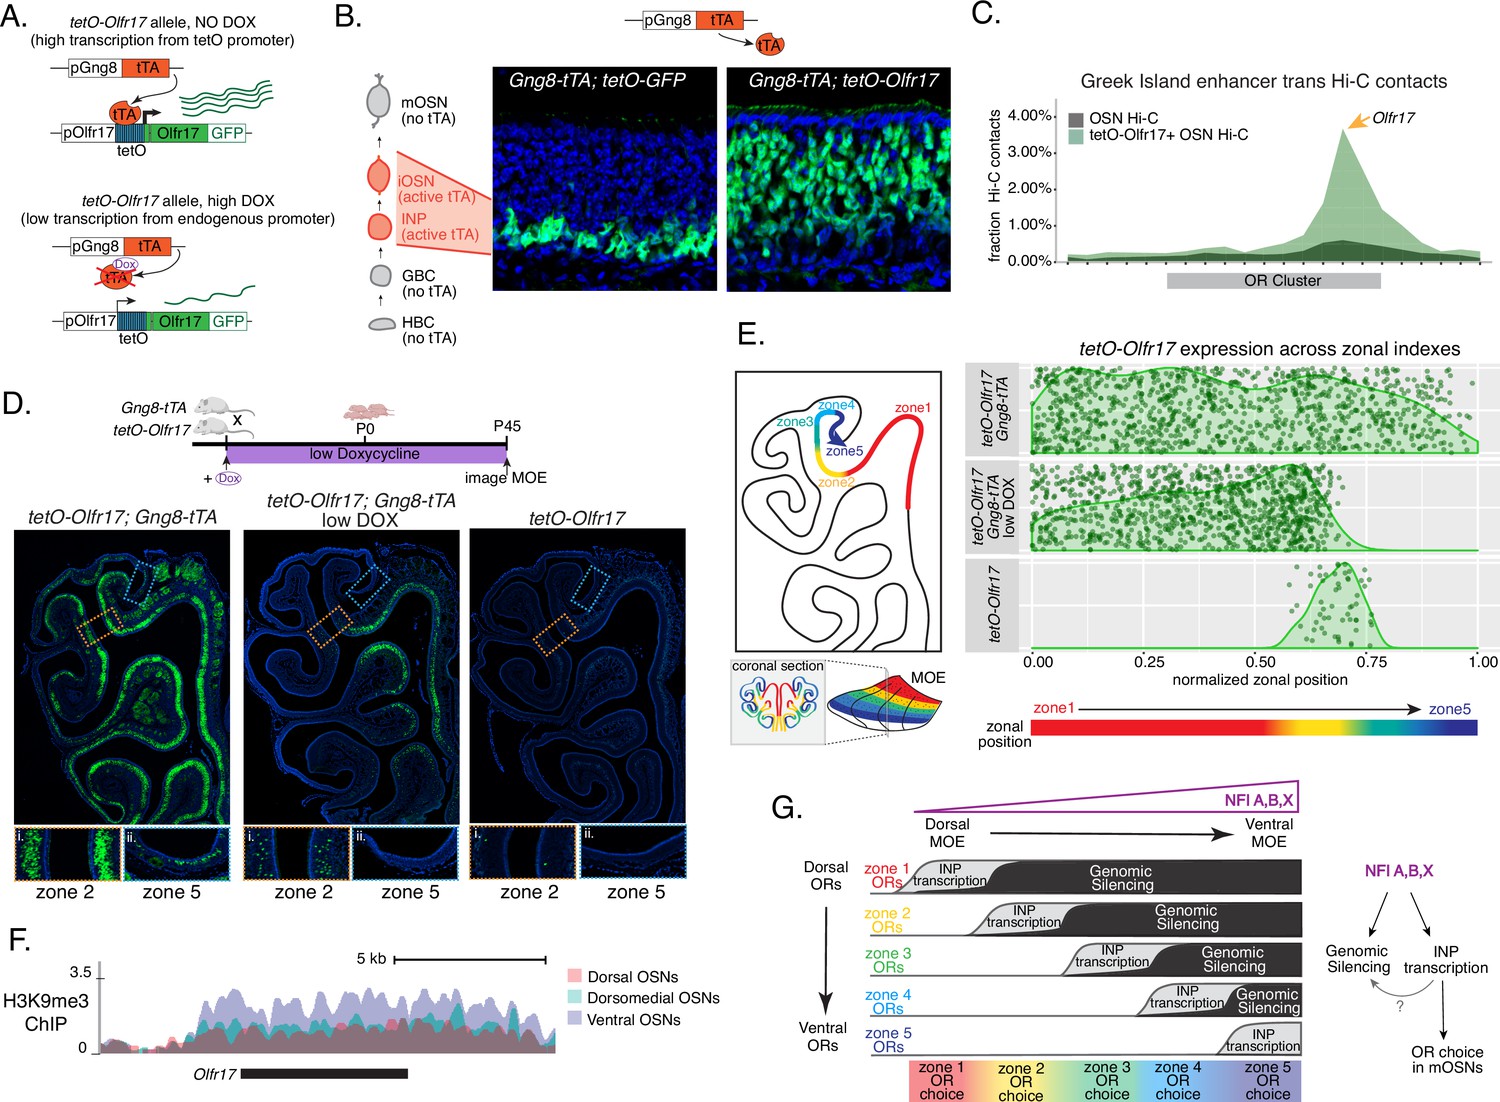
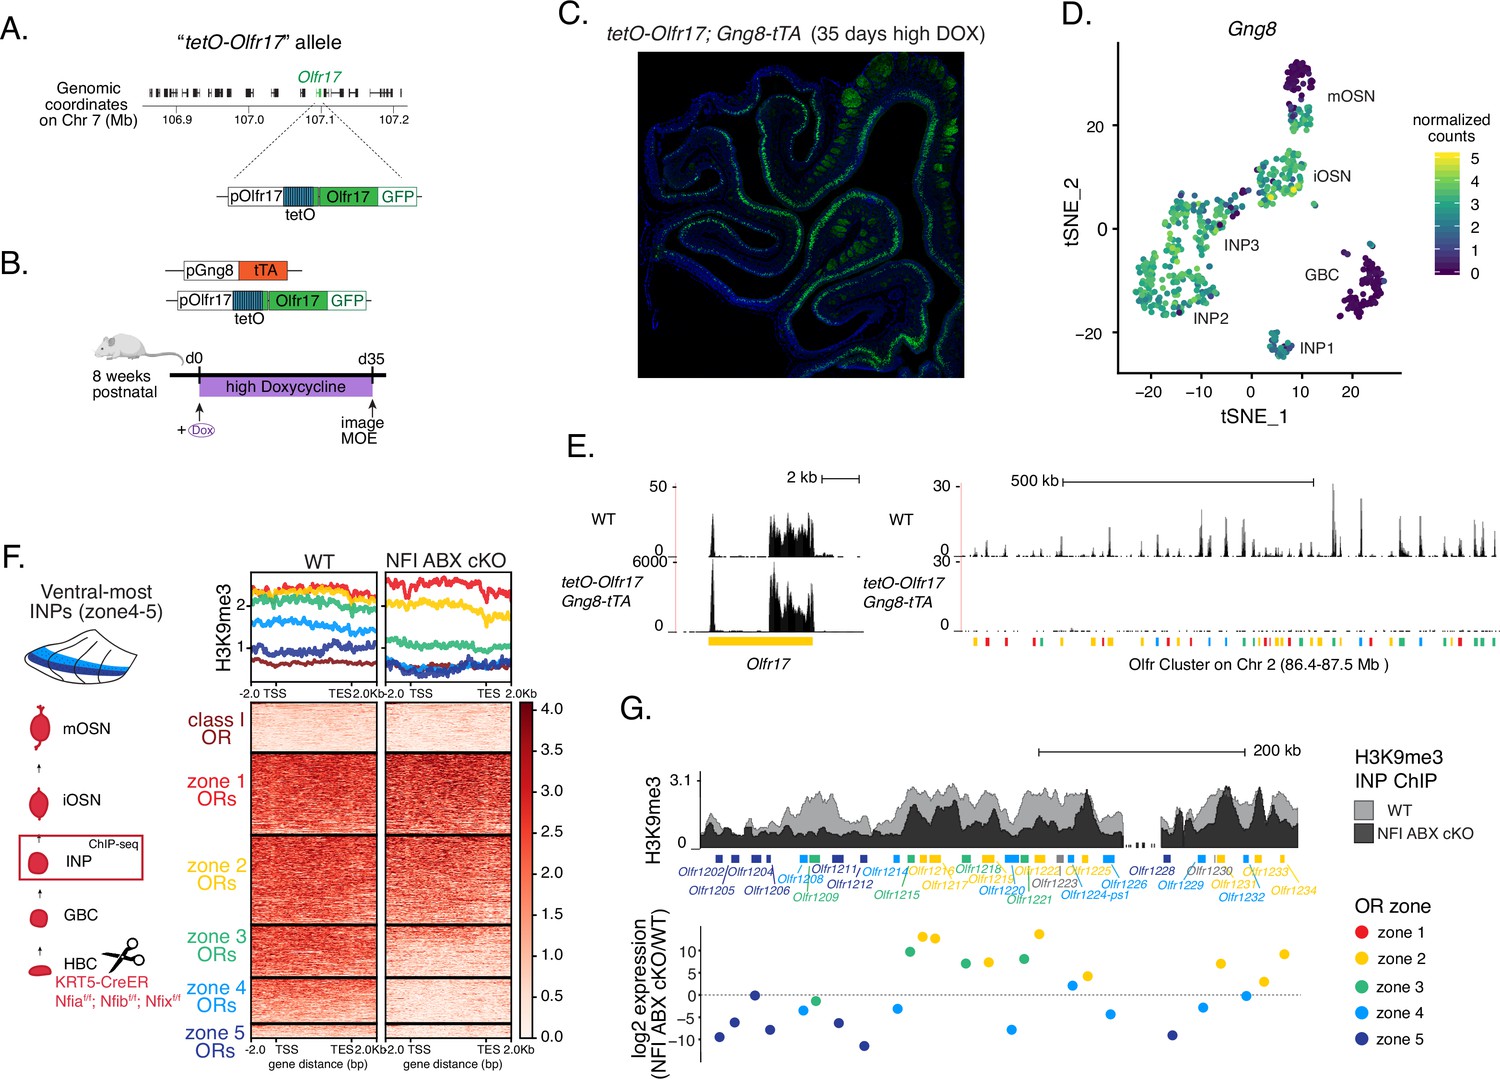
(A) Genetic strategy for transcriptional induction of OR Olfr17 (a zone 2 identity OR) from its endogenous genomic locus. A genetically modified ‘tetO-Olfr17’ allele contains a tetO promoter immediately downstream of the endogenous Olfr17 promoter and an IRES GFP reporter after the coding sequence (Fleischmann et al., 2013). In the presence of tTA a high level of tetO-Olfr17 is induced from the tetO promoter (top), while in the presence of a high amount of doxycycline (DOX) tTA is inhibited and transcription is regulated by the endogenous promoter. See also Figure 7—figure supplement 1A for information on the genomic locus of this Olfr17 allele. (B) tTA driven by the Gng8 promoter is expressed in immediate neuronal precursor (INP) and immature OSN (iOSN) cells in the main olfactory epithelium (MOE) (Tirindelli and Ryba, 1996). When Gng8-tTA drives the expression of a tetO-GFP allele, transcription is detected only in progenitor cells located on the basal side of the MOE, where the tTA is expressed (left) (Nguyen et al., 2010). In contrast, when Gng8-tTA drives the expression of tetO-Olfr17, expression persists in mature OSNs where tTA is no longer present (right). See also Figure 7—figure supplement 1B–C for the sustained and widespread expression of the tetO-Olfr17 allele after 35 days of high DOX treatment and Figure 7—figure supplement 1D for Gng8 expression during OSN differentiation. (C) In situ Hi-C in tetO-Olfr17 expressing cells shows enriched contacts with interchromosomal olfactory receptor (‘Greek Island’) enhancers over the Olfr17 locus, suggesting tetO-Olfr17 + OSNs are using endogenous mechanisms to sustain Olfr17 expression after Gng8-tTA is no longer present. (D) tetO-Olfr17 expression in coronal sections of the MOE determined by GFP fluorescence. In the absence of tTA tetO-Olfr17 expression occurs only in zone 2 of the MOE (right); with high tTA induction in progenitor cells tetO-Olfr17 expression occurs throughout all zones of the MOE (left); and with low tTA induction in progenitor cells, due to the addition of a low amount of doxycycline, tetO-Olfr17 expression occurs in zone 2 and spreads dorsally to zone 1 (middle) only. Magnified views show tetO-Olfr17 expression in its native zone 2 (i) and ectopic expression in the most ventral zone 5 (ii). Mice on low doxycycline (DOX) treatment were provided doxycycline at 1 ug/ml in water throughout gestation and postnatal life. (E) Quantification of tetO-Olfr17 expression (determined by GFP fluorescence in immunofluorescence images) relative to a normalized zonal position (illustrated on the left) in coronal sections of the MOE from tetO-Olfr17 without tTA driver (bottom), tetO-Olfr17 with Gng8-tTA driver (top), and tetO-Olfr17 with Gng8-tTA driver on low DOX (middle). Six sections from two replicates were analyzed for tetO-Olfr17 with Gng8-tTA; 9 sections from two replicates were analyzed from tetO-Olfr17 with Gng8-tTA and low DOX; 29 sections from two replicates were analyzed for tetO-Olfr17 without tTA. The plot displays a maximum of 1000 cells randomly selected for each condition. (F) H3K9me3 native ChIP signal over the Olfr17 locus in mOSNs from dorsal (red), dorsomedial (green), and ventral (blue) MOE shows a higher level of heterochromatin in ventral MOE. (G) Model of OR choice in each zone of the MOE, regulated by the interplay of low-level polygenic OR transcription in INP cells, which defines the OR repertoire that can be chosen in each zone, and heterochromatic silencing, which prevents ectopic expression of more dorsal ORs. Both polygenic OR transcription in INP cells and heterochromatin deposition are influenced by NFI A, B, and X transcription factors, expressed in a dorsal-low ventral-high gradient across the MOE.
Figure 7—figure supplement 1
Hijacking olfactory receptor (OR) gene choice by inducing OR transcription at the stage of polygenic OR transcription.
(A) Schematic showing that the tetO promoter and the IRES-GFP tag have been inserted in the endogenous Olfr17 gene locus on Chromosome 7 (top). Olfr17 (green) resides in a large OR gene cluster surrounded by other OR genes (shown in black). Early induction of this ‘tetO-Olfr17’ allele in olfactory progenitors with the Gng8-tTA driver results in sustained, tTA-independent, expression in mature olfactory sensory neurons (OSNs). GFP signal from induced tetO-Olfr17 expression persists in most OSNs after 35 days in a high doxycycline diet (B,C). (B–C) Schematic of the high doxycycline feeding protocol used to inhibit the tTA and thereby confirm tTA-independent tetO-Olfr17 expression in mOSNs (B). After adult (>8-weeks-old) tetO-Olf17 with Gng8-tTA mice were placed in a high DOX diet for 35 days their OSNs continued to express GFP (C), excluding the possibility that tTA traces could support tetO-Olfr17 transcription. Note the distinction from the low doxycycline (DOX) treatment described in Figure 7, where mice were exposed in utero to doxycycline and never had a chance to induce tetO-Olfr17 expression at high levels. (D) Feature plot showing Gng8 expression in single-cell RNA-seq from sorted cells in the main olfactory epithelium (MOE) (as described in Figure 1—figure supplement 1). Clustering shows six populations corresponding to different stages of mOSN development, with Gng8 being expressed in INP and iOSN cell types but not in mOSNs, consistent with previous reports. (E) Genome track of RNA-seq in tetO-Olfr17 + OSNs from Gng8-tTA; tetO-Olfr17 mice and previously published WT OSNs (GSE112153). Cells expressing the immediate neuronal precursor (INP)/immature OSN (iOSN)-induced tetO-Olfr17 allele do not express any other OR genes. (F, G) H3K9me3 native ChIP in ventral INP cells isolated from NFI ABX KO and age-matched wild-type (WT) control mice (as described in Figure 4—figure supplement 1) shows heterochromatin deposition at the onset of OR choice. Heatmap of ChIP signal (F) shows decreased heterochromatin on zone 4–5 OR genes, which have the ‘correct’ zonal identity for expression in this ventral segment. Overlay of ChIP signal tracks of over an OR cluster (G, top) shows variable changes in heterochromatin levels between WT control and NFI ABX cKO INP cells throughout the cluster. OR genes are colored according to their zonal identity. Log2 fold change in expression between ventral NFI ABX knockout and WT control mOSNs for each OR in the cluster is shown (G, bottom). Note that zone 2 and 3 OR genes ectopically chosen in ventral NFI ABX KO OSNs have decreased heterochromatin in ventral KO INPs. Pooled data from two biological replicates is shown.
Additional files
-
Supplementary file 1
Complete list of transcription factors significantly differentially expressed between dorsal and ventral cells at various stages of olfactory sensory neuron (OSN) differentiation.
- https://cdn.elifesciences.org/articles/87445/elife-87445-supp1-v1.xlsx
-
Supplementary file 2
Complete list of mouse genotypes analyzed in this manuscript (related to methods).
- https://cdn.elifesciences.org/articles/87445/elife-87445-supp2-v1.xlsx
-
Supplementary file 3
List of reagents used for spatial transcriptomics (related to methods).
- https://cdn.elifesciences.org/articles/87445/elife-87445-supp3-v1.xlsx
-
MDAR checklist
- https://cdn.elifesciences.org/articles/87445/elife-87445-mdarchecklist1-v1.docx
Download links
A two-part list of links to download the article, or parts of the article, in various formats.
Downloads (link to download the article as PDF)
Open citations (links to open the citations from this article in various online reference manager services)
Cite this article (links to download the citations from this article in formats compatible with various reference manager tools)
Opposing, spatially-determined epigenetic forces impose restrictions on stochastic olfactory receptor choice
eLife 12:RP87445.
https://doi.org/10.7554/eLife.87445.3


