Structural and mechanistic insights into the MCM8/9 helicase complex
- Shenzhen Key Laboratory for Systems Medicine in Inflammatory Diseases, School of Medicine, Shenzhen Campus of Sun Yat-sen University, China
- State Key Laboratory of Protein and Plant Gene Research, School of Life Sciences, Peking University, China
- Department of Colorectal Surgery, The Sixth Affiliated Hospital, Sun Yat-sen University, Guangdong Institute of Gastroenterology, Guangdong Provincial Key Laboratory of Colorectal and Pelvic Floor Diseases, China
- Pharmaceutical Sciences (Shenzhen), Sun Yat-sen University, China
Figures
Figure 1 with 9 supplements
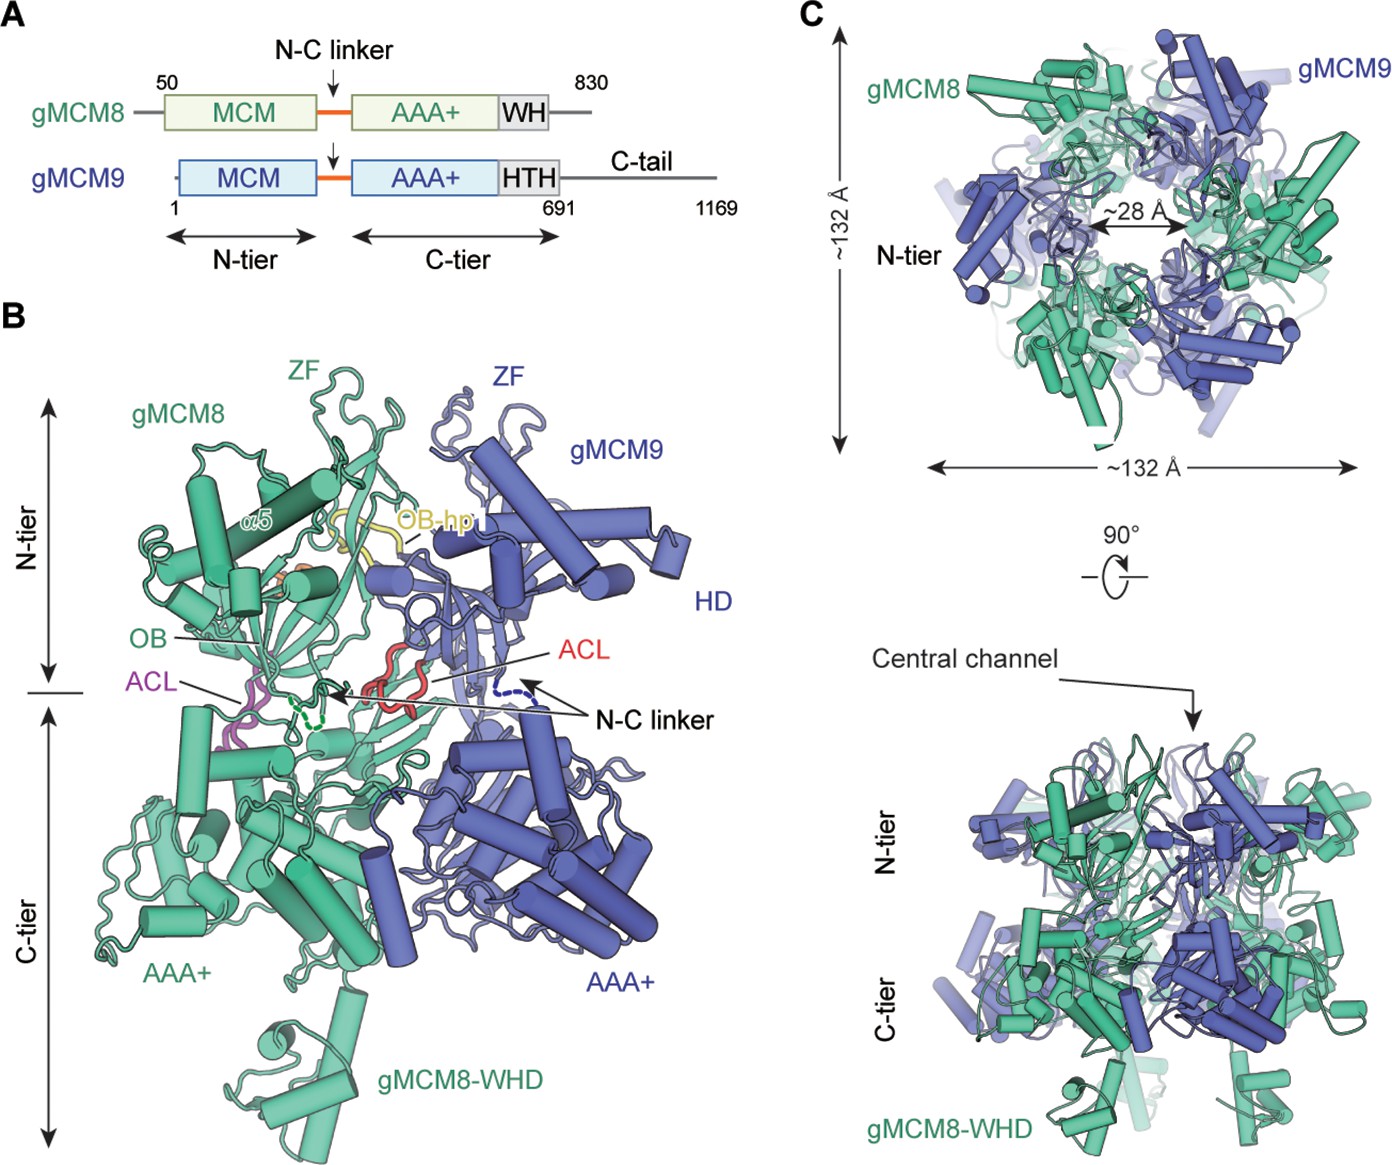
Overall structural features of the gMCM8/9 hexamer.
(A) Domain organization of chicken MCM8 and MCM9. (MCM8, green cyan; MCM9, slate), N-C linker, linkers connecting the N-terminal domain (NTD) and C-terminal domain (CTD) of MCM8 or MCM9; WH, winged helix domain; HTH, helix-turn-helix; the C-tail domain is not included in this study. (B) Fold of the gMCM8/9 dimer. The N-C linkers are shown as dotted lines and the OB hairpins OB-hp are highlighted in orange (MCM8) and yellow (MCM9), while the allosteric communication loop (ACL) are highlighted in purple (MCM8) and red (MCM9). The long helix of MCM8 was marked as α5. (C) Ribbon diagram showing the top and side views of gMCM8/9 hexamer with threefold symmetry axis.
Figure 1—figure supplement 1
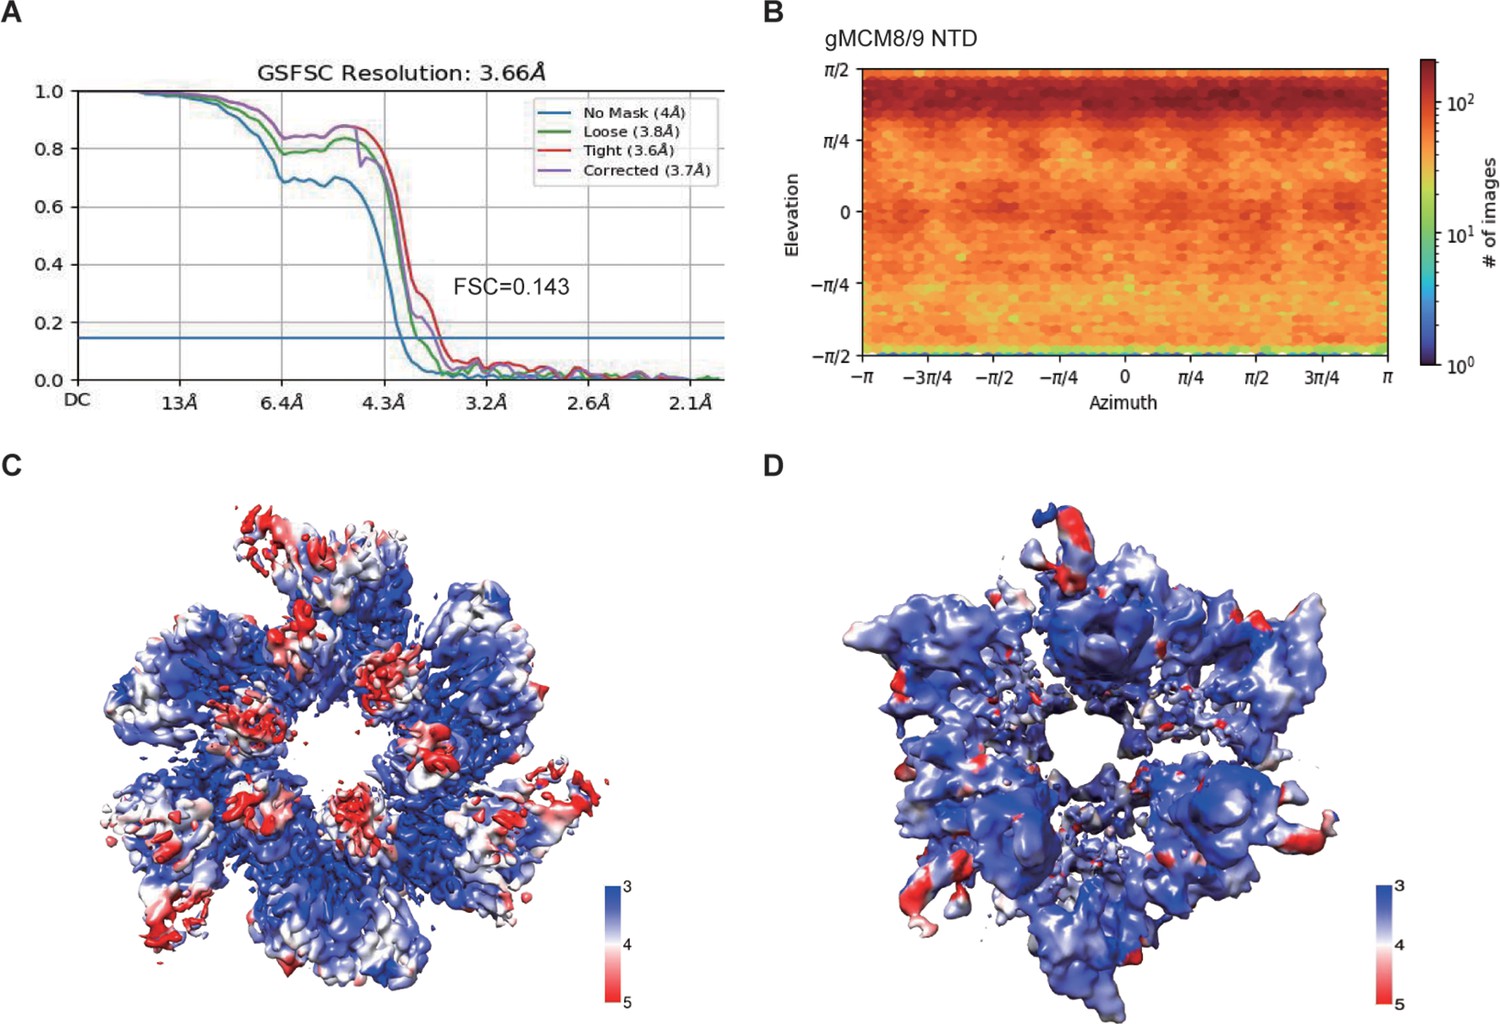
Resolution evaluation of the gMCM8/9 N-terminal domain (NTD) and C-terminal domain (CTD).
(A) Gold standard Fourier shell correlation (FSC) curve for the 3D refinement of the overall structure of the gMCM8/9 NTD. (B) Angular distribution of the particles used for the final reconstructions. (C) and (D) Local resolution distributions of gMCM8/9 NTD and gMCM8/9 CTD.
Figure 1—figure supplement 2
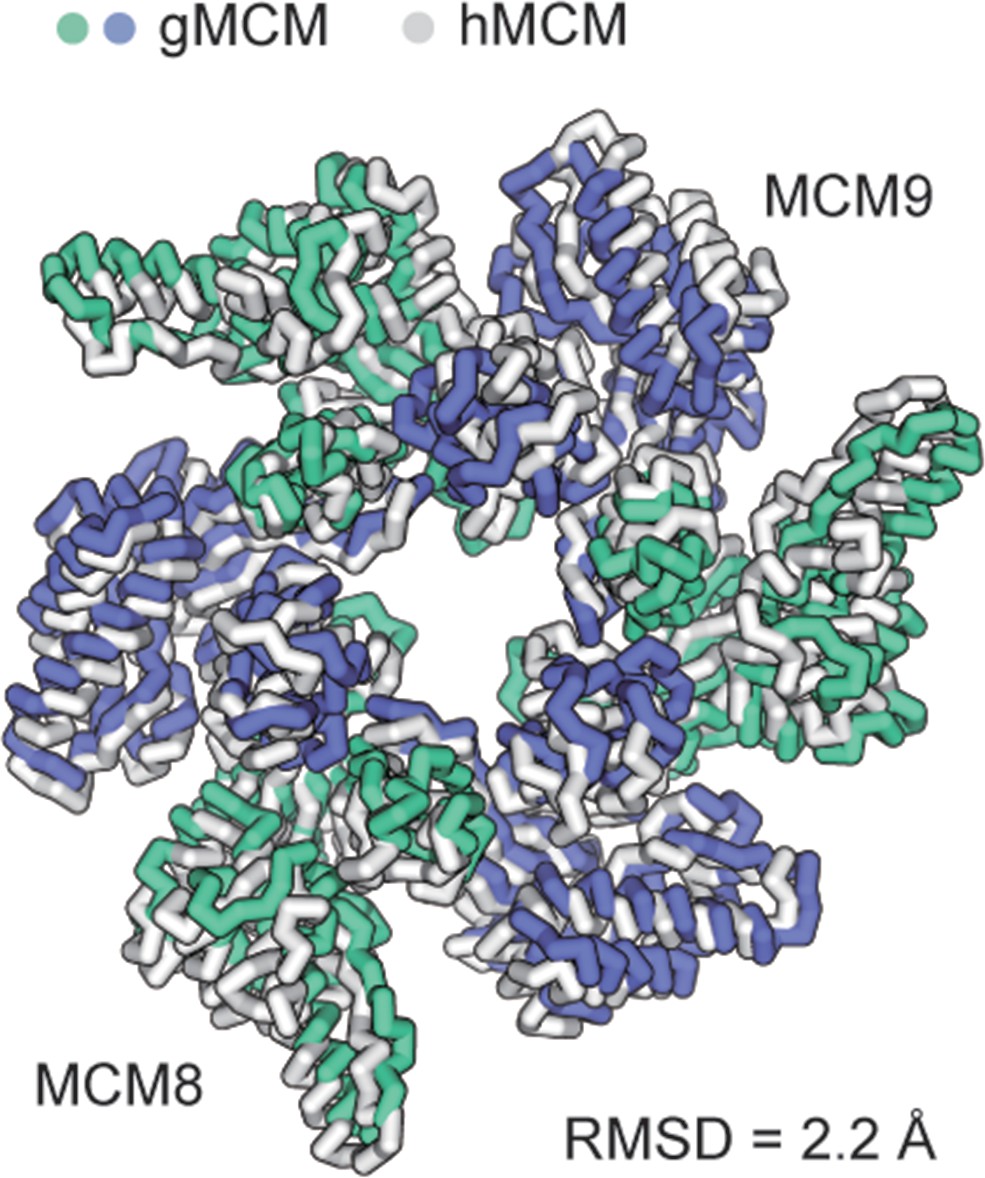
Structural superposition of the N-terminal domains (NTDs) of gMCM8/9 and hMCM8/9.
The overall root mean square deviation (RMSD) (2.2 Å) was listed below the structures. The structures were shown as ribbons. gMCM8/9, green cyan and slate; hMCM8/9, gray.
Figure 1—figure supplement 3
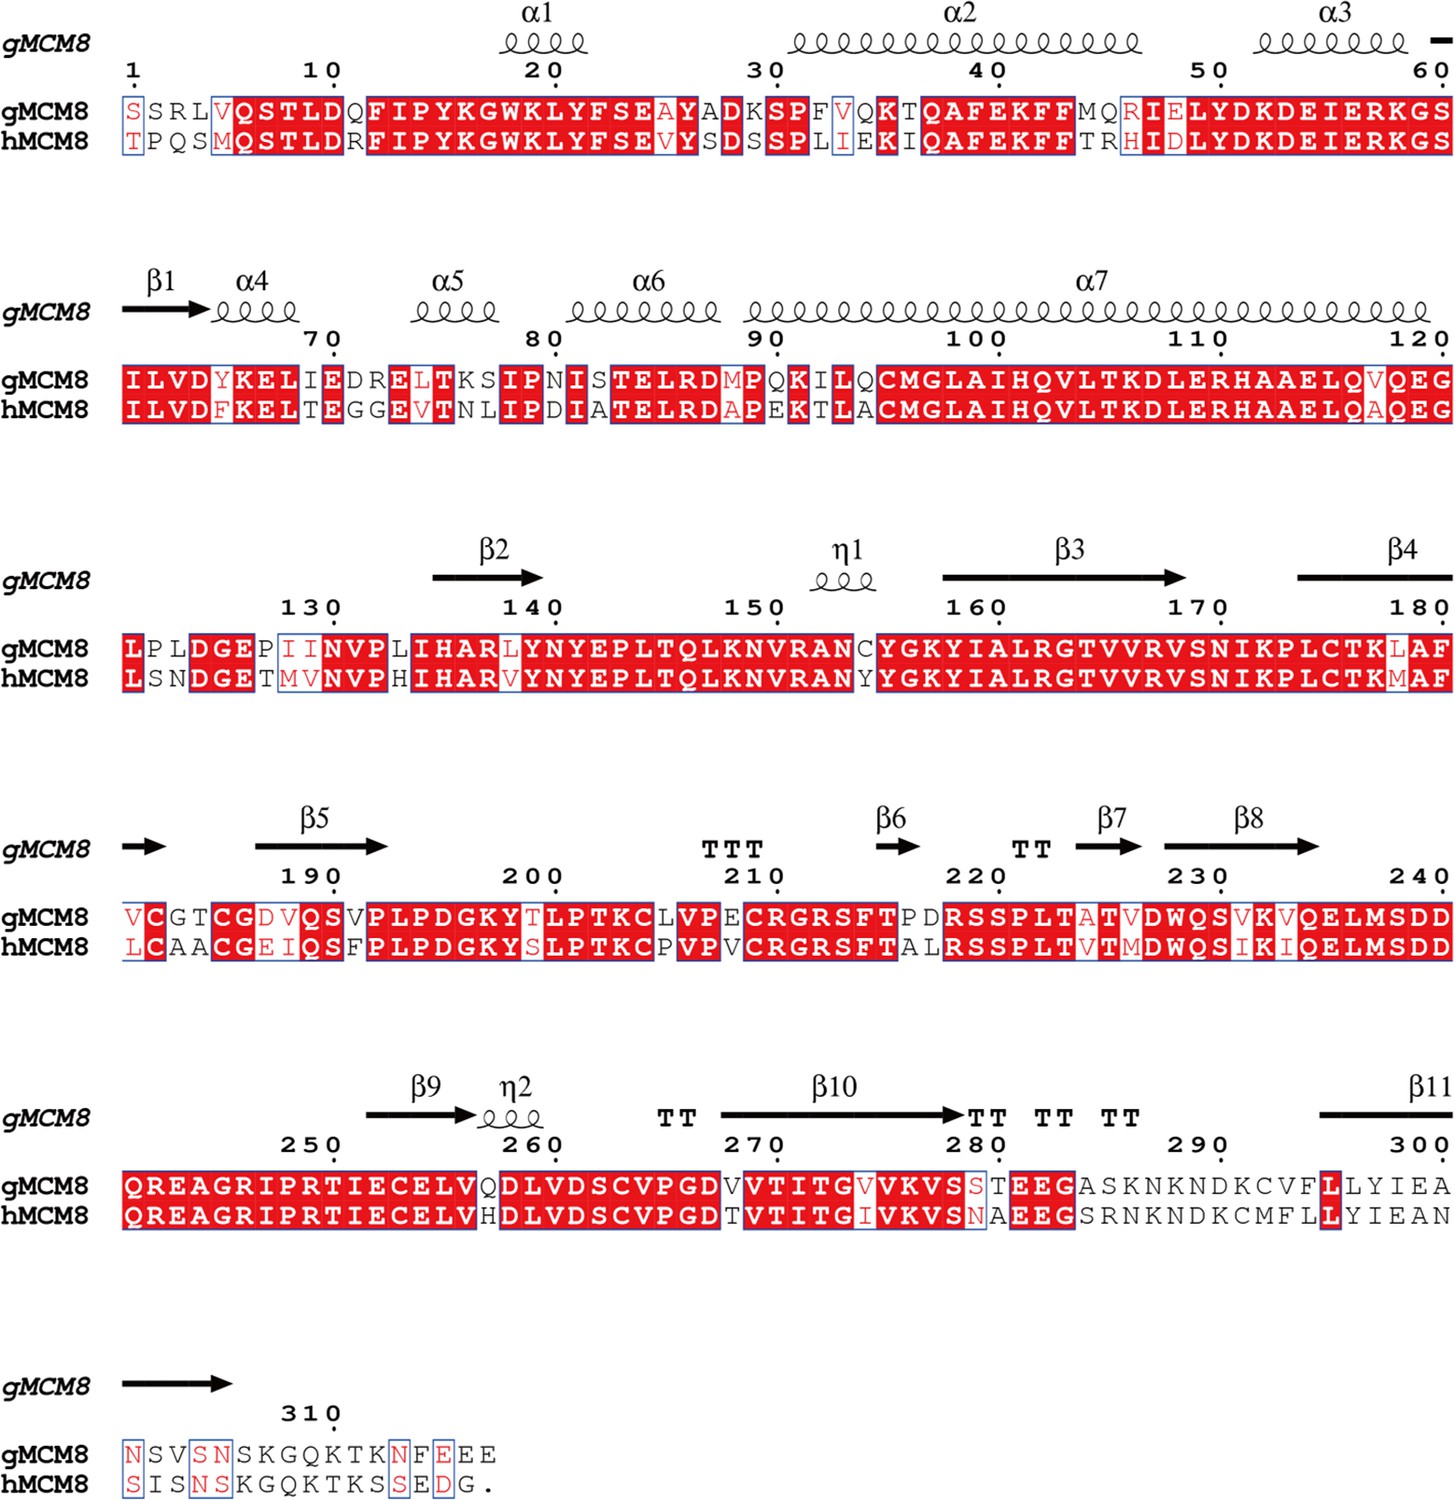
Sequence alignments of N-terminal domains (NTDs) of gMCM8 and hMCM8.
The secondary structures were shown above the sequences and the highly conserved residues were highlighted in red color. h, human; g, chicken (Gallus gallus).
Figure 1—figure supplement 4
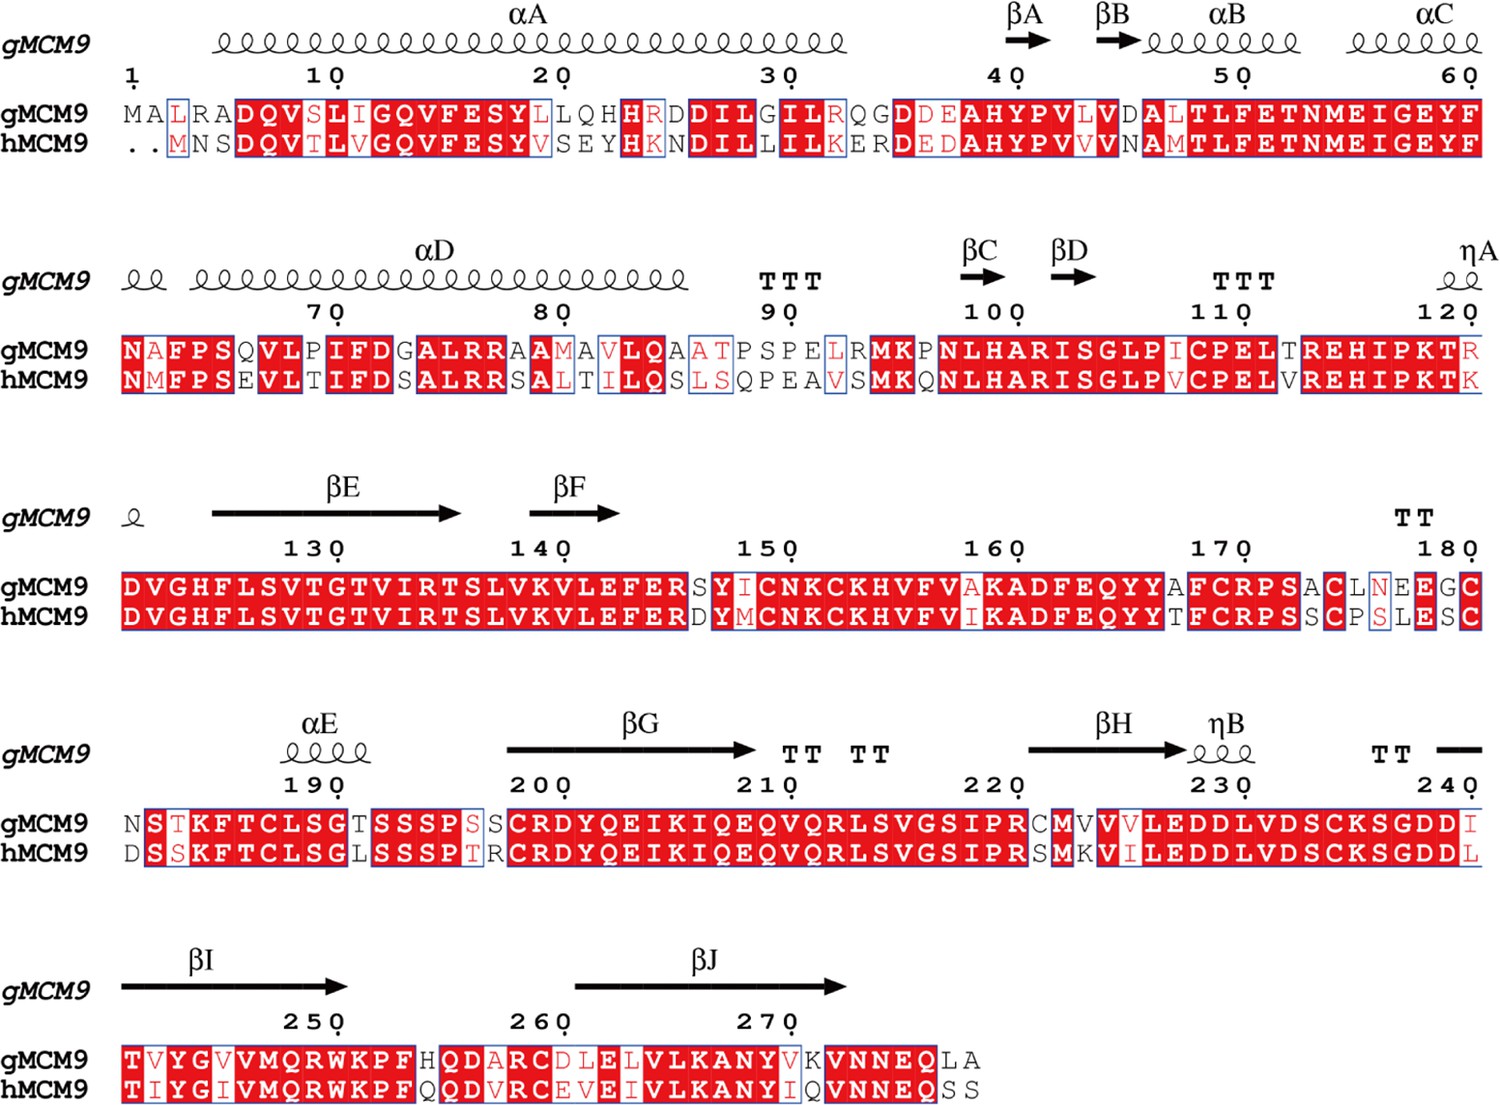
Sequence alignments of N-terminal domains (NTDs) of gMCM9 and hMCM9.
The secondary structures were shown above the sequences and the highly conserved residues were highlighted in red color. h, human; g, chicken (Gallus gallus).
Figure 1—figure supplement 5
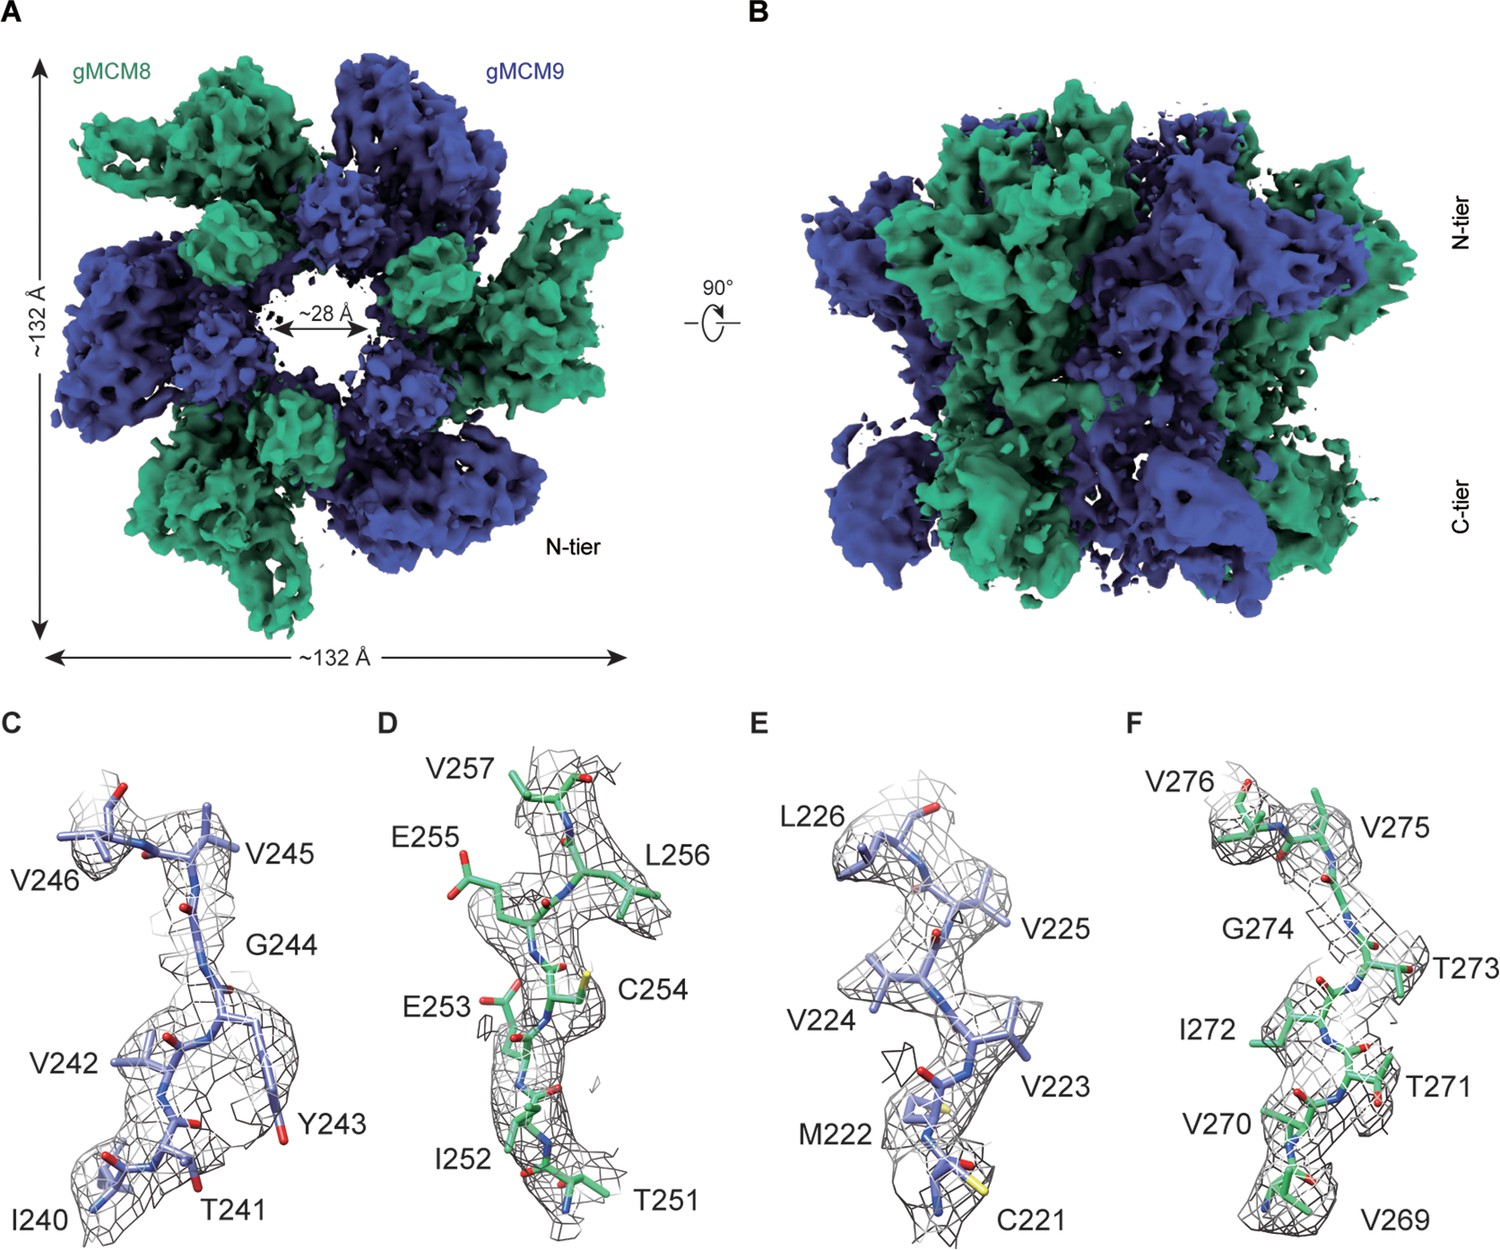
The cryo-electron microscopy (cryo-EM) structure of gMCM8/9.
(A and B) Reconstructed cryo-EM map of gMCM8/9. The diameter of the inner channel of MCM8/9 was measured at ~28 Å. (C–F) Representative regions of the cryo-EM structure of gMCM8/9 N-terminal domain (NTD) are shown based on their density map. (C), chain A (MCM9);(D), chain B (MCM8); (E), chain C (MCM9); (F), chain D (MCM8).
Figure 1—figure supplement 6
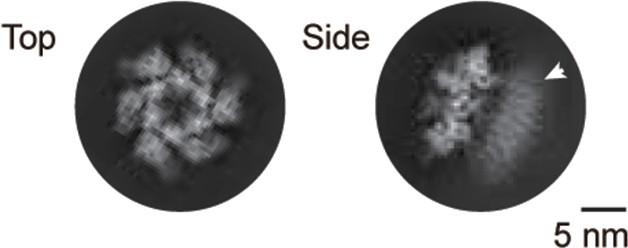
Selected 2D classes of gMCM8/9 showing its typical top and side views.
The white triangle marks the blurry C-tier ring of gMCM8/9.
Figure 1—figure supplement 7
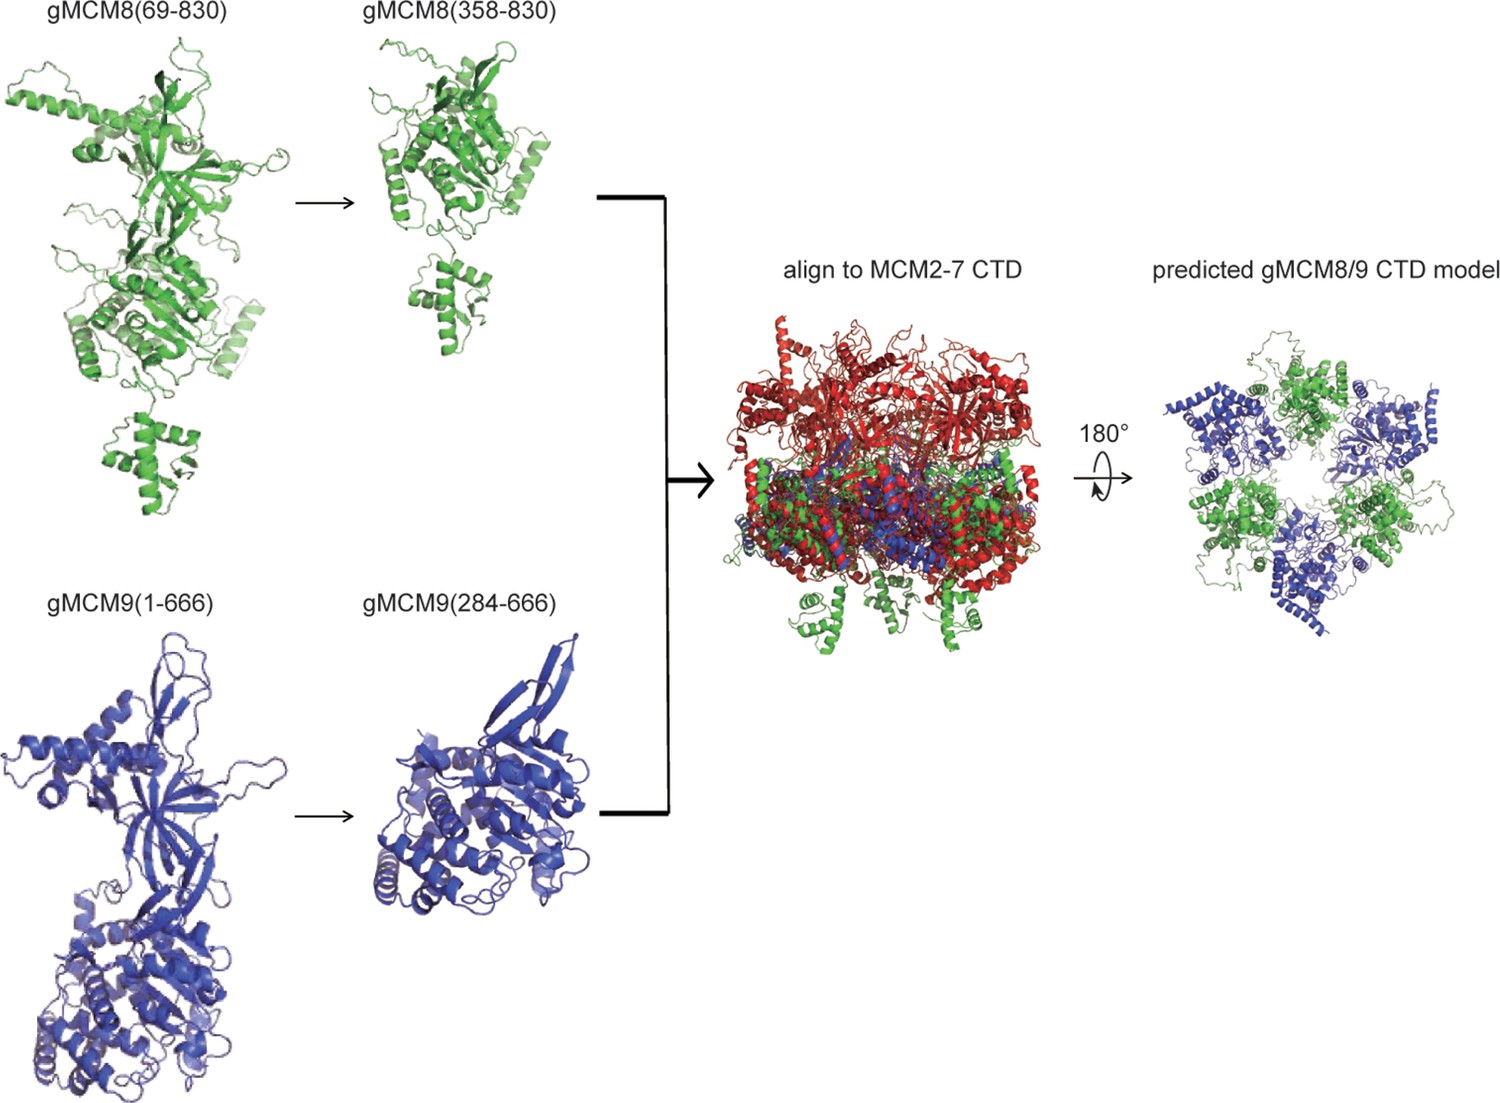
The predicted model uses as a reference for the morphing map of the gMCM8/9 C-terminal domain (CTD).
The structures of gMCM8 and gMCM9 were predicted using AlphaFold. Their CTD was extracted and aligned to MCM2-7 (PDB: 3JA8) by applying C3 symmetry.
Figure 1—figure supplement 8
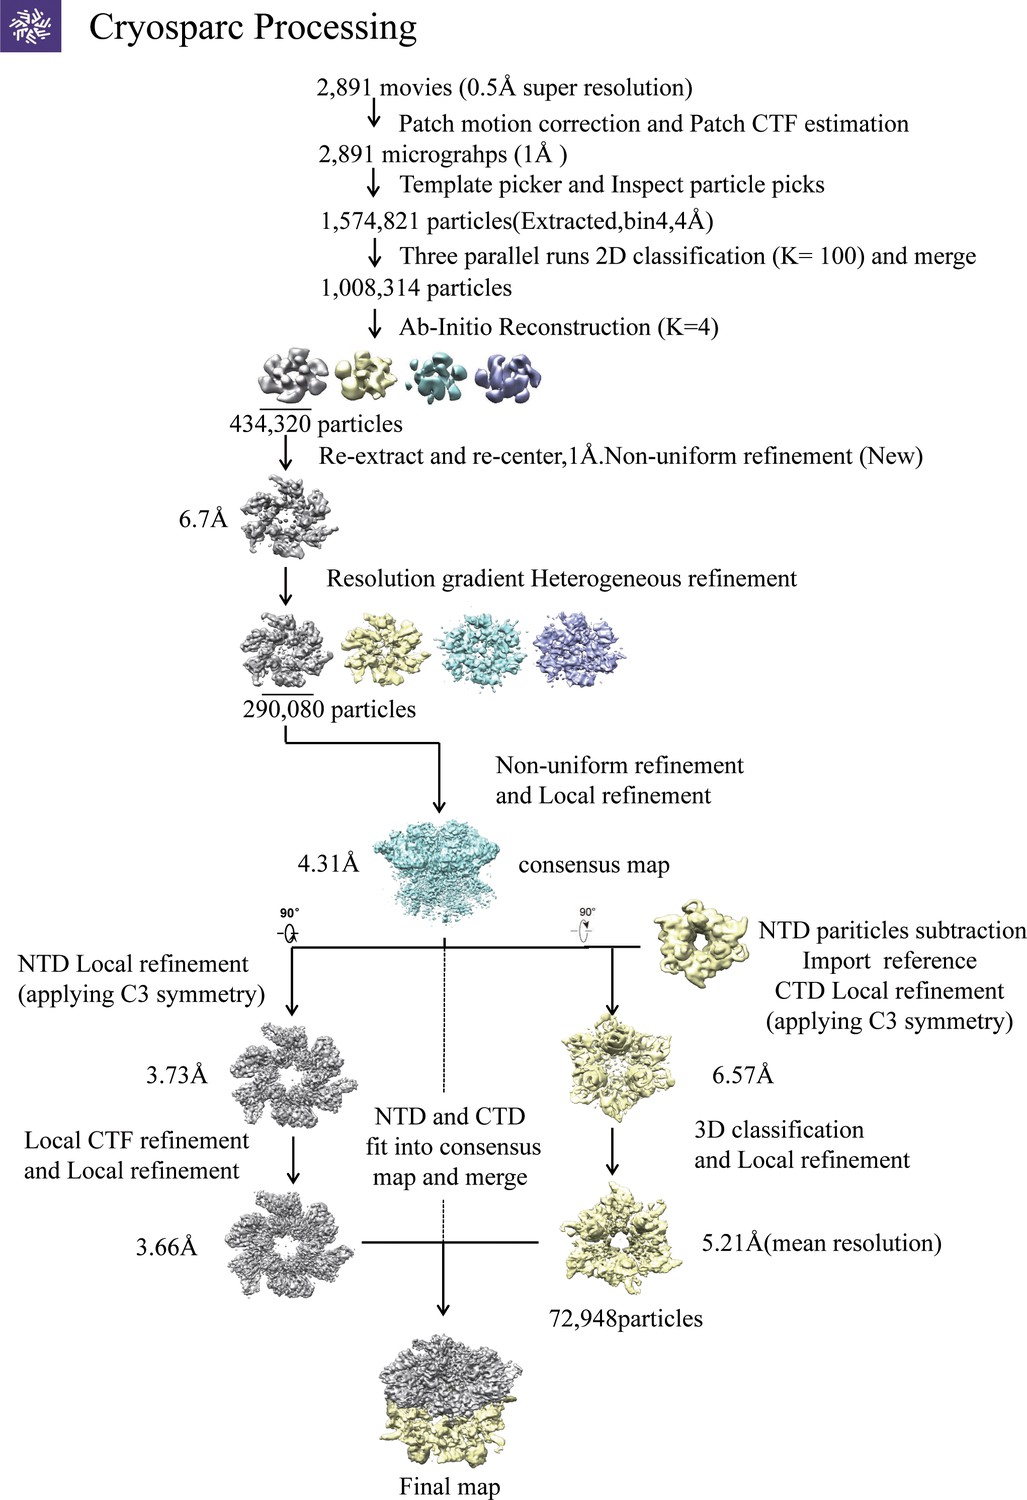
The image processing and 3D reconstruction steps of the gMCM8/9 complex using cryoSPARC.
Figure 1—figure supplement 9
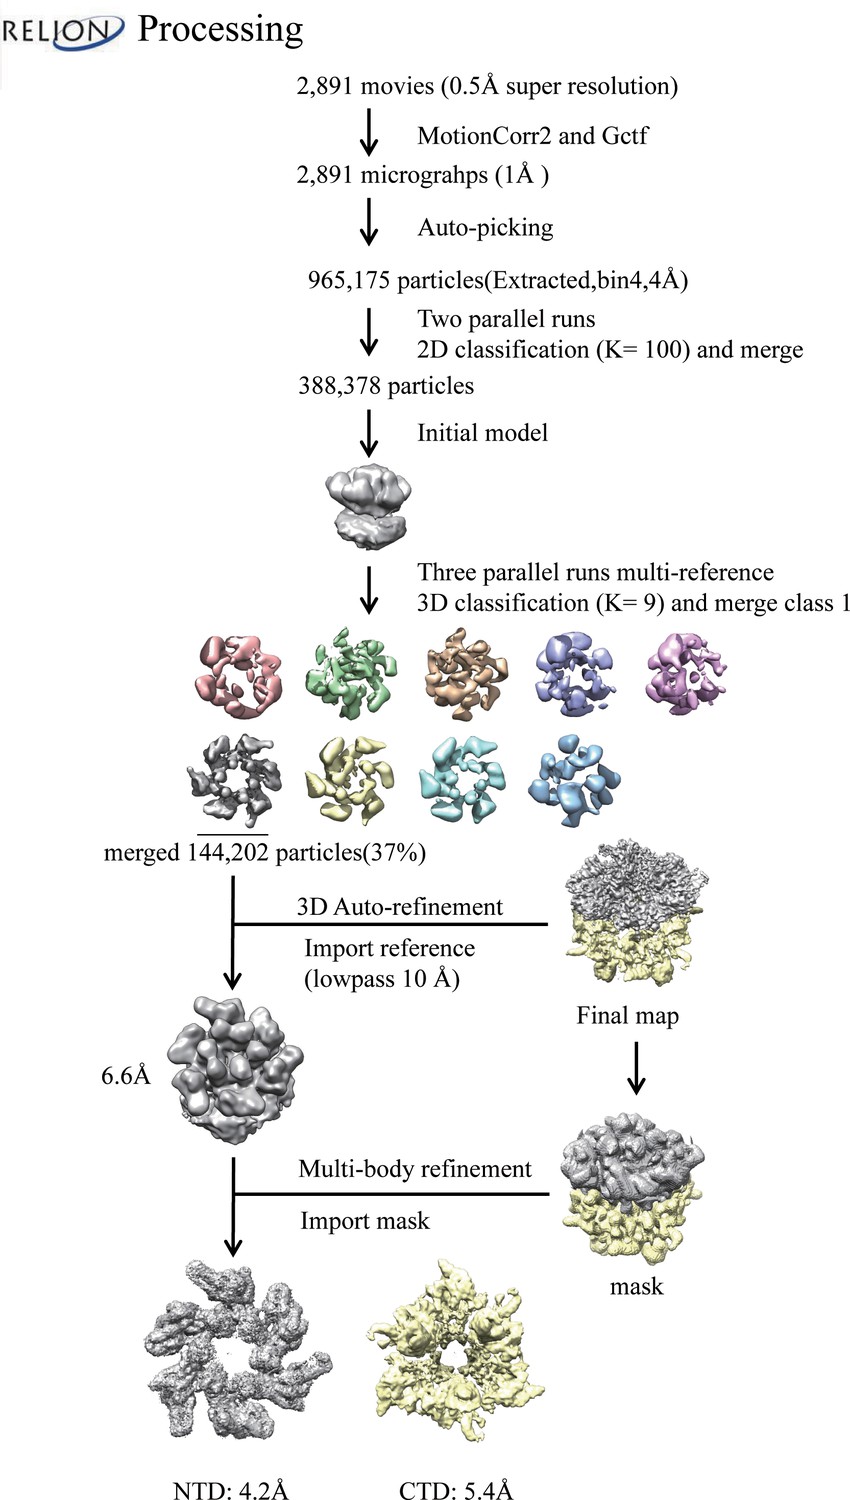
The image processing and 3D reconstruction steps of the gMCM8/9 complex using RELION-3.1.1.
Figure 2 with 1 supplement
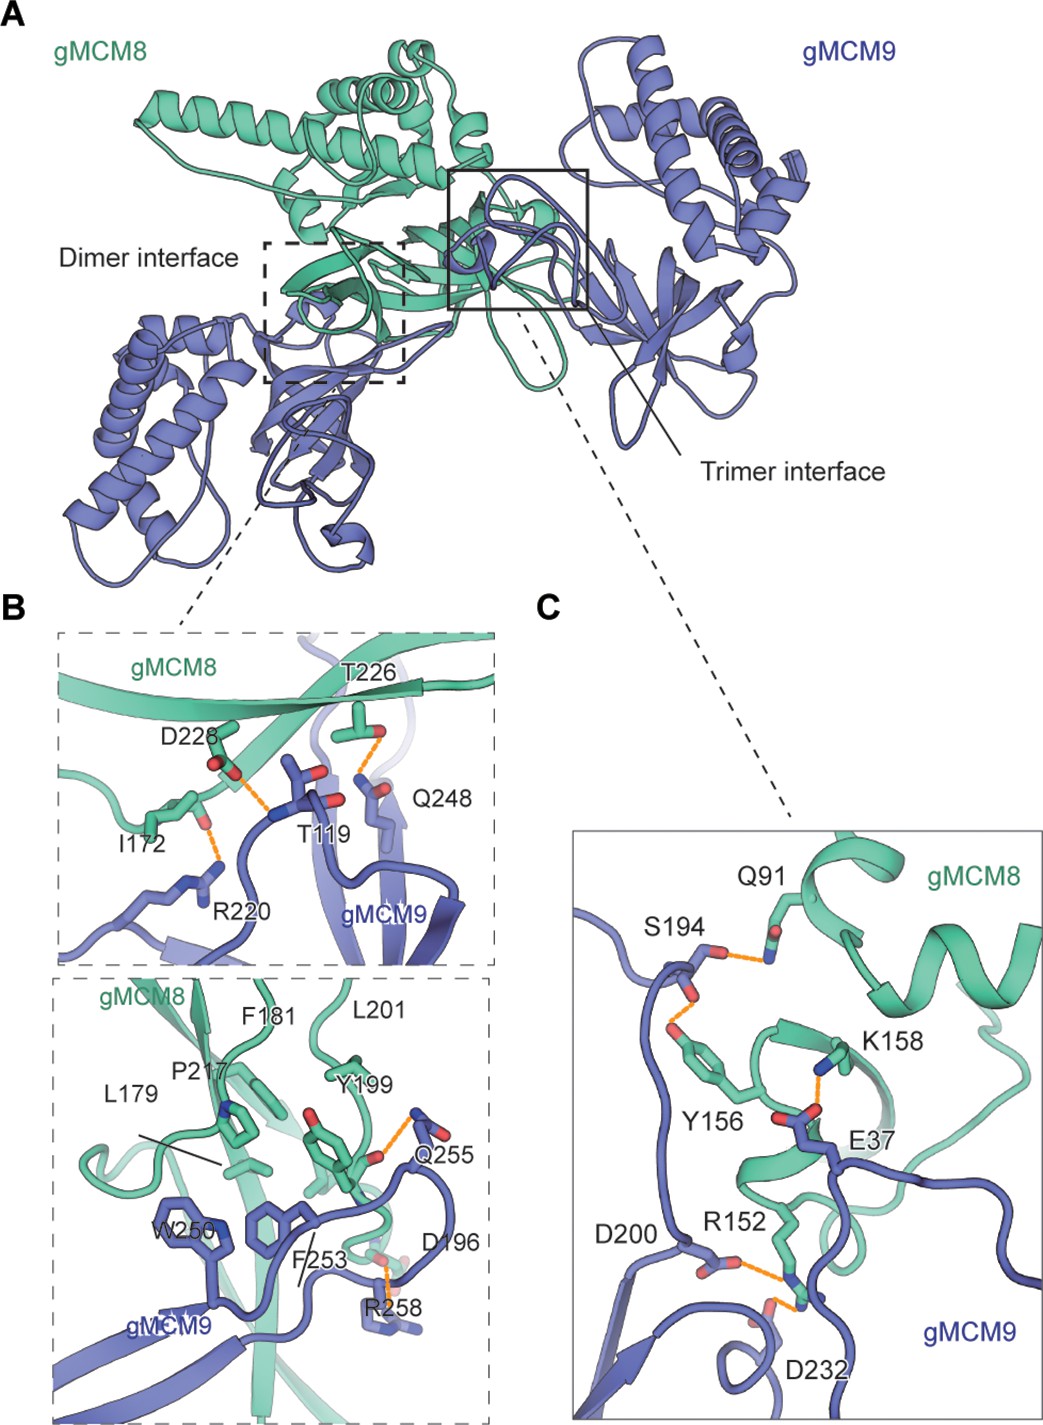
The assembly analysis of the gMCM8/9 N-terminal domain (NTD) ring.
(A) The cutoff structure of the gMCM8/9 NTD presents in the cartoon. The dimer interface and trimer interface were indicated by boxes with dotted lines and solid lines, respectively. (B, C) The dimer interface (B) and trimer interface (C) were mediated by hydrophobic interaction and polar interactions. The interaction details between gMCM8 and gMCM9 in two interfaces are shown in stereo view.
Figure 2—figure supplement 1
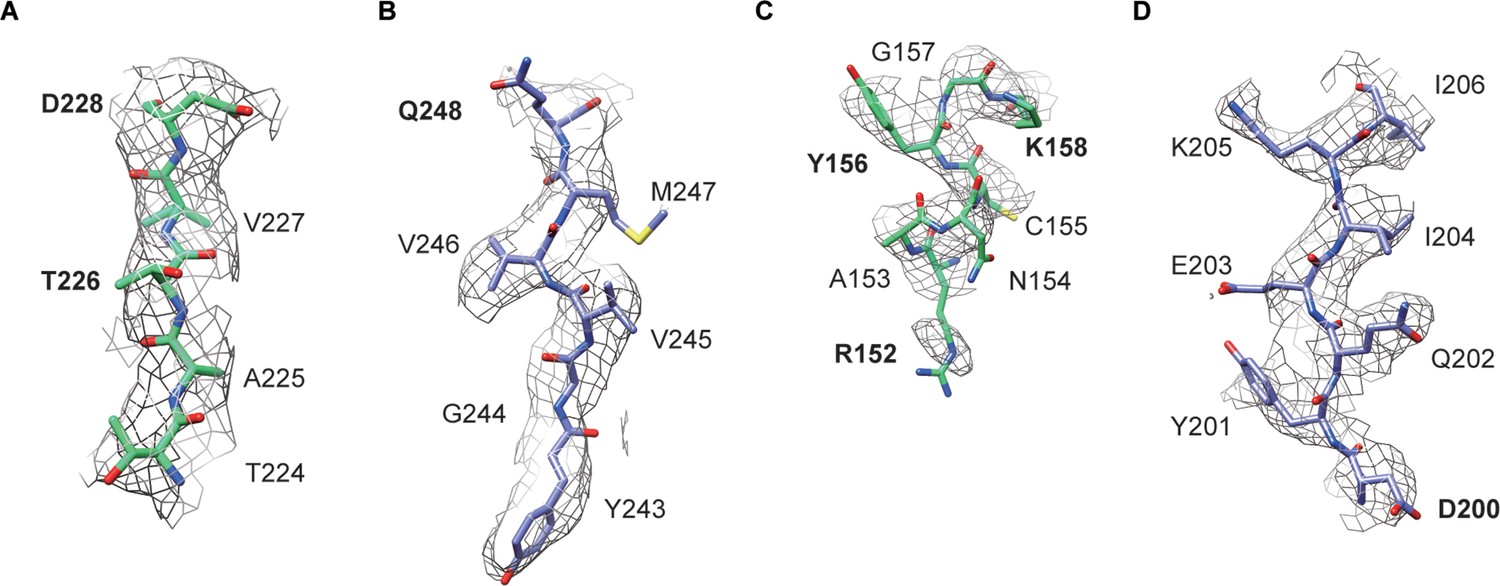
Representative regions of the cryo-electron microscopy (cryo-EM) structure of gMCM8/9 N-terminal domain (NTD).
Figure 3
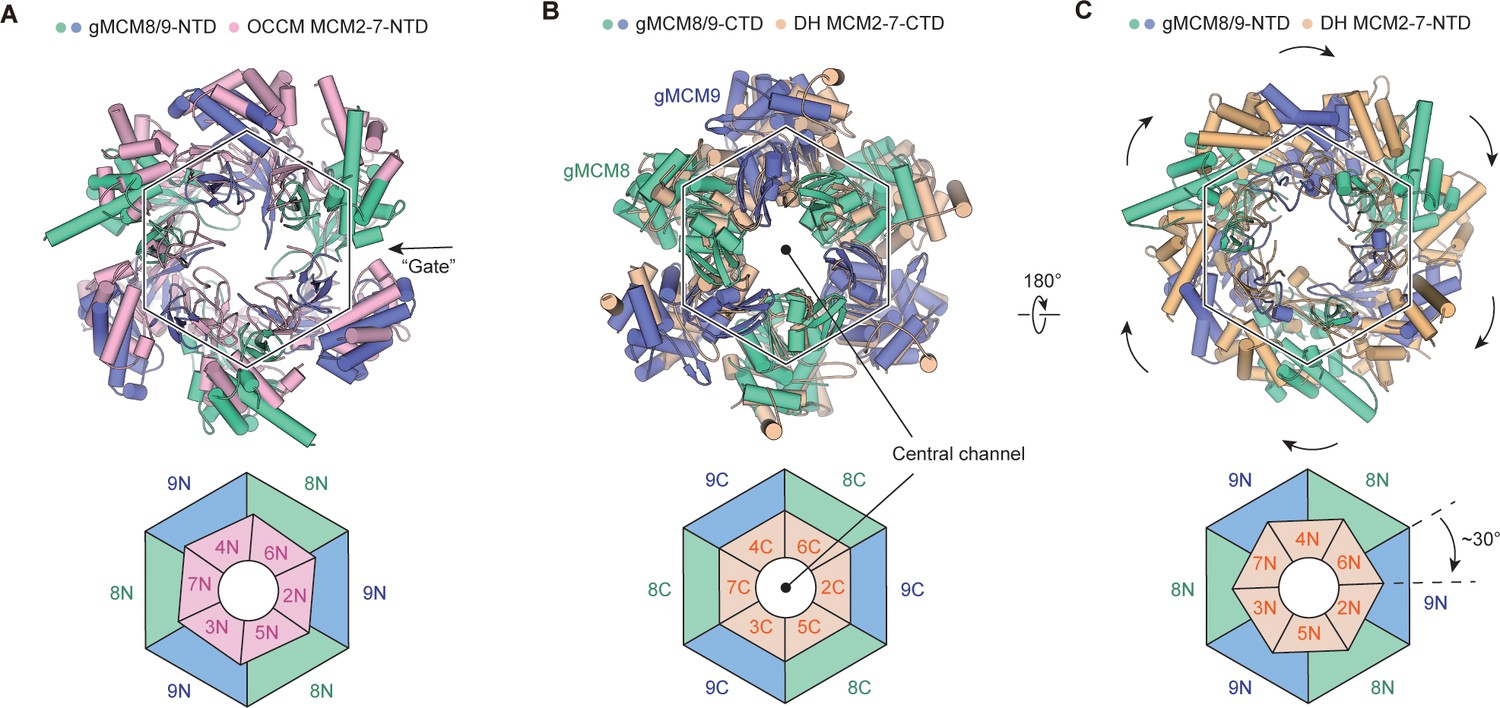
Structural comparison of gMCM8/9 with MCM2-7-containing intermediates.
(A) The gMCM8/9 hexamer (green cyan and slate) was aligned to the MCM2-7 hexamer (light pink) from the Orc-Cdc6-Cdt1-MCM2-7 (OCCM) complex. The N-tier rings comparison are presented here with a slight rotation beginning at MCM5-MCM2 ’Gate’ and the following MCM6 and MCM4. The ‘Gate’ was indicated by the black arrow. (B, C) Structural superposition of the gMCM8/9 hexamer to the MCM2-7 double hexamer (wheat) by aligning their respective C-tier ring. The bottom view (B) and top view (C) are shown respectively. Note the ~30° clockwise rotation of the gMCM8/9 N-tier ring compared to that of MCM2-7.
Figure 4 with 2 supplements
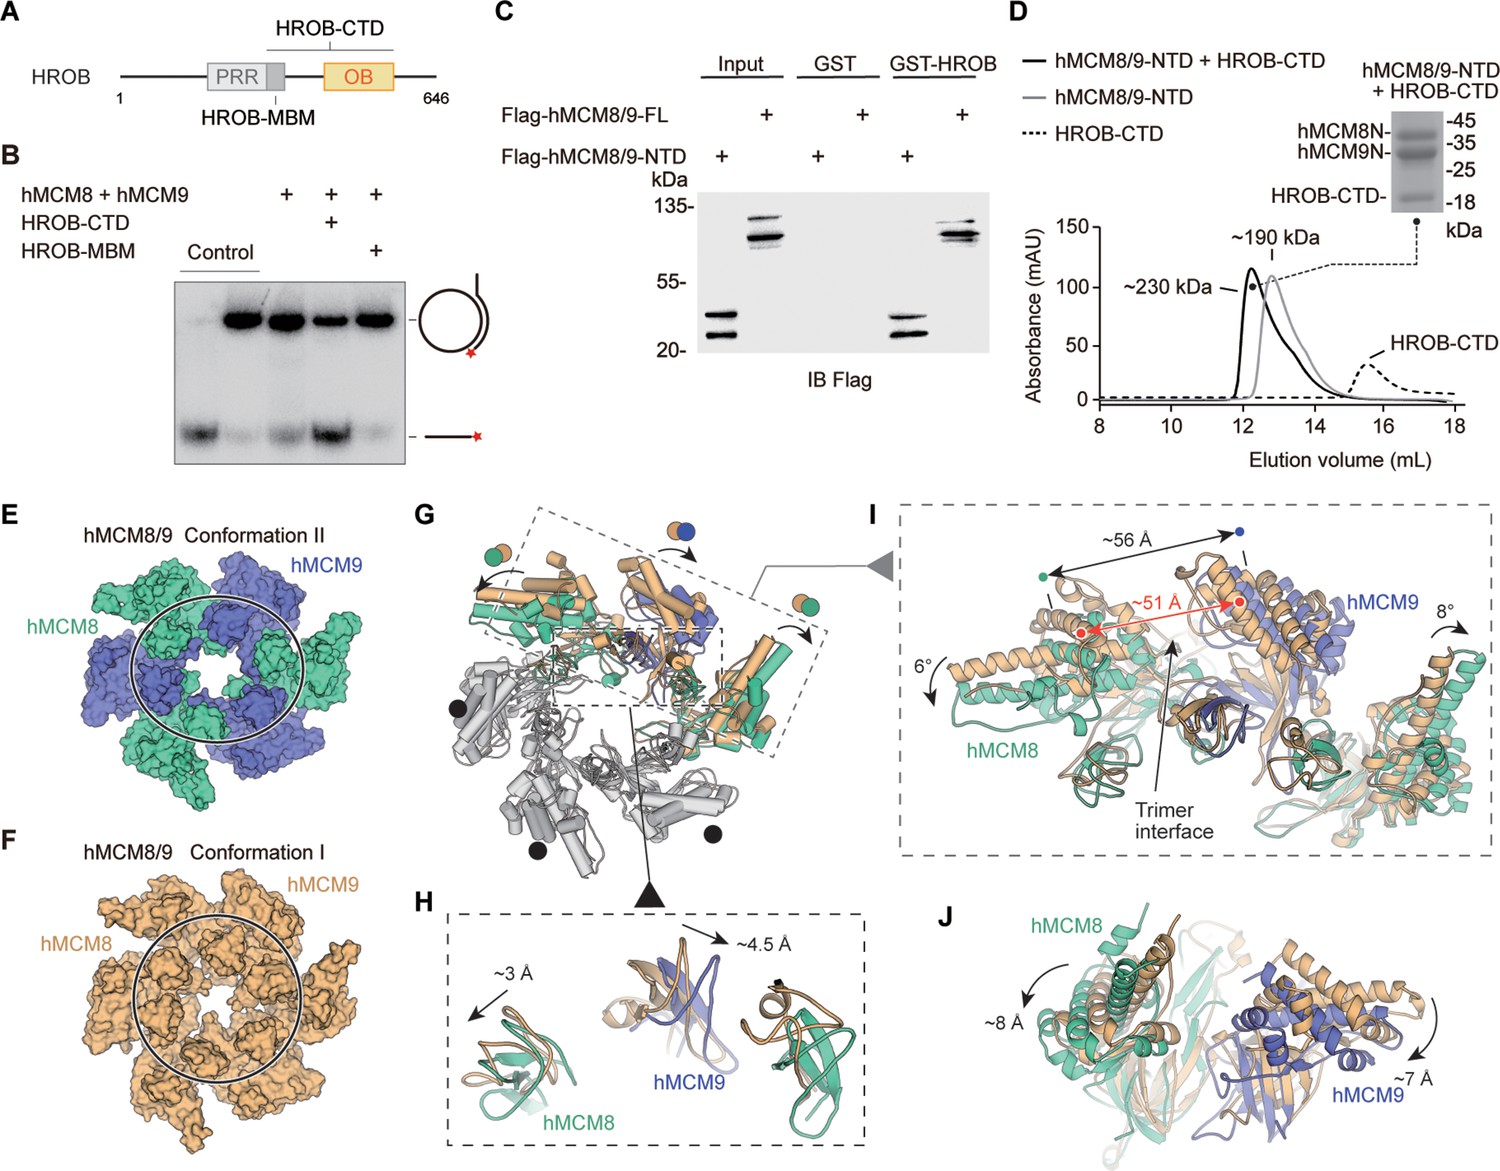
HROB induces conformational change of hMCM8/9 complex.
(A) Domain organization of human HROB. PRR, proline-rich region, gray; MBM, MCM8/9 binding motif, dark gray; OB, OB-fold domain, yellow. The HROB-CTD consisting of the HROB-MBM and oligosaccharide/oligonucleotide domain (OB) is indicated. (B) The OB domain is required for MCM8/9 helicase in DNA unwinding. Representative autoradiograph of the DNA unwinding reaction was conducted using a 32P-labeled ssDNA oligo annealed to the M13mp18 as DNA substrate in the presence of HROB-MBM or HROB-CTD with purified hMCM8/9. Control, DNA substrate without proteins. (C) HROB-CTD interacts with MCM8/9-NTD. Detection by western blot of MCM8/9-FL or MCM8/9-NTD co-precipitated by bead-bound GST or GST-HROB. (D) The diagram of gel filtration shows the co-purified protein complex of HROB-CTD and MCM8/9-NTD. Their complex is also indicated in SDS-PAGE. (E) Reconstructed cryo-EM map of MCM8/9 NTD ring in Conformation II. MCM8, green cyan; MCM9, slate. The shape of the channel is oval. (F) The structure of hMCM8/9-NTD from the previous study. MCM8/9, orange. (G–J) Structural superposition of the hMCM8/9-NTD in Conformation I and Conformation II. The translations of the Zinc fingers were shown in (H). The ~5 Å expansion of the trimer interface of hMCM8/9-NTD in Conformation II was shown in (I). The shift distance and angles of the MCM8/9 heterodimer were also shown in (I) and (J), respectively.
-
Figure 4—source data 1
The oligosaccharide/oligonucleotide (OB) domain is required for MCM8/9 helicase in DNA unwinding.
Representative autoradiograph of the DNA unwinding reaction was conducted using a 32P-labeled ssDNA oligo annealed to the M13mp18 as DNA substrate in the presence of HROB-MBM or HROB-CTD with purified hMCM8/9. Control, DNA substrate without proteins.
- https://cdn.elifesciences.org/articles/87468/elife-87468-fig4-data1-v1.zip
-
Figure 4—source data 2
HROB-CTD interacts with MCM8/9-NTD.
Detection by western blot of MCM8/9-FL or MCM8/9-NTD co-precipitated by bead-bound GST or GST-HROB.
- https://cdn.elifesciences.org/articles/87468/elife-87468-fig4-data2-v1.zip
Figure 4—figure supplement 1
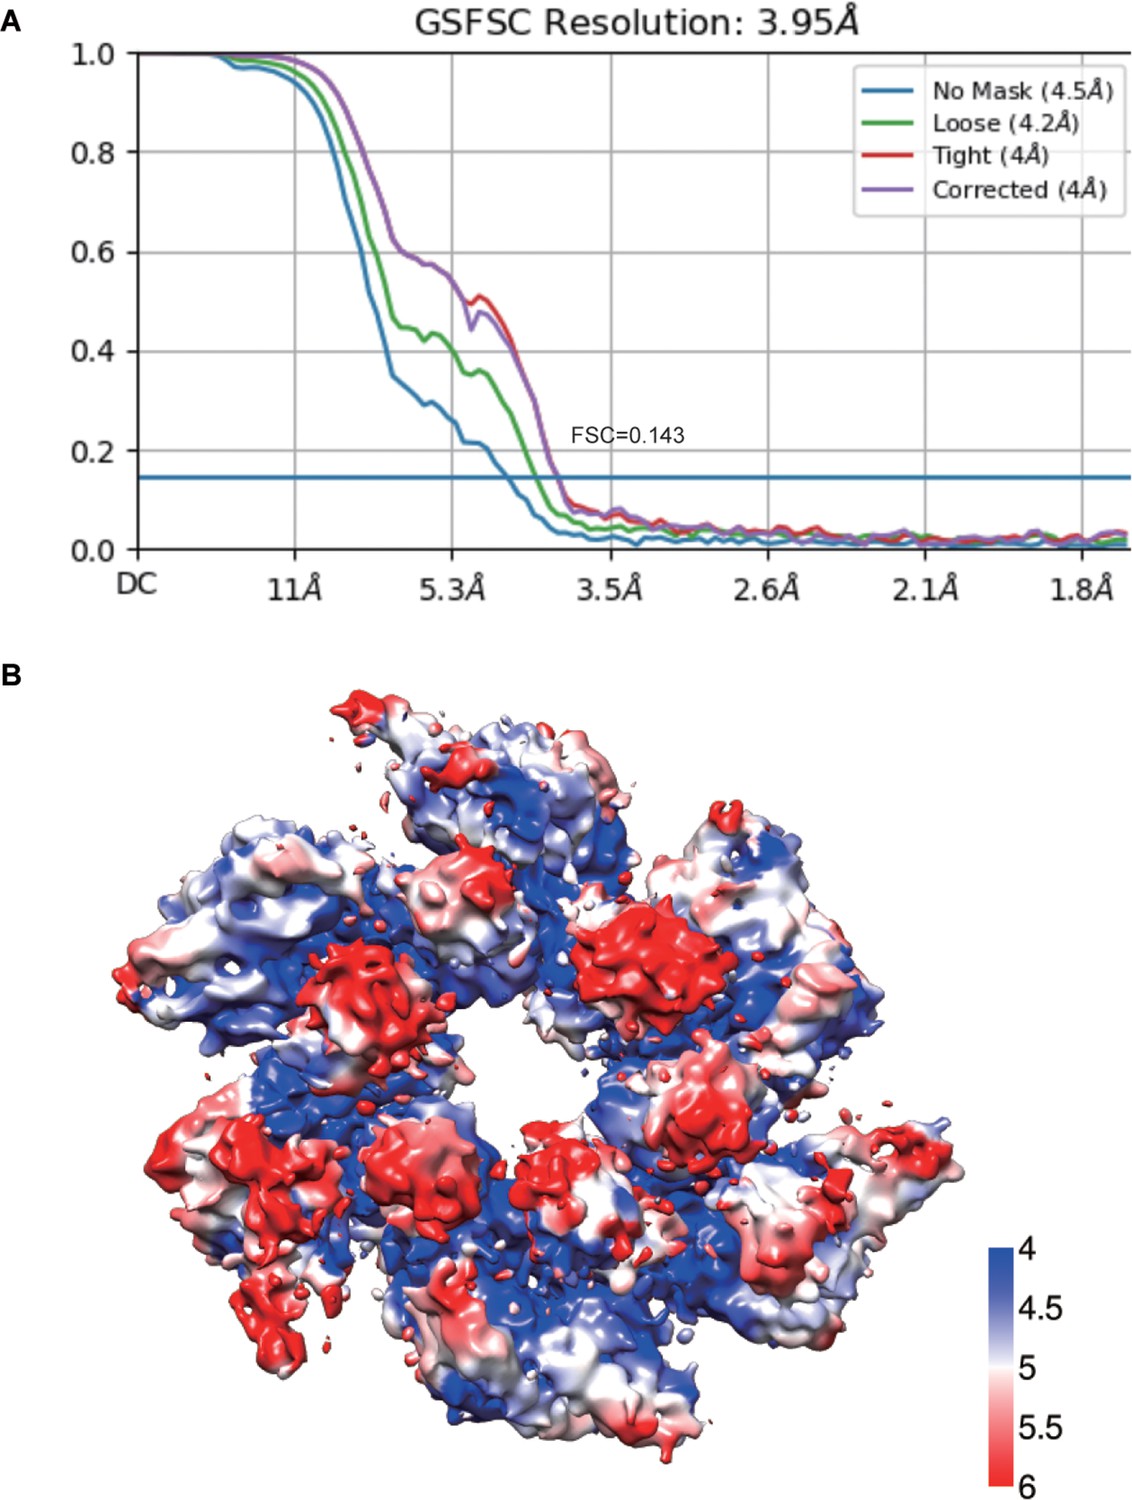
Resolution evaluation of the hMCM8/9 NTD Conformation II.
(A) Gold standard Fourier shell correlation (FSC) curve for the 3D refinement of the overall structure of the hMCM8/9 N-terminal domain (NTD). (B) Local resolution distributions of hMCM8/9 NTD.
Figure 4—figure supplement 2
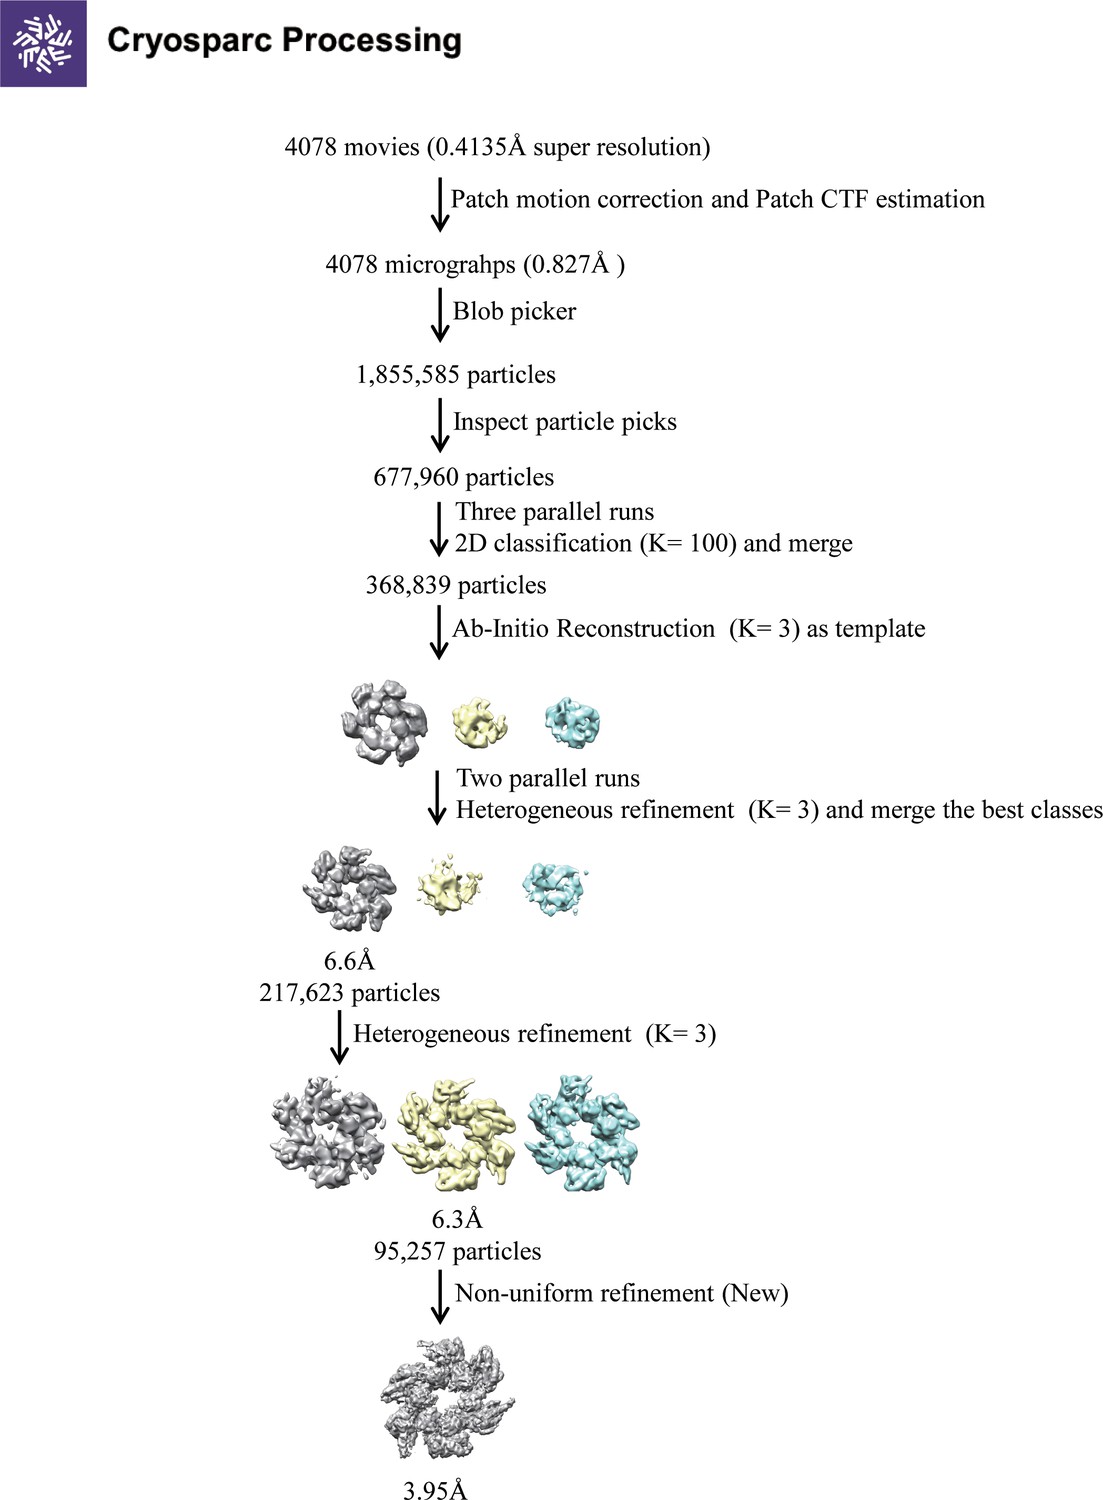
The image processing and 3D reconstruction steps of the N-terminal domain (NTD) ring of hMCM8/9 Conformation II using cryoSPARC.
Figure 5 with 1 supplement
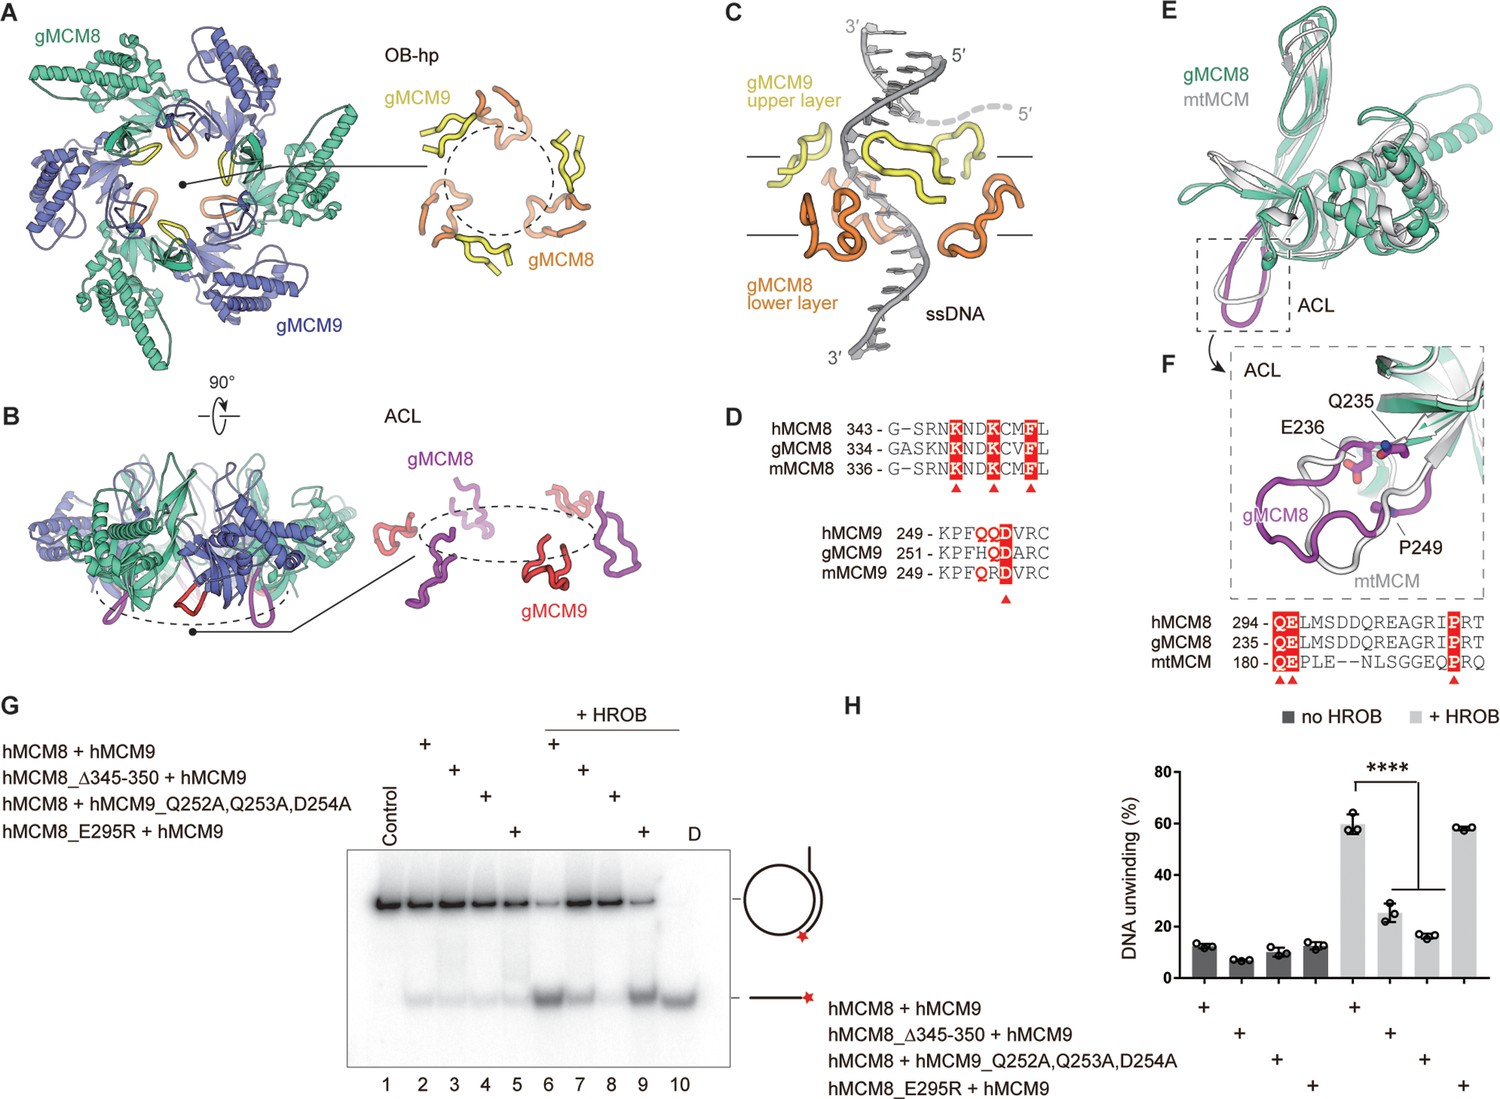
The spatial distribution of OB-fold hairpins and their functional roles in DNA unwinding.
(A, B) Top and side views of the structure of the gMCM8/9 NTD ring. OB hairpins (OB-hps) of gMCM8 and gMCM9 are highlighted in orange and yellow, respectively (A); Allosteric communication loops (ACLs) are highlighted in purple and red as indicated (B). (C) Contacts between OB-hps and forked DNA are illustrated by fitting a forked DNA fragment into the hexameric gMCM8/9 central channel. While encircling the DNA, the OB-hps of the gMCM9 form the upper layer and that of gMCM8 constitute the lower layer. (D) Sequence alignments of the OB-hps of MCM8 and MCM9 from different species. h, human; m, mouse; g, chicken (Gallus gallus). The highly conserved residues are labeled with red triangles. (E, F) Structure superposition of the gMCM8 NTD/mtMCM NTD (gMCM8, green cyan; mtMCM, PDB: 1LTL, gray). The ACL is highlighted by purple (gMCM8) (E). Structure-based alignment of minichromosome maintenance (MCM) from different species is shown below the structures and key residues are labeled with red triangles (F). (G) Representative autoradiograph of the DNA unwinding reaction was conducted using a 32P-labeled ssDNA oligo annealed to the M13mp18 as DNA substrate in the presence of HROB with purified MCM8/9 or mutants as indicated. (H) Graphical representation of the percentage of DNA unwinding in reactions conducted as in (G). The mean ± SD of three independent experiments is presented. Statistical analysis was conducted using one-way ANOVA (**p<0.01, ***p<0.001).
-
Figure 5—source data 1
The helicase activities of MCM8/9 OB loop mutants.
Representative autoradiograph of the DNA unwinding reaction was conducted using a 32P-labeled ssDNA oligo annealed to the M13mp18 as DNA substrate in the presence of HROB with purified MCM8/9 or mutants as indicated. The assays were repeated at least three times.
- https://cdn.elifesciences.org/articles/87468/elife-87468-fig5-data1-v1.zip
Figure 5—figure supplement 1
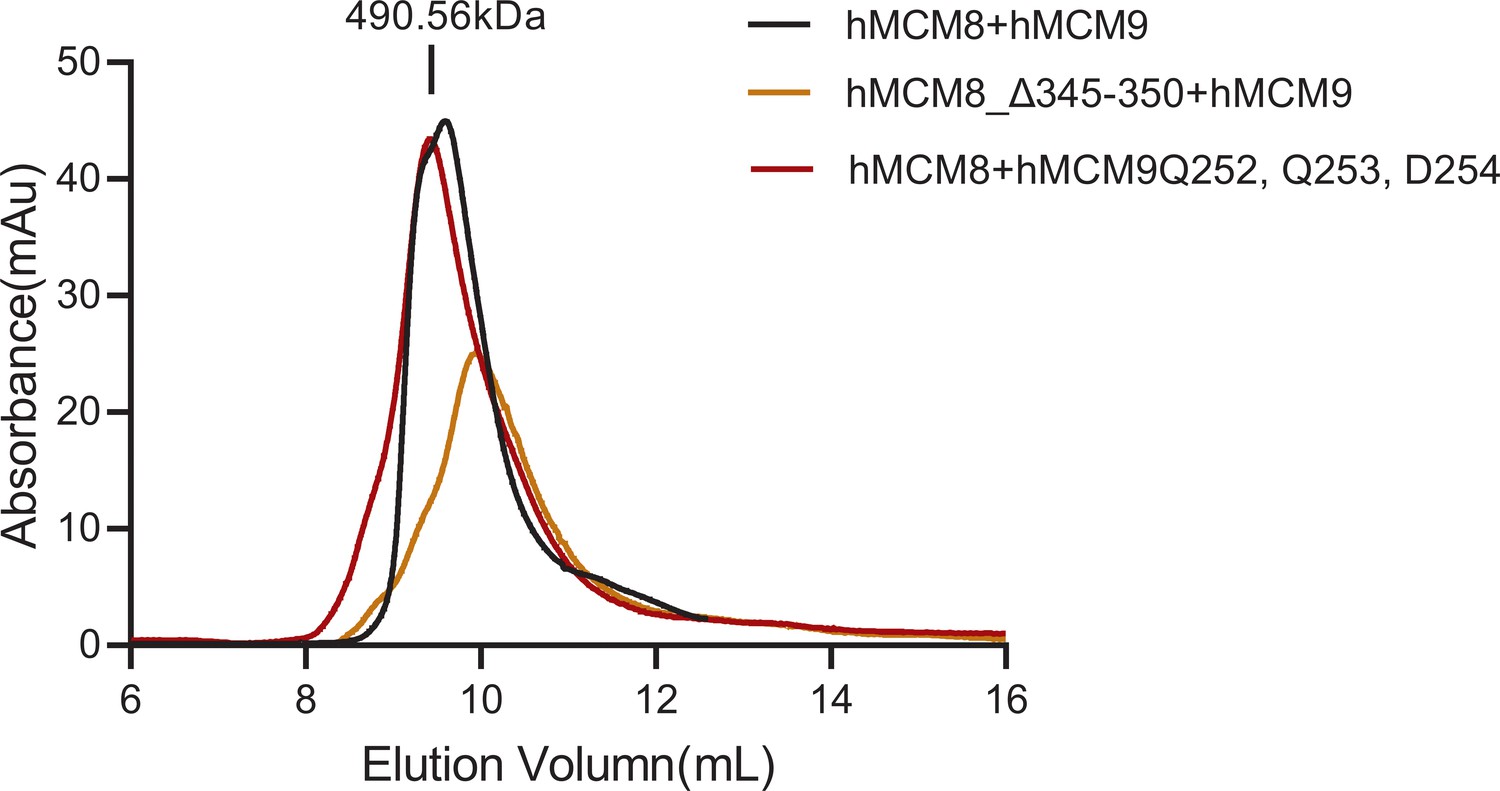
SEC profiles of wild-type (WT) and OB hairpins (OB-hps) mutants of MCM8/9 complex.
Figure 6 with 2 supplements
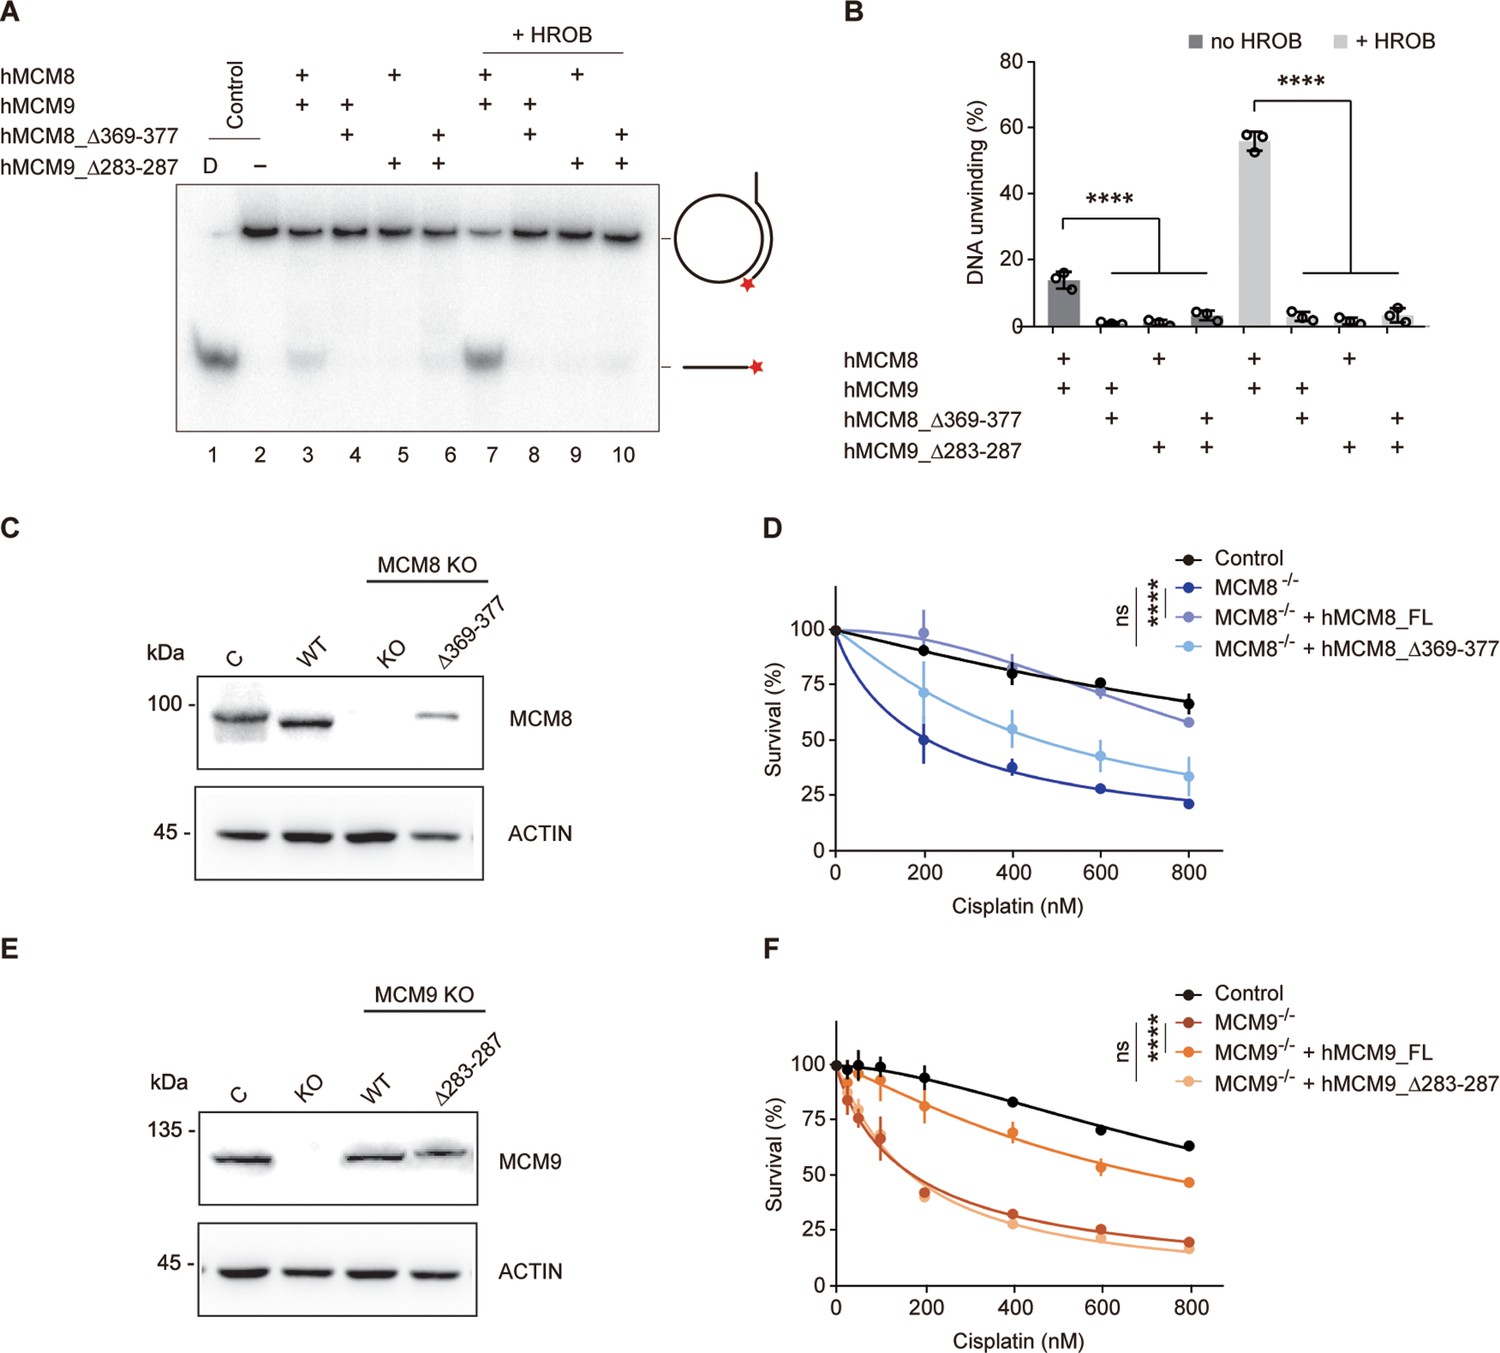
Analysis of the helicase activities and chemoresistance exhibited by the N-C linkers.
(A) Representative autoradiograph of the DNA unwinding reaction was conducted using a 32P-labeled ssDNA oligo annealed to the M13mp18 as DNA substrate in the presence or absence of HROB with purified MCM8/9, MCM8 N-C linker mutant (MCM8Δ369-377) or MCM9 N-C linker mutant (MCM9Δ283-287), either alone or in combination. D-boiled DNA substrate control. (B) Graphical representation of the percentage of DNA unwinding in reactions conducted as in (A). The mean ± SD of three independent experiments is presented. Statistical analysis was conducted using one-way ANOVA (****p<0.0001). (C) Western blot to detect MCM8 in DT40 control cells or in an MCM8 KO clone reconstituted with MCM8 WT or MCM8_Δ369–377 mutant. Actin is shown as a loading control. C, control cells; Δ369–377, MCM8_Δ369–377. (D) Survival analysis in DT40 control cell, MCM8 KO cell, or cells reconstituted with MCM8 WT or MCM8 N-C linker mutant upon treatment with cisplatin. Cell survival is expressed as a percentage of an untreated control. The mean ± SD of three independent experiments is presented. Statistical analysis was conducted on data points at four distinct cisplatin concentrations (200, 400, 600, 800 nM) using Student’s t-test (****p<0.0001, at all four concentrations analyzed). (E) Detection by western blot of MCM9 in DT40 control cells or in an MCM9 KO clone reconstituted with MCM9 WT or MCM9_Δ283–287 mutant. Actin is shown as a loading control. C, control cells; Δ283–287, MCM9_Δ283–287. (F) Survival analysis in DT40 control cell, MCM9 KO cell, or cells reconstituted with MCM9 WT, or MCM9 N-C linker mutant upon treatment with cisplatin. Cell survival is represented as in (D) and statistical analysis was conducted as in (D) (****p<0.0001, at all four concentrations analyzed).
-
Figure 6—source data 1
The helicase activities of MCM8/9 N-C linker mutants.
Representative autoradiograph of the DNA unwinding reaction was conducted using a 32P-labeled ssDNA oligo annealed to the M13mp18 as DNA substrate in the presence or absence of HROB with purified MCM8/9, MCM8 N-C linker mutant (MCM8Δ369-377) or MCM9 N-C linker mutant (MCM9Δ2283-287), either alone or in combination. D-boiled DNA substrate control. The assays were repeated at least three times.
- https://cdn.elifesciences.org/articles/87468/elife-87468-fig6-data1-v1.zip
-
Figure 6—source data 2
Western blot to detect MCM8 or MCM9 in DT40 control cells or in an MCM8/MCM9 KO clone.
Actin is shown as a loading control. C, control cells; Δ369–377, MCM8_Δ369–377; Δ283–287, MCM9_Δ283–287.
- https://cdn.elifesciences.org/articles/87468/elife-87468-fig6-data2-v1.zip
Figure 6—figure supplement 1
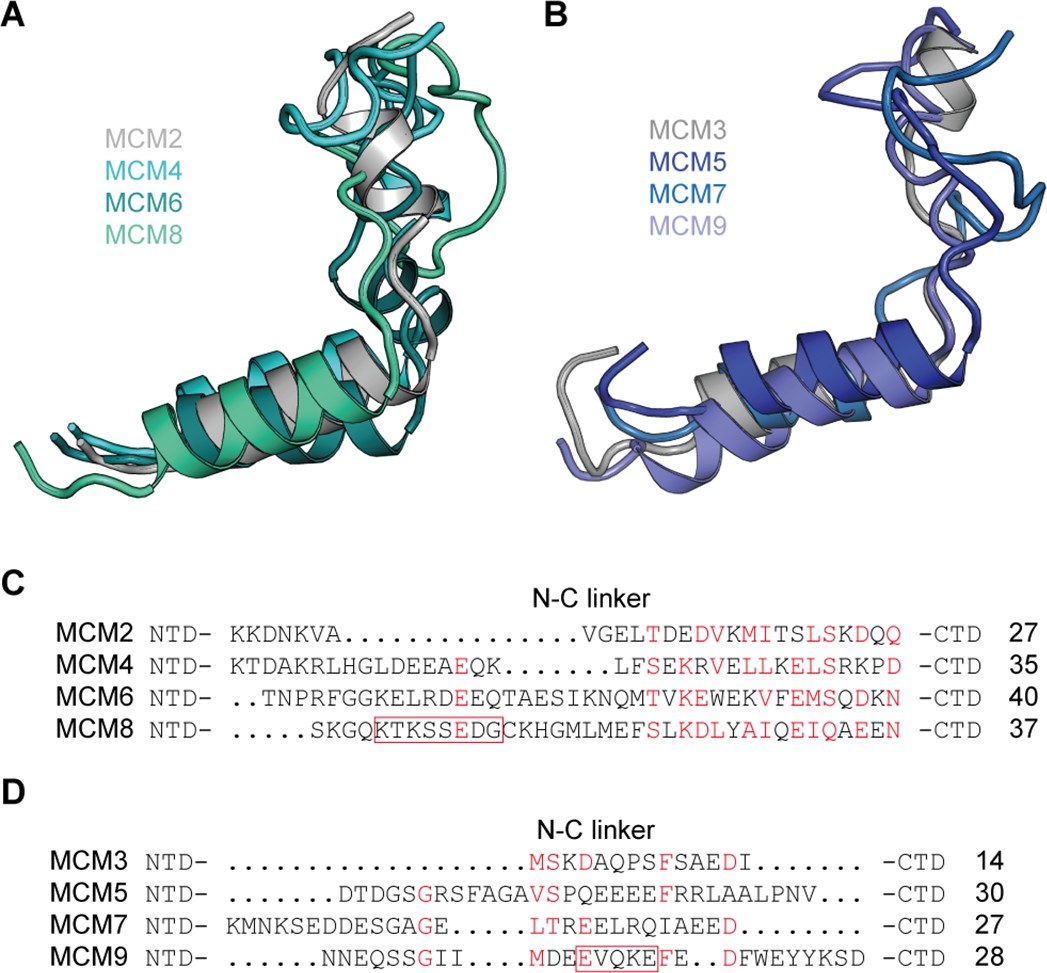
Subgroups of the N-C linkers of MCM2-9.
The N-C linkers of MCM2-9 were divided into two subgroups according to structural and sequence similarity. The N-C linkers of MCM2, MCM4, MCM6, and MCM8 formed group I while the other N-C linkers made up another group II. (A, B) structural alignments of the N-C linkers from group I (A) and group II (B). All the structures are from AlphaFold prediction website. (C, D) sequence alignments of the N-C linkers of group I (C) and group II (D), respectively. The sequence alignments were performed in ESPript3.0 (Robert and Gouet, 2014). conserved residues are highlighted as red and deletion residues of MCM8 and MCM9 in helicase assay are labeled by red boxes. The length of the N-C linkers of MCM2-9 are listed on the right.
Figure 6—figure supplement 2
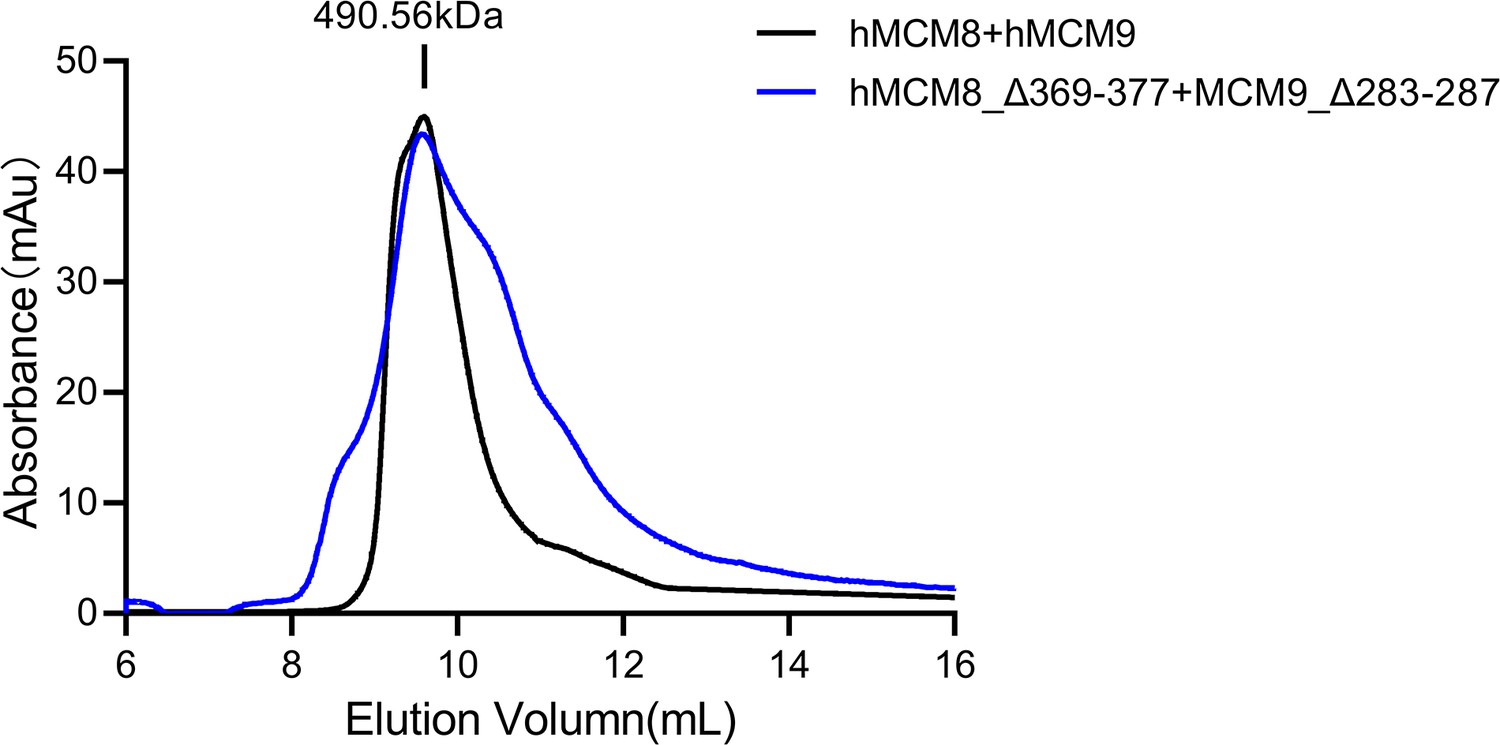
SEC profiles of wild-type (WT) and N-C linker mutant of MCM8/9 complex.
Author response image 1
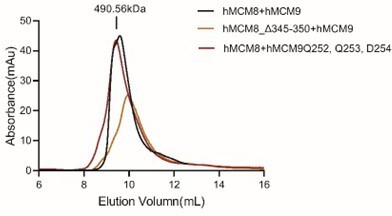
SEC profiles of WT and OB-hps mutants of MCM8/9 complex.
Author response image 2
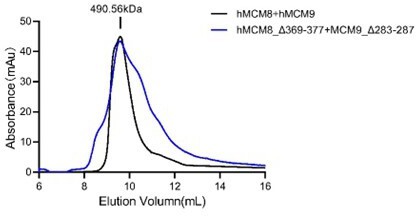
SEC profiles of WT and N-C linker mutant of MCM8/9 complex.
Author response image 3
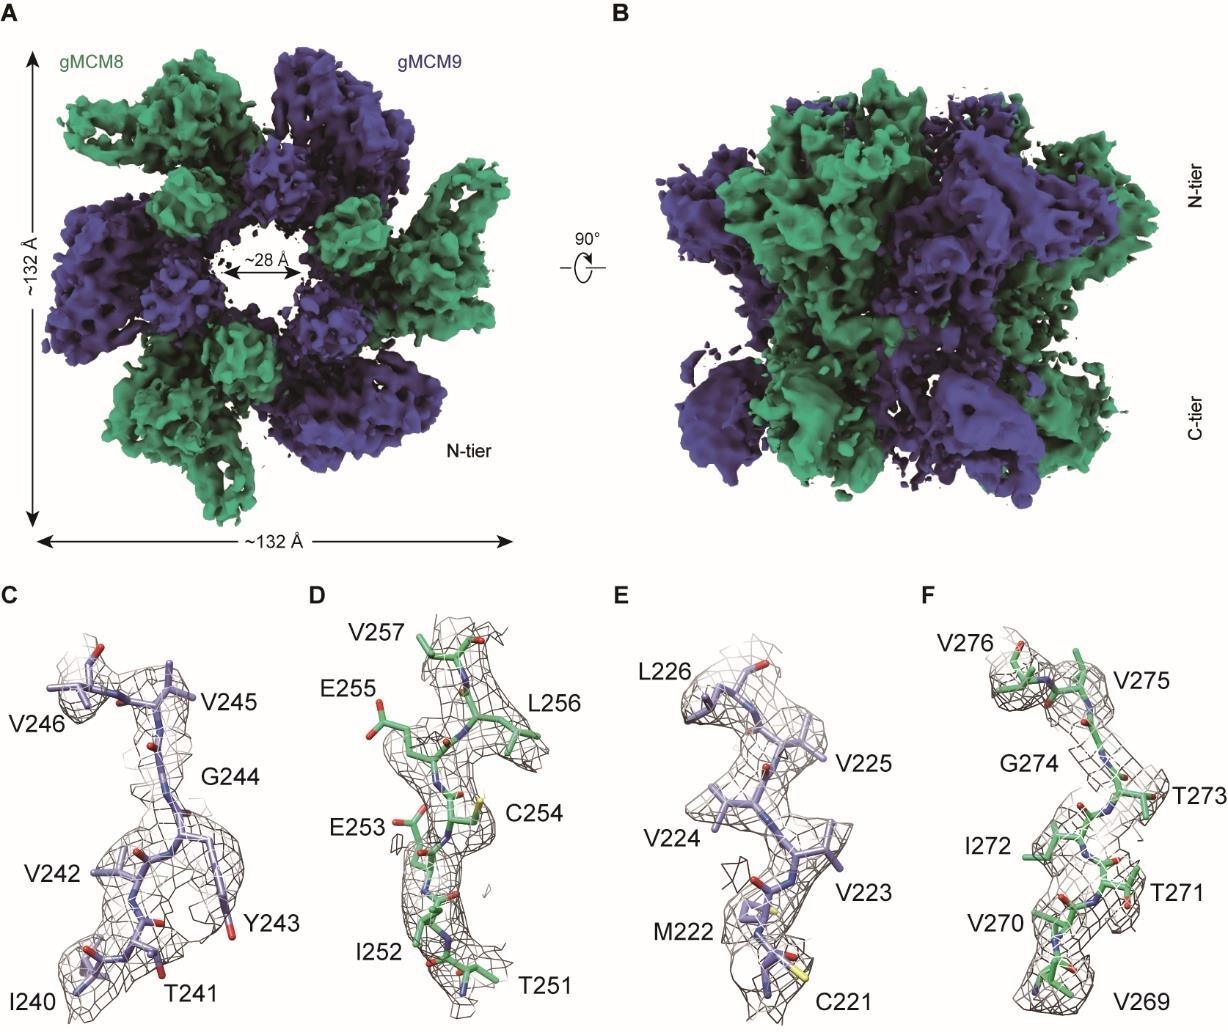
The cryo-EM structure of gMCM8/9.
(A and B) Reconstructed cryo-EM map of gMCM8/9.The diameter of the inner channel of MCM8/9 was measured at ~28 Å. (C-F) Representative regions of the cryo-EM structure of gMCM8/9 NTD are shown based on their density map. (C), chain A (MCM9); (D), chain B (MCM8); (E), chain C (MCM9); (F), chain D (MCM8).
Author response image 4
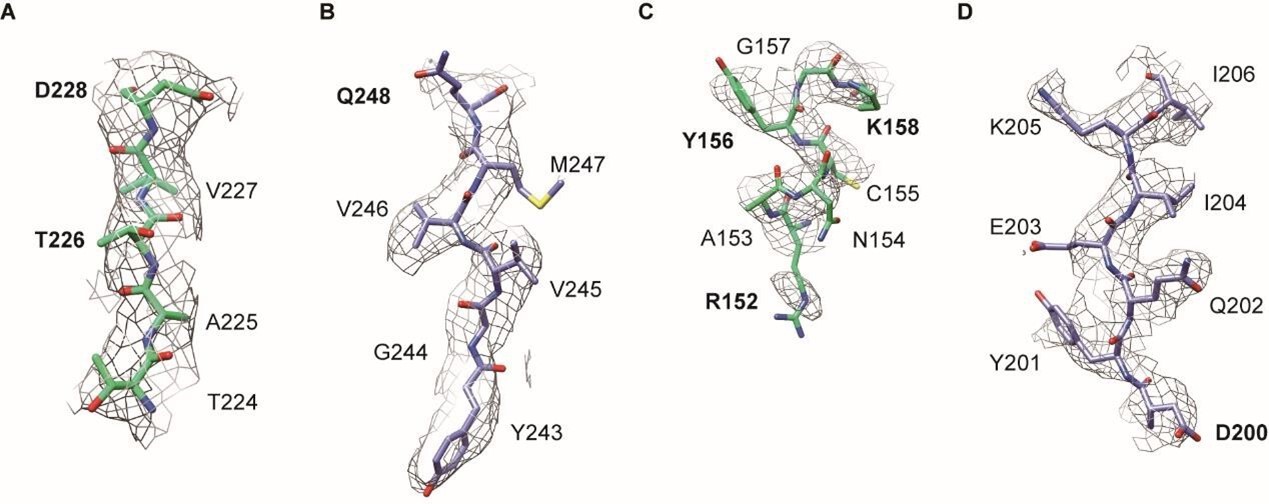
Representative regions of the cryo-EM structure of gMCM8/9 NTD.
(A and B), the region mediated hydrophobic interaction in figure 2B. (A) (MCM8), (B) (MCM9). (C and D), the region mediated hydrophobic interaction in figure 2C. (C) (MCM8), (D) (MCM9). The key residues were in bold.
Videos
Video 1
Structural flexibility analyses of the gMCM8/9 C-terminal domain (CTD) ring.
Tables
Table 1
Cryo-electron microscopy (Cryo-EM) 3D reconstruction and refinement of the gMCM8/9 complex.
| Data collection and processing | NTD | CTD |
|---|---|---|
| Magnification | 130,000 | |
| Voltage (kV) | 200 | |
| Electron dose (e−/Å2) | 50 | |
| Frame | 32 | |
| Under-focus range (μm) | 1.7–2.2 | |
| Pixel size (Å) | 1.0 | |
| Symmetry imposed | C3 | |
| FSC threshold | 0.143 | |
| Relion processing | ||
| Initial particle images (no.) | 965 k | |
| Final particle images (no.) | 144,202 | |
| Global map resolution (Å) | 6.6 | |
| NTD map resolution (Å) | 4.2 | |
| CTD map resolution (Å) | 5.4 | |
| Cryosparc processing | ||
| Initial particle images (no.) | 2,134 k | |
| Global map resolution (Å) | 4.31 | |
| Final particle images (no.) | 290,080 | 72,948 |
| NTD map resolution (Å) | 3.66 | |
| CTD mean map resolution (Å) | 5.21 | |
| Model composition | ||
| Initial model used (PDB code) | 7DP3 and 7DPD | 3JA8 |
| Non-hydrogen atoms | 13410 | 12,687 |
| Protein | 1698 | 1671 |
| Ligands | 0 | 0 |
| R.m.s. deviations | ||
| Bond lengths (Å) | 0.002 | 0.003 |
| Bond angels (°) | 0.593 | 0.843 |
| Validation | ||
| MolProbity score | 1.73 | 2.25 |
| Clashscore | 8.36 | 29 |
| Rotamers outliers (%) | 0.00 | 0.00 |
| Ramachandran plot | ||
| Favored (%) | 95.64 | 95.61 |
| Allowed (%) | 4.3 | 4.33 |
| Outliers (%) | 0.06 | 0.06 |
Table 2
cryo-electron microscopy (Cryo-EM) 3D reconstruction and refinement of the hMCM8/9 N-terminal domain (NTD) ring.
| Data collection and processing | |
|---|---|
| Magnification | 105,000 |
| Voltage (kV) | 300 |
| Electron dose (e−/Å2) | 50 |
| Frame | 32 |
| Under-focus range (μm) | 1.7–2.2 |
| Pixel size (Å) | 0.827 |
| Symmetry imposed | C1 |
| FSC threshold | 0.143 |
| Cryosparc processing | |
| Initial particle images (no.) | 1855 k |
| Final particle images (no.) | 95,257 |
| Global map resolution (Å) | 3.95 |
| Model composition | |
| Initial model used (PDB code) | 7DP3 and 7DPD |
| Non-hydrogen atoms | 13,878 |
| Protein and DNA residues | 1749 |
| Ligands | 0 |
| R.m.s. deviations | |
| Bond lengths (Å) | 0.003 |
| Bond angels (°) | 0.682 |
| Validation | |
| MolProbity score | 1.99 |
| Clashscore | 19.18 |
| Rotamers outliers (%) | 0.06 |
| Ramachandran plot | |
| Favored (%) | 96.6 |
| Allowed (%) | 3.28 |
| Outliers (%) | 0.06 |
Additional files
Download links
A two-part list of links to download the article, or parts of the article, in various formats.
Downloads (link to download the article as PDF)
Open citations (links to open the citations from this article in various online reference manager services)
Cite this article (links to download the citations from this article in formats compatible with various reference manager tools)
Structural and mechanistic insights into the MCM8/9 helicase complex
eLife 12:RP87468.
https://doi.org/10.7554/eLife.87468.3


