Scn1a-GFP transgenic mouse revealed Nav1.1 expression in neocortical pyramidal tract projection neurons
- Department of Neurodevelopmental Disorder Genetics, Institute of Brain Science, Nagoya City University Graduate School of Medical Sciences, Japan
- Laboratory for Neurogenetics, RIKEN Center for Brain Science, Japan
- Department of Physiology, Nippon Medical School, Japan
- Laboratory for Behavioral Genetics, RIKEN Center for Brain Science, Japan
Figures
Figure 1 with 1 supplement
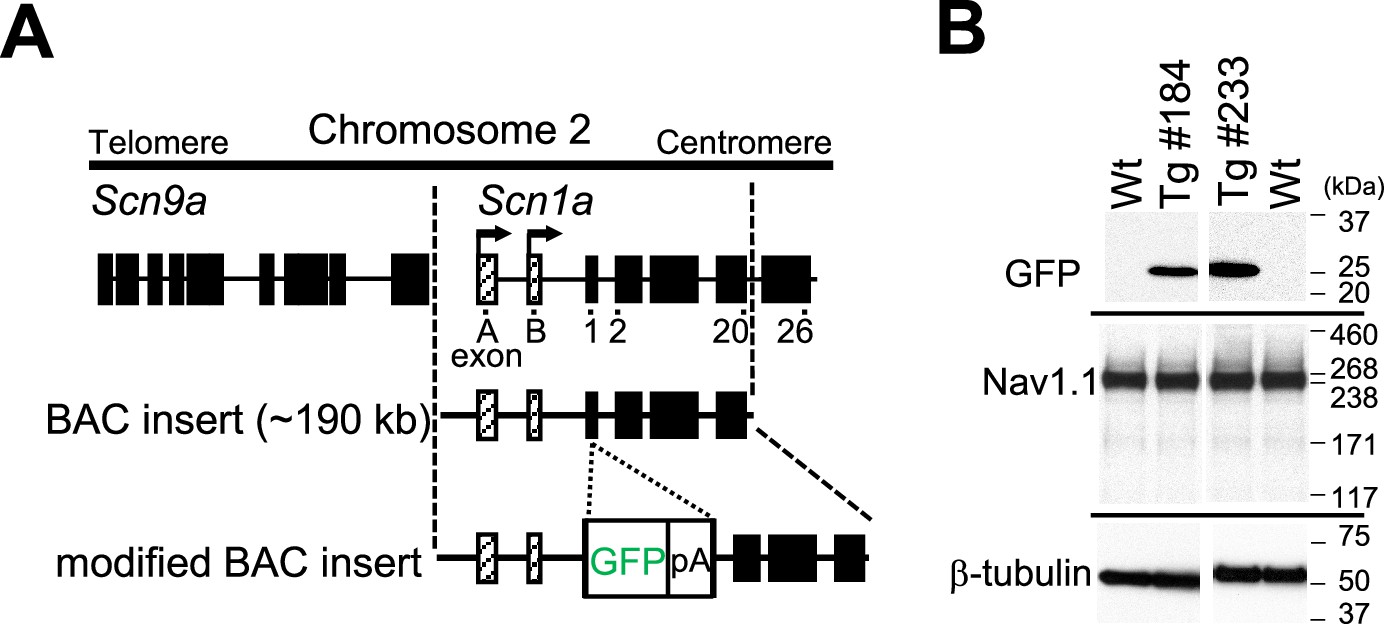
Generation of Scn1a-GFP mice.
(A) Schematic representation of the modified bacterial artificial chromosome (BAC) construct containing the Scn1a-GFP transgene. A green fluorescent protein (GFP) reporter cassette consisting of GFP cDNA and a polyadenylation signal was inserted at the ATG initiation codon in the coding exon 1 of Scn1a. Filled and hatched boxes indicate the coding and non-coding exons of Scn9a and Scn1a. Arrows indicate the start sites and orientation of transcription of Scn1a. (B) Western blot analysis for Scn1a-GFP and endogenous Nav1.1. The whole cytosolic fractions from 5W Scn1a-GFP brains (lines #184 and #233) were probed with anti-GFP and their membrane fractions were probed with anti-Nav1.1 antibodies. β-Tubulin was used as an internal control. pA, polyadenylation signal; Tg, hemizygous Scn1a-GFP transgenic mice; Wt, wild-type littermates.
-
Figure 1—source data 1
Raw and annotated immunoblots for Figure 1B.
- https://cdn.elifesciences.org/articles/87495/elife-87495-fig1-data1-v1.zip
Figure 1—figure supplement 1
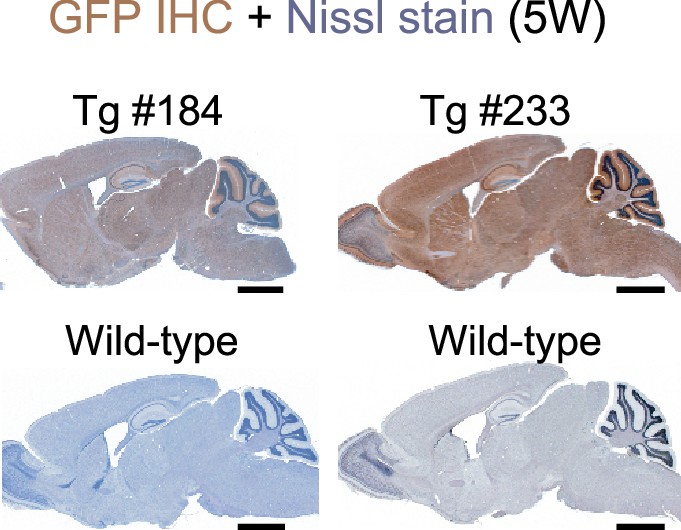
Green fluorescent protein (GFP) expression in the brain of two Scn1a-GFP transgenic mouse lines.
Chromogenic immunostaining of GFP in parasagittal sections from brains of 5W Scn1a-GFP mouse lines (#184, #233) and wild-type controls by anti-GFP antibody (brown). Sections were counterstained with Nissl for labeling of neurons (violet). IHC, immunohistochemistry. Scale bars: 1 mm.
Figure 2 with 2 supplements
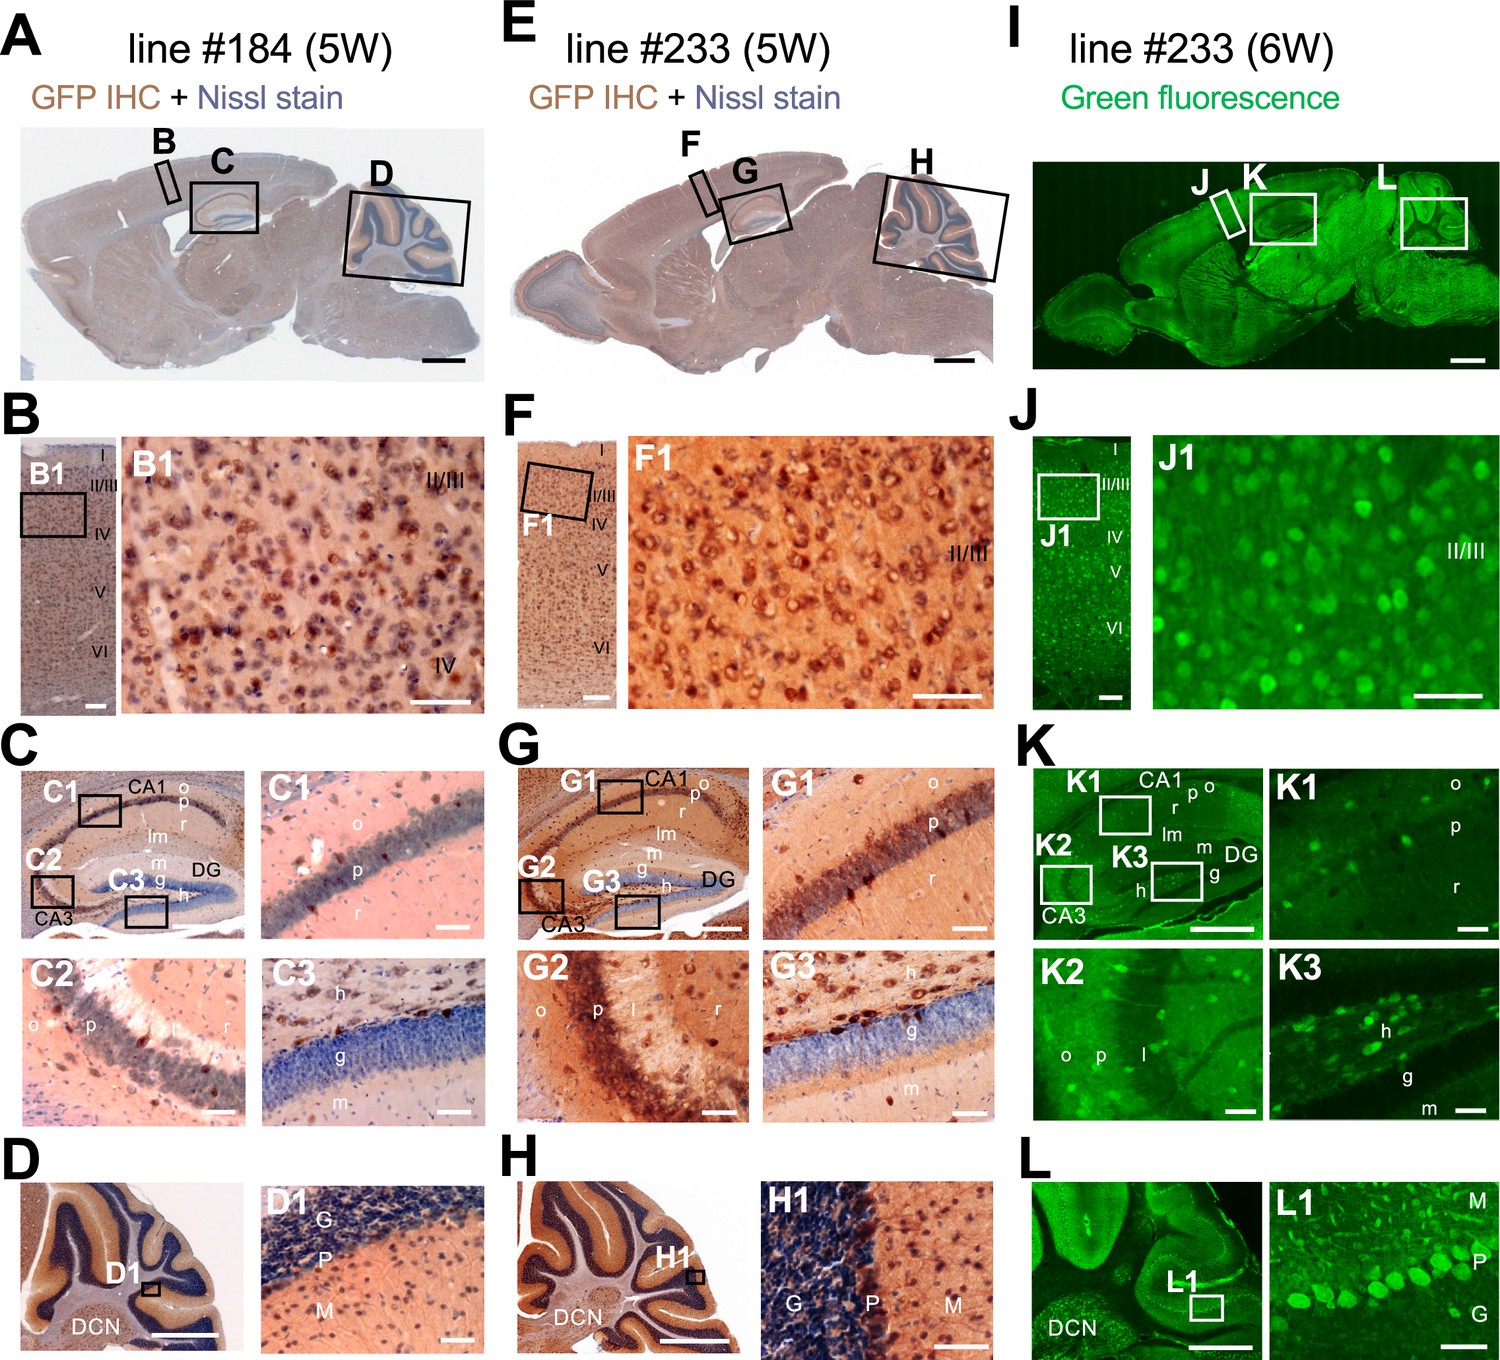
Distributions of green fluorescent protein (GFP) signals in brains are similar among Scn1a-GFP mouse lines.
Chromogenic immunostaining of GFP (brown) with Nissl counterstaining (violet) of lines #184 and #233 (A–H) and GFP fluorescence images of line #233 (I–L) on parasagittal sections from 5W to 6W Scn1a-GFP brains. Boxed areas in (A, E, I, B, F, J, C, G, K, D, H, L) are magnified in (B–D, F–H, J–L, B1, F1, J1, C1–3, G1–3, K1–3, D1, H1, L1). The two lines (#184 and #233) showed a similar distribution pattern of GFP-expressing cells across all brain regions (A–H), but the signals in the line #233 are more intense than the line #184. In neocortex (B, F, J), GFP-expressing cells were scattered throughout the entire region. In the hippocampus (C, G, K), GFP-positive inhibitory neurons were sparsely distributed (see also Figure 8), while excitatory neurons in stratum pyramidale and stratum granulosum are GFP-negative. In cerebellum (D, H, L), Purkinje, basket, and deep cerebellar nuclei cells were GFP-positive. IHC, immunohistochemistry; CA, cornu ammonis; DG, dentate gyrus; o, stratum oriens; p, stratum pyramidale; r, stratum radiatum; lm, stratum lacunosum-moleculare; l, stratum lucidum; m, stratum moleculare; g, stratum granulosum; h, hilus; DCN, deep cerebellar nuclei; M, molecular layer; P, Purkinje cell layer; G, granular cell layer. Scale bars: 1 mm (A, E, I), 500 µm (C, D, G, H, K, L), 100 µm (B, F, J), and 50 µm (B1, C1–3, D1, F1, G1–3, H1, J1, K1–3, L1).
Figure 2—figure supplement 1
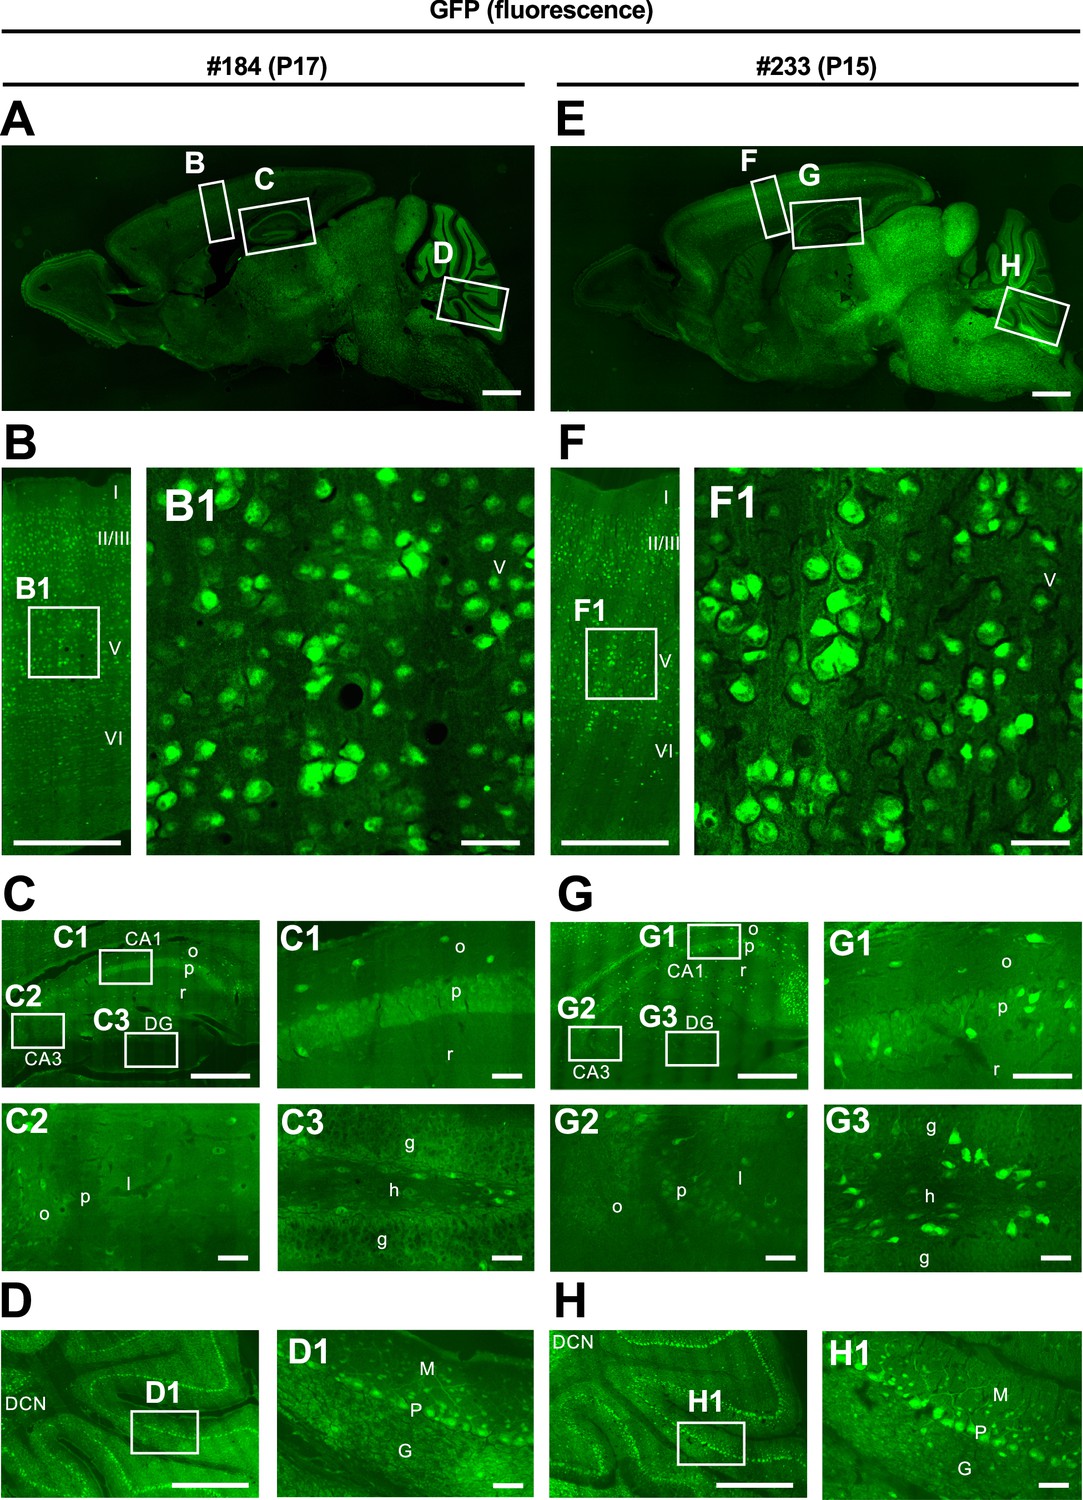
Green fluorescent protein (GFP) distribution in the brains of two Scn1a-GFP mice from lines #184 and #233.
Fluorescence images of parasagittal sections from brains of P15–17 Scn1a-GFP mouse lines #184 (A–D) and #233 (E–H). Magnified images outlined in (A, E) are shown in (B–D, F–H) and further magnified in (B1, C1–3, D1, F1, G1–3, H1). Although both lines #184 and #233 show a similar distribution of GFP signals across all brain regions, the GFP signals are more intense in #233 than that in #184 in caudal parts of the brain such as midbrain and brainstem. CA, cornu ammonis; DG, dentate gyrus; o, stratum oriens; p, stratum pyramidale; r, stratum radiatum; l, stratum lucidum; g, stratum granulosum; h, hilus; DCN, deep cerebellar nuclei; M, molecular layer; P, Purkinje cell layer; G, granular cell layer. Scale bars: 1 mm (A, E), 500 µm (B–D, F–H), and 50 µm (B1, C1–3, D1, F1, G1–3, H1).
Figure 2—figure supplement 2
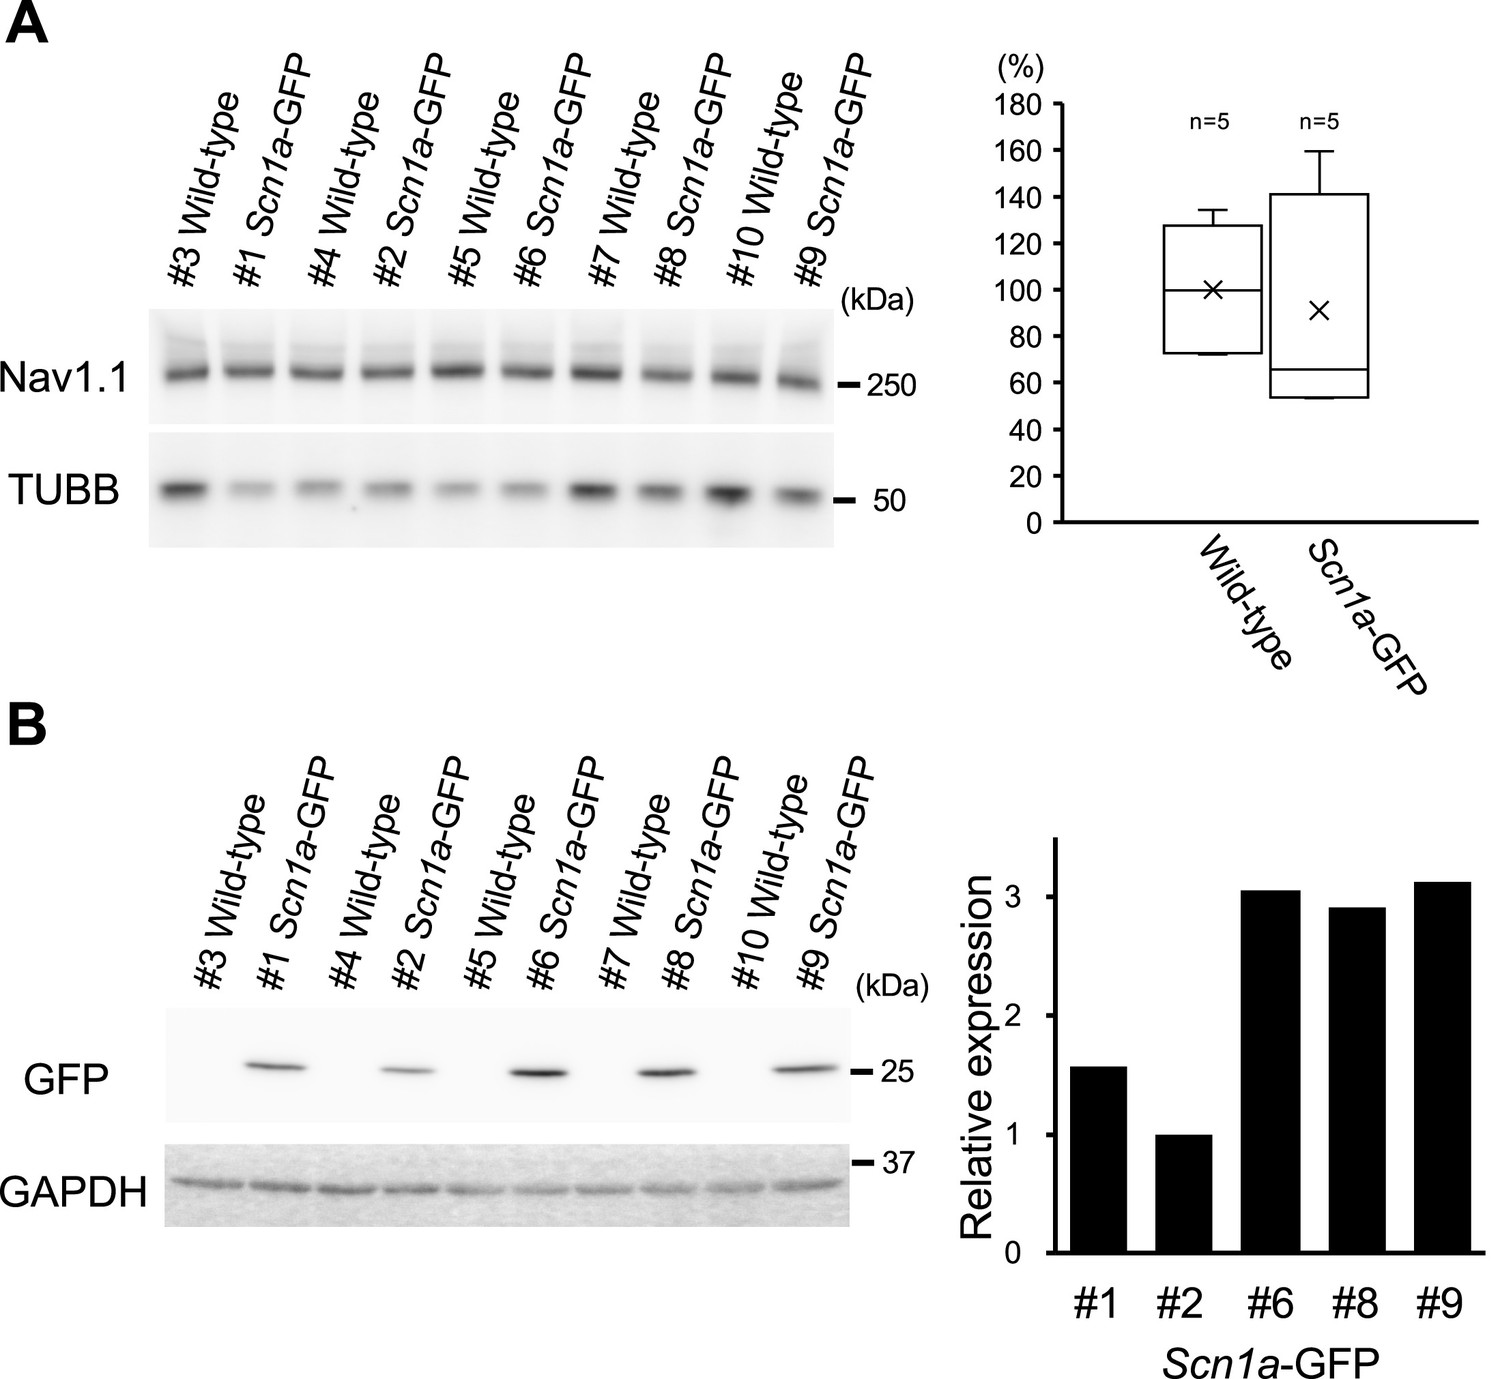
Nav1.1 expression is stable while green fluorescent protein (GFP) expression varies among individual Scn1a-GFP mice.
(A) Western blot analysis for Nav1.1 in Scn1a-GFP and wild-type mice. The whole membrane fractions from 5W Scn1a-GFP brains (line #233) were probed with anti-Nav1.1 antibody (left panel). Nav1.1 values quantified from the blots were normalized by beta-tubulin (TUBB), and the mean of Nav1.1 amount in wild-type was assigned as a value of 100 (right panel). The amount of Nav1.1 was not significantly changed in the Scn1a-GFP mice compared to wild-type mice (t-test; p > 0.05). The boxes show median, 25th and 75th percentiles, and whiskers represent minimum and maximum values. Cross marks indicate mean values for each genotype. (B) Western blot analysis for GFP in Scn1a-GFP and wild-type mice. The whole cytosolic fractions from the same series of mice used in (A) were probed with anti-GFP antibody (left panel). GFP values were normalized by glyceraldehyde 3-phosphate dehydrogenase (GAPDH), and the lowest GFP amount in the #2 mouse was assigned as a value of 1 (right panel). Statistical significance was assessed using t-test.
-
Figure 2—figure supplement 2—source data 1
Raw and annotated immunoblots for Figure 2—figure supplement 2.
- https://cdn.elifesciences.org/articles/87495/elife-87495-fig2-figsupp2-data1-v1.zip
-
Figure 2—figure supplement 2—source data 2
Numerical source data for Figure 2—figure supplement 2.
- https://cdn.elifesciences.org/articles/87495/elife-87495-fig2-figsupp2-data2-v1.xlsx
Figure 3 with 2 supplements
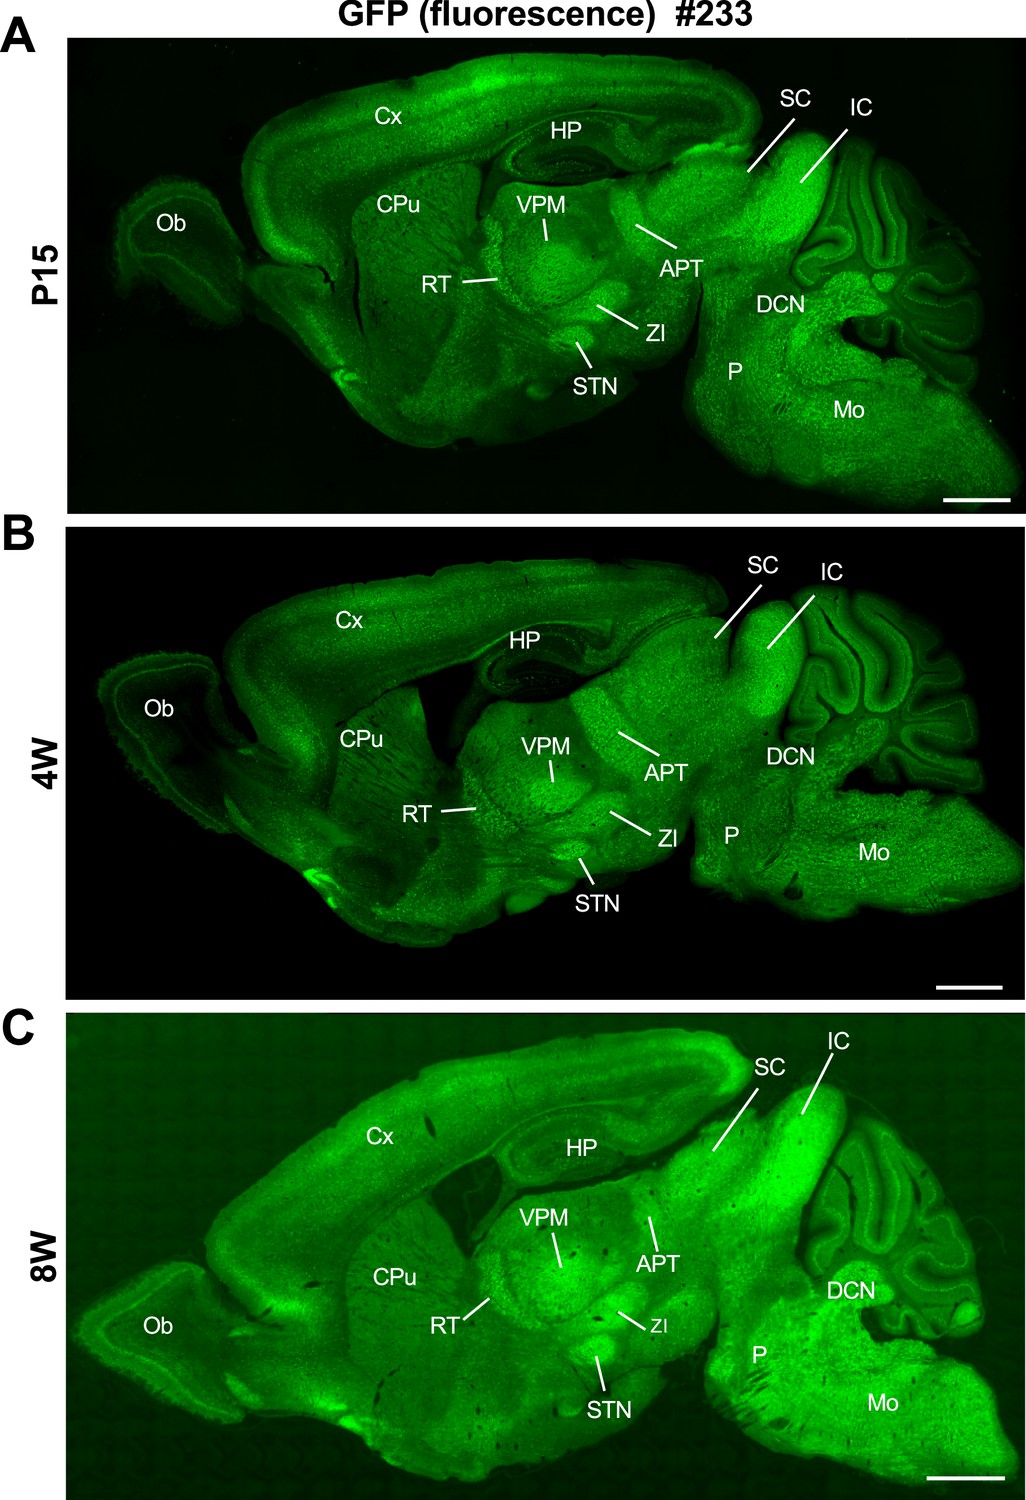
Distribution of green fluorescent protein (GFP) signals in Scn1a-GFP mouse brain are largely maintained through development.
Fluorescent images of parasagittal sections from P15 (A), 4W (B), and 8W (C) Scn1a-GFP mouse brains (line #233). GFP signals were observed in multiple brain regions. APT, anterior pretectal nucleus; CPu, caudate putamen; Cx, cerebral cortex; DCN, deep cerebellar nuclei; HP, hippocampus; IC, inferior colliculus; Mo, medulla oblongata; Ob, olfactory bulb; P, pons; RT, reticular thalamic nucleus; SC, superior colliculus; STN, subthalamic nucleus; VPM, ventral posteromedial thalamic nucleus; ZI, zona incerta. Scale bars: 1 mm.
Figure 3—figure supplement 1
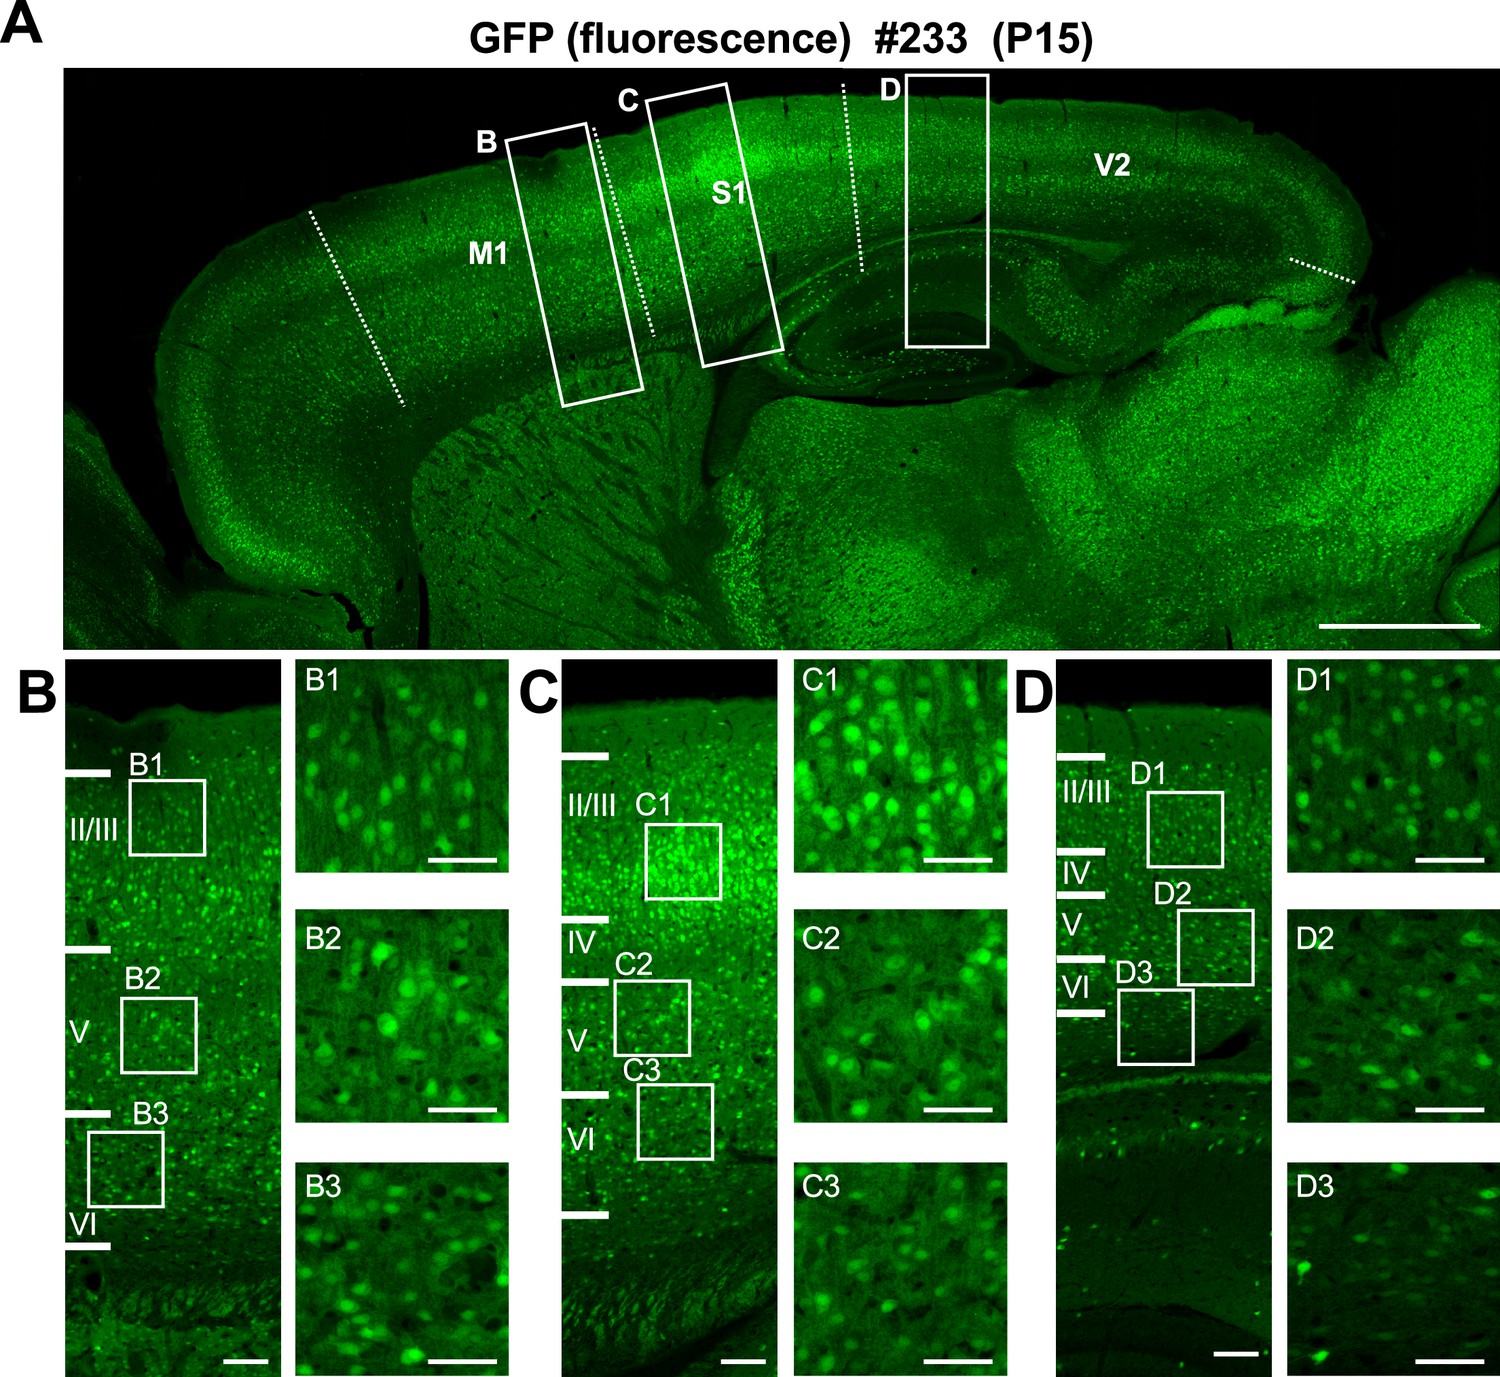
Distribution of green fluorescent protein (GFP) fluorescent signals in neocortical layers of Scn1a-GFP mouse brain.
(A) Fluorescent images of parasagittal section spanning whole neocortical area of P15 Scn1a-GFP brain (line #233). (B–D) Outlined areas in (A) are magnified in (B–D) and further in (B1–B3, C1–C2, D1–D3). GFP signals in L2/3 of primary somatosensory cortex (C) are brighter than other regions such as primary motor cortex (B) and secondary visual cortex (D). Brain regions were defined using mouse brain atlas (Paxinos and Franklin, 2001) as reference. Dashed lines indicate the borders between M1, S1, and V2 areas. M1, primary motor cortex; S1, primary somatosensory cortex; V2, secondary visual cortex. Scale bars: 1 mm (A), 100 µm (B–D), and 50 µm (B1–B3, C1–C3, D1–D3).
Figure 3—figure supplement 2
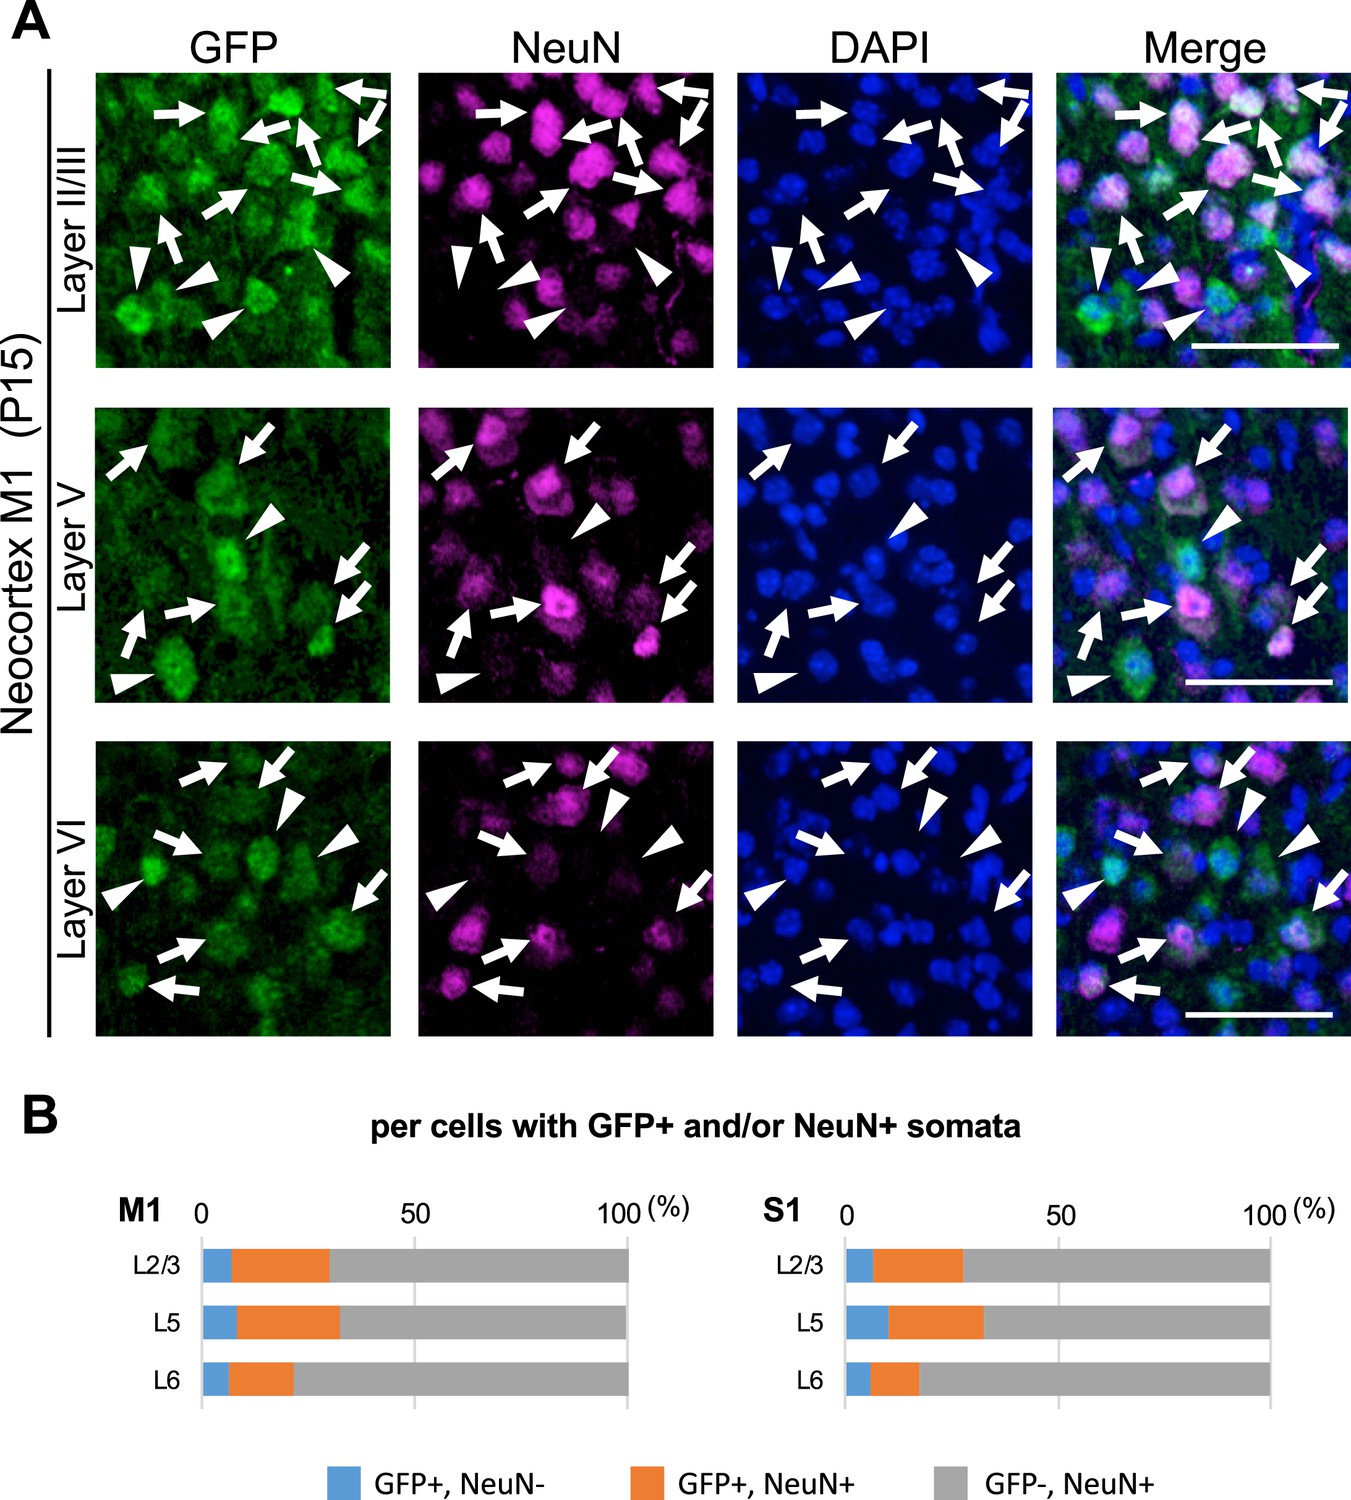
Immunostaining for NeuN and green fluorescent protein (GFP) in the neocortex of Scn1a-GFP mouse.
(A) Double immunostaining of parasagittal sections from P15 Scn1a-GFP mouse brain (line #233) by mouse anti-GFP (green) and mouse anti-NeuN (magenta) antibodies with DAPI (blue). Merged images are shown in the right panels. Arrows indicate GFP/NeuN-double positive cells. Arrowheads indicate GFP-positive but NeuN-negative cells. Note that cells with intense GFP signals, which are assumed to be inhibitory neurons (see Figure 8), were NeuN-negative. All images are oriented from pial surface (top) to callosal (bottom). Scale bars: 50 μm. (B) Bar graphs indicating the percentage of cells with GFP-positive somata among cells with GFP- and/or NeuN-positive somata in neocortical layers. Cells in primary motor cortex (M1) and primary somatosensory cortex (S1) of P15 Scn1a-GFP mice were counted (see also Supplementary file 1a). L2/3, L5, L6: neocortical layer II/III, V, VI. +, positive; −, negative.
-
Figure 3—figure supplement 2—source data 1
Numerical source data for Figure 3—figure supplement 2.
- https://cdn.elifesciences.org/articles/87495/elife-87495-fig3-figsupp2-data1-v1.xlsx
Figure 4 with 2 supplements
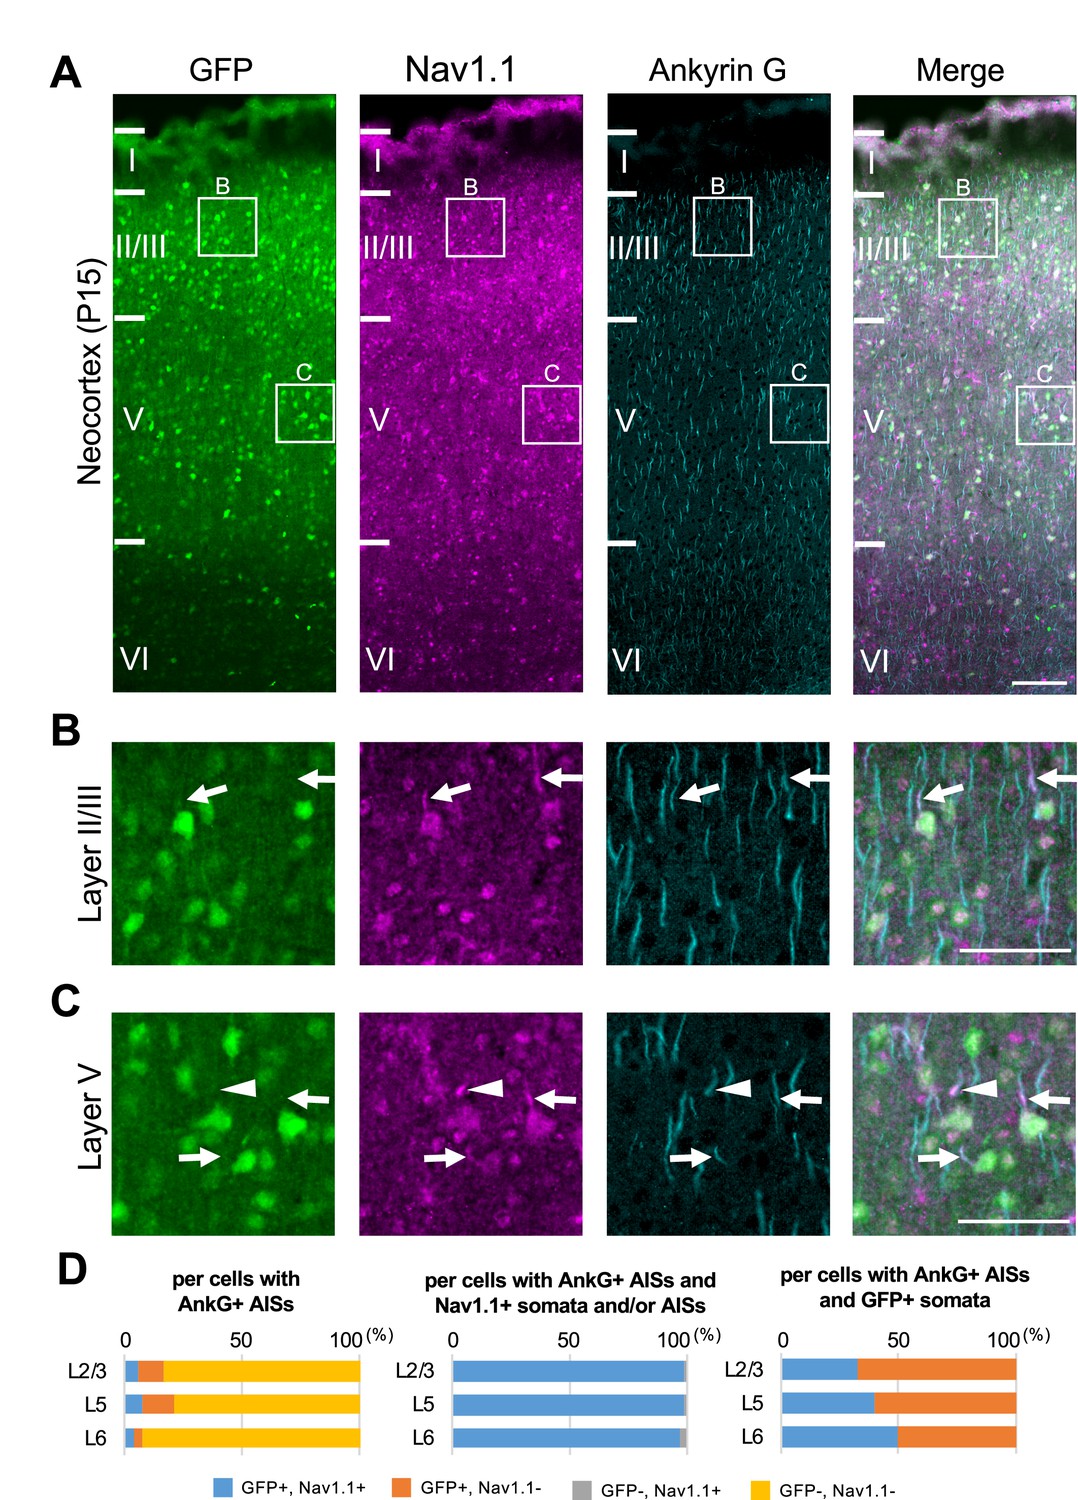
Nav1.1 expression at the axon initial segment (AIS) in the Scn1a-GFP mouse neocortex.
(A) Triple immunofluorescent staining of parasagittal sections from P15 Scn1a-GFP mouse brain (line #233) by mouse anti-GFP (green), rabbit anti-Nav1.1 (magenta), and goat anti-ankyrinG (cyan) antibodies. Regions at primary motor cortex are shown. (B, C) Magnified images outlined in (A) are shown in (B) and (C). Arrows indicate AISs of cells with green fluorescent protein (GFP)-positive somata in which both somata and AISs are positive for Nav1.1. Arrowheads indicate AISs of cells with GFP-positive somata in which AISs but not somata are positive for Nav1.1. All images are oriented from pial surface (top) to callosal (bottom). Scale bars: 100 μm (A), 50 μm (B, C). (D) Cell counting of three Scn1a-GFP mice. Bar graphs indicating the percentage of cells with GFP- and Nav1.1-positive/negative somata and AISs per cells with ankyrinG-positive AISs (left panel), the percentage of cells with GFP-positive/negative somata per cells with ankyrinG-positive AISs and Nav1.1-positive somata and/or AISs (middle panel), and the percentage of cells with Nav1.1-positive/negative somata and/or AISs per cells with ankyrinG-positive AISs and GFP-positive somata (right panel) in L2/3, L5, and L6 (see also Supplementary file 1b–d). Only cells with ankyrinG-positive AISs were counted. Nav1.1 immunosignals were occasionally observed in somata, but in such cases Nav1.1 signals were always observed in their AISs if visible by ankyrinG staining. Note that 99% (L2/3), 99% (L5), and 97% (L6) of cells with Nav1.1-positive AISs have GFP-positive somata (middle panel), but only half or less of cells with GFP-positive somata have Nav1.1-positive AISs (right panel). L2/3, L5: neocortical layer II/III and V. AnkG, ankyrinG; +, positive; −, negative.
-
Figure 4—source data 1
Numerical source data for Figure 4D.
- https://cdn.elifesciences.org/articles/87495/elife-87495-fig4-data1-v1.xlsx
Figure 4—figure supplement 1
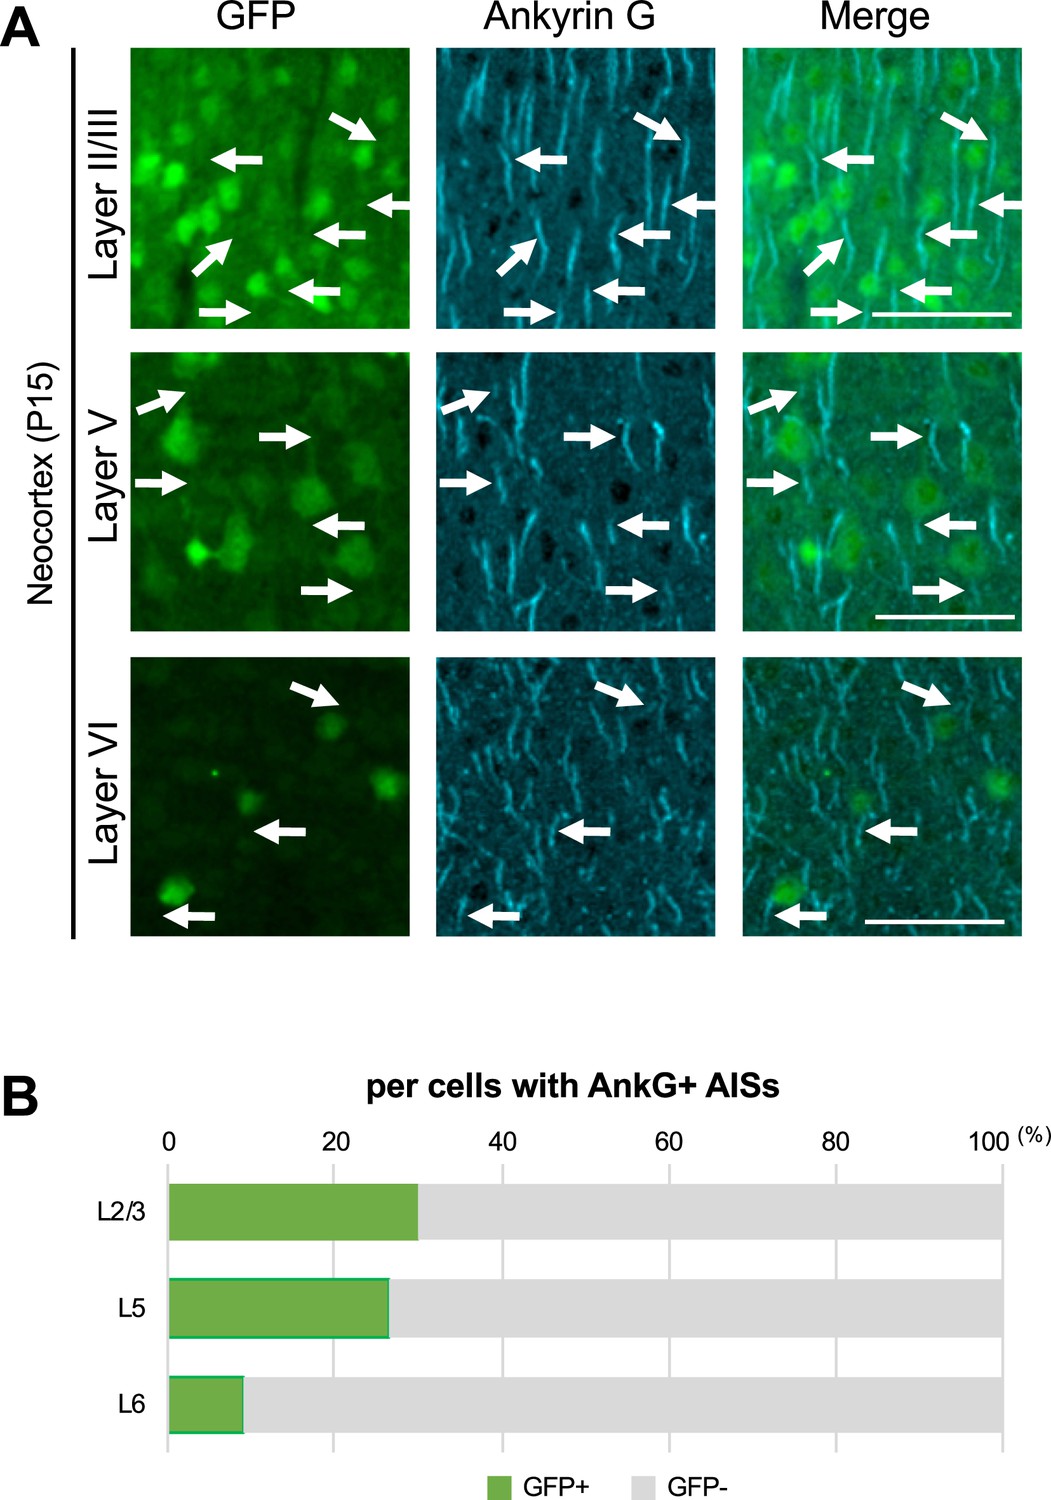
Immunostaining for green fluorescent protein (GFP) and ankyrinG in the neocortex of Scn1a-GFP mouse.
(A) Double immunostaining of parasagittal sections from P15 Scn1a-GFP mouse brain (line #233) by mouse anti-GFP (green) and goat anti-ankyrinG (cyan) antibodies. Merged images are shown in the right panels. Arrows indicate ankyrinG-positive axon initial segments (AISs) with GFP-positive soma. All images are oriented from pial surface (top) to callosal (bottom). Scale bars: 50 μm. (B) Bar graphs indicating the percentage of cells with GFP-positive/negative somata per cells with ankyrinG-positive AISs in L2/3, L5, and L6 (see also Supplementary file 1e). Note that 30% (L2/3), 26% (L5), and 9% (L6) of cells with ankyrinG-positive AISs have GFP-positive somata. L2/3, L5, L6: neocortical layer II/III, V, VI. AnkG, ankyrinG; +, positive; −, negative.
-
Figure 4—figure supplement 1—source data 1
Numerical source data for Figure 4—figure supplement 1B.
- https://cdn.elifesciences.org/articles/87495/elife-87495-fig4-figsupp1-data1-v1.xlsx
Figure 4—figure supplement 2
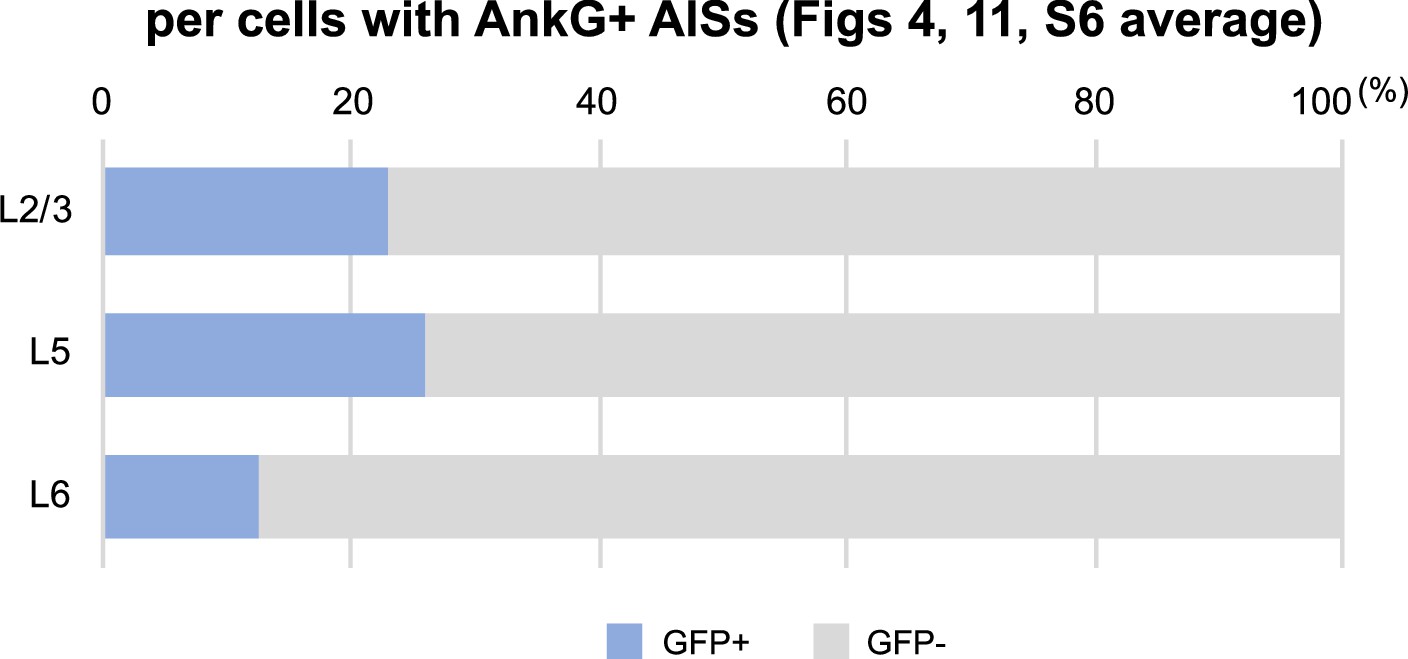
Green fluorescent protein (GFP)-positive cells are more abundant in layers II/III and V than in layer VI of the neocortex.
Bar graphs indicating the average percentage of cells with GFP-positive/negative somata per cells with ankyrinG-positive axon initial segments (AISs) in three different assessments (see also Supplementary file 1f). Note that 23% (L2/3), 26% (L5), and 13% (L6) of cells with ankyrinG-positive AISs have GFP-positive somata. L2/3, L5, L6: neocortical layer II/III, V, VI. AnkG, ankyrinG; +, positive; −, negative.
Figure 5
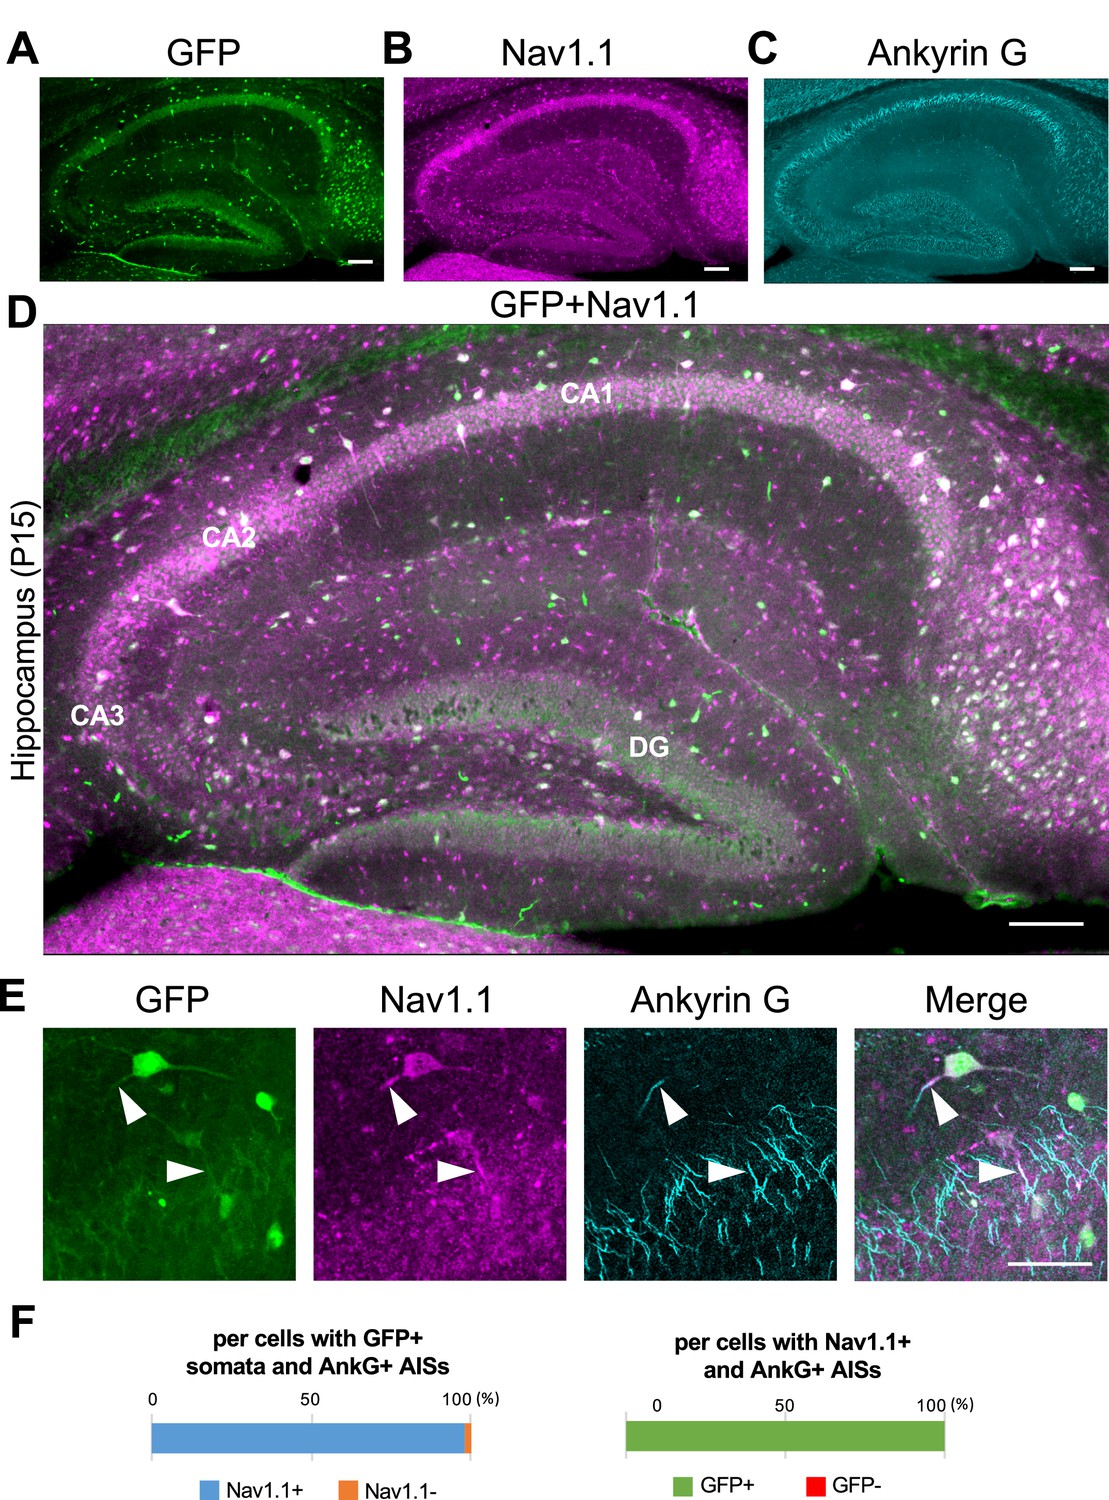
Nav1.1 expression at the axon initial segment (AIS) in the Scn1a-GFP mouse hippocampus.
(A–D) Triple immunofluorescent staining of parasagittal sections from P15 Scn1a-GFP mouse brain (line #233) by mouse anti-GFP (green), rabbit anti-Nav1.1 (magenta), and goat anti-ankyrinG (cyan) antibodies. Regions at hippocampus were shown. Note that green fluorescent protein (GFP) and Nav1.1 immunosignals mostly overlap at somata. CA1, cornu ammonis 1; CA2, cornu ammonis 2; CA3, cornu ammonis 3; DG, dentate gyrus. Images are oriented from pial surface (top) to callosal (bottom). Scale bars: 100 μm. (E) Magnified images for co-expression of GFP and Nav1.1 in cells at CA1 region. Arrowheads indicate Nav1.1-positive AISs of GFP expression cells. Scale bar: 50 μm. (F) Bar graphs indicate the percentage of cells in hippocampal CA1 region with Nav1.1-positive/negative AISs per cells with GFP-positive somata and ankyrinG-positive AISs (left panel), and the percentage of cells with GFP-positive/negative somata per cells with Nav1.1/ankyrinG-double positive AISs (right panel) (see also Supplementary file 1g, h). Only cells with ankyrinG-positive AISs were counted. GFP/Nav1.1-double negative cells, most of which are pyramidal cells, were not counted because of the accumulated nature of their ankyrinG-positive AISs. AnkG, ankyrinG; +, positive; −, negative.
-
Figure 5—source data 1
Numerical source data for Figure 5F.
- https://cdn.elifesciences.org/articles/87495/elife-87495-fig5-data1-v1.xlsx
Figure 6
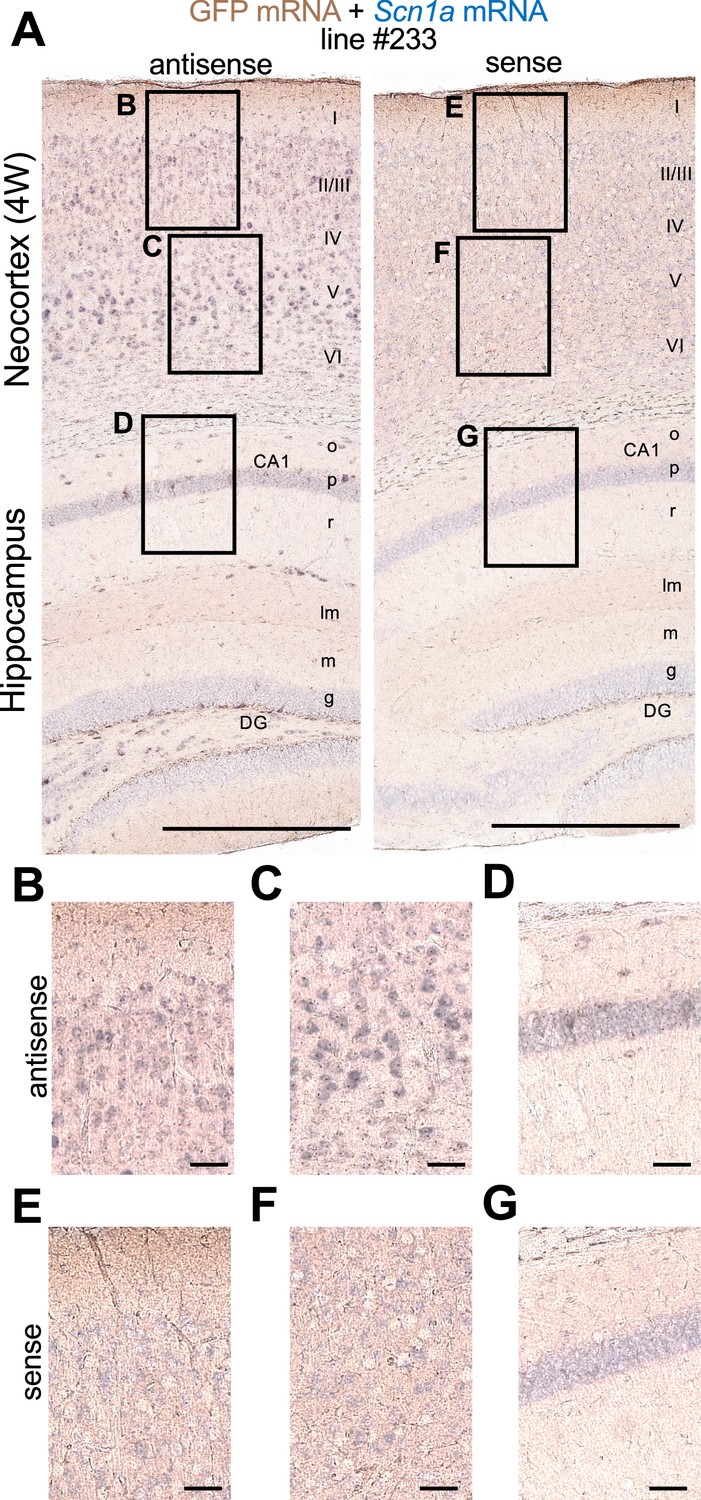
Green fluorescent protein (GFP) and Scn1a mRNAs expression mainly overlap in Scn1a-GFP mouse brain.
Double in situ hybridization for Scn1a-GFP transgene mRNA and endogenous Scn1a mRNA on parasagittal sections from 4W Scn1a-GFP brains (line #233). (A) Sections were hybridized with antisense (left) and sense (right) RNA probes for GFP transgene (brown) and endogenous Scn1a (blue) mRNA species and chromogenically stained. Magnified images outlined in (A) are shown in (B–D) for antisense probes, and (E–G) for sense probes. o, stratum oriens; p, stratum pyramidale; r, stratum radiatum; lm, stratum lacunosum-moleculare; m, stratum moleculare; g, stratum granulosum, CA1, cornu ammonis 1; DG, dentate gyrus. Scale bars: 500 µm (A), 50 µm (B–G).
Figure 7
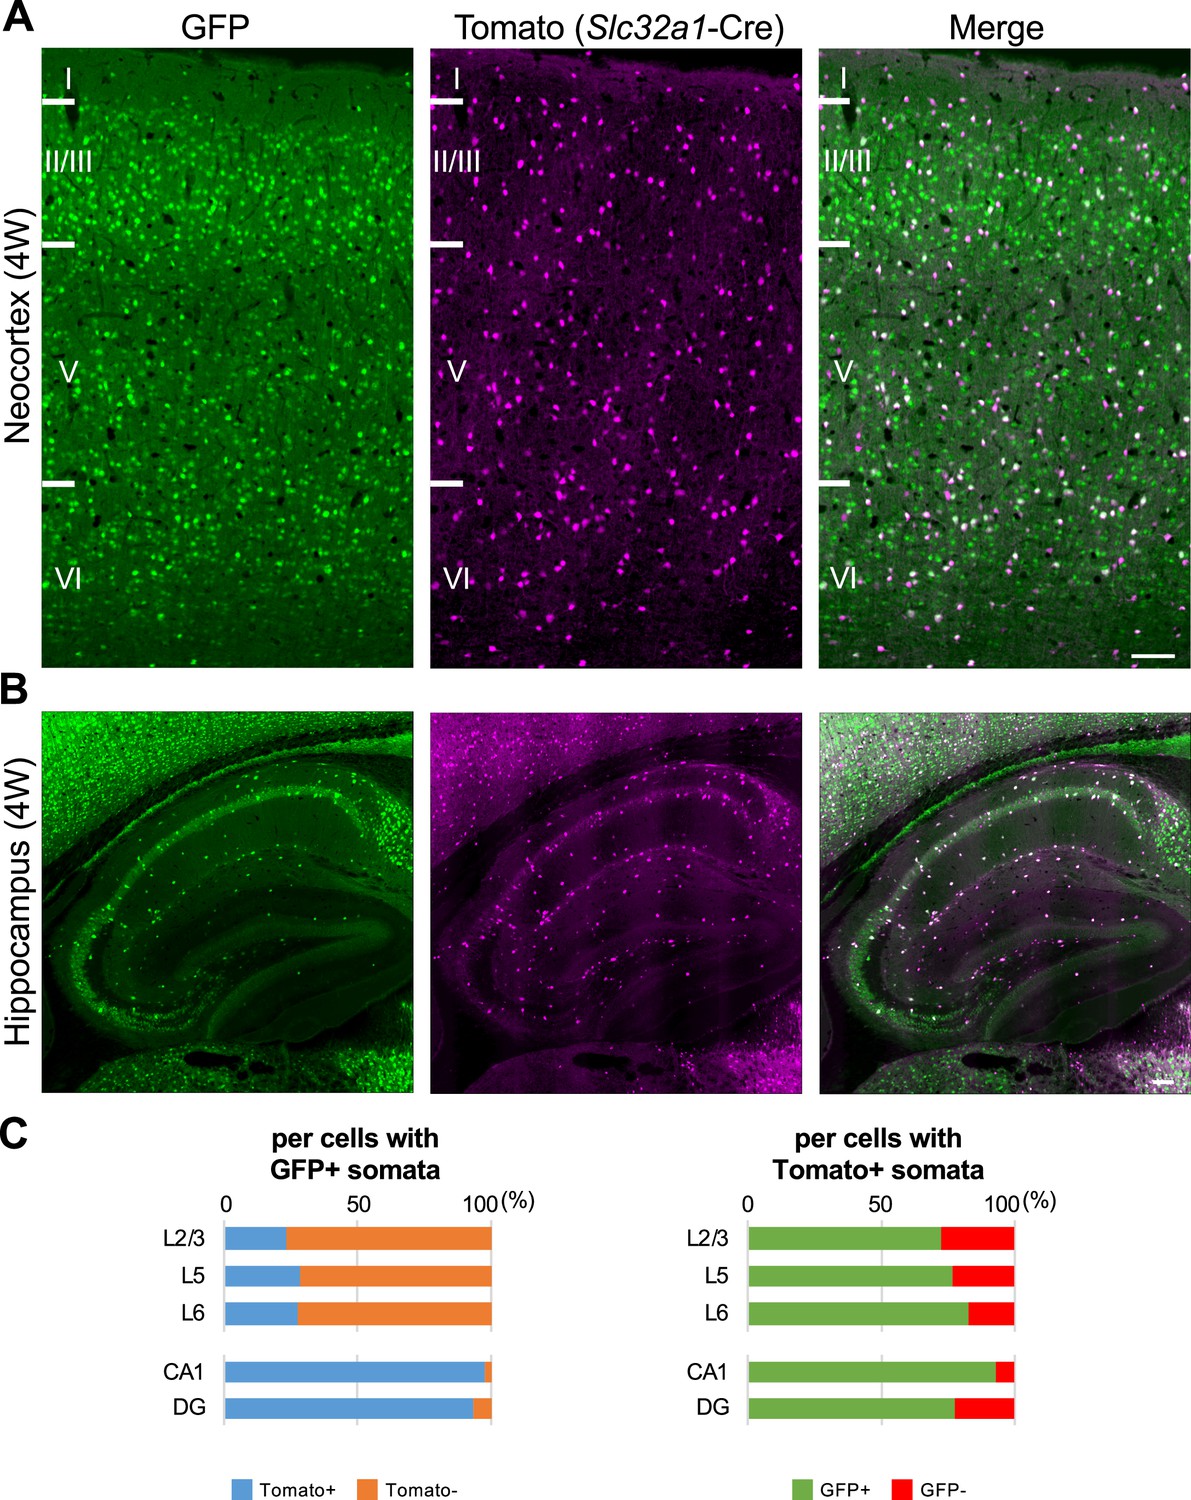
One-third of green fluorescent protein (GFP)-positive cells in neocortex are inhibitory neurons, but most of GFP-positive cells in hippocampus are inhibitory neurons.
(A, B) GFP (green) and Tomato (magenta) fluorescent images of parasagittal sections from 4W Scn1a-GFP/Slc32a1-cre/Ai14 mouse. Regions at primary motor cortex (A) and hippocampus (B) are shown. Scale bar: 100 μm. (C) Bar graphs indicate the percentage of cells with Tomato-positive/negative somata per cells with GFP-positive somata (left panel) (see also Supplementary file 1i) and the percentage of cells with GFP-positive/negative somata per cells with Tomato-positive somata (right panel) (see also Supplementary file 1j) in L2/3, L5, L6, CA1, and DG. Cells in primary motor cortex and hippocampus of Scn1a-GFP mouse at 4W were counted. L2/3, L5, L6, CA1, and DG: neocortical layer II/III, V, VI, cornu ammonis 1, dentate gyrus. +, positive; −, negative.
-
Figure 7—source data 1
Numerical source data for Figure 7C.
- https://cdn.elifesciences.org/articles/87495/elife-87495-fig7-data1-v1.xlsx
Figure 8
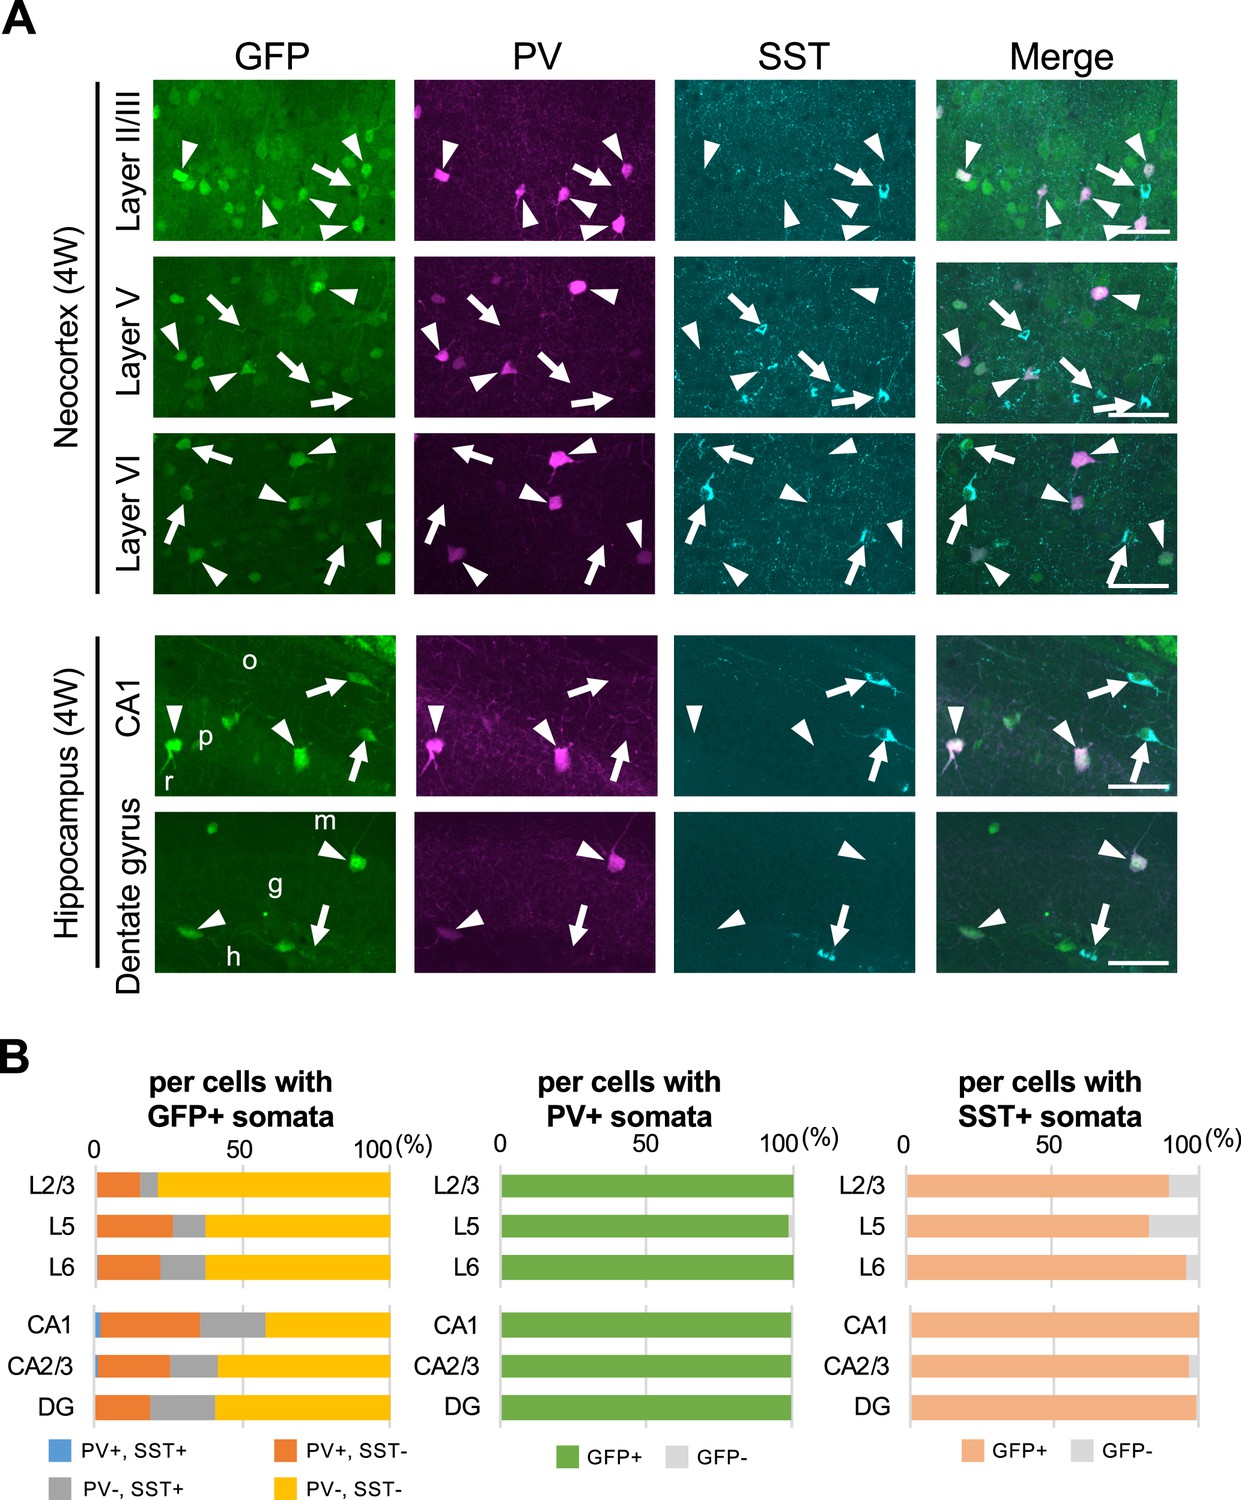
Parvalbumin- or somatostatin-positive inhibitory neurons are green fluorescent protein (GFP)-positive in Scn1a-GFP mouse neocortex and hippocampus.
(A) Triple immunofluorescent staining of parasagittal sections from 4W Scn1a-GFP mouse (line #233) by mouse anti-GFP (green), rabbit anti-parvalbumin (PV) (magenta), and goat anti-somatostatin (SST) (cyan) antibodies. Regions at neocortex and hippocampus are shown. Merged images were shown in the right columns. Arrows indicate SST/GFP-double positive cells. Arrowheads indicate PV/GFP-double positive. o, stratum oriens; p, stratum pyramidale; r, stratum radiatum; h, hilus; g, stratum granulosum; m, stratum moleculare. All images are oriented from pial surface (top) to callosal (bottom). Scale bars: 50 μm. (B) Bar graphs indicate the percentage of cells with PV- and SST-positive/negative somata per cells with GFP-positive somata (left panel) (see also Supplementary file 1k), the percentage of cells with GFP-positive/negative somata per cells with PV-positive somata (middle panel) (see also Supplementary file 1l), and the percentage of cells with GFP-positive/negative somata per cells with SST-positive somata (right panel) (see also Supplementary file 1m) in L2/3, L5, L6, CA1, CA2/3, and DG. Cells in neocortex and hippocampus of Scn1a-GFP mouse at 4W were counted. L2/3, L5, L6, CA1, CA2/3, and DG: neocortical layer II/III, V, VI, cornu ammonis 1, 2 plus 3, dentate gyrus. +, positive; −, negative.
-
Figure 8—source data 1
Numerical source data for Figure 8B.
- https://cdn.elifesciences.org/articles/87495/elife-87495-fig8-data1-v1.xlsx
Figure 9
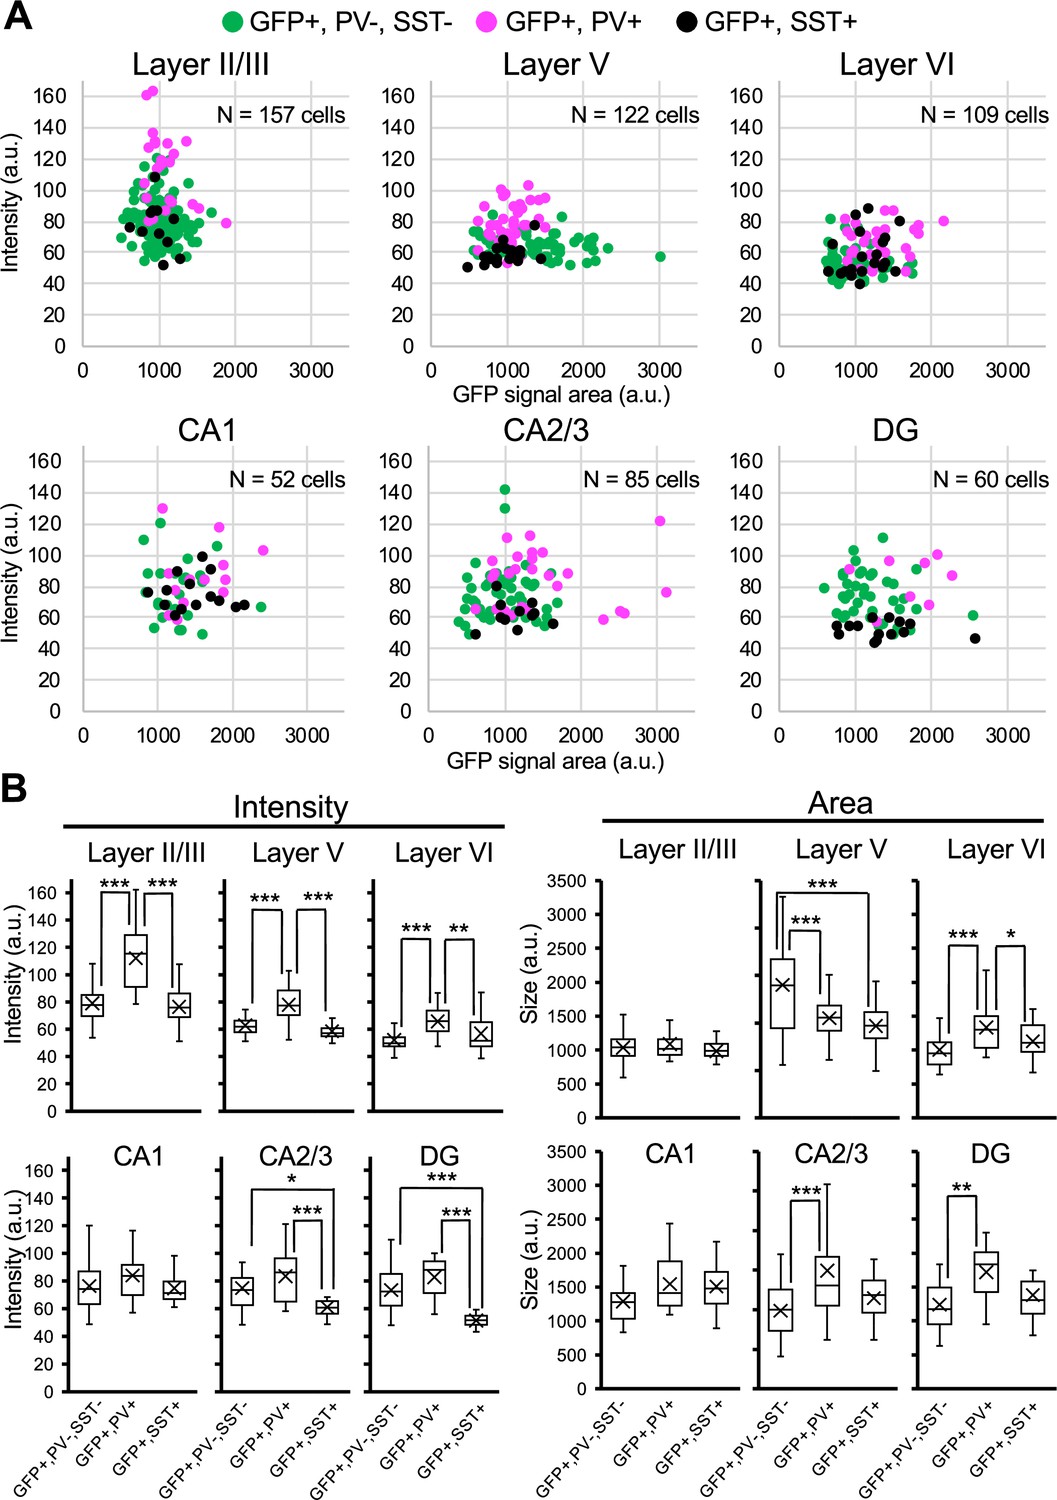
Green fluorescent protein (GFP) signals in parvalbumin-positive inhibitory neurons are higher than PV-negative/GFP-positive cells in Scn1a-GFP mouse neocortex.
(A) Scatter plots of intensities and area sizes of GFP immunosignals in GFP-positive cells with PV- or SST-positive or -negative somata. Cells at primary motor cortex (upper panels) and hippocampus (lower panels) in parasagittal sections from 4W Scn1a-GFP mouse (line #233) were analyzed. PV-positive (magenta circles) or SST-positive (black circles) and -negative (green circles) cells in neocortical L2/3, L5, and L6 or hippocampal CA1, CA2/3, and DG are plotted (see also Supplementary file 1n). (B) Box plots represent values for the intensity and area size in each cell type (see also Supplementary file 1o, p). Cross marks indicate mean values in each cell type. Statistical significance was assessed using one-way analysis of variance (ANOVA) followed by Tukey–Kramer post hoc multiple comparison test. *p < 0.05, **p < 0.01, ***p < 0.001. Note that GFP signal intensities of PV/GFP-double positive cells were significantly higher than that of SST/GFP-double positive cells and PV/SST-negative/GFP-positive cells (all layers), while GFP signal intensities of SST/GFP-double positive cells were similar to PV/SST-negative/GFP-positive cells in neocortex. In hippocampus, GFP signal intensities of SST/GFP-double positive cells were significantly lower than that of SST-negative/GFP-positive cells at CA2/3 and DG. CA1, CA2/3, and DG: cornu ammonis 1, 2 plus 3, dentate gyrus. a.u., arbitrary unit; +, positive; −, negative.
-
Figure 9—source data 1
Numerical source data for Figure 9.
- https://cdn.elifesciences.org/articles/87495/elife-87495-fig9-data1-v1.xlsx
Figure 10
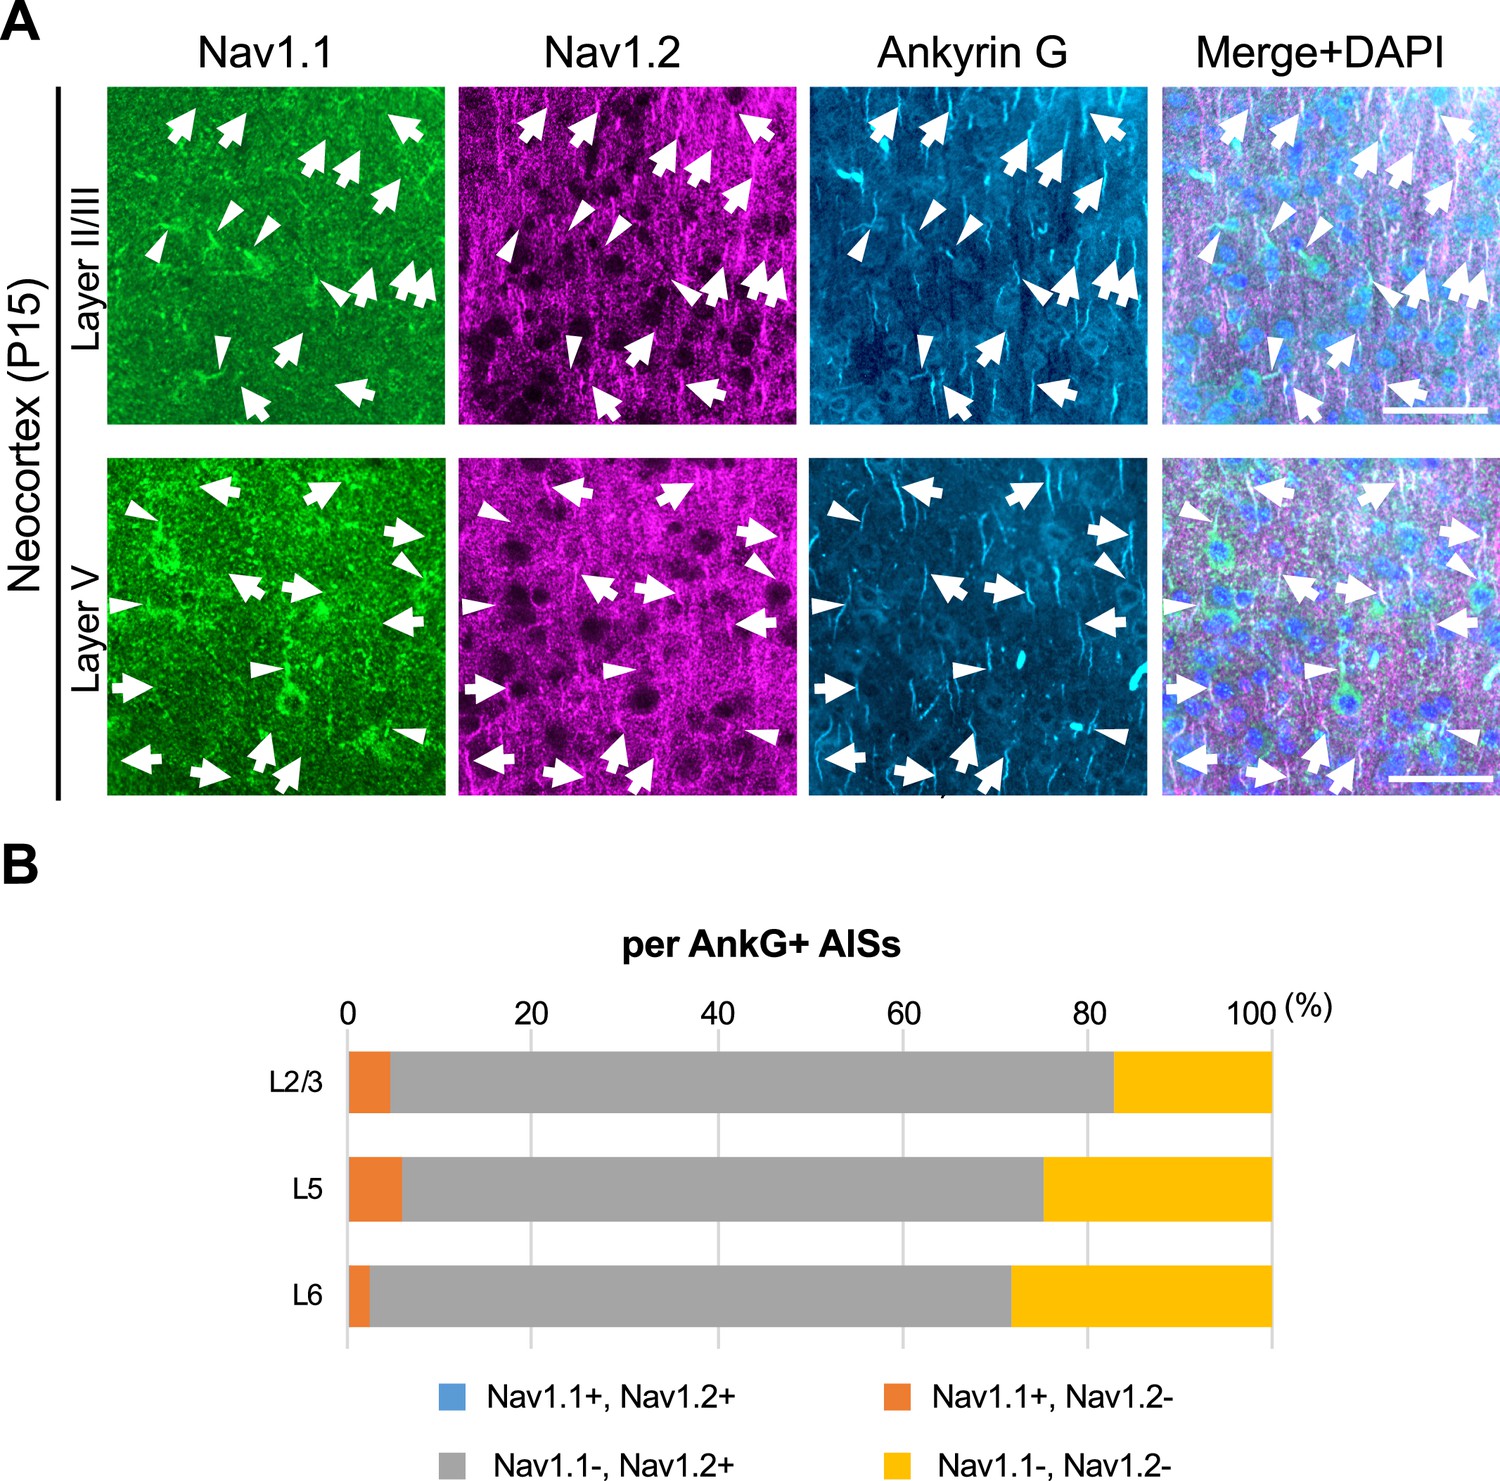
Nav1.1 and Nav1.2 are mutually exclusive at axon initial segments (AISs) in mouse brain.
(A) Triple immunofluorescent staining on parasagittal sections from Scn1a-GFP mouse at P15 by rabbit anti-Nav1.1 (green), goat anti-Nav1.2 (magenta), and mouse anti-ankyrinG (cyan) antibodies. Merged images are shown in the right panels. Arrows indicate Nav1.2-positive AISs. Arrowheads indicate Nav1.1-positive AISs. Note that there are no Nav1.1/Nav1.2-double positive AISs. Images are oriented from pial surface (top) to callosal (bottom). Scale bars: 50 μm. (B) Bar graphs indicating the percentage of Nav1.1- and Nav1.2-positive/negative AISs per AISs detected by ankyrinG staining in L2/3, L5, and L6 of Scn1a-GFP mice. Note that Nav1.1/Nav1.2-double positive AISs were less than 0.5% of all AISs in these layers (see Supplementary file 1q). L2/3, L5, L6: neocortical layer II/III, V, VI. AnkG, ankyrinG; +, positive; −, negative.
-
Figure 10—source data 1
Numerical source data for Figure 10B.
- https://cdn.elifesciences.org/articles/87495/elife-87495-fig10-data1-v1.xlsx
Figure 11
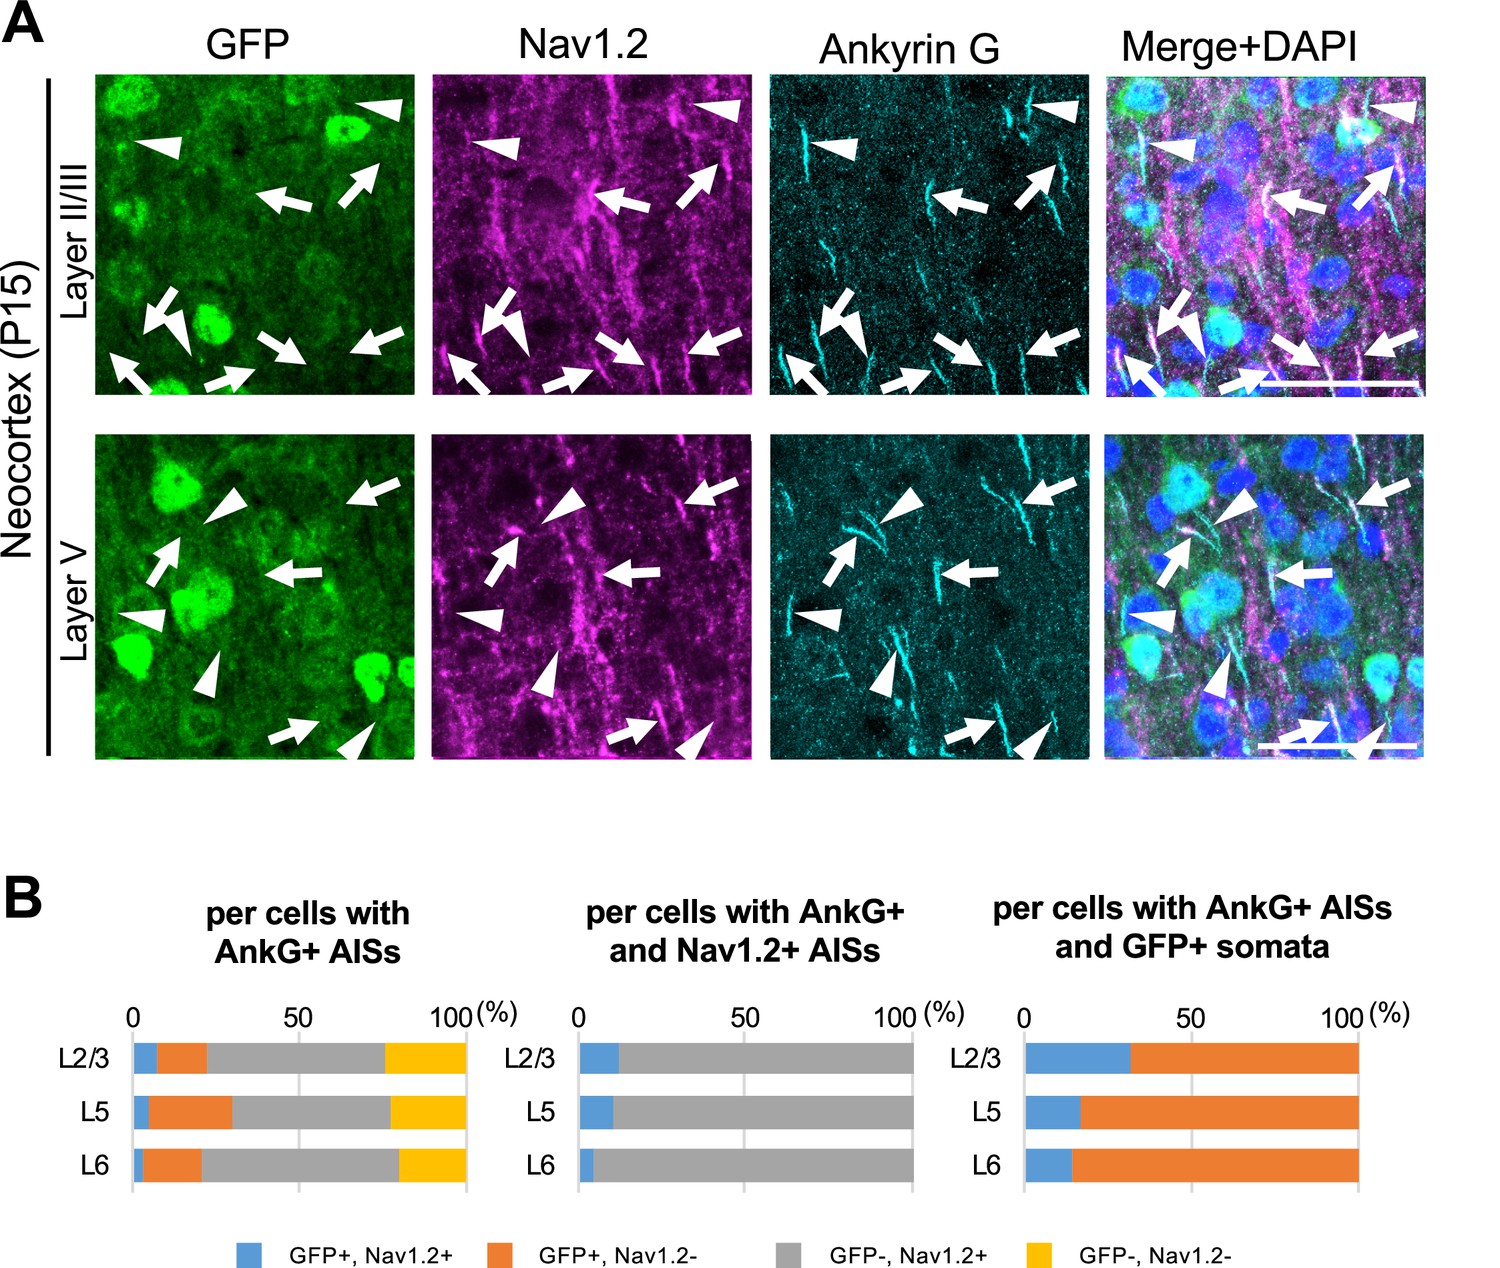
Cells with Nav1.2-positive axon initial segments (AISs) are mostly green fluorescent protein (GFP)-negative in Scn1a-GFP mouse neocortex.
(A) Triple immunofluorescent staining of parasagittal sections from P15 Scn1a-GFP mouse brain (line #233) by mouse anti-GFP (green), goat anti-Nav1.2 (magenta), and rabbit anti-ankyrinG (cyan) antibodies. Merged images of the signals are shown in the right panels. Arrows indicate Nav1.2-positive AISs of cells with GFP-negative somata. Arrowheads indicate Nav1.2-negative AISs of cells with GFP-positive somata. All images are oriented from pial surface (top) to callosal (bottom). Scale bars: 50 μm. (B) Bar graphs indicating the percentage of cells with GFP- and Nav1.2-positive/negative somata and AISs per cells with ankyrinG-positive AISs (left panel) (see also Supplementary file 1r), the percentage of cells with GFP-positive/negative somata per cells with ankyrinG/Nav1.2-double positive AISs (middle panel) (see also Supplementary file 1s), and the percentage of cells with Nav1.2-positive/negative AISs per cells with ankyrinG-positive AISs and GFP-positive somata (right panel) (see also Supplementary file 1t) in L2/3, L5, and L6. Note that 88% (L2/3), 90% (L5), and 95% (L6) of cells with Nav1.2-positive AISs have GFP-negative somata (middle panel), and 68% (L2/3), 83% (L5), and 86% (L6) of cells with GFP-positive somata have Nav1.2-negative AISs (right panel). L2/3, L5, L6: neocortical layer II/III, V, VI. AnkG, ankyrinG; +, positive; −, negative.
-
Figure 11—source data 1
Numerical source data for Figure 11B.
- https://cdn.elifesciences.org/articles/87495/elife-87495-fig11-data1-v1.xlsx
Figure 12 with 3 supplements
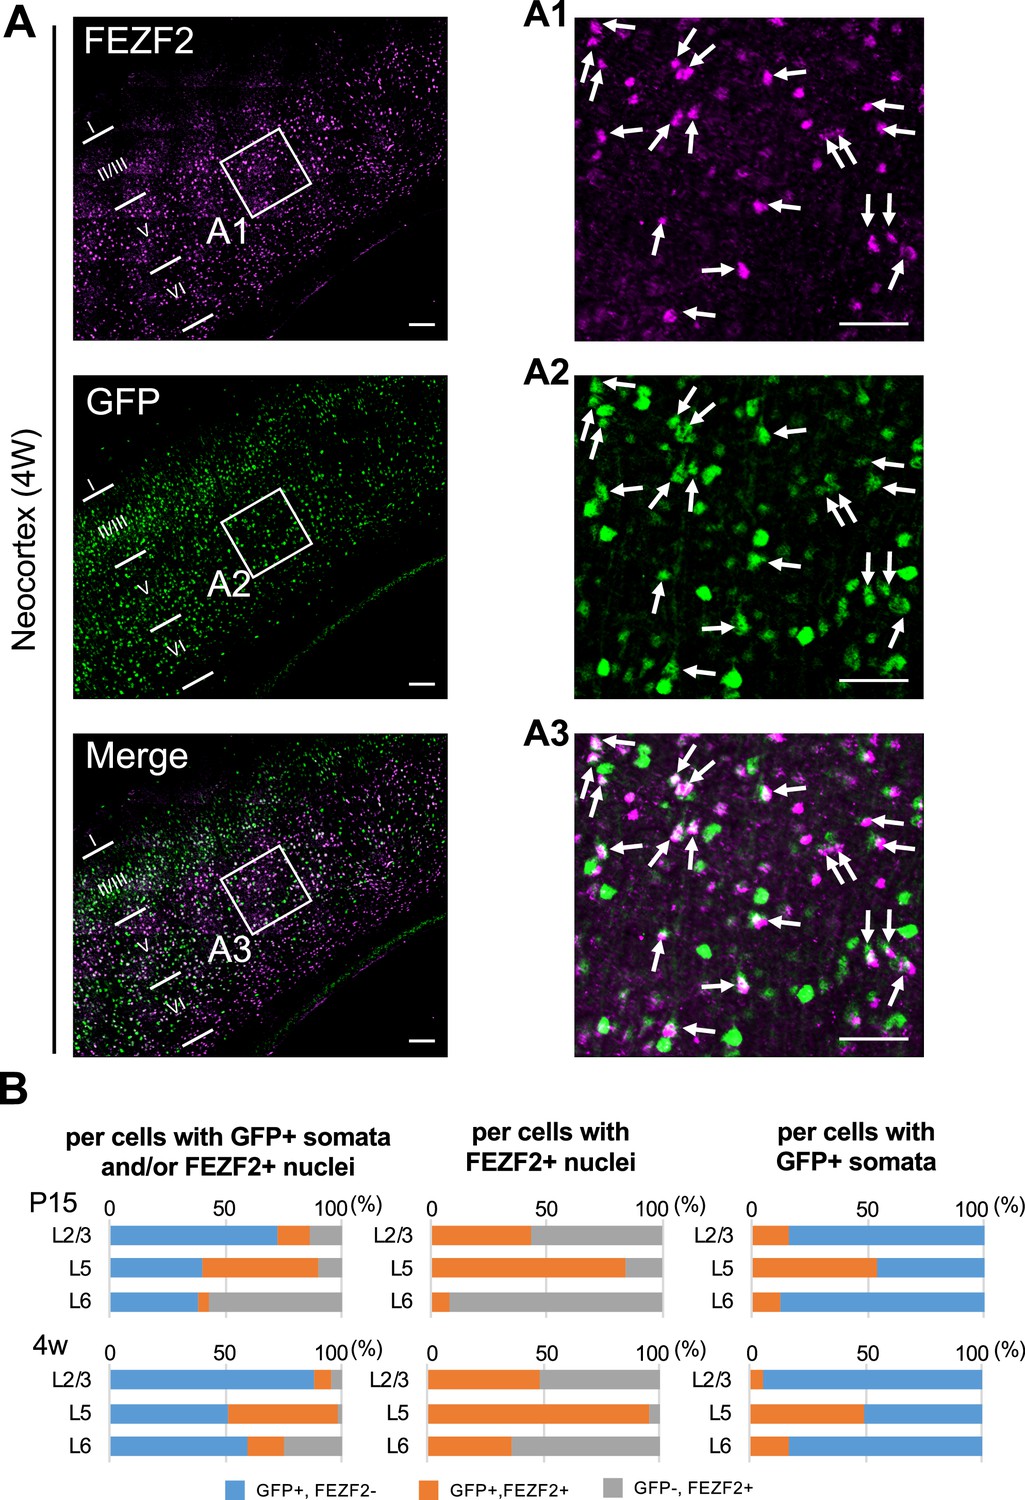
Cells positive for FEZF2 are mostly green fluorescent protein (GFP)-positive in L5 of Scn1a-GFP mouse neocortex.
(A) Double immunostaining of FEZF2 and GFP in neocortex of 4W Scn1a-GFP mouse (line #233) by rabbit anti-FEZF2 (magenta) and mouse anti-GFP (green) antibodies. Arrows indicate FEZF2/GFP-double positive cells. Magnified images outlined in (A) are shown in (A1–A3). Note that FEZF2 signals mostly overlap with GFP signals in L5. Many of the remained GFP-positive/FEZF2-negative cells have intense GFP signals and are assumed to be inhibitory neurons (see Figure 8). Scale bars: 100 μm (A), 50 μm (A1–A3). (B) Bar graphs indicating the percentage of cells with FEZF2- and GFP-positive/negative nuclei and somata per cells with GFP-positive somata and/or FEZF2-positive nuclei (left panels) (see also Supplementary file 1u), the percentage of cells with GFP-positive/negative somata per cells with FEZF2-positive nuclei (middle panels) (see also Supplementary file 1v), and the percentage of cells with FEZF2-positive/negative nuclei per cells with GFP-positive somata (right panels) (see also Supplementary file 1w) in L2/3, L5, and L6. Cells at primary motor cortex of Scn1a-GFP mouse at P15 and 4W were counted. Note that 83% (P15) and 96% (4W) of cells with FEZF2-positive cells are GFP-positive in L5 (middle panels), but a half of cells with GFP-positive cells are FEZF2-positive in L5 (right panel). L2/3, L5, L6: neocortical layer II/III, V, VI. +, positive; −, negative.
-
Figure 12—source data 1
Numerical source data for Figure 12B.
- https://cdn.elifesciences.org/articles/87495/elife-87495-fig12-data1-v1.xlsx
Figure 12—figure supplement 1
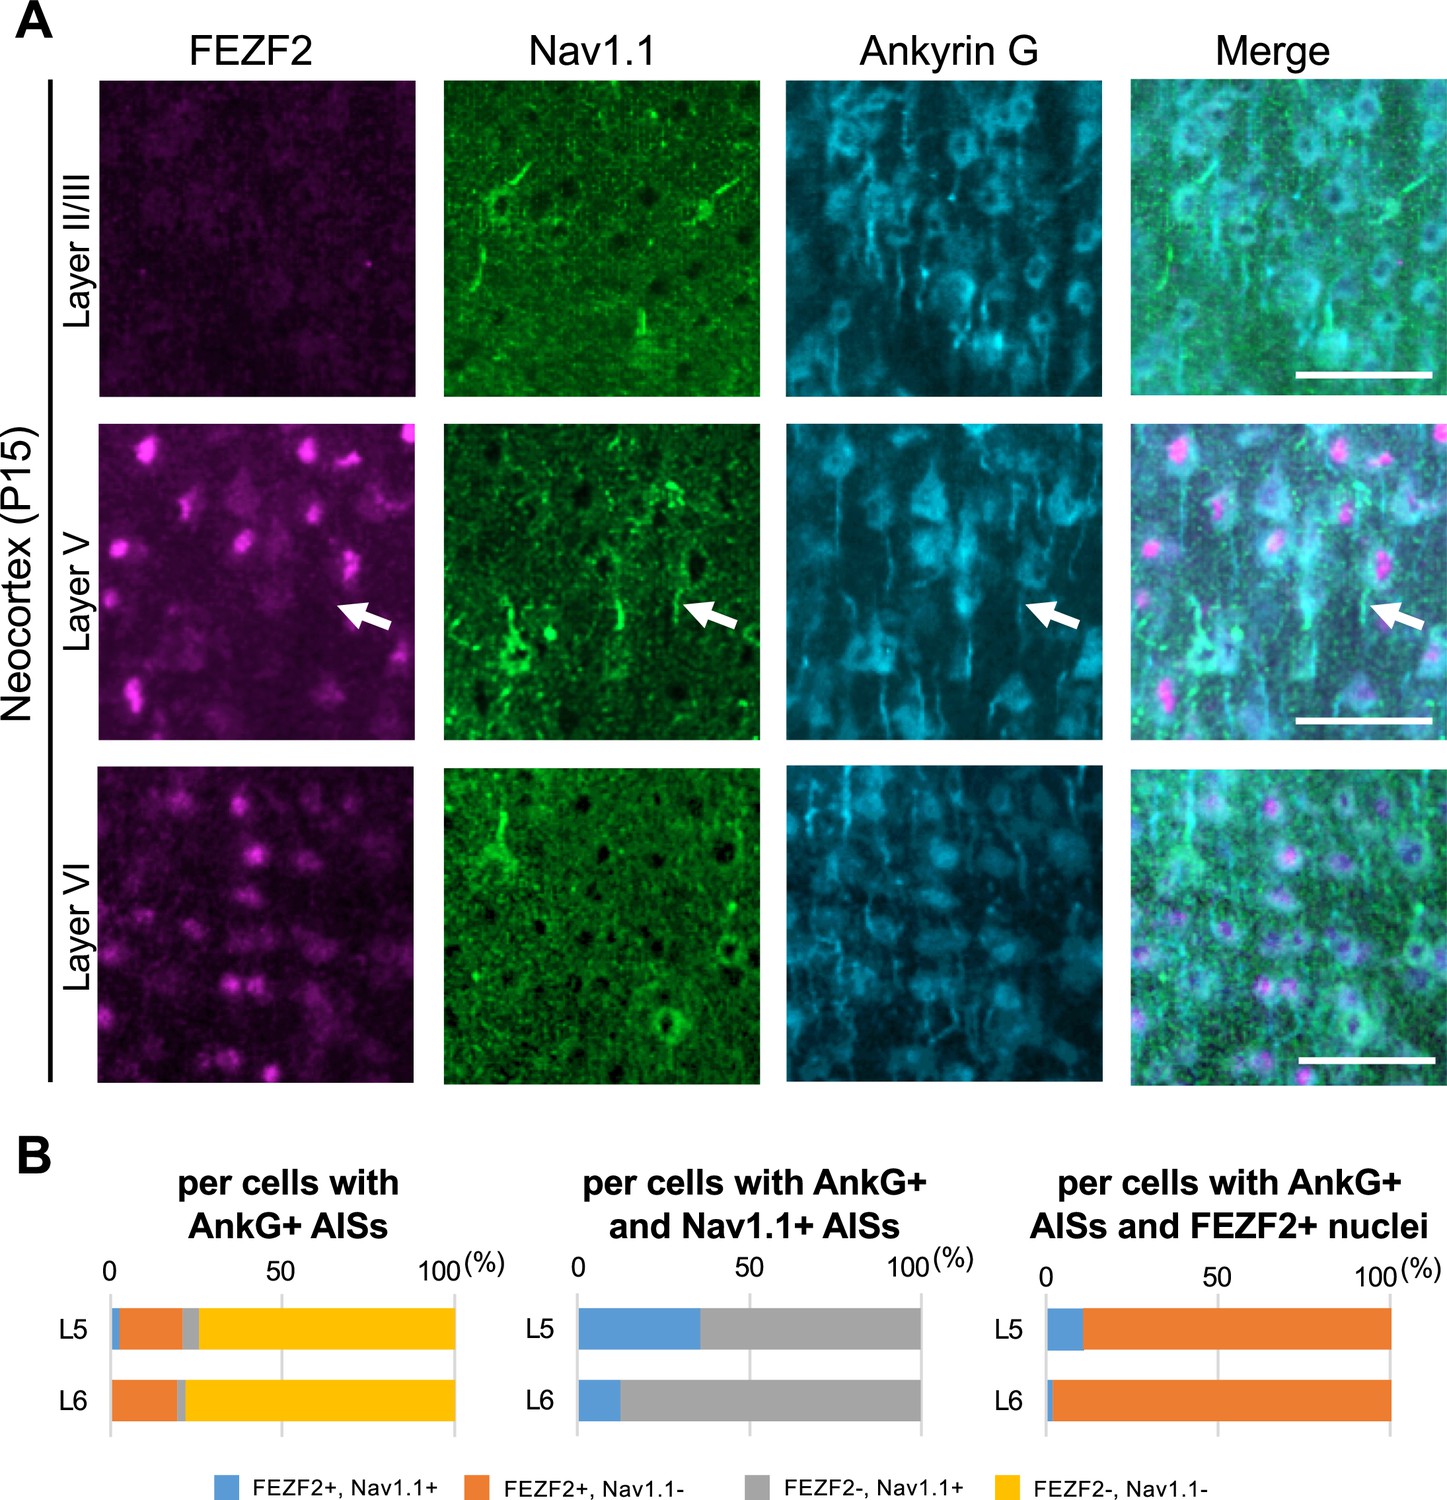
Some FEZF2-positive cells in L5 of the Scn1a-GFP mouse neocortex have Nav1.1-positive axon initial segment (AIS).
(A) Triple immunostaining of parasagittal section from P15 Scn1a-GFP mouse brain (line #233) by rabbit anti-FEZF2 (magenta), goat anti-Nav1.1 (green), and mouse anti-ankyrinG (cyan) antibodies. Merged images are shown in the right panels. An arrow indicates Nav1.1-positive AIS of FEZF2-positive cell. All images are oriented from pial surface (top) to callosal (bottom). Scale bars: 50 μm. (B) Bar graphs indicating the percentage of cells with FEZF2- and Nav1.1-positive/negative nuclei or AISs per cells with ankyrinG-positive AISs (left panel) (see also Supplementary file 1y), the percentage of cells with FEZF2-positive/negative nuclei per cells with ankyrinG- and Nav1.1-positive AISs (middle panel) (see also Supplementary file 1z), and the percentage of cells with Nav1.1-positive/negative AISs per cells with ankyrinG-positive AISs and FEZF2-positive nuclei (right panel) (see also Supplementary file 1aa). Cells in primary motor cortex of Scn1a-GFP mouse at P15 were counted. L5, L6: neocortical layer V, VI. AnkG, ankyrinG; +, positive; −, negative.
-
Figure 12—figure supplement 1—source data 1
Numerical source data for Figure 12—figure supplement 1B.
- https://cdn.elifesciences.org/articles/87495/elife-87495-fig12-figsupp1-data1-v1.xlsx
Figure 12—figure supplement 2
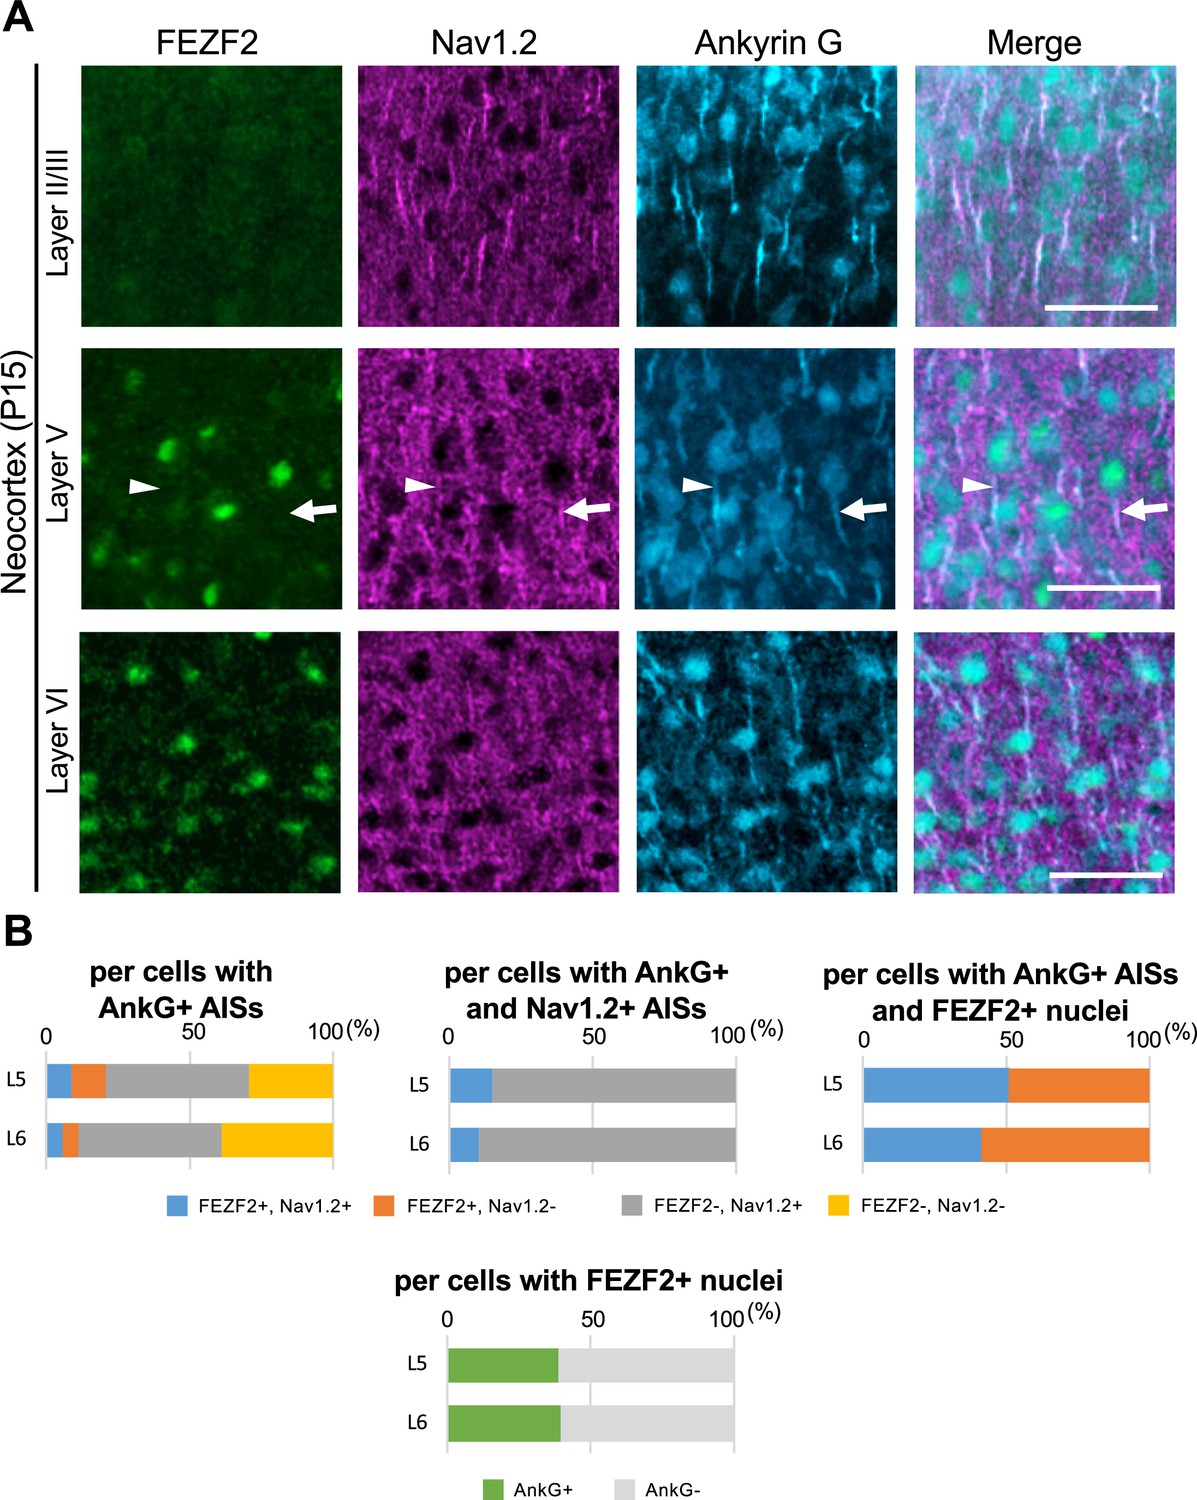
A half of FEZF2-positive cells at L5 have Nav1.2-positive axon initial segment (AIS) of Scn1a-GFP mouse neocortex.
(A) Triple immunostaining of parasagittal section from P15 Scn1a-GFP mouse brain (line #233) by rabbit anti-FEZF2 (green), goat anti-Nav1.2 (magenta), and mouse anti-ankyrinG (cyan) antibodies. Merged images are shown in the right panels. An arrow indicates FEZF2/Nav1.2-double positive cell. An arrowhead indicates Nav1.2-negative AIS of FEZF2-positive cell. All images are oriented from pial surface (top) to callosal (bottom). Scale bars: 50 μm. (B) Bar graphs indicating the percentage of cells with FEZF2- and Nav1.2-positive/negative nuclei or AISs per cells with ankyrinG-positive AISs (left-upper panel) (see also Supplementary file 1ab), the percentage of cells with FEZF2-positive/negative nuclei per cells with ankyrinG- and Nav1.2-positive AISs (middle-upper panel) (see also Supplementary file 1ac), and the percentage of cells with Nav1.2-positive/negative AISs per cells with ankyrinG-positive AISs and FEZF2-positive nuclei (right-upper panel) (see also Supplementary file 1ad). Cells with ankyrinG-positive/negative AISs per cells with FEZF2-positive nuclei (lower panel) (see also Supplementary file 1ae). Cells in primary motor cortex of Scn1a-GFP mouse at P15 were counted. L5, L6: neocortical layer V, VI. +, positive; −, negative.
-
Figure 12—figure supplement 2—source data 1
Numerical source data for Figure 12—figure supplement 2B.
- https://cdn.elifesciences.org/articles/87495/elife-87495-fig12-figsupp2-data1-v1.xlsx
Figure 12—figure supplement 3
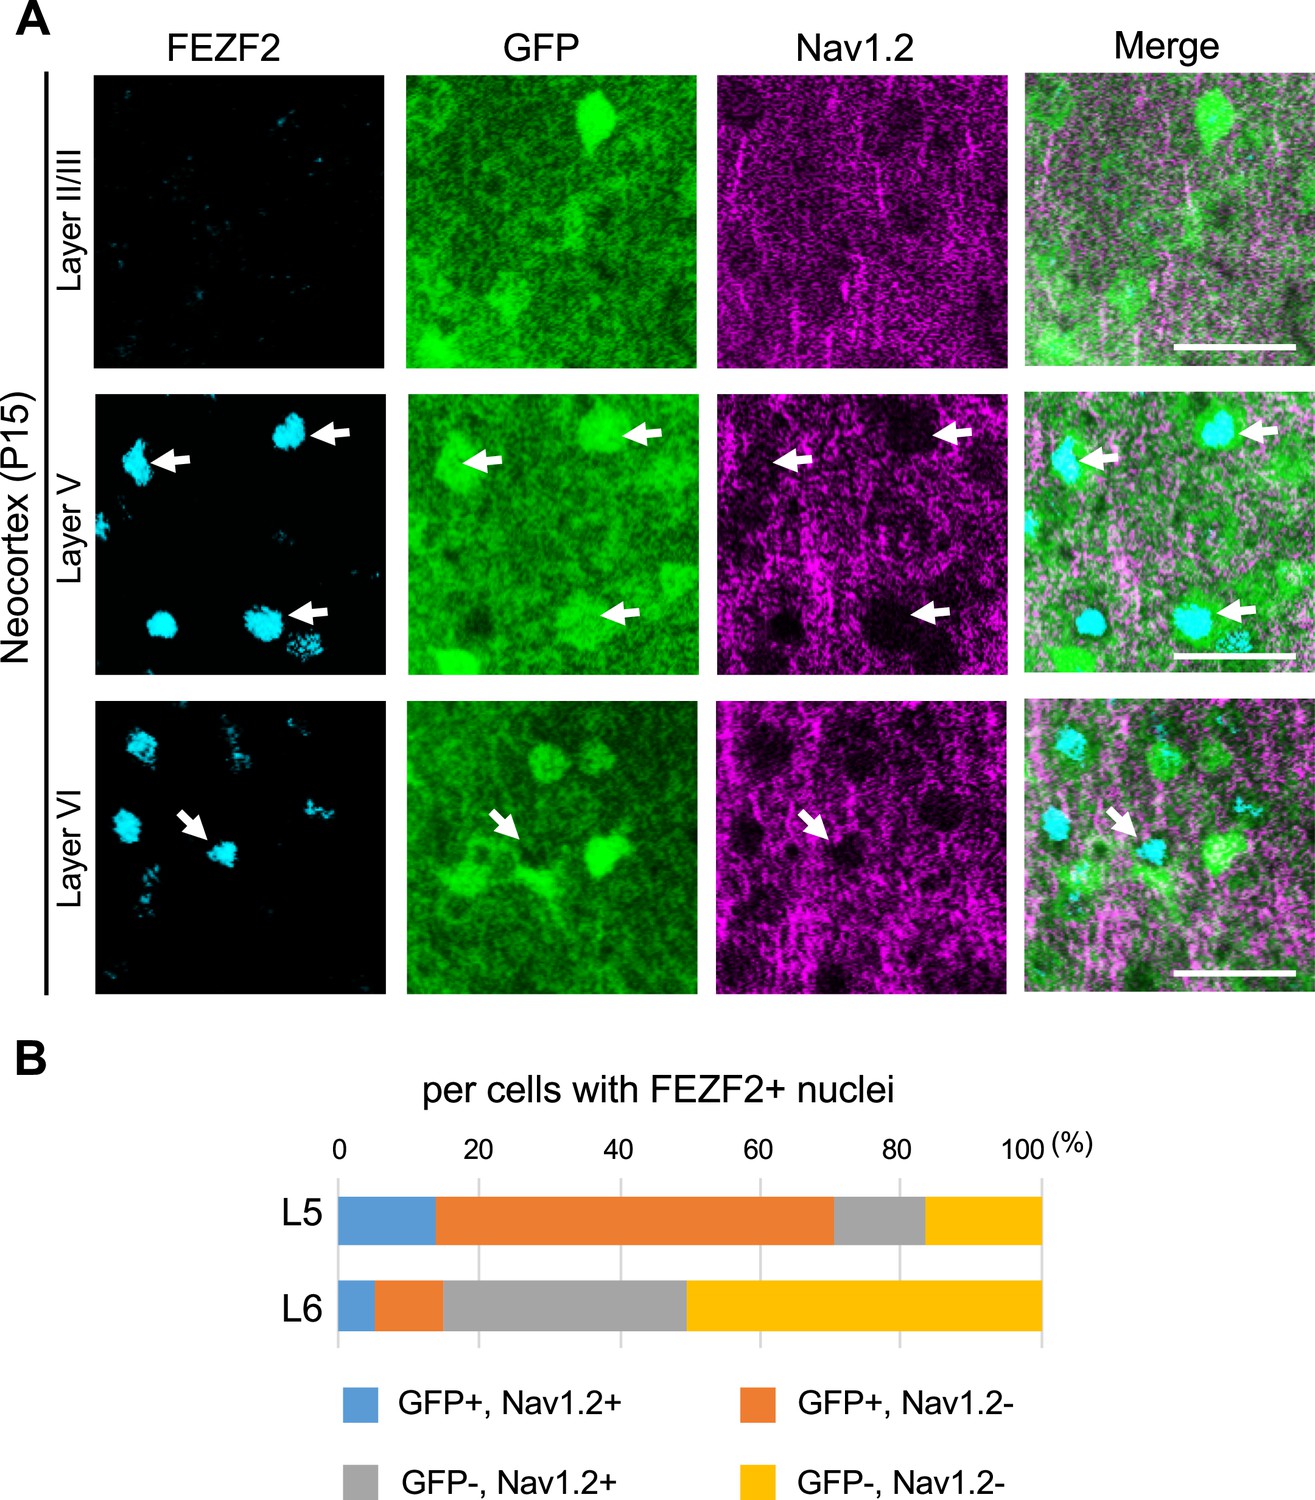
Most of the FEZF2/green fluorescent protein (GFP)-double positive cells are Nav1.2-negative in L5 of Scn1a-GFP mouse neocortex.
(A) Triple immunostaining of parasagittal sections from P15 Scn1a-GFP mouse brain (line #233) by rabbit anti-FEZF2 (cyan), mouse anti-GFP (green), and goat anti-Nav1.2 (magenta) antibodies. Merged images are shown in the right panels. Arrows indicate FEZF2/GFP-double positive cells (cells with GFP-positive somata and FEZF2-positive nuclei). Note that Nav1.2-positive axon initial segments (AISs) do not belong to GFP/FEZF2-double positive cells. All images are oriented from pial surface (top) to callosal (bottom). Scale bars: 25 µm. (B) Bar graphs indicating the percentage of cells with GFP- and Nav1.2-positive/negative somata and AISs per cells with FEZF2-positive nuclei in L5 and L6 (see also Supplementary file 1af). For this graph, to obtain correct cell population for Nav1.2-negative cells, virtual cell numbers were estimated using percentage of ankyrinG/FEZF2-double positive cells in Figure 12—figure supplement 2B, lower panel (see also Supplementary file 1ab). Cells in primary motor cortex of Scn1a-GFP mouse at P15 were counted. L5, L6: neocortical layer V, VI. +, positive; −, negative.
-
Figure 12—figure supplement 3—source data 1
Numerical source data for Figure 12—figure supplement 3B.
- https://cdn.elifesciences.org/articles/87495/elife-87495-fig12-figsupp3-data1-v1.xlsx
Figure 13

FEZF2-positive cells have lower green fluorescent protein (GFP) signal intensities in Scn1a-GFP mouse neocortex.
Scatter plots of intensities and area sizes of GFP immunosignals in GFP-positive cells with FEZF2-positive/negative nuclei. Cells at primary motor cortex in parasagittal sections from 4W Scn1a-GFP mouse (line #233) were analyzed. FEZF2-positive (orange squares) and negative (black circles) cells in neocortical L2/3, L5, and L6 are plotted (see also Supplementary file 1x). Note that GFP signal intensities of FEZF2/GFP-double positive cells were significantly lower than that of FEZF2-negative/GFP-positive cells (L5, L6), and signal area size of FEZF2/GFP-double positive cells was significantly larger than that of FEZF2-negative/GFP-positive cells (L2/3, L5). Statistical significance was assessed using t-test. a.u., arbitrary unit; +, positive; −, negative.
-
Figure 13—source data 1
Numerical source data for Figure 13.
- https://cdn.elifesciences.org/articles/87495/elife-87495-fig13-data1-v1.xlsx
Figure 14 with 4 supplements

Green fluorescent protein (GFP)-positive cells were mostly negative for TBR1 in L5 of Scn1a-GFP mouse neocortex.
(A) Double immunostaining of TBR1 and GFP in neocortex of 4W Scn1a-GFP mouse (line #233) detected by mouse rabbit anti-TBR1 (magenta) and anti-GFP (green) antibodies. Arrows indicate TBR1-negative/GFP-positive cells. Magnified images outlined in (A) are shown in (A1–A6). Note that at L5 GFP-positive cells were mostly TBR1-negative but at L2/3 more than half of GFP-positive cells were TBR1-positive. Scale bars: 100 μm (A), 50 μm (A1–A6). (B) Bar graphs indicating the percentage of cells with TBR1- and GFP-positive/negative nuclei and somata per GFP-positive cells and/or TBR1-positive nuclei (left panels) (see also Supplementary file 1ag), the percentage of cells with GFP-positive/negative somata per cells with TBR1-positive nuclei (middle panels) (see also Supplementary file 1ah), and the percentage of cells with TBR1-positive/negative nuclei per cells with GFP-positive somata (right panels) (see also Supplementary file 1ai) in L2/3, L5, and L6. Cells in primary motor cortex of Scn1a-GFP mouse at P15 and 4W were counted. Note that 86% (P15) and 95% (4W) of cells with TBR1-positive cells are GFP-negative in L5 (middle panels), and 90% (P15) and 96% (4W) of cells with GFP-positive cells are TBR1-negative in L5 (right panel). L2/3, L5, L6: neocortical layer II/III, V, VI. +, positive; −, negative.
-
Figure 14—source data 1
Numerical source data for Figure 14B.
- https://cdn.elifesciences.org/articles/87495/elife-87495-fig14-data1-v1.xlsx
Figure 14—figure supplement 1
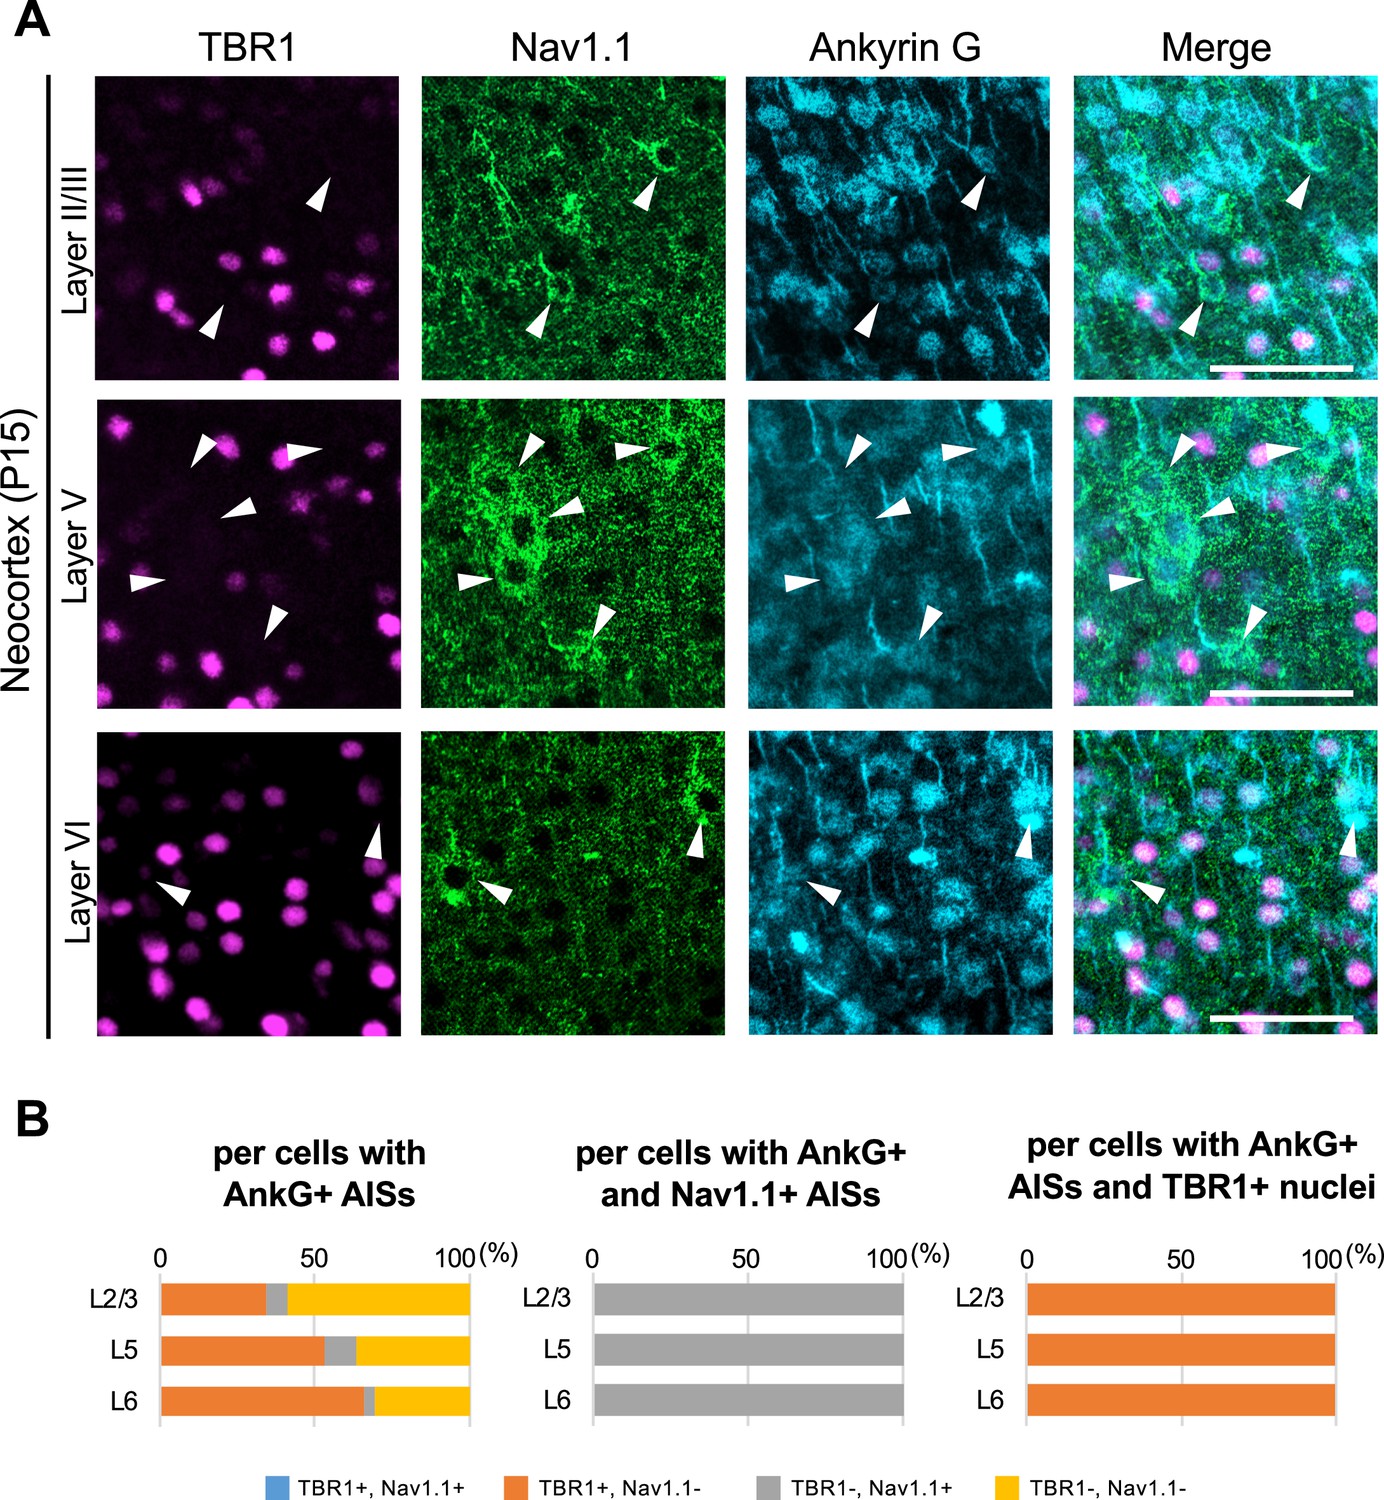
Axon initial segments (AISs) of TBR1-positive cells are Nav1.1-negative in Scn1a-GFP mouse neocortex.
(A) Triple immunostaining of parasagittal section from P15 Scn1a-GFP mouse brain (line #233) by rabbit anti-TBR1 (magenta), goat anti-Nav1.1 (green), and mouse anti-ankyrinG (cyan) antibodies. The regions of motor cortex were shown. Merged images are shown in the right panels. Arrowheads indicate Nav1.1-positive cells. All images are oriented from pial surface (top) to callosal (bottom). Scale bars: 50 μm. (B) Bar graphs indicating the percentage of cells with TBR1- and Nav1.1-positive/negative nuclei or AISs per cells with ankyrinG-positive AISs (left panel) (see also Supplementary file 1ak), the percentage of cells with TBR1-positive/negative nuclei per cells with ankyrinG- and Nav1.1-positive AISs (middle panel) (see also Supplementary file 1al), and the percentage of cells with Nav1.1-positive/negative AISs per cells with ankyrinG-positive AISs and TBR1-positive nuclei (right panel) (see also Supplementary file 1am). Cells in primary motor cortex of Scn1a-GFP mouse at P15 were counted. L2/3, L5, L6: neocortical layer II/III, V, VI. AnkG, ankyrinG; +, positive; −, negative.
-
Figure 14—figure supplement 1—source data 1
Numerical source data for Figure 14—figure supplement 1B.
- https://cdn.elifesciences.org/articles/87495/elife-87495-fig14-figsupp1-data1-v1.xlsx
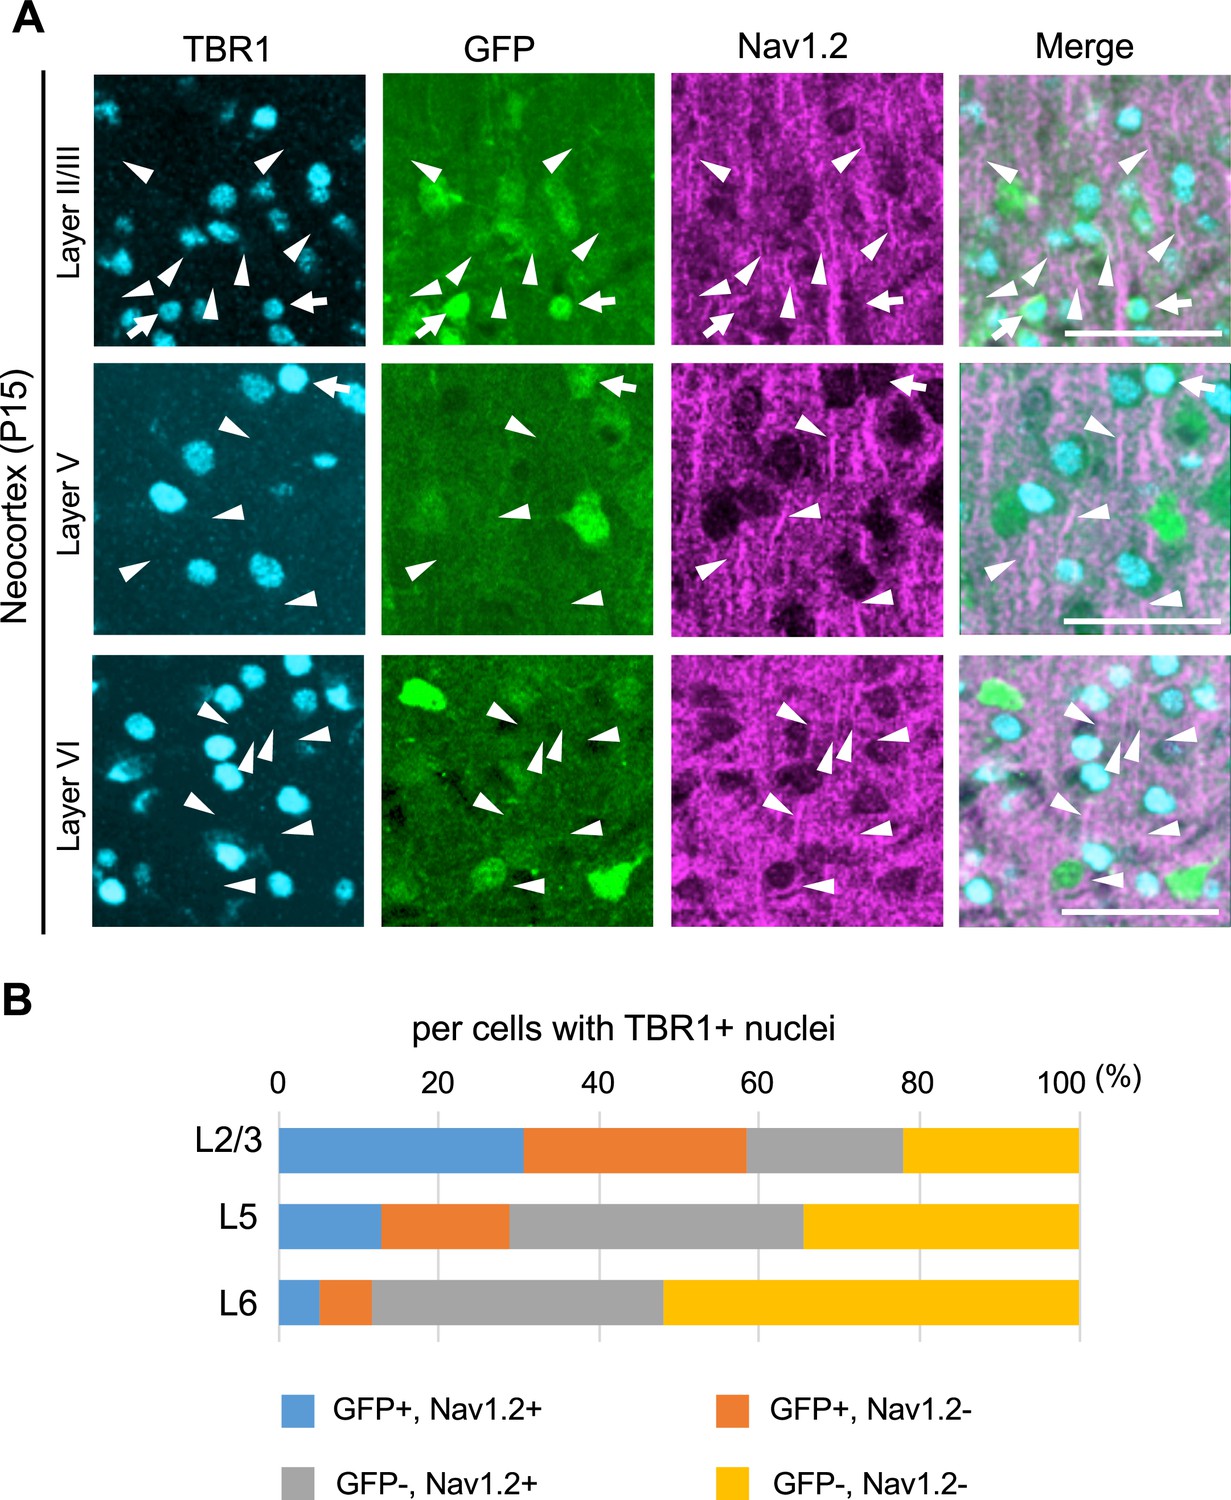
Figure 14—figure supplement 2
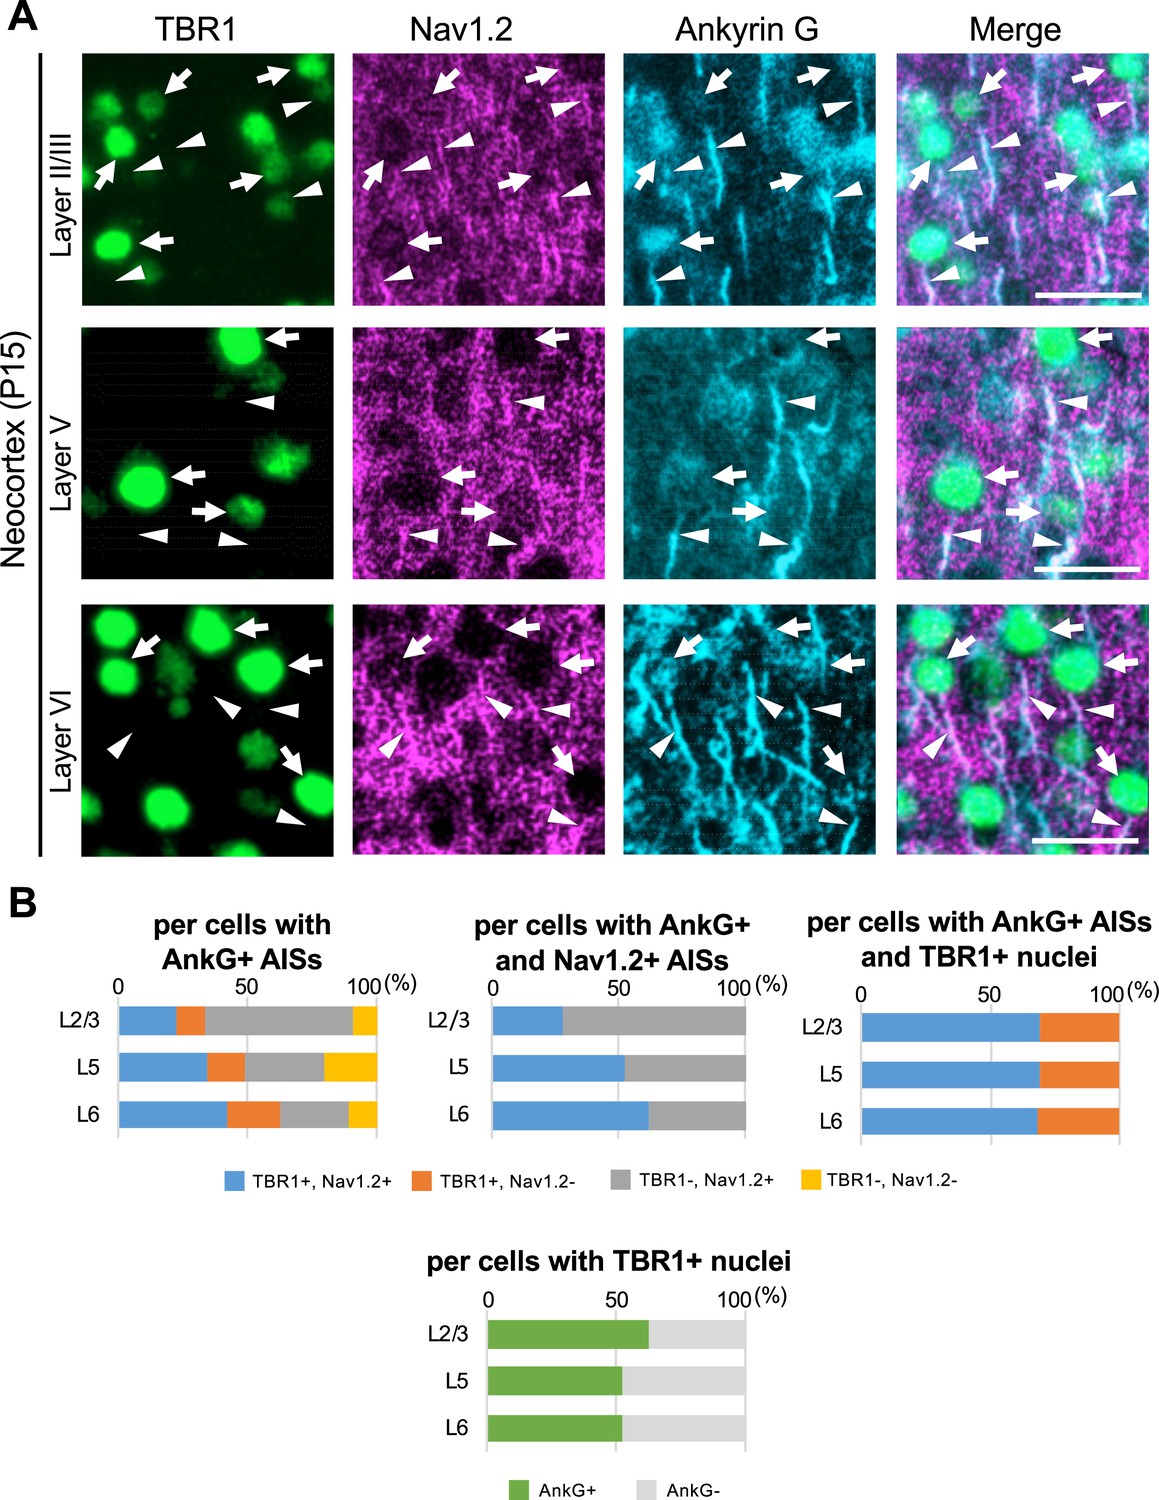
70% of TBR1-positive cells have Nav1.2-positive axon initial segment (AIS) in Scn1a-GFP mouse neocortex.
(A) Triple immunostaining of parasagittal section from P15 Scn1a-GFP mouse brain (line #233) by rabbit anti-TBR1 (green), goat anti-Nav1.2 (magenta), and mouse anti-ankyrinG (cyan) antibodies. Merged images are shown in the right panels. Arrows indicate TBR1/ankyrinG-double positive cells. Arrowheads indicate Nav1.2-positive AIS of TBR1-positive cells. All images are oriented from pial surface (top) to callosal (bottom). Scale bars: 25 μm. (B) Bar graphs indicating the percentage of cells with TBR1- and Nav1.2-positive/negative nuclei or AISs per cells with ankyrinG-positive AISs (left-upper panel) (see also Supplementary file 1an), the percentage of cells with TBR1-positive/negative nuclei per cells with ankyrinG- and Nav1.2-positive AISs (middle-upper panel) (see also Supplementary file 1ao), and the percentage of cells with Nav1.2-positive/negative AISs per cells with ankyrinG-positive AISs and TBR1-positive nuclei (right-upper panel) (see also Supplementary file 1ap). Cells with ankyrinG-positive/negative AISs per cells with TBR1-positive nuclei (lower panel) (see also Supplementary file 1aq). Cells in primary motor cortex of Scn1a-GFP mouse at P15 were counted. L2/3, L5, L6: neocortical layer II/III, V, VI. AnkG, ankyrinG; +, positive; −, negative.
-
Figure 14—figure supplement 2—source data 1
Numerical source data for Figure 14—figure supplement 2B.
- https://cdn.elifesciences.org/articles/87495/elife-87495-fig14-figsupp2-data1-v1.xlsx
Figure 14—figure supplement 3
TBR1/Nav1.2-double positive cells are green fluorescent protein (GFP)-negative in L5 and L6 in Scn1a-GFP mouse neocortex.
(A) Triple immunostaining of parasagittal section from P15 Scn1a-GFP mouse brain (line #233) by rabbit anti-TBR1 (cyan), mouse anti-GFP (green), and goat anti-Nav1.2 (magenta) antibodies. Merged images are shown in the right panels. Arrows indicate TBR1/GFP-double positive cells. Arrowheads indicate Nav1.2-positive axon initial segment (AIS) of TBR1-positive cells. All images are oriented from pial surface (top) to callosal (bottom). Scale bar: 50 µm. (B) Bar graphs indicating the percentage of cells with GFP- and Nav1.2-positive/negative somata and AISs per cells with TBR1-positive nuclei in L2/3, L5, and L6 (see also Supplementary file 1ar). For this graph, to obtain correct cell population for Nav1.2-negative cells, virtual cell numbers were estimated using percentage of ankyrinG/TBR1-double positive cells in Figure 14—figure supplement 2B, lower panel (see also Supplementary file 1an). Cells in primary motor cortex of Scn1a-GFP mouse at P15 were counted. L2/3, L5, L6: neocortical layer II/III, V, VI. +, positive; −, negative.
-
Figure 14—figure supplement 3—source data 1
Numerical source data for Figure 14—figure supplement 3B.
- https://cdn.elifesciences.org/articles/87495/elife-87495-fig14-figsupp3-data1-v1.xlsx
Figure 14—figure supplement 4
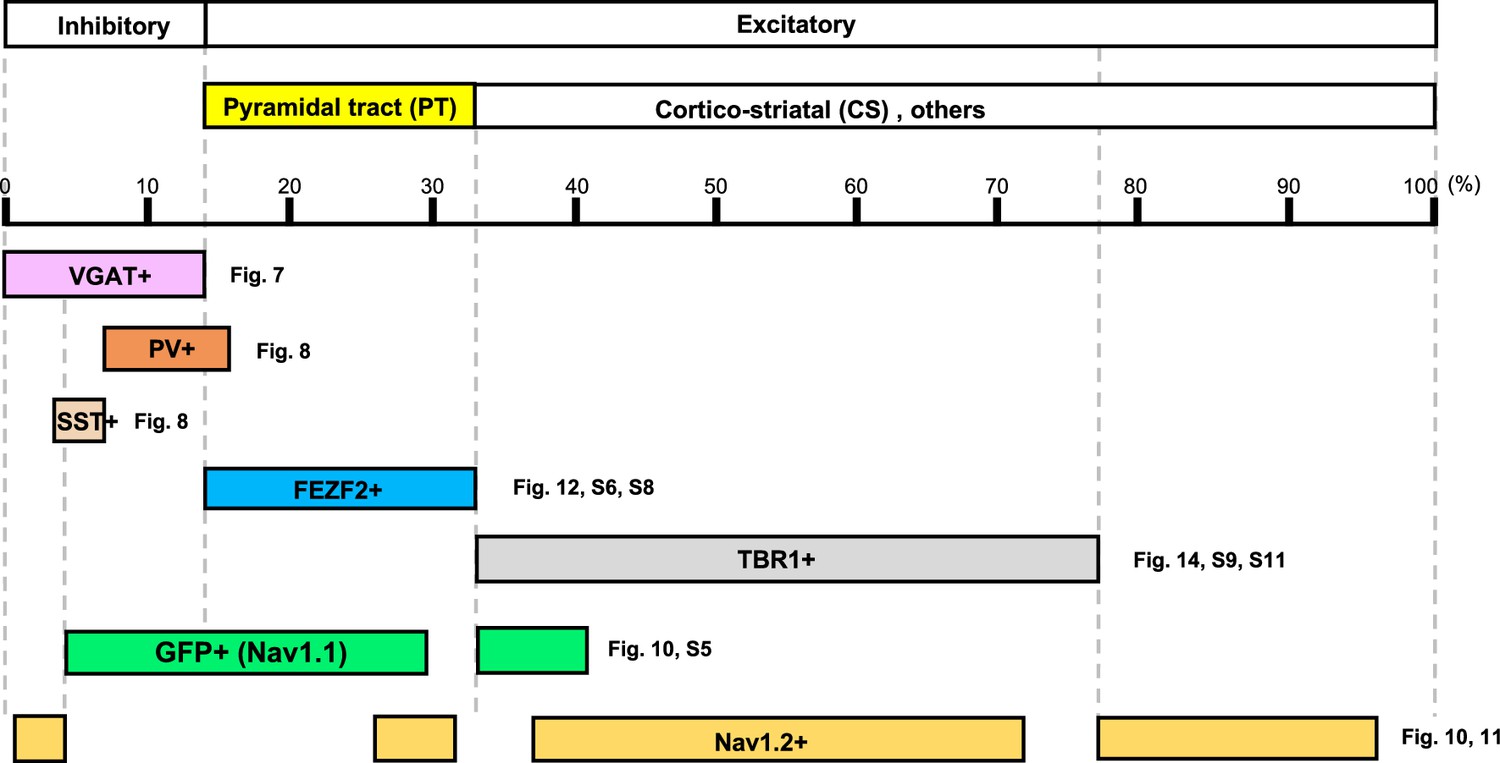
Distributions of Nav1.1 (green fluorescent protein, GFP) and Nav1.2 in neocortical layer V revealed by the analysis of Scn1a-GFP mouse.
Figure 15
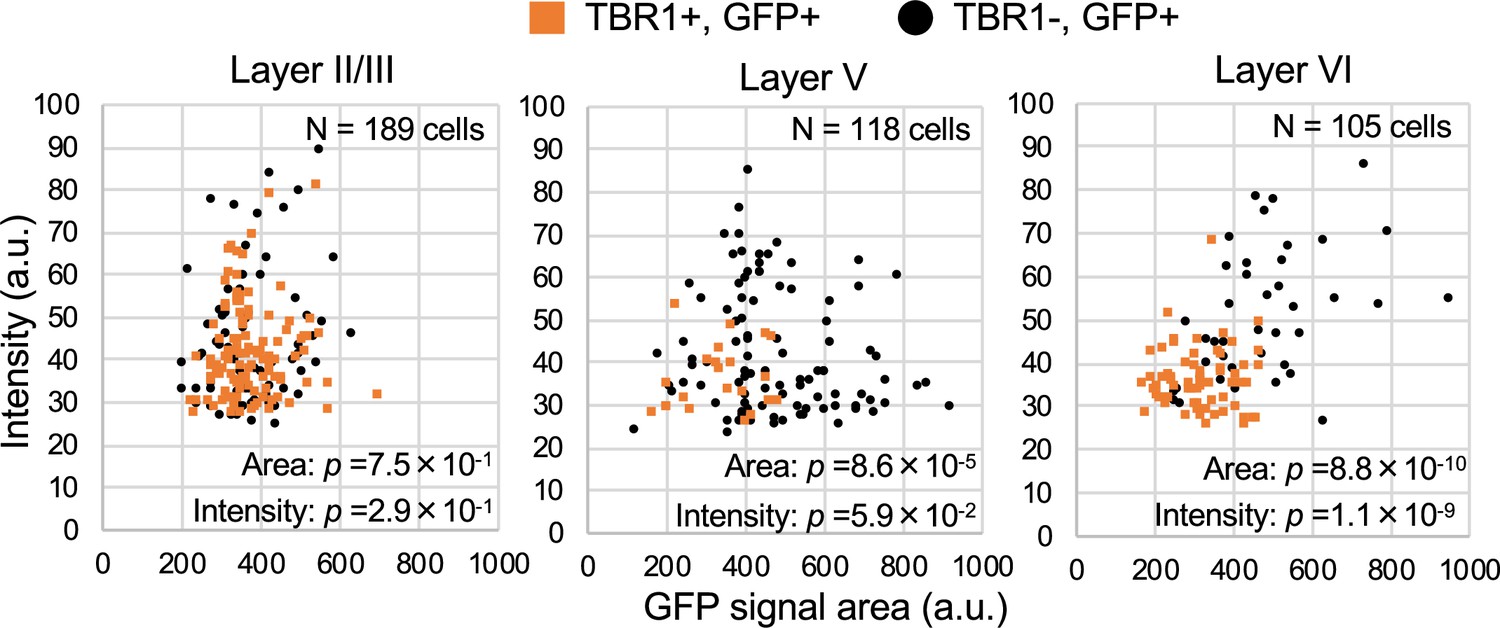
TBR1-positive cells have lower green fluorescent protein (GFP) signal intensities in Scn1a-GFP mouse neocortex.
Scatter plots of intensities and area sizes of GFP immunosignals in GFP-positive cells with TBR1-positive/negative nuclei. Cells at primary motor cortex in parasagittal sections from 4W Scn1a-GFP mouse (line #233) were analyzed. TBR1-positive (orange squares) and negative (black circles) cells in neocortical L2/3, L5, and L6 are plotted (see also Supplementary file 1aj). Note that GFP signal intensities of TBR1/GFP-double positive cells were significantly lower than that of TBR1-negative/GFP-positive cells (L6), and signal area size of TBR1/GFP-double positive cells was significantly smaller than that of TBR1-negative/GFP-positive cells (L5, L6). Statistical significance was assessed using t-test. a.u., arbitrary unit; +, positive; −, negative.
-
Figure 15—source data 1
Numerical source data for Figure 15.
- https://cdn.elifesciences.org/articles/87495/elife-87495-fig15-data1-v1.xlsx
Additional files
-
Supplementary file 1
Tables of cell counting data for Figures 3—5, Figures 7—15, and Figure 3—figure supplement 2, Figure 4—figure supplements 1 and 2, Figure 12—figure supplements 1–3, Figure 14—figure supplements 1–3.
- https://cdn.elifesciences.org/articles/87495/elife-87495-supp1-v1.xlsx
-
MDAR checklist
- https://cdn.elifesciences.org/articles/87495/elife-87495-mdarchecklist1-v1.docx
Download links
A two-part list of links to download the article, or parts of the article, in various formats.
Downloads (link to download the article as PDF)
Open citations (links to open the citations from this article in various online reference manager services)
Cite this article (links to download the citations from this article in formats compatible with various reference manager tools)
Scn1a-GFP transgenic mouse revealed Nav1.1 expression in neocortical pyramidal tract projection neurons
eLife 12:e87495.
https://doi.org/10.7554/eLife.87495


